arab states telecommunication indicators 2002arab states telecommunication indicators is based on a...
TRANSCRIPT
ARAB STATES TELECOMMUNICATION
INDICATORS
1992-2001
INTERNATIONAL TELECOMMUNICATION UNION

FOREWORD Arab States Telecommunication Indicators is based on a special questionnaire sent to Arab countries as well as on ITU in-house data files. The purpose of this document is to provide a comprehensive and comparable set of telecommunication indicators comprising the latest available data for the Arab speaking world. Developments in the public telecommunication sector for the last decade are shown in tables. More detailed information about coverage and country specific notes from 1960, 1965, 1970, 1975-2002 is contained in a CD-ROM version available separately. Any inferences made herein do not necessarily reflect the views of the ITU or its Members. For comments and further information on the statistics please contact: Email: [email protected] Fax: +41 22 730 6449 Reproduction is authorized except for commercial purposes, provided the source is acknowledged. TELECOMMUNICATION INDICATORS Introduction List of countries - Country pages Organizations Technical notes Data Sources
Introduction In this document, data are provided for 22 Arab States. Unless otherwise noted, the data refer to totals for all telecommunication operators providing service in the country. Substantial effort has been made to collect and harmonize the data. Because of differences in national statistical practices and definitions, strict comparability is not always possible. Limitations with particular indicators and additional explanations and definitions are provided in the Technical Notes. Data refer to the end of the calendar year indicated unless there is a note to the contrary. Billions, millions and thousands are separated by a space and decimals by a period. The following signs and symbols are used in the document: italic Estimate k Thousands M Millions US$ United States dollars % Percent _ Zero or a quantity less than half the unit shown or not applicable ... Data not available The absence of any sign or symbol indicates that data are in units.

List of countries
Full designation Designation in document
Algeria (People's Democratic Republic of) Algeria
Bahrain (State of) Bahrain
Comoros (Islamic Federal Republic of the) Comoros
Djibouti (Republic of) Djibouti
Egypt (Arab Republic of) Egypt
Iraq (Republic of) Iraq
Jordan (Hashemite Kingdom of) Jordan
Kuwait (State of) Kuwait
Lebanon Lebanon
Libya (Socialist People's Libyan Arab Jamahiriya) Libya
Mauritania (Islamic Republic of) Mauritania
Morocco (Kingdom of) Morocco
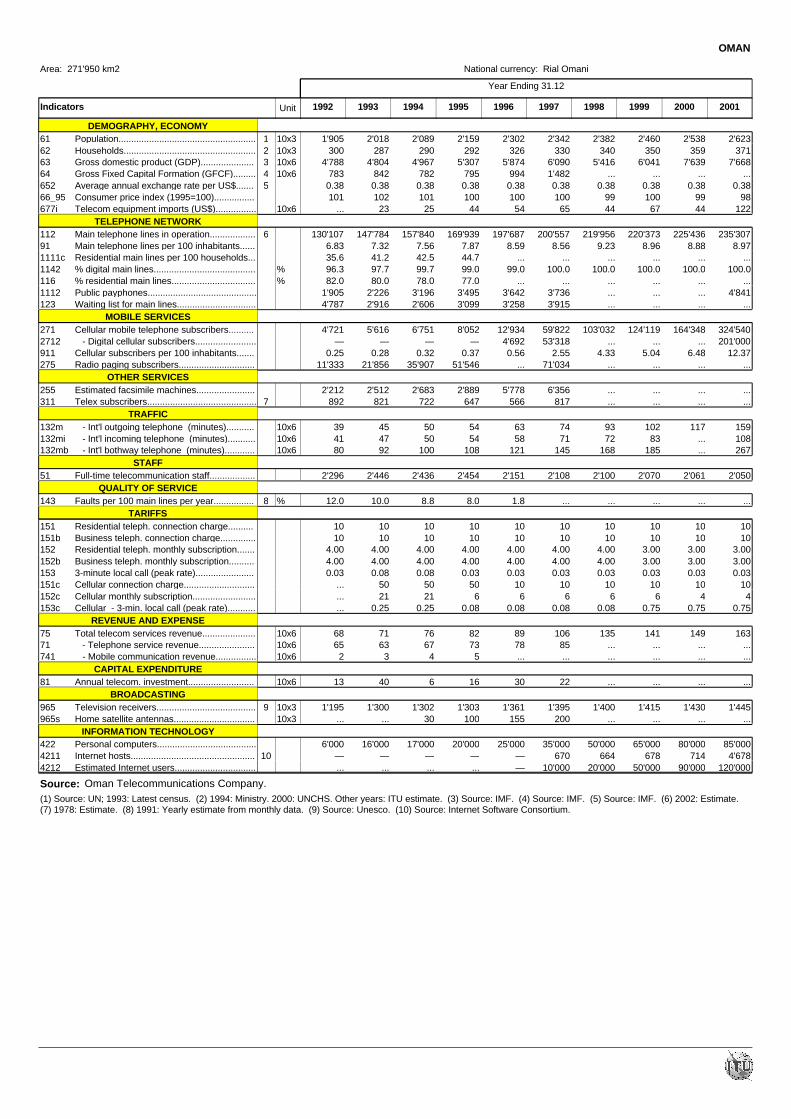
Oman (Sultanate of) Oman
Palestine Palestine
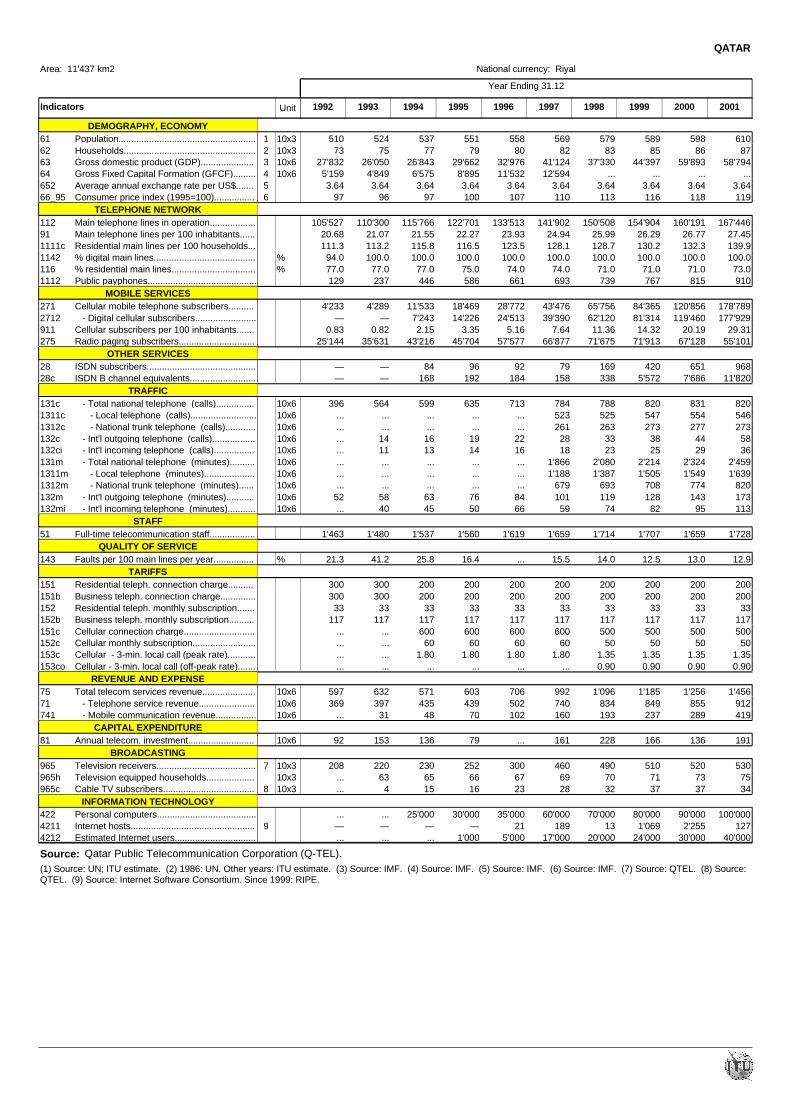
Qatar (State of) Qatar
Saudi Arabia (Kingdom of) Saudi Arabia
Somali Democratic Republic Somalia
Sudan (Republic of the) Sudan
Syrian Arab Republic Syria
Tunisia Tunisia
United Arab Emirates United Arab Emirates
Yemen (Republic of) Yemen
Arab States Arab States

200120001996 1997 1998 19991995199419931992
Year Ending 31.12
Area: 2'381'745 km2 National currency: Dinar
Indicators Unit
ALGERIA
DEMOGRAPHY, ECONOMY28'060Population......................................................61 10x31 27'49626'271 26'894 28'566 29'045 29'507 29'950 30'386 30'8364'162Households....................................................62 10x32 4'0403'806 3'921 4'280 4'402 4'500 4'604 4'892 5'000
2'004'990Gross domestic product (GDP).....................63 10x63 1'487'4001'074'700 1'189'720 2'570'030 2'780'170 2'810'120 3'215'130 4'078'680 ...541'830Gross Fixed Capital Formation (GFCF).........64 10x64 407'550277'970 324'140 639'450 638'120 728'754 728'754 869'326 ...
47.66Average annual exchange rate per US$.......652 5 35.0621.84 23.35 54.75 57.71 58.74 66.57 75.26 77.22100Consumer price index (1995=100)................66_95 6 7649 59 122 126 129 133 139 144
...Telecom equipment imports (US$)................677i 10x6 ...126 71 92 86 104 149 118 ...TELEPHONE NETWORK
1'176Main telephone lines in operation..................112 10x3 1'122962 1'068 1'278 1'400 1'477 1'600 1'761 1'8804.19Main telephone lines per 100 inhabitants......91 4.083.66 3.97 4.47 4.82 5.01 5.34 5.80 6.10
...% households with a telephone.....................1111 ...... ... ... ... ... 34.0 36.0 37.6
...Residential main lines per 100 households...1111c ...21.7 ... ... ... ... ... 28.8 31.633.9% digital main lines........................................1142 % 29.425.6 27.2 45.9 51.3 57.9 70.0 92.0 100.0
...% residential main lines.................................116 %7 ...86.0 ... ... ... ... ... 80.0 84.06'523Public payphones...........................................1112 6'7226'387 7'386 5'777 5'698 5'000 5'000 5'000 5'000
676Waiting list for main lines...............................123 10x3 647757 688 691 732 730 640 646 727MOBILE SERVICES
4'691Cellular mobile telephone subscribers..........271 1'3484'781 4'781 11'700 17'400 18'000 72'000 86'000 100'000— - Digital cellular subscribers........................2712 —— — — — — 54'000 68'000 100'000
0.02Cellular subscribers per 100 inhabitants.......911 —0.02 0.02 0.04 0.06 0.06 0.24 0.28 0.32OTHER SERVICES
5'200Estimated facsimile machines.......................255 8 4'1385'000 5'500 6'200 7'000 ... ... ... ...11'600Telex subscribers...........................................311 11'90012'000 12'400 11'200 10'000 9'500 8'035 8'000 ...
TRAFFIC84 - Int'l outgoing telephone (minutes)...........132m 10x6 79118 78 93 100 121 143 152 209
8'889Total telephone (pulses)...............................133p 10x6 8'7786'643 7'778 9'672 11'000 13'000 15'160 ... ...STAFF
18'423Full-time telecommunication staff..................51 18'49219'208 22'712 18'554 18'817 18'230 17'809 17'900 17'900QUALITY OF SERVICE
73.0Faults per 100 main lines per year................143 %9 74.081.9 72.0 70.0 64.0 50.0 25.0 12.0 6.0TARIFFS
2'200Residential teleph. connection charge..........151 2'2002'200 2'200 2'200 2'200 3'500 3'500 3'500 3'5002'200Business teleph. connection charge..............151b 2'2002'200 2'200 2'200 2'200 3'500 3'500 3'500 3'500
100Residential teleph. monthly subscription.......152 9090 90 100 100 200 200 200 200100Business teleph. monthly subscription..........152b 9090 90 100 100 200 200 200 2001.303-minute local call (peak rate).......................153 1.150.90 0.90 1.30 1.30 1.30 1.30 1.30 1.30
20'000Cellular connection charge............................151c 10'00010'000 10'000 20'000 20'000 20'000 20'000 20'000 20'0001'300Cellular monthly subscription.........................152c 500500 500 1'300 1'300 1'300 1'300 1'300 1'30019.50Cellular - 3-min. local call (peak rate)...........153c 15.6010.80 13.80 19.60 19.60 9.75 9.75 9.75 9.7515.60Cellular - 3-min. local call (off-peak rate).......153co 15.6010.80 13.80 16.00 16.00 7.80 7.80 7.80 7.80
REVENUE AND EXPENSE10'698Total telecom services revenue.....................75 10x6 8'7695'355 6'703 12'456 12'947 16'873 19'360 23'000 27'9268'421 - Telephone service revenue......................71 10x6 7'0424'343 5'283 9'995 11'426 13'980 17'700 18'607 20'613
113 - Mobile communication revenue................741 10x6 ...... ... ... ... ... ... ... ...CAPITAL EXPENDITURE
3'692Annual telecom. investment..........................81 10x6 3'8053'787 3'467 7'035 5'692 8'594 7'620 ... 7'449BROADCASTING
2'500Television receivers.......................................965 10x310 2'1502'000 2'100 3'000 3'400 3'420 3'450 3'480 3'5002'357Television equipped households...................965h 10x311 2'0271'886 1'980 2'829 3'206 3'225 3'253 3'281 3'300
600Home satellite antennas................................965s 10x312 100... ... ... ... ... 3'500 3'500 3'500INFORMATION TECHNOLOGY
85'000Personal computers.......................................422 72'00048'000 60'000 130'000 140'000 160'000 180'000 200'000 220'00016Internet hosts.................................................4211 13 10— — 28 49 88 200 34 665
500Estimated Internet users................................4212 100... ... 500 3'000 6'000 60'000 150'000 200'000
Ministère des Postes et Télécommunications (MPT).Source:(1) Source: UN. Last census: 1987. Since 1990: Algeria Statistical Office. (2) 1990, 1995: UNHCS. Other years: ITU estimates. (3) Source: IMF. (4) Source: IMF. (5) Source: IMF. (6) Source: IMF. (7) 2000: ITU estimate. (8) 1994: MPT. Estimate. (9) 1996: ITU estimate. (10) Sources: ENT, EBU, UNESCO, ITU estimates. (11) 2001: Entreprise Nationale de Télévision. (12) Source: OBS. 2001: Entreprise Nationale de Télévision. (13) Source: RIPE.

200120001996 1997 1998 19991995199419931992
Year Ending 31.12
BAHRAIN
National currency: Dinar
Indicators Unit
Area: 709 km2
DEMOGRAPHY, ECONOMY561Population......................................................61 10x31 547521 534 575 589 604 619 635 65192Households....................................................62 10x32 9086 88 94 96 98 101 103 106
2'199Gross domestic product (GDP).....................63 10x63 2'0931'786 1'955 2'294 2'387 2'325 2'489 2'997 2'984381Gross Fixed Capital Formation (GFCF).........64 10x64 431394 465 284 286 326 338 405 3980.38Average annual exchange rate per US$.......652 5 0.380.38 0.38 0.38 0.38 0.38 0.38 0.38 0.38100Consumer price index (1995=100)................66_95 6 9794 97 100 102 102 100 100 ...
...Telecom equipment imports (US$)................677i 10x3 ...... ... ... ... ... ... 36'038 49'710TELEPHONE NETWORK
140'850Main telephone lines in operation..................112 135'853112'530 124'353 144'391 152'303 157'619 165'369 170'976 173'85525.11Main telephone lines per 100 inhabitants......91 24.8321.61 23.30 25.12 25.84 26.09 26.71 26.94 26.72106.0Residential main lines per 100 households...1111c 101.688.2 95.2 107.6 110.9 112.1 115.0 116.1 115.2100.0% digital main lines........................................1142 % 100.0100.0 100.0 100.0 100.0 100.0 100.0 100.0 100.069.0% residential main lines.................................116 % 67.067.0 67.0 70.0 70.0 70.0 70.0 70.0 70.0
1'004Public payphones...........................................1112 7 878654 805 1'084 1'321 1'589 1'855 2'308 2'029MOBILE SERVICES
27'600Cellular mobile telephone subscribers..........271 17'6169'683 11'360 40'080 58'543 92'063 133'468 205'727 300'8298'382 - Digital cellular subscribers........................2712 —— — 20'529 49'615 92'063 133'468 205'727 300'8294.92Cellular subscribers per 100 inhabitants.......911 3.221.86 2.13 6.97 9.93 15.24 21.55 32.41 46.24
61'016Radio paging subscribers..............................275 55'52429'584 47'781 65'934 70'629 73'076 84'611 86'316 86'375OTHER SERVICES
6'299Estimated facsimile machines.......................255 8 5'3883'798 5'064 6'341 6'620 6'687 6'928 4'797 4'614—ISDN subscribers...........................................28 —— — 70 173 381 684 1'088 1'533—ISDN B channel equivalents..........................28c 9 —— — 140 346 762 1'368 2'176 3'066
895Telex subscribers...........................................311 9941'224 1'124 756 657 580 513 500 432TRAFFIC
89 - Int'l outgoing telephone (minutes)...........132m 10x6 8768 77 92 107 124 134 140 17063 - Int'l incoming telephone (minutes)...........132mi 10x6 5951 55 69 85 102 107 126 183
151 - Int'l bothway telephone (minutes)............132mb 10x6 146120 132 165 192 227 241 265 353519 - Total national telephone (pulses)............131p 10x6 471373 427 551 623 690 1'052 1'363 ...
STAFF2'139Full-time telecommunication staff..................51 2'1022'090 2'070 2'074 2'049 2'100 2'118 2'089 2'038
QUALITY OF SERVICE28.0Faults per 100 main lines per year................143 % 49.066.0 71.0 24.0 30.0 18.0 19.0 15.0 15.0
TARIFFS20Residential teleph. connection charge..........151 2020 20 20 20 20 20 20 2020Business teleph. connection charge..............151b 2020 20 20 20 20 20 20 20
1.17Residential teleph. monthly subscription.......152 1.171.25 1.15 1.17 1.16 1.16 1.16 1.16 1.162.17Business teleph. monthly subscription..........152b 2.172.00 2.00 2.17 2.16 2.16 2.16 2.16 2.16
0.0213-minute local call (peak rate).......................153 10 0.0210.021 0.021 0.021 0.021 0.021 0.021 0.021 0.02145Cellular connection charge............................151c 5050 50 35 35 35 35 35 3515Cellular monthly subscription.........................152c 11 88 8 10 25 10 10 10 10
0.15Cellular - 3-min. local call (peak rate)...........153c 12 0.150.15 0.15 0.15 0.15 0.15 0.14 0.14 0.140.12Cellular - 3-min. local call (off-peak rate).......153co 13 ...... ... 0.11 0.11 0.10 0.10 0.10 0.10
REVENUE AND EXPENSE91Total telecom services revenue.....................75 10x6 8677 80 99 111 129 138 147 17169 - Telephone service revenue......................71 10x6 6760 63 74 76 76 65 61 629 - Mobile communication revenue................741 10x6 8... 4 14 21 32 38 42 54
CAPITAL EXPENDITURE18Annual telecom. investment..........................81 10x6 1816 21 23 20 27 33 32 43
BROADCASTING255Television receivers.......................................965 10x314 236220 228 257 260 265 270 275 28091Television equipped households...................965h 10x315 8680 83 93 95 97 99 100 102...Cable TV subscribers....................................965c 10x3 ...... ... ... 3 5 6 6 8
57Home satellite antennas................................965s 10x316 5653 54 58 60 61 63 64 66INFORMATION TECHNOLOGY
29'250Personal computers.......................................422 17 ...... ... 40'000 50'000 60'000 93'000 95'000 100'000142Internet hosts.................................................4211 18 —— — 841 338 577 1'117 1'121 1'718
2'000Estimated Internet users................................4212 ...... ... 5'000 10'000 20'000 30'000 40'000 132'330
Bahrain Telecommunications Company (BATELCO).Source:(1) Source: 1960-1979: UN. 1980,1991,2001: Census. Other years: ITU estimate. (2) Source: 1960-1979: UN. 1980,1991,2001: Census. Other years: ITU estimate. (3) Source: IMF. (4) Source: IMF. (5) Source: IMF. (6) Source: IMF. (7) Not including payphones in private establishments. (8) Number of fax lines. (9) 1996-2001: Estimated. (10) No "off peak" rate for local calls. All calls charged at 21 fils per 3 min., (1'000 fils = 1 Dinar). (11) In 1999, mobile tariffs split into "high", "regular" and "low" usage. Figures relate to regular usage package. (12) In 1999, mobile tariffs split into "high", "regular" and "low" usage. Figures relate to regular usage package. (13) In 1999, mobile tariffs split into "high", "regular" and "low" usage. Figures relate to regular usage package. (14) Source: Unesco, Bahrain TV, Batelco, ITU estimates. (15) 2001: Census. (16) 2001: Census. (17) 1999,2002: Batelco estimate. (18) Source: Internet Software Consortium.

200120001996 1997 1998 19991995199419931992
Year Ending 31.12
Area: 1'862 km2 National currency: Franc CFA
Indicators Unit
COMOROS
DEMOGRAPHY, ECONOMY610'000Population......................................................61 1 590'000508'400 570'000 632'000 652'000 658'000 675'888 694'000 727'000102'000Households....................................................62 2 98'70093'000 95'700 128'000 130'000 130'000 133'500 144'200 145'00087'313Gross domestic product (GDP).....................63 10x63 83'50969'129 79'223 ... 92'836 95'304 102'782 108'851 121'003
...Gross Fixed Capital Formation (GFCF).........64 10x64 18'75413'964 10'356 ... ... ... ... ... ...374.36Average annual exchange rate per US$.......652 416.40264.69 283.16 383.66 437.75 442.46 461.78 533.98 549.78
TELEPHONE NETWORK4'377Main telephone lines in operation..................112 4'2723'851 4'010 4'980 5'507 6'226 6'521 6'773 8'8760.72Main telephone lines per 100 inhabitants......91 0.720.76 0.70 0.79 0.84 0.95 0.96 0.98 1.223.3Residential main lines per 100 households...1111c ...3.6 ... ... ... ... ... ... ...
10.2% digital main lines........................................1142 % 5.7— 3.6 10.0 10.7 ... ... ... ...78.0% residential main lines.................................116 % ...87.0 ... ... ... ... ... ... ...
58Public payphones...........................................1112 28... ... 89 113 130 151 175 ......Waiting list for main lines...............................123 ...1'156 ... ... ... ... ... 3'054 ...
OTHER SERVICES...Estimated facsimile machines.......................255 ...76 98 ... 166 173 173 173 ...3Telex subscribers...........................................311 ...48 55 ... 23 23 21 19 ...
TRAFFIC942 - Int'l outgoing telephone (minutes)...........132m 10x3 1'3001'474 1'188 1'111 1'222 1'697 2'005 1'982 2'254
1'694 - Int'l incoming telephone (minutes)...........132mi 10x3 ...1'086 1'248 2'290 3'271 4'764 6'829 10'717 ...2'636 - Int'l bothway telephone (minutes)............132mb 10x3 ...2'560 2'436 3'401 4'493 6'461 8'834 12'699 ...
STAFF136Full-time telecommunication staff..................51 122230 199 148 140 140 125 123 121
QUALITY OF SERVICE60.0Faults per 100 main lines per year................143 % ...96.0 68.0 81.7 92.5 84.8 87.9 82.8 ...
TARIFFS45'000Residential teleph. connection charge..........151 45'00035'250 35'250 45'000 45'000 45'000 45'000 45'000 39'00045'000Business teleph. connection charge..............151b 45'00035'250 35'250 45'000 45'000 45'000 45'000 45'000 39'0002'250Residential teleph. monthly subscription.......152 2'2501'875 1'875 2'250 2'250 2'250 2'250 2'250 2'2502'250Business teleph. monthly subscription..........152b 2'2501'875 1'875 2'250 2'250 2'250 2'250 2'250 2'250
753-minute local call (peak rate).......................153 5 7575 75 75 75 75 75 75 75REVENUE AND EXPENSE
1'699Total telecom services revenue.....................75 10x6 1'2751'168 1'250 2'795 3'590 3'394 2'572 3'418 4'737CAPITAL EXPENDITURE
592Annual telecom. investment..........................81 10x6 ...254 246 ... ... ... ... ... ...BROADCASTING
2'310Television receivers.......................................965 6 2'2501'600 1'950 2'500 2'600 2'700 2'700 2'700 2'700INFORMATION TECHNOLOGY
162Personal computers.......................................422 7 ...... ... ... ... 1'500 2'000 3'000 4'000—Internet hosts.................................................4211 8 —— — — — 9 33 40 11...Estimated Internet users................................4212 ...... ... ... — 200 800 1'500 2'500
Société Nationale des Postes et Telecommunications (SNPT).Source:(1) Source: UN; ITU estimate. 1991: Latest census. (2) ITU estimate. (3) Source: IMF. Since 1997: World Bank. (4) Source: IMF. (5) 1992-93: Manual call tariff (except for France). Tariff is for 6 minutes. (6) Source: Société nationale des postes et télécommunications, ITU estimate. (7) Source: ACCT. (8) Source: Internet Software Consortium.
200120001996 1997 1998 19991995199419931992
Year Ending 31.12
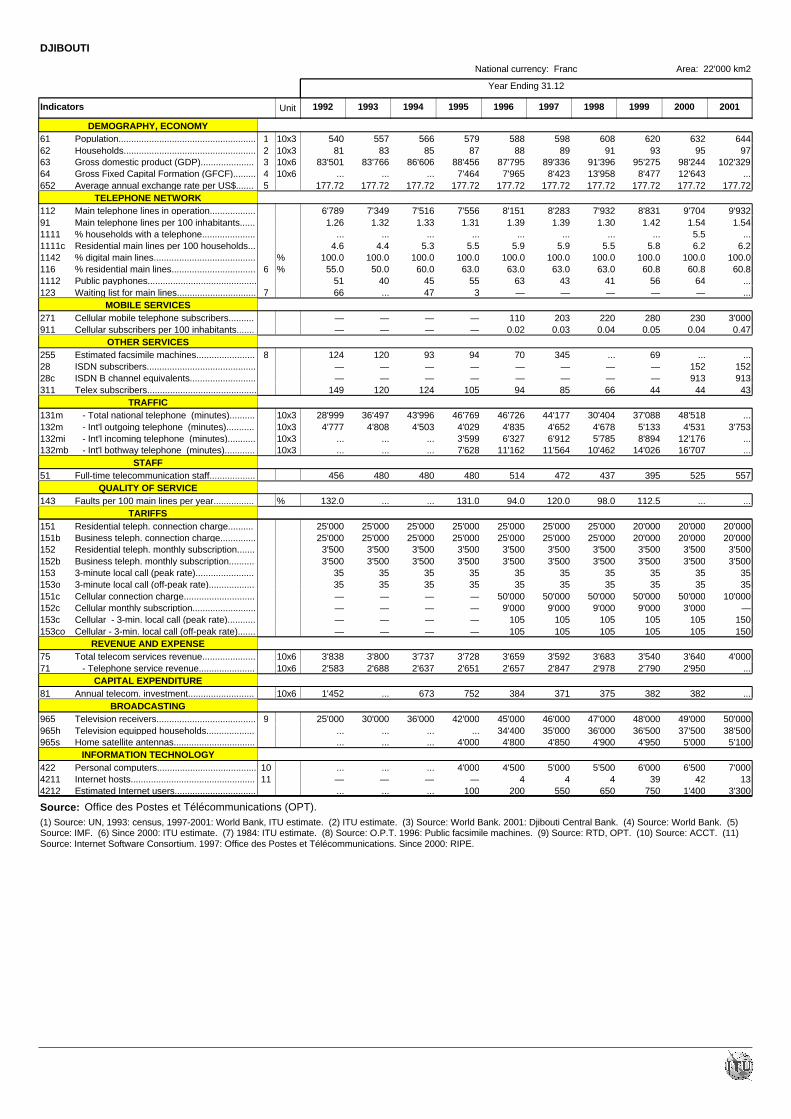
DJIBOUTI
National currency: Franc
Indicators Unit
Area: 22'000 km2
DEMOGRAPHY, ECONOMY579Population......................................................61 10x31 566540 557 588 598 608 620 632 64487Households....................................................62 10x32 8581 83 88 89 91 93 95 97
88'456Gross domestic product (GDP).....................63 10x63 86'60683'501 83'766 87'795 89'336 91'396 95'275 98'244 102'3297'464Gross Fixed Capital Formation (GFCF).........64 10x64 ...... ... 7'965 8'423 13'958 8'477 12'643 ...
177.72Average annual exchange rate per US$.......652 5 177.72177.72 177.72 177.72 177.72 177.72 177.72 177.72 177.72TELEPHONE NETWORK
7'556Main telephone lines in operation..................112 7'5166'789 7'349 8'151 8'283 7'932 8'831 9'704 9'9321.31Main telephone lines per 100 inhabitants......91 1.331.26 1.32 1.39 1.39 1.30 1.42 1.54 1.54
...% households with a telephone.....................1111 ...... ... ... ... ... ... 5.5 ...5.5Residential main lines per 100 households...1111c 5.34.6 4.4 5.9 5.9 5.5 5.8 6.2 6.2
100.0% digital main lines........................................1142 % 100.0100.0 100.0 100.0 100.0 100.0 100.0 100.0 100.063.0% residential main lines.................................116 %6 60.055.0 50.0 63.0 63.0 63.0 60.8 60.8 60.8
55Public payphones...........................................1112 4551 40 63 43 41 56 64 ...3Waiting list for main lines...............................123 7 4766 ... — — — — — ...
MOBILE SERVICES—Cellular mobile telephone subscribers..........271 —— — 110 203 220 280 230 3'000—Cellular subscribers per 100 inhabitants.......911 —— — 0.02 0.03 0.04 0.05 0.04 0.47
OTHER SERVICES94Estimated facsimile machines.......................255 8 93124 120 70 345 ... 69 ... ...—ISDN subscribers...........................................28 —— — — — — — 152 152—ISDN B channel equivalents..........................28c —— — — — — — 913 913
105Telex subscribers...........................................311 124149 120 94 85 66 44 44 43TRAFFIC
46'769 - Total national telephone (minutes)..........131m 10x3 43'99628'999 36'497 46'726 44'177 30'404 37'088 48'518 ...4'029 - Int'l outgoing telephone (minutes)...........132m 10x3 4'5034'777 4'808 4'835 4'652 4'678 5'133 4'531 3'7533'599 - Int'l incoming telephone (minutes)...........132mi 10x3 ...... ... 6'327 6'912 5'785 8'894 12'176 ...7'628 - Int'l bothway telephone (minutes)............132mb 10x3 ...... ... 11'162 11'564 10'462 14'026 16'707 ...
STAFF480Full-time telecommunication staff..................51 480456 480 514 472 437 395 525 557
QUALITY OF SERVICE131.0Faults per 100 main lines per year................143 % ...132.0 ... 94.0 120.0 98.0 112.5 ... ...
TARIFFS25'000Residential teleph. connection charge..........151 25'00025'000 25'000 25'000 25'000 25'000 20'000 20'000 20'00025'000Business teleph. connection charge..............151b 25'00025'000 25'000 25'000 25'000 25'000 20'000 20'000 20'0003'500Residential teleph. monthly subscription.......152 3'5003'500 3'500 3'500 3'500 3'500 3'500 3'500 3'5003'500Business teleph. monthly subscription..........152b 3'5003'500 3'500 3'500 3'500 3'500 3'500 3'500 3'500
353-minute local call (peak rate).......................153 3535 35 35 35 35 35 35 35353-minute local call (off-peak rate)..................153o 3535 35 35 35 35 35 35 35—Cellular connection charge............................151c —— — 50'000 50'000 50'000 50'000 50'000 10'000—Cellular monthly subscription.........................152c —— — 9'000 9'000 9'000 9'000 3'000 ——Cellular - 3-min. local call (peak rate)...........153c —— — 105 105 105 105 105 150—Cellular - 3-min. local call (off-peak rate).......153co —— — 105 105 105 105 105 150
REVENUE AND EXPENSE3'728Total telecom services revenue.....................75 10x6 3'7373'838 3'800 3'659 3'592 3'683 3'540 3'640 4'0002'651 - Telephone service revenue......................71 10x6 2'6372'583 2'688 2'657 2'847 2'978 2'790 2'950 ...
CAPITAL EXPENDITURE752Annual telecom. investment..........................81 10x6 6731'452 ... 384 371 375 382 382 ...
BROADCASTING42'000Television receivers.......................................965 9 36'00025'000 30'000 45'000 46'000 47'000 48'000 49'000 50'000
...Television equipped households...................965h ...... ... 34'400 35'000 36'000 36'500 37'500 38'5004'000Home satellite antennas................................965s ...... ... 4'800 4'850 4'900 4'950 5'000 5'100
INFORMATION TECHNOLOGY4'000Personal computers.......................................422 10 ...... ... 4'500 5'000 5'500 6'000 6'500 7'000
—Internet hosts.................................................4211 11 —— — 4 4 4 39 42 13100Estimated Internet users................................4212 ...... ... 200 550 650 750 1'400 3'300
Office des Postes et Télécommunications (OPT).Source:(1) Source: UN, 1993: census, 1997-2001: World Bank, ITU estimate. (2) ITU estimate. (3) Source: World Bank. 2001: Djibouti Central Bank. (4) Source: World Bank. (5) Source: IMF. (6) Since 2000: ITU estimate. (7) 1984: ITU estimate. (8) Source: O.P.T. 1996: Public facsimile machines. (9) Source: RTD, OPT. (10) Source: ACCT. (11) Source: Internet Software Consortium. 1997: Office des Postes et Télécommunications. Since 2000: RIPE.

200120001996 1997 1998 19991995199419931992
Year Ending 30.06
Area: 1'000'250 km2 National currency: Pound
Indicators Unit
EGYPT
DEMOGRAPHY, ECONOMY58'180Population......................................................61 10x31 57'55655'339 56'434 59'272 60'348 61'401 62'430 63'475 64'55012'300Households....................................................62 10x32 11'50011'100 11'280 12'514 12'732 12'954 13'180 13'410 13'800
204'000Gross domestic product (GDP).....................63 10x63 175'000139'100 157'300 229'400 257'200 278'100 302'100 338'700 361'80033'100Gross Fixed Capital Formation (GFCF).........64 10x64 29'00026'500 25'500 36'760 47'700 58'200 59'500 60'000 59'400
3.39Average annual exchange rate per US$.......652 5 3.393.32 3.35 3.39 3.39 3.39 3.40 3.47 3.97100Consumer price index (1995=100)................66_95 6 8671 80 107 112 117 120 124 12697Telecom equipment imports (US$)................677i 10x6 121... ... 123 145 304 336 ... 238
TELEPHONE NETWORK2'716Main telephone lines in operation..................112 10x37 2'4562'028 2'235 3'025 3'453 3'972 4'686 5'484 6'6884.67Main telephone lines per 100 inhabitants......91 4.273.66 3.96 5.10 5.72 6.47 7.51 8.64 10.3615.9Residential main lines per 100 households...1111c 15.313.1 14.2 17.6 20.1 23.9 27.7 31.9 39.767.0% digital main lines........................................1142 % 56.343.0 47.0 72.0 75.0 82.0 86.0 96.0 99.072.0% residential main lines.................................116 %8 71.671.5 71.8 73.0 74.2 78.0 77.8 78.0 82.0
4'734Public payphones...........................................1112 9 4'1343'438 3'873 5'046 4'946 4'976 10'316 21'987 35'1701'300Waiting list for main lines...............................123 10x310 1'3101'246 1'238 1'300 1'278 1'363 1'294 1'300 583
MOBILE SERVICES7'368Cellular mobile telephone subscribers..........271 7'3714'913 6'877 7'369 65'378 90'786 480'974 1'359'900 2'793'800
— - Digital cellular subscribers........................2712 —— — — 58'154 83'536 473'942 1'359'900 2'793'8000.01Cellular subscribers per 100 inhabitants.......911 0.010.01 0.01 0.01 0.11 0.15 0.77 2.14 4.33
23'000Radio paging subscribers..............................275 11 9'1824'640 5'593 37'000 36'335 27'307 28'770 26'971 23'637OTHER SERVICES
27'332Estimated facsimile machines.......................255 21'59113'638 17'608 31'394 30'720 33'068 34'194 ... ...—ISDN subscribers...........................................28 —— — — — — — 617 3'057—ISDN B channel equivalents..........................28c 12 —— — — — — — 1'250 6'150
4'400Telex subscribers...........................................311 4'9946'017 5'621 3'700 3'172 2'652 2'263 ... ...TRAFFIC
314 - National trunk telephone (calls)............1312c 10x613 270211 228 371 428 563 791 ... ...100 - Int'l outgoing telephone (minutes)...........132m 10x614 9474 80 113 119 127 149 187 223376 - Int'l incoming telephone (minutes)...........132mi 10x615 396258 372 417 451 475 532 621 811476 - Int'l bothway telephone (minutes)............132mb 10x6 489332 452 530 571 603 681 808 1'034
STAFF52'291Full-time telecommunication staff..................51 52'38352'705 52'890 51'750 51'981 55'647 55'524 54'922 54'810
QUALITY OF SERVICE...Faults per 100 main lines per year................143 % ...... ... ... 8.2 7.2 6.9 2.0 0.5
TARIFFS...Residential teleph. connection charge..........151 400400 400 ... 500 500 500 500 500...Business teleph. connection charge..............151b 900900 900 ... 1'000 1'000 1'000 1'000 1'000
3.75Residential teleph. monthly subscription.......152 3.753.75 3.75 3.75 3.75 3.75 3.75 3.75 3.756.25Business teleph. monthly subscription..........152b 6.256.25 6.25 6.25 6.25 6.25 6.25 6.25 6.25
...3-minute local call (peak rate).......................153 0.050.05 0.05 ... 0.10 0.10 0.10 0.05 0.05
...3-minute local call (off-peak rate)..................153o ...... ... ... 0.10 0.10 0.10 0.05 0.05
...Cellular connection charge............................151c 16 3'400... ... ... ... ... 500 500 500
...Cellular monthly subscription.........................152c 17 300... ... ... ... ... 105 65 65
...Cellular - 3-min. local call (peak rate)...........153c 18 0.45... ... ... ... ... 1.50 2.70 2.70
...Cellular - 3-min. local call (off-peak rate).......153co ...... ... ... ... ... 1.20 2.10 2.10REVENUE AND EXPENSE
2'168Total telecom services revenue.....................75 10x6 1'8011'489 1'681 2'622 2'963 4'657 6'793 9'463 10'157... - Telephone service revenue......................71 10x6 ...1'338 ... ... ... ... 3'507 3'691 3'033... - Mobile communication revenue................741 10x619 ...... ... ... ... 541 2'476 3'943 4'150
CAPITAL EXPENDITURE...Annual telecom. investment..........................81 10x6 1'003980 931 ... ... ... 2'424 1'781 2'412
BROADCASTING9'600Television receivers.......................................965 10x320 8'8007'600 7'900 10'600 11'600 12'800 14'000 14'400 14'9008'000Television equipped households...................965h 10x321 7'3006'300 6'600 8'800 9'700 10'700 11'640 12'025 12'400
...Home satellite antennas................................965s 10x322 150... ... ... 669 ... 877 882 887INFORMATION TECHNOLOGY
250'000Personal computers.......................................422 23 194'000... ... 350'000 450'000 600'000 750'000 800'000 1'000'000561Internet hosts.................................................4211 24 153— 10 1'976 1'805 2'420 2'355 2'240 1'802
20'000Estimated Internet users................................4212 4'000... 600 40'000 60'000 100'000 200'000 450'000 600'000
Telecom Egypt.Source:(1) Source: UN. (2) 1960,1976,1986: UN. 2000: UNCHS. Other years: ITU estimates. (3) Source: IMF. (4) Source: IMF. (5) Source: IMF. (6) Source: IMF. (7) 2002: September. (8) 1995-96: ITU estimates. (9) 1999-2001: Including data from Menatel Company and Nile Company. (10) 1983-86: Estimates. 1995-96: ITU estimates. (11) 1995: ITU estimate. (12) 1999-2000: Estimated. (13) 1996: ITU estimate. (14) 1984: Estimate. Year ending 31.12. (15) Year ending 31.12. (16) 1999: MobiNil. Classic Plan. Excluding sales tax. 2000-2001: Mobinil "Light" plan. (17) 1999: MobiNil. Classic Plan. Excluding sales tax. 2000-2001: Mobinil "Light" plan. (18) 1999: MobiNil. Classic Plan. Excluding sales tax. 2000-2001: Mobinil "Light" plan. (19) Source: ITU estimates. (20) Source: Unesco, ITU estimates. (21) ITU estimates. Eutelsat. (22) Eutelsat. (23) Source: ITU estimates. (24) Source: RIPE.

200120001996 1997 1998 19991995199419931992
Year Ending 30.06
IRAQ
National currency: Dinar
Indicators Unit
Area: 438'446 km2
DEMOGRAPHY, ECONOMY20'090Population......................................................61 10x31 19'65018'991 19'260 20'607 21'177 21'800 22'450 22'946 23'5852'459Households....................................................62 10x32 2'4102'315 2'362 2'509 2'560 2'612 2'665 2'722 2'8400.31Average annual exchange rate per US$.......652 3 0.310.31 0.31 0.31 0.31 0.31 0.31 0.31 0.31
TELEPHONE NETWORK639Main telephone lines in operation..................112 10x34 649714 680 640 651 650 675 675 6753.18Main telephone lines per 100 inhabitants......91 3.303.76 3.53 3.10 3.07 2.98 3.01 2.94 2.86
OTHER SERVICES3'166Telex subscribers...........................................311 3'1603'330 3'135 ... ... ... ... ... ...
TRAFFIC1 - Int'l outgoing telephone (calls).................132c 10x6 13 3 1 2 4 ... ... ...4 - Int'l outgoing telephone (minutes)...........132m 10x6 510 12 6 6 19 ... ... ...
BROADCASTING1'600Television receivers.......................................965 10x35 1'5001'400 1'450 1'700 1'750 1'800 1'850 1'900 ...
INFORMATION TECHNOLOGY—Internet hosts.................................................4211 6 —— — — — — 5 1 —...Estimated Internet users................................4212 ...... ... ... ... ... ... ... 12'500
Iraqi Telecommunications and Posts.Source:(1) Source: UN; 1987: Latest census. (2) 1965, 1985, 2000: UN. Other years: ITU estimates. (3) Source: World Bank. (4) 1989,1999-2000: Estimate. (5) Source 1992-93, 1995-96: Unesco. (6) Source: Internet Software Consortium.

200120001996 1997 1998 19991995199419931992
Year Ending 31.12
Area: 96'000 km2 National currency: Dinar
Indicators Unit
JORDAN
DEMOGRAPHY, ECONOMY4'291Population......................................................61 10x31 4'1103'843 3'991 4'444 4'600 4'756 4'900 5'039 5'182
684Households....................................................62 10x32 672580 609 697 709 751 796 843 8944'774Gross domestic product (GDP).....................63 10x63 4'4003'648 3'926 4'982 5'192 5'647 5'724 5'913 6'2591'395Gross Fixed Capital Formation (GFCF).........64 10x64 1'3911'049 1'304 1'445 1'325 1'183 1'088 1'199 ...0.70Average annual exchange rate per US$.......652 5 0.700.68 0.69 0.71 0.71 0.71 0.71 0.71 0.71100Consumer price index (1995=100)................66_95 6 9891 94 107 110 115 115 115 11740Telecom equipment imports (US$)................677i 10x6 13... ... ... 36 58 43 59 125
TELEPHONE NETWORK317'007Main telephone lines in operation..................112 7 316'593278'265 290'086 345'527 404'333 510'875 565'273 614'000 668'000
7.39Main telephone lines per 100 inhabitants......91 7.707.24 7.27 7.78 8.79 10.74 11.54 12.18 12.8932.4Residential main lines per 100 households...1111c 34.838.9 38.6 35.2 42.5 52.4 54.0 56.8 58.370.6% digital main lines........................................1142 % 70.065.0 68.0 74.0 85.0 93.0 93.9 94.0 94.070.0% residential main lines.................................116 % 74.081.0 81.0 71.0 74.6 77.0 76.0 78.0 78.0687Public payphones...........................................1112 ...308 ... 730 656 3'489 6'308 7'420 7'851
128'978Waiting list for main lines...............................123 119'97177'280 99'449 156'158 161'076 73'664 29'687 14'583 9'350MOBILE SERVICES
12'400Cellular mobile telephone subscribers..........271 8 1'4461'462 1'456 16'100 45'037 82'429 118'417 388'949 866'00012'400 - Digital cellular subscribers........................2712 —— — 16'100 45'037 82'429 118'417 388'949 866'000
0.29Cellular subscribers per 100 inhabitants.......911 0.040.04 0.04 0.36 0.98 1.73 2.42 7.72 16.717'090Radio paging subscribers..............................275 2'060— — 12'580 15'240 11'540 23'450 11'700 4'412
OTHER SERVICES—ISDN subscribers...........................................28 9 —— — — — — 661 1'175 1'826—ISDN B channel equivalents..........................28c 10 —— — — — — 1'322 5'227 10'603
TRAFFIC...Total national telephone (minutes)...............131m 10x6 3'4423'035 3'295 ... 3'513 4'563 5'249 5'724 6'582... - Local telephone (minutes)....................1311m 10x6 3'1752'837 3'085 ... 3'152 4'107 4'743 5'202 ...... - National trunk telephone (minutes)......1312m 10x6 267198 210 ... 361 456 506 521 488
72 - Int'l outgoing telephone (minutes)...........132m 10x611 5746 50 75 92 123 146 171 190127 - Int'l incoming telephone (minutes)...........132mi 10x6 11292 100 141 147 178 192 214 217198 - Int'l bothway telephone (minutes)............132mb 10x6 169138 150 216 239 300 337 385 408
STAFF4'382Full-time telecommunication staff..................51 3'8763'553 3'787 4'585 5'259 5'675 5'880 6'430 6'541
QUALITY OF SERVICE65.0Faults per 100 main lines per year................143 % 69.879.7 74.5 72.0 76.0 60.0 42.0 18.2 14.2
TARIFFS125Residential teleph. connection charge..........151 12 125125 125 125 125 125 125 100 80250Business teleph. connection charge..............151b 250250 250 250 250 250 250 200 1602.33Residential teleph. monthly subscription.......152 13 2.332.33 2.33 2.33 2.33 2.33 2.33 2.80 3.355.00Business teleph. monthly subscription..........152b 5.005.00 5.00 5.00 5.00 5.00 6.00 7.20 8.000.023-minute local call (peak rate).......................153 0.020.01 0.02 0.02 0.03 0.03 0.03 0.03 0.03
70Cellular connection charge............................151c 1'0001'000 1'000 70 70 70 70 15 1521.00Cellular monthly subscription.........................152c 64.1464.14 64.14 21.00 21.00 21.00 15.00 5.00 5.000.72Cellular - 3-min. local call (peak rate)...........153c 0.060.06 0.06 0.72 0.56 0.56 0.56 0.44 0.340.42Cellular - 3-min. local call (off-peak rate).......153co ...... ... 0.42 0.30 0.30 0.30 0.24 0.24
REVENUE AND EXPENSE...Total telecom services revenue.....................75 10x614 153112 135 217 221 257 283 400 489
156 - Telephone service revenue......................71 10x615 11385 101 173 169 187 193 279 283... - Mobile communication revenue................741 10x6 ...... ... 16 33 58 69 96 188
CAPITAL EXPENDITURE9.38Annual telecom. investment..........................81 10x616 9.941.35 3.80 35.00 68.20 104.10 88.00 154.00 188.00
BROADCASTING670'000Television receivers.......................................965 17 644'000530'000 569'000 697'000 725'000 785'000 849'000 899'000 918'000609'200Television equipped households...................965h 18 585'100481'400 517'700 634'000 659'500 713'500 772'120 817'700 834'500
200Cable TV subscribers....................................965c —— — 600 800 1'000 1'200 1'400 ...1'000Home satellite antennas................................965s 19 6'0001'200 2'500 2'500 70'918 90'100 188'652 210'750 261'000
INFORMATION TECHNOLOGY35'000Personal computers.......................................422 30'000... ... 40'000 50'000 77'000 90'000 150'000 170'000
19Internet hosts.................................................4211 20 —— — 140 249 370 978 907 2'1851'000Estimated Internet users................................4212 ...... ... 2'000 27'354 60'816 120'000 127'317 234'000
Telecommunications Regulatory Commission.Source:(1) Source: Until 1986: UN; From 1987: Jordan Department of Statistics. 1994: Latest census. (2) 1979: UN. 1994: Census data. 1995: TCC. Other years: ITU estimate. (3) Source: IMF. (4) Source: IMF. (5) Source: IMF. (6) Source: IMF. (7) 1983: Estimate. (8) 1997: ITU estimate. (9) 2000: Preliminary. (10) 1999-2001: Estimated. (11) 1983-84: Estimate. (12) 2001: Including 89 free local minutes. (13) 2001: Including 89 free minutes per month. (14) 1996-2000: Jordan Telekom. (15) 1999-2000: Jordan Telekom. (16) 2000: Jordan Telekom. (17) ITU estimates. (18) ITU estimates. (19) Estimates of Telecommunications Corporation. ITU estimates. (20) Source: Internet Software Consortium. Since 1999: RIPE.

200120001996 1997 1998 19991995199419931992
Year Ending 31.12
KUWAIT
National currency: Dinar
Indicators Unit
Area: 24'281 km2
DEMOGRAPHY, ECONOMY1'802Population......................................................61 10x31 1'7921'776 1'784 1'894 1'980 2'027 2'107 2'190 2'275
255Households....................................................62 10x32 255251 253 284 316 352 392 437 4547'925Gross domestic product (GDP).....................63 10x63 7'3805'826 7'231 9'303 9'060 7'742 8'884 10'991 10'0571'198Gross Fixed Capital Formation (GFCF).........64 10x64 9821'013 1'094 1'230 1'240 1'448 1'335 827 8660.30Average annual exchange rate per US$.......652 5 0.300.29 0.30 0.30 0.30 0.30 0.30 0.31 0.31100Consumer price index (1995=100)................66_95 6 9795 95 104 104 104 108 109 111129Telecom equipment imports (US$)................677i 10x6 114139 140 147 ... ... ... ... ...
TELEPHONE NETWORK382Main telephone lines in operation..................112 10x3 373346 358 392 412 427 456 467 472
21.22Main telephone lines per 100 inhabitants......91 20.8019.46 20.07 20.68 20.79 21.08 21.62 21.33 20.77...Residential main lines per 100 households...1111c ...... 86.7 89.5 84.7 80.1 75.6 69.5 67.7
84.8% digital main lines........................................1142 % 84.875.0 82.4 92.3 93.0 94.0 97.0 100.0 100.0...% residential main lines.................................116 %7 ...... 61.3 64.9 65.0 66.0 65.0 65.0 65.0
546Public payphones...........................................1112 496316 360 562 559 574 550 620 6902'620Waiting list for main lines...............................123 8 2'6052'773 2'034 2'632 32'168 37'523 — — —
MOBILE SERVICES118Cellular mobile telephone subscribers..........271 10x3 8551 64 151 210 250 300 476 87840 - Digital cellular subscribers........................2712 10x3 8— — 76 126 180 220 ... 878
6.53Cellular subscribers per 100 inhabitants.......911 4.752.87 3.60 7.97 10.61 12.33 14.24 21.74 38.59120Radio paging subscribers..............................275 10x3 9796 110 145 160 180 185 ... ...
OTHER SERVICES35'000Estimated facsimile machines.......................255 30'000... 25'000 40'000 42'000 50'000 60'000 ... ...
485Telex subscribers...........................................311 535455 544 448 418 396 374 ... ...TRAFFIC
126 - Int'l outgoing telephone (minutes)...........132m 10x6 118113 117 143 160 173 180 159 167153 - Int'l incoming telephone (minutes)...........132mi 10x69 138... 125 160 160 167 162 ... ...279 - Int'l bothway telephone (minutes)............132mb 10x6 256... 242 303 320 340 342 ... ...
STAFF7'292Full-time telecommunication staff..................51 7'3507'425 7'430 7'485 8'397 8'653 7'632 7'695 7'378
QUALITY OF SERVICE27.0Faults per 100 main lines per year................143 % 30.0... 30.0 28.0 30.0 30.0 30.0 ... ...
TARIFFS35Residential teleph. connection charge..........151 3535 35 35 35 35 35 35 3575Business teleph. connection charge..............151b 7575 75 75 75 75 75 75 75
2.50Residential teleph. monthly subscription.......152 2.502.50 2.50 2.50 2.50 2.50 2.50 2.50 2.505.83Business teleph. monthly subscription..........152b 5.835.83 5.83 5.83 5.83 5.83 5.83 5.83 5.83
20Cellular connection charge............................151c 20... 150 20 20 40 40 40 518Cellular monthly subscription.........................152c 8... 8 4 4 4 4 4 4
0.12Cellular - 3-min. local call (peak rate)...........153c 0.12... 0.12 0.12 0.12 0.12 0.12 0.12 0.120.06Cellular - 3-min. local call (off-peak rate).......153co 0.06... 0.06 0.06 0.06 0.06 0.06 0.06 0.06
REVENUE AND EXPENSE72.42Total telecom services revenue.....................75 10x610 79.2067.25 67.42 90.97 99.27 105.13 114.90 194.00 222.00
... - Telephone service revenue......................71 10x6 ...66.45 66.55 ... ... ... ... 103.02 100.13
... - Mobile communication revenue................741 10x6 ...... ... ... ... ... ... 90.30 120.00CAPITAL EXPENDITURE
13.90Annual telecom. investment..........................81 10x6 33.46... ... 75.99 12.50 58.00 126.00 ... ...BROADCASTING
630Television receivers.......................................965 10x311 620610 615 860 875 890 910 930 950...Home satellite antennas................................965s 10x312 ...... ... ... 372 435 498 570 650
INFORMATION TECHNOLOGY95'000Personal computers.......................................422 13 85'00053'000 70'000 125'000 150'000 190'000 230'000 250'000 272'0001'233Internet hosts.................................................4211 14 220— 138 2'920 4'057 6'231 4'069 3'360 3'4373'500Estimated Internet users................................4212 2'600... 1'700 15'000 40'000 60'000 100'000 150'000 200'000
Ministry of Communications, Mobile Telecommunications Company (MTC).Source:(1) Source: UN; 1995-2001: Ministry of Planning. ITU estimate. (2) 1965,1970,1975,1980: UN. 1985,1995, 2000: Ministry of Planning. Other years: ITU estimate. (3) Source: IMF. (4) Source: IMF. (5) Source: IMF. (6) Source: IMF. (7) 2000-01: Estimate. (8) 1995: ITU estimate. (9) 1993, 1996 and 1997: Estimate. (10) 2000-2001: Estimate. (11) Source: Unesco, ITU estimates. (12) 2000-01: Estimate. (13) ITU estimate. (14) Source: Internet Software Consortium.

200120001996 1997 1998 19991995199419931992
Year Ending 31.12
Area: 10'400 km2 National currency: Pound
Indicators Unit
LEBANON
DEMOGRAPHY, ECONOMY3'010Population......................................................61 10x31 2'9102'700 2'810 3'084 3'144 3'191 3'236 3'286 3'350
640Households....................................................62 10x32 619574 598 656 669 679 688 699 71318'317Gross domestic product (GDP).....................63 10x93 15'5239'827 13'137 20'800 22'877 24'639 24'300 24'856 25'189
1'621.40Average annual exchange rate per US$.......652 4 1'680.071'712.79 1'741.04 1'571.44 1'539.45 1'516.13 1'507.84 1'507.50 1'507.50...Telecom equipment exports (US$)................677e 10x6 ...... ... ... ... ... 4 5 4...Telecom equipment imports (US$)................677i 10x6 ...... ... ... ... ... 80 62 49
TELEPHONE NETWORK449Main telephone lines in operation..................112 10x35 437415 426 461 562 566 571 576 626
14.91Main telephone lines per 100 inhabitants......91 15.0315.38 15.16 14.93 17.86 17.74 17.65 17.53 18.69...Residential main lines per 100 households...1111c ...28.9 ... ... ... ... 62.2 ... ...
99.0% digital main lines........................................1142 % 99.075.0 99.0 99.0 99.0 100.0 100.0 100.0 100.0...% residential main lines.................................116 % ...40.0 ... ... ... ... 75.0 ... ......Public payphones...........................................1112 ...170 ... ... ... ... ... ... ......Waiting list for main lines...............................123 10x3 ...240 ... ... ... ... ... ... ...
MOBILE SERVICES120Cellular mobile telephone subscribers..........271 10x36 —— — 198 374 505 627 743 767120 - Digital cellular subscribers........................2712 10x3 —— — 198 374 505 627 743 8003.99Cellular subscribers per 100 inhabitants.......911 —— — 6.42 11.89 15.84 19.38 22.61 22.89
TRAFFIC34 - Int'l outgoing telephone (minutes)...........132m 10x67 2212 15 39 60 70 81 85 93
130 - Int'l incoming telephone (minutes)...........132mi 10x68 96... 75 175 240 300 320 ... ...164 - Int'l bothway telephone (minutes)............132mb 10x6 118... 90 214 300 370 401 ... ...
STAFF3'500Full-time telecommunication staff..................51 9 3'5004'500 4'000 4'000 5'000 5'000 5'700 ... ...
TARIFFS627'000Residential teleph. connection charge..........151 627'000100'000 ... 627'000 627'000 427'000 427'000 427'000 200'000727'000Business teleph. connection charge..............151b 727'000... ... 627'000 627'000 427'000 427'000 427'000 200'000
5'000Residential teleph. monthly subscription.......152 5'0002'000 ... 8'000 8'000 20'000 20'000 20'000 12'0005'000Business teleph. monthly subscription..........152b 5'000... ... 8'000 8'000 20'000 20'000 20'000 20'000
303-minute local call (peak rate).......................153 3030 30 70 70 100 110 110 110303-minute local call (off-peak rate)..................153o 30... ... 40 36 50 55 55 55
770'000Cellular connection charge............................151c 10 —— — 770'000 770'000 758'065 226'175 ... 124'00038'500Cellular monthly subscription.........................152c 11 —— — 38'500 38'500 37'903 22'610 ... 37'525
231Cellular - 3-min. local call (peak rate)...........153c 12 —— — 231 231 364 306 ... 646REVENUE AND EXPENSE
310Total telecom services revenue.....................75 10x9 25080 ... 420 509 660 900 ... ...164 - Mobile communication revenue................741 10x9 —— — 279 473 662 ... ... ...
CAPITAL EXPENDITURE...Annual telecom. investment..........................81 10x9 ...50 ... ... ... ... ... ... ...
BROADCASTING1'075Television receivers.......................................965 10x313 1'035950 995 1'096 1'107 1'120 1'150 1'170 1'195
...Television equipped households...................965h 10x314 ...... ... 550 590 600 620 640 6600.50Cable TV subscribers....................................965c 10x315 ...... ... 1.20 4.50 10.00 19.00 50.00 100.00
...Home satellite antennas................................965s 10x3 ...... ... 40 90 ... 253 275 300INFORMATION TECHNOLOGY
50'000Personal computers.......................................422 16 40'000... ... 75'000 100'000 125'000 150'000 175'000 250'00088Internet hosts.................................................4211 17 —— — 601 1'134 2'358 3'889 — 7'101
2'500Estimated Internet users................................4212 18 ...... ... 5'000 45'000 100'000 200'000 300'000 260'000
Ministère des Postes et des Télécommunications.Source:(1) Source: UN. 1996: census. Other years: ITU estimate. (2) 1996: census.Other years: ITU estimate. (3) Source: IMF. Since 1997: World Bank. (4) Source: IMF. (5) 1982-95, 1998-99: ITU estimate. (6) ITU estimate. (7) 1993: ITU estimate. (8) 1993, 1995-96: ITU estimate. (9) 1992: ITU estimate. (10) From 1999: LibanCell. (11) From 1999: LibanCell. (12) From 1999: LibanCell. (13) Source: Lebanese Broadcasting Corporation International. ITU estimate. (14) ITU estimate. (15) MMDS antennas. (16) Source: Lebanese Broadcasting Corporation International. (17) Source: Internet Software Consortium. Since 1999: RIPE. (18) Source: Lebanese Broadcasting Corporation International.

200120001996 1997 1998 19991995199419931992
Year Ending 31.12
LIBYA
National currency: Dinar
Indicators Unit
Area: 1'759'540 km2
DEMOGRAPHY, ECONOMY5'408Population......................................................61 10x31 5'2224'872 5'044 5'593 5'552 5'511 5'471 5'605 5'580
730Households....................................................62 10x32 705657 681 754 770 790 810 830 ...10'680Gross domestic product (GDP).....................63 10x63 9'9679'541 9'332 12'180 14'149 12'742 14'139 17'395 ...1'245Gross Fixed Capital Formation (GFCF).........64 10x64 1'6221'008 1'504 1'640 1'685 1'397 1'536 2'281 ...0.35Average annual exchange rate per US$.......652 5 0.320.28 0.31 0.36 0.38 0.39 0.46 0.50 0.60
TELEPHONE NETWORK318Main telephone lines in operation..................112 10x36 264236 240 380 400 500 550 605 6105.88Main telephone lines per 100 inhabitants......91 5.064.84 4.76 6.79 7.20 9.07 10.05 10.79 10.93
...Residential main lines per 100 households...1111c ...... ... 40.3 41.6 50.6 54.3 ... ...
...% digital main lines........................................1142 % ...... ... 60.0 65.0 70.0 70.0 ... ...
...% residential main lines.................................116 % ...... ... 80.0 80.0 80.0 80.0 ... ...450Public payphones...........................................1112 ...... ... 450 450 450 450 ... ...
...Waiting list for main lines...............................123 10x3 ...232 ... ... ... ... 80 ... ...MOBILE SERVICES
—Cellular mobile telephone subscribers..........271 7 —— — — 10'000 20'000 30'000 40'000 50'000— - Digital cellular subscribers........................2712 —— — — 10'000 20'000 30'000 40'000 50'000—Cellular subscribers per 100 inhabitants.......911 —— — — 0.18 0.36 0.55 0.71 0.90
OTHER SERVICES2'608Telex subscribers...........................................311 2'6702'619 2'720 2'608 ... ... ... ... ...
TRAFFIC2'333 - Int'l outgoing telephone (calls).................132c 10x3 2'1211'676 1'928 ... ... ... ... ... ...
46'655 - Int'l outgoing telephone (minutes)...........132m 10x38 42'41333'528 38'557 35'500 43'000 43'000 43'000 43'000 45'20013'000 - Int'l incoming telephone (minutes)...........132mi 10x3 15'000... 17'000 25'000 24'500 ... ... ... ...59'655 - Int'l bothway telephone (minutes)............132mb 10x3 57'413... 55'557 60'500 67'500 ... ... ... ...
STAFF10'000Full-time telecommunication staff..................51 9 ...8'886 ... 12'000 13'000 14'000 14'000 14'000 ...
QUALITY OF SERVICE...Faults per 100 main lines per year................143 % ...230.0 ... ... ... ... ... ... ...
TARIFFS45Residential teleph. connection charge..........151 4545 45 45 ... ... ... ... ...
200Business teleph. connection charge..............151b 200... ... 200 ... ... ... ... ...1.67Residential teleph. monthly subscription.......152 1.671.67 1.67 1.67 ... ... ... ... ...
16.66Business teleph. monthly subscription..........152b 16.66... ... 16.66 ... ... ... ... ...0.013-minute local call (peak rate).......................153 0.010.01 0.01 0.01 ... ... ... ... ...
REVENUE AND EXPENSE...Total telecom services revenue.....................75 10x6 ...79.75 ... 85.00 ... ... ... ... ...
CAPITAL EXPENDITURE...Annual telecom. investment..........................81 10x6 ...60.00 ... 40.00 ... ... ... ... ...
BROADCASTING550Television receivers.......................................965 10x310 525485 504 680 730 750 760 770 ...
...Home satellite antennas................................965s 10x311 ...... ... 7 ... ... ... ... ...INFORMATION TECHNOLOGY
—Internet hosts.................................................4211 12 —— — — 1 4 3 29 70...Estimated Internet users................................4212 ...... ... ... ... ... 7'000 10'000 20'000
General Post and Telecommunication Company (GDPT).Source:(1) Source: UN; ITU estimate. (2) ITU estimate. (3) Source: IMF. (4) Source: IMF. (5) Source: IMF. (6) 1990, 99-2000: Estimate. (7) 1997: ITU estimate. (8) 1983-84: Estimate. (9) 1983-84: Estimate. (10) Source: ITU estimates, GPTC. (11) Source: 1996: GPTC. (12) Source: Internet Software Consortium.
200120001996 1997 1998 19991995199419931992
Year Ending 31.12
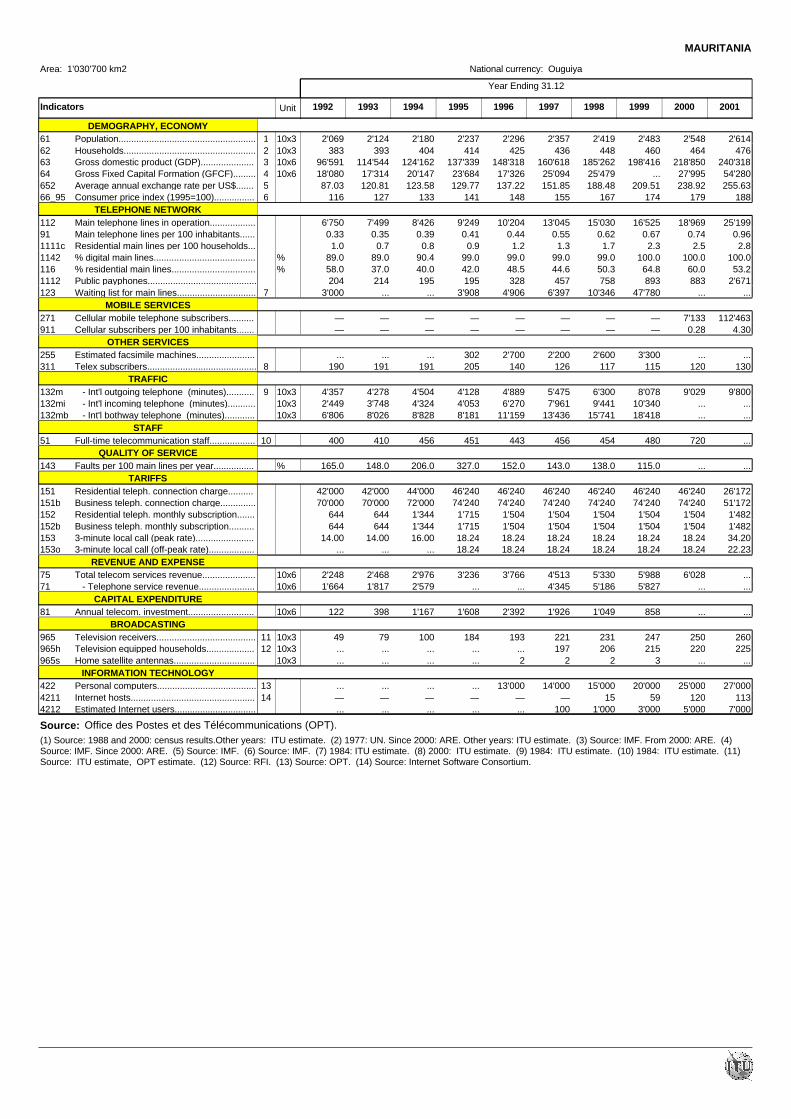
Area: 1'030'700 km2 National currency: Ouguiya
Indicators Unit
MAURITANIA
DEMOGRAPHY, ECONOMY2'237Population......................................................61 10x31 2'1802'069 2'124 2'296 2'357 2'419 2'483 2'548 2'614
414Households....................................................62 10x32 404383 393 425 436 448 460 464 476137'339Gross domestic product (GDP).....................63 10x63 124'16296'591 114'544 148'318 160'618 185'262 198'416 218'850 240'31823'684Gross Fixed Capital Formation (GFCF).........64 10x64 20'14718'080 17'314 17'326 25'094 25'479 ... 27'995 54'280129.77Average annual exchange rate per US$.......652 5 123.5887.03 120.81 137.22 151.85 188.48 209.51 238.92 255.63
141Consumer price index (1995=100)................66_95 6 133116 127 148 155 167 174 179 188TELEPHONE NETWORK
9'249Main telephone lines in operation..................112 8'4266'750 7'499 10'204 13'045 15'030 16'525 18'969 25'1990.41Main telephone lines per 100 inhabitants......91 0.390.33 0.35 0.44 0.55 0.62 0.67 0.74 0.960.9Residential main lines per 100 households...1111c 0.81.0 0.7 1.2 1.3 1.7 2.3 2.5 2.8
99.0% digital main lines........................................1142 % 90.489.0 89.0 99.0 99.0 99.0 100.0 100.0 100.042.0% residential main lines.................................116 % 40.058.0 37.0 48.5 44.6 50.3 64.8 60.0 53.2195Public payphones...........................................1112 195204 214 328 457 758 893 883 2'671
3'908Waiting list for main lines...............................123 7 ...3'000 ... 4'906 6'397 10'346 47'780 ... ...MOBILE SERVICES
—Cellular mobile telephone subscribers..........271 —— — — — — — 7'133 112'463—Cellular subscribers per 100 inhabitants.......911 —— — — — — — 0.28 4.30
OTHER SERVICES302Estimated facsimile machines.......................255 ...... ... 2'700 2'200 2'600 3'300 ... ...205Telex subscribers...........................................311 8 191190 191 140 126 117 115 120 130
TRAFFIC4'128 - Int'l outgoing telephone (minutes)...........132m 10x39 4'5044'357 4'278 4'889 5'475 6'300 8'078 9'029 9'8004'053 - Int'l incoming telephone (minutes)...........132mi 10x3 4'3242'449 3'748 6'270 7'961 9'441 10'340 ... ...8'181 - Int'l bothway telephone (minutes)............132mb 10x3 8'8286'806 8'026 11'159 13'436 15'741 18'418 ... ...
STAFF451Full-time telecommunication staff..................51 10 456400 410 443 456 454 480 720 ...
QUALITY OF SERVICE327.0Faults per 100 main lines per year................143 % 206.0165.0 148.0 152.0 143.0 138.0 115.0 ... ...
TARIFFS46'240Residential teleph. connection charge..........151 44'00042'000 42'000 46'240 46'240 46'240 46'240 46'240 26'17274'240Business teleph. connection charge..............151b 72'00070'000 70'000 74'240 74'240 74'240 74'240 74'240 51'1721'715Residential teleph. monthly subscription.......152 1'344644 644 1'504 1'504 1'504 1'504 1'504 1'4821'715Business teleph. monthly subscription..........152b 1'344644 644 1'504 1'504 1'504 1'504 1'504 1'48218.243-minute local call (peak rate).......................153 16.0014.00 14.00 18.24 18.24 18.24 18.24 18.24 34.2018.243-minute local call (off-peak rate)..................153o ...... ... 18.24 18.24 18.24 18.24 18.24 22.23
REVENUE AND EXPENSE3'236Total telecom services revenue.....................75 10x6 2'9762'248 2'468 3'766 4'513 5'330 5'988 6'028 ...
... - Telephone service revenue......................71 10x6 2'5791'664 1'817 ... 4'345 5'186 5'827 ... ...CAPITAL EXPENDITURE
1'608Annual telecom. investment..........................81 10x6 1'167122 398 2'392 1'926 1'049 858 ... ...BROADCASTING
184Television receivers.......................................965 10x311 10049 79 193 221 231 247 250 260...Television equipped households...................965h 10x312 ...... ... ... 197 206 215 220 225...Home satellite antennas................................965s 10x3 ...... ... 2 2 2 3 ... ...
INFORMATION TECHNOLOGY...Personal computers.......................................422 13 ...... ... 13'000 14'000 15'000 20'000 25'000 27'000—Internet hosts.................................................4211 14 —— — — — 15 59 120 113...Estimated Internet users................................4212 ...... ... ... 100 1'000 3'000 5'000 7'000
Office des Postes et des Télécommunications (OPT).Source:(1) Source: 1988 and 2000: census results.Other years: ITU estimate. (2) 1977: UN. Since 2000: ARE. Other years: ITU estimate. (3) Source: IMF. From 2000: ARE. (4) Source: IMF. Since 2000: ARE. (5) Source: IMF. (6) Source: IMF. (7) 1984: ITU estimate. (8) 2000: ITU estimate. (9) 1984: ITU estimate. (10) 1984: ITU estimate. (11) Source: ITU estimate, OPT estimate. (12) Source: RFI. (13) Source: OPT. (14) Source: Internet Software Consortium.

200120001996 1997 1998 19991995199419931992
Year Ending 31.12
MOROCCO
National currency: Dirham
Indicators Unit
Area: 659'970 km2
DEMOGRAPHY, ECONOMY26'621Population......................................................61 10x31 26'07425'547 26'069 27'170 27'518 27'692 27'867 28'705 29'1704'565Households....................................................62 10x32 4'4724'258 4'383 4'600 4'790 4'900 5'072 5'211 5'354
281'700Gross domestic product (GDP).....................63 10x63 279'322242'910 249'223 319'340 318'340 344'000 345'590 354'070 382'90060'390Gross Fixed Capital Formation (GFCF).........64 10x64 57'50054'360 56'720 61'940 65'790 75'740 81'900 85'310 85'260
8.54Average annual exchange rate per US$.......652 5 9.208.54 9.30 8.72 9.53 9.60 9.80 10.63 11.30100Consumer price index (1995=100)................66_95 6 9485 90 103 104 107 108 110 110
...Telecom equipment exports (US$)................677e 10x6 ...... ... ... ... ... 1 ... ...75Telecom equipment imports (US$)................677i 10x6 117137 69 72 50 ... 172 611 ...
TELEPHONE NETWORK1'128Main telephone lines in operation..................112 10x3 1'007654 827 1'208 1'301 1'393 1'471 1'425 1'1914.24Main telephone lines per 100 inhabitants......91 3.862.56 3.17 4.45 4.73 5.03 5.28 4.96 4.0819.2Residential main lines per 100 households...1111c 17.311.4 14.3 20.5 21.4 22.5 22.6 21.1 ...95.0% digital main lines........................................1142 % 93.088.3 90.2 98.3 99.3 99.5 100.0 100.0 100.077.7% residential main lines.................................116 % 76.874.0 75.9 78.1 79.0 79.0 78.0 77.0 ...
17'966Public payphones...........................................1112 7 9'8904'423 6'306 23'876 28'515 31'617 38'845 46'843 ...93Waiting list for main lines...............................123 10x3 104135 108 48 29 18 14 5 ...
MOBILE SERVICES30Cellular mobile telephone subscribers..........271 10x3 143 7 43 74 117 369 2'342 4'77220 - Digital cellular subscribers........................2712 10x3 5— — 33 68 111 364 2'342 4'772
0.11Cellular subscribers per 100 inhabitants.......911 0.050.01 0.03 0.16 0.27 0.42 1.32 8.16 16.36—Radio paging subscribers..............................275 8 —— — ... ... 3'889 6'789 4'414 ...
OTHER SERVICES—ISDN subscribers...........................................28 9 —— — 38 216 612 2'397 6'728 10'000—ISDN B channel equivalents..........................28c —— — ... ... ... 5'144 26'728 ...
TRAFFIC130 - Int'l outgoing telephone (minutes)...........132m 10x6 130103 125 129 150 181 220 245 270265 - Int'l incoming telephone (minutes)...........132mi 10x6 235147 193 287 364 467 ... ... ...394 - Int'l bothway telephone (minutes)............132mb 10x6 365249 318 416 514 648 ... ... ...
3'308 - Total national telephone (pulses)............131p 10x6 3'136... 3'178 3'543 3'855 ... ... ... ......Total telephone (pulses)...............................133p 10x6 ...... ... 5'592 5'375 ... ... ... ...
STAFF14'626Full-time telecommunication staff..................51 13'39611'484 12'632 14'772 14'208 14'150 14'068 14'511 16'200
QUALITY OF SERVICE49.0Faults per 100 main lines per year................143 % 63.084.3 67.0 55.0 46.0 37.0 32.0 24.8 ...
TARIFFS340Residential teleph. connection charge..........151 10 340300 340 340 600 600 600 600 600340Business teleph. connection charge..............151b 11 340300 340 340 700 700 1'200 1'200 1'20053Residential teleph. monthly subscription.......152 12 3020 30 53 60 65 65 65 7853Business teleph. monthly subscription..........152b 13 3020 30 53 70 80 90 108 108
0.803-minute local call (peak rate).......................153 14 0.800.75 0.80 0.96 0.96 0.96 0.96 0.96 1.62...3-minute local call (off-peak rate)..................153o ...... ... ... ... ... ... ... 1.33
1'400Cellular connection charge............................151c 15 1'400... 1'400 800 600 600 200 120 120250Cellular monthly subscription.........................152c 16 400... 400 200 200 200 180 150 150
12.00Cellular - 3-min. local call (peak rate)...........153c 17 16.00... 16.00 12.00 9.60 9.60 7.20 7.20 7.20...Cellular - 3-min. local call (off-peak rate).......153co ...... ... ... ... ... 3.60 3.60 3.60
REVENUE AND EXPENSE5'631Total telecom services revenue.....................75 10x6 5'0614'814 4'655 6'062 6'509 7'426 8'505 12'000 16'0004'576 - Telephone service revenue......................71 10x6 4'2053'730 4'487 4'896 5'185 5'334 5'473 ... 6'000
... - Mobile communication revenue................741 10x6 ...40 84 ... ... ... 1'253 3'000 6'000CAPITAL EXPENDITURE
2'668Annual telecom. investment..........................81 10x618 2'4762'200 1'801 1'723 1'362 1'264 2'326 2'350 ...BROADCASTING
4'096Television receivers.......................................965 10x319 3'9513'757 3'891 4'245 4'368 4'466 4'568 4'784 4'8623'500Television equipped households...................965h 10x320 3'4802'700 3'100 3'500 3'600 3'700 3'900 4'000 4'100
529Home satellite antennas................................965s 10x321 403... ... 715 901 930 771 780 800INFORMATION TECHNOLOGY
85'000Personal computers.......................................422 22 70'000... 60'000 100'000 130'000 200'000 300'000 350'000 400'000229Internet hosts.................................................4211 23 —— — 468 1'405 2'045 2'034 1'858 2'454
1'000Estimated Internet users................................4212 24 ...... ... 1'552 6'000 40'000 50'000 200'000 400'000
Office National des Postes et Télécommunications (ONPT).Source:(1) Source: UN; Direction de la Statistique; ITU estimate. 1994: Latest census. (2) 1982: UN. 2000 and 2001: Direction de la Statistique. Other years: ITU estimate. (3) Source: IMF. (4) Source: IMF. (5) Source: IMF. (6) Source: IMF. (7) Including public call offices and privately-operated telephone centres. (8) Service opens in 1995. (9) 2001: ARNT estimate. (10) Excluding TVA 19 %. (11) Excluding TVA 19 %. (12) Excluding TVA 19 %. (13) Excluding TVA 19 %. (14) Excluding TVA 19 %. (15) Network access cost 600 DH, technical reception costs 400 DH (if terminal has been bought in private sector), programming costs 400 DH. Excluding TVA 19 %. (16) Excluding TVA 19 %. (17) UT = 0.80 DH. Excluding TVA 19 %. (18) Investments from ONPT. (19) Source: Ministry of Communication and ITU estimate. (20) Source: 1994: Eutelsat estimate of TV households. From 1999: ONE. (21) Source: Eutelsat; ITU estimate. From 1999: Radiodiffusion Télévision Marocaine. (22) Source: ITU estimate. (23) Source: RIPE. (24) Source: 1996: ONPT.
200120001996 1997 1998 19991995199419931992
Year Ending 31.12
Area: 271'950 km2 National currency: Rial Omani
Indicators Unit
OMAN
DEMOGRAPHY, ECONOMY2'159Population......................................................61 10x31 2'0891'905 2'018 2'302 2'342 2'382 2'460 2'538 2'623
292Households....................................................62 10x32 290300 287 326 330 340 350 359 3715'307Gross domestic product (GDP).....................63 10x63 4'9674'788 4'804 5'874 6'090 5'416 6'041 7'639 7'668
795Gross Fixed Capital Formation (GFCF).........64 10x64 782783 842 994 1'482 ... ... ... ...0.38Average annual exchange rate per US$.......652 5 0.380.38 0.38 0.38 0.38 0.38 0.38 0.38 0.38100Consumer price index (1995=100)................66_95 101101 102 100 100 99 100 99 9844Telecom equipment imports (US$)................677i 10x6 25... 23 54 65 44 67 44 122
TELEPHONE NETWORK169'939Main telephone lines in operation..................112 6 157'840130'107 147'784 197'687 200'557 219'956 220'373 225'436 235'307
7.87Main telephone lines per 100 inhabitants......91 7.566.83 7.32 8.59 8.56 9.23 8.96 8.88 8.9744.7Residential main lines per 100 households...1111c 42.535.6 41.2 ... ... ... ... ... ...99.0% digital main lines........................................1142 % 99.796.3 97.7 99.0 100.0 100.0 100.0 100.0 100.077.0% residential main lines.................................116 % 78.082.0 80.0 ... ... ... ... ... ...
3'495Public payphones...........................................1112 3'1961'905 2'226 3'642 3'736 ... ... ... 4'8413'099Waiting list for main lines...............................123 2'6064'787 2'916 3'258 3'915 ... ... ... ...
MOBILE SERVICES8'052Cellular mobile telephone subscribers..........271 6'7514'721 5'616 12'934 59'822 103'032 124'119 164'348 324'540
— - Digital cellular subscribers........................2712 —— — 4'692 53'318 ... ... ... 201'0000.37Cellular subscribers per 100 inhabitants.......911 0.320.25 0.28 0.56 2.55 4.33 5.04 6.48 12.37
51'546Radio paging subscribers..............................275 35'90711'333 21'856 ... 71'034 ... ... ... ...OTHER SERVICES
2'889Estimated facsimile machines.......................255 2'6832'212 2'512 5'778 6'356 ... ... ... ...647Telex subscribers...........................................311 7 722892 821 566 817 ... ... ... ...
TRAFFIC54 - Int'l outgoing telephone (minutes)...........132m 10x6 5039 45 63 74 93 102 117 15954 - Int'l incoming telephone (minutes)...........132mi 10x6 5041 47 58 71 72 83 ... 108
108 - Int'l bothway telephone (minutes)............132mb 10x6 10080 92 121 145 168 185 ... 267STAFF
2'454Full-time telecommunication staff..................51 2'4362'296 2'446 2'151 2'108 2'100 2'070 2'061 2'050QUALITY OF SERVICE
8.0Faults per 100 main lines per year................143 %8 8.812.0 10.0 1.8 ... ... ... ... ...TARIFFS
10Residential teleph. connection charge..........151 1010 10 10 10 10 10 10 1010Business teleph. connection charge..............151b 1010 10 10 10 10 10 10 10
4.00Residential teleph. monthly subscription.......152 4.004.00 4.00 4.00 4.00 4.00 3.00 3.00 3.004.00Business teleph. monthly subscription..........152b 4.004.00 4.00 4.00 4.00 4.00 3.00 3.00 3.000.033-minute local call (peak rate).......................153 0.080.03 0.08 0.03 0.03 0.03 0.03 0.03 0.03
50Cellular connection charge............................151c 50... 50 10 10 10 10 10 106Cellular monthly subscription.........................152c 21... 21 6 6 6 6 4 4
0.08Cellular - 3-min. local call (peak rate)...........153c 0.25... 0.25 0.08 0.08 0.08 0.75 0.75 0.75REVENUE AND EXPENSE
82Total telecom services revenue.....................75 10x6 7668 71 89 106 135 141 149 16373 - Telephone service revenue......................71 10x6 6765 63 78 85 ... ... ... ...5 - Mobile communication revenue................741 10x6 42 3 ... ... ... ... ... ...
CAPITAL EXPENDITURE16Annual telecom. investment..........................81 10x6 613 40 30 22 ... ... ... ...
BROADCASTING1'303Television receivers.......................................965 10x39 1'3021'195 1'300 1'361 1'395 1'400 1'415 1'430 1'445
100Home satellite antennas................................965s 10x3 30... ... 155 200 ... ... ... ...INFORMATION TECHNOLOGY
20'000Personal computers.......................................422 17'0006'000 16'000 25'000 35'000 50'000 65'000 80'000 85'000—Internet hosts.................................................4211 10 —— — — 670 664 678 714 4'678...Estimated Internet users................................4212 ...... ... — 10'000 20'000 50'000 90'000 120'000
Oman Telecommunications Company.Source:(1) Source: UN; 1993: Latest census. (2) 1994: Ministry. 2000: UNCHS. Other years: ITU estimate. (3) Source: IMF. (4) Source: IMF. (5) Source: IMF. (6) 2002: Estimate. (7) 1978: Estimate. (8) 1991: Yearly estimate from monthly data. (9) Source: Unesco. (10) Source: Internet Software Consortium.

200120001996 1997 1998 19991995199419931992
Year Ending 31.12
PALESTINE
National currency: Jordan Dinar
Indicators Unit
Area: 6'020 km2
DEMOGRAPHY, ECONOMY2'316Population......................................................61 10x31 2'1161'767 1'934 2'535 2'783 2'897 3'020 3'150 3'299
...Households....................................................62 10x3 ...... ... 331 360 380 400 425 4450.70Average annual exchange rate per US$.......652 0.70... 0.69 0.70 0.70 0.70 0.70 0.71 0.71
TELEPHONE NETWORK80'000Main telephone lines in operation..................112 2 78'40073'000 75'000 83'381 110'893 167'271 222'198 272'212 292'022
3.45Main telephone lines per 100 inhabitants......91 3.704.13 3.88 3.29 3.98 5.77 7.36 8.64 8.8522.7% households with a telephone.....................1111 ...... ... ... ... ... ... ... ...
...Residential main lines per 100 households...1111c ...... ... ... ... ... ... 53.0 ...
...% digital main lines........................................1142 % 75.0... ... 88.0 100.0 100.0 100.0 100.0 100.0
...% residential main lines.................................116 % ...... ... ... ... ... ... 82.8 ...
...Public payphones...........................................1112 ...... ... 1'630 2'250 2'655 2'031 ... ...
...Waiting list for main lines...............................123 61'262... ... 206'000 182'866 156'248 38'750 14'488 2'351MOBILE SERVICES
20'000Cellular mobile telephone subscribers..........271 3 —— — 25'000 40'000 100'000 117'000 175'941 300'0000.86Cellular subscribers per 100 inhabitants.......911 —— — 0.99 1.44 3.45 3.87 5.59 9.09
OTHER SERVICES...Estimated facsimile machines.......................255 ...... ... 15'000 18'000 ... ... ... ...—ISDN subscribers...........................................28 —... ... — — — — 176 424—ISDN B channel equivalents..........................28c 4 —... ... — — — — 352 848
TRAFFIC... - Total national telephone (calls)...............131c 10x6 ...... ... ... 150 208 ... ... ...... - Local telephone (calls)..........................1311c 10x6 ...... ... ... 119 166 ... ... ...... - National trunk telephone (calls)............1312c 10x6 ...... ... ... 31 42 ... ... ...... - Int'l outgoing telephone (calls).................132c 10x6 ...... ... ... 6 7 ... ... ...... - Total national telephone (minutes)..........131m 10x6 ...... ... ... 324 474 ... ... ...... - Local telephone (minutes)....................1311m 10x6 ...... ... ... 240 354 ... 728 ...... - National trunk telephone (minutes)......1312m 10x6 ...... ... ... 83 120 ... 171 ...... - Int'l outgoing telephone (minutes)...........132m 10x6 ...... ... 18 22 28 35 46 45... - Int'l incoming telephone (minutes)...........132mi 10x6 ...... ... 26 24 17 ... 37 48... - Int'l bothway telephone (minutes)............132mb 10x6 ...... ... 44 46 44 ... 83 93
STAFF560Full-time telecommunication staff..................51 406... ... 580 846 1'382 1'972 1'701 1'661
QUALITY OF SERVICE...Faults per 100 main lines per year................143 % ...... ... ... 78.8 72.3 ... ... ...
TARIFFS...Residential teleph. connection charge..........151 ...... ... 497.00 99.60 99.60 87.37 84.50 84.50...Business teleph. connection charge..............151b ...... ... 497.00 99.60 150.00 131.58 127.28 127.28...Residential teleph. monthly subscription.......152 ...... ... 20.30 6.00 6.00 5.26 4.24 4.24...Business teleph. monthly subscription..........152b ...... ... 20.30 6.00 6.00 5.26 4.24 4.24...3-minute local call (peak rate).......................153 ...... ... ... 0.04 0.03 0.04 0.04 0.04...3-minute local call (off-peak rate)..................153o ...... ... 3.19 0.01 0.01 0.02 0.02 0.02—Cellular connection charge............................151c 5 —— — ... ... ... 21 ... ...—Cellular monthly subscription.........................152c 6 —— — ... ... ... 11 ... ...—Cellular - 3-min. local call (peak rate)...........153c —— — ... ... ... 0.36 ... ...—Cellular - 3-min. local call (off-peak rate).......153co —— — ... ... ... 0.27 ... ...
REVENUE AND EXPENSE7.00Total telecom services revenue.....................75 10x6 ...... ... 19.85 27.36 36.19 47.00 69.25 73.28
... - Telephone service revenue......................71 10x6 ...... ... ... ... ... ... 58.15 58.82CAPITAL EXPENDITURE
...Annual telecom. investment..........................81 10x6 ...... ... ... 10.94 34.32 39.50 31.99 23.82BROADCASTING
...Television receivers.......................................965 10x37 ...... ... ... ... ... ... 427 478
...Home satellite antennas................................965s 10x38 ...... ... ... ... ... ... 214 260INFORMATION TECHNOLOGY
...Estimated Internet users................................4212 10x3 ...... ... ... ... ... ... 35 60
Palestine Telecommunications Company (PALTEL).Source:(1) 1997-2001: PCBS. (2) 1993: Estimate. (3) Users use Israel cellular network. 1998-1999: ESIS. 2000: Palestinian Bureau of Statistics. (4) 2000: Estimate. (5) 1999: Not including 17% tax. (6) 1999: Not including 17% tax. (7) Source: ESIS. Based on PCBS survey. (8) Source: ESIS. Based on PCBS survey. Home equipped.
200120001996 1997 1998 19991995199419931992
Year Ending 31.12
Area: 11'437 km2 National currency: Riyal
Indicators Unit
QATAR
DEMOGRAPHY, ECONOMY551Population......................................................61 10x31 537510 524 558 569 579 589 598 61079Households....................................................62 10x32 7773 75 80 82 83 85 86 87
29'662Gross domestic product (GDP).....................63 10x63 26'84327'832 26'050 32'976 41'124 37'330 44'397 59'893 58'7948'895Gross Fixed Capital Formation (GFCF).........64 10x64 6'5755'159 4'849 11'532 12'594 ... ... ... ...3.64Average annual exchange rate per US$.......652 5 3.643.64 3.64 3.64 3.64 3.64 3.64 3.64 3.64100Consumer price index (1995=100)................66_95 6 9797 96 107 110 113 116 118 119
TELEPHONE NETWORK122'701Main telephone lines in operation..................112 115'766105'527 110'300 133'513 141'902 150'508 154'904 160'191 167'446
22.27Main telephone lines per 100 inhabitants......91 21.5520.68 21.07 23.93 24.94 25.99 26.29 26.77 27.45116.5Residential main lines per 100 households...1111c 115.8111.3 113.2 123.5 128.1 128.7 130.2 132.3 139.9100.0% digital main lines........................................1142 % 100.094.0 100.0 100.0 100.0 100.0 100.0 100.0 100.075.0% residential main lines.................................116 % 77.077.0 77.0 74.0 74.0 71.0 71.0 71.0 73.0586Public payphones...........................................1112 446129 237 661 693 739 767 815 910
MOBILE SERVICES18'469Cellular mobile telephone subscribers..........271 11'5334'233 4'289 28'772 43'476 65'756 84'365 120'856 178'78914'226 - Digital cellular subscribers........................2712 7'243— — 24'513 39'390 62'120 81'314 119'460 177'929
3.35Cellular subscribers per 100 inhabitants.......911 2.150.83 0.82 5.16 7.64 11.36 14.32 20.19 29.3145'704Radio paging subscribers..............................275 43'21625'144 35'631 57'577 66'877 71'675 71'913 67'128 55'101
OTHER SERVICES96ISDN subscribers...........................................28 84— — 92 79 169 420 651 968
192ISDN B channel equivalents..........................28c 168— — 184 158 338 5'572 7'686 11'820TRAFFIC
635 - Total national telephone (calls)...............131c 10x6 599396 564 713 784 788 820 831 820... - Local telephone (calls)..........................1311c 10x6 ...... ... ... 523 525 547 554 546... - National trunk telephone (calls)............1312c 10x6 ...... ... ... 261 263 273 277 273
19 - Int'l outgoing telephone (calls).................132c 10x6 16... 14 22 28 33 38 44 5814 - Int'l incoming telephone (calls)................132ci 10x6 13... 11 16 18 23 25 29 36... - Total national telephone (minutes)..........131m 10x6 ...... ... ... 1'866 2'080 2'214 2'324 2'459... - Local telephone (minutes)....................1311m 10x6 ...... ... ... 1'188 1'387 1'505 1'549 1'639... - National trunk telephone (minutes)......1312m 10x6 ...... ... ... 679 693 708 774 820
76 - Int'l outgoing telephone (minutes)...........132m 10x6 6352 58 84 101 119 128 143 17350 - Int'l incoming telephone (minutes)...........132mi 10x6 45... 40 66 59 74 82 95 113
STAFF1'560Full-time telecommunication staff..................51 1'5371'463 1'480 1'619 1'659 1'714 1'707 1'659 1'728
QUALITY OF SERVICE16.4Faults per 100 main lines per year................143 % 25.821.3 41.2 ... 15.5 14.0 12.5 13.0 12.9
TARIFFS200Residential teleph. connection charge..........151 200300 300 200 200 200 200 200 200200Business teleph. connection charge..............151b 200300 300 200 200 200 200 200 20033Residential teleph. monthly subscription.......152 3333 33 33 33 33 33 33 33
117Business teleph. monthly subscription..........152b 117117 117 117 117 117 117 117 117600Cellular connection charge............................151c 600... ... 600 600 500 500 500 50060Cellular monthly subscription.........................152c 60... ... 60 60 50 50 50 50
1.80Cellular - 3-min. local call (peak rate)...........153c 1.80... ... 1.80 1.80 1.35 1.35 1.35 1.35...Cellular - 3-min. local call (off-peak rate).......153co ...... ... ... ... 0.90 0.90 0.90 0.90
REVENUE AND EXPENSE603Total telecom services revenue.....................75 10x6 571597 632 706 992 1'096 1'185 1'256 1'456439 - Telephone service revenue......................71 10x6 435369 397 502 740 834 849 855 91270 - Mobile communication revenue................741 10x6 48... 31 102 160 193 237 289 419
CAPITAL EXPENDITURE79Annual telecom. investment..........................81 10x6 13692 153 ... 161 228 166 136 191
BROADCASTING252Television receivers.......................................965 10x37 230208 220 300 460 490 510 520 53066Television equipped households...................965h 10x3 65... 63 67 69 70 71 73 7516Cable TV subscribers....................................965c 10x38 15... 4 23 28 32 37 37 34
INFORMATION TECHNOLOGY30'000Personal computers.......................................422 25'000... ... 35'000 60'000 70'000 80'000 90'000 100'000
—Internet hosts.................................................4211 9 —— — 21 189 13 1'069 2'255 1271'000Estimated Internet users................................4212 ...... ... 5'000 17'000 20'000 24'000 30'000 40'000
Qatar Public Telecommunication Corporation (Q-TEL).Source:(1) Source: UN; ITU estimate. (2) 1986: UN. Other years: ITU estimate. (3) Source: IMF. (4) Source: IMF. (5) Source: IMF. (6) Source: IMF. (7) Source: QTEL. (8) Source: QTEL. (9) Source: Internet Software Consortium. Since 1999: RIPE.

200120001996 1997 1998 19991995199419931992
Year Ending 31.12
SAUDI ARABIA
National currency: Riyal
Indicators Unit
Area: 2'400'900 km2
DEMOGRAPHY, ECONOMY18'250Population......................................................61 10x31 17'76016'929 17'350 18'836 19'494 20'181 20'899 21'607 22'3222'640Households....................................................62 10x32 2'7002'602 2'703 2'780 2'880 2'980 3'080 3'196 3'320
478'652Gross domestic product (GDP).....................63 10x63 450'025461'400 443'842 590'749 617'902 546'648 603'589 706'757 698'40393'555Gross Fixed Capital Formation (GFCF).........64 10x64 84'20793'980 98'450 102'848 109'241 112'959 118'196 123'324 126'609
3.75Average annual exchange rate per US$.......652 5 3.753.75 3.75 3.75 3.75 3.75 3.75 3.75 3.75100Consumer price index (1995=100)................66_95 6 9594 95 101 101 101 99 99 98
...Telecom equipment imports (US$)................677i 10x6 211213 243 364 ... 416 551 383 ...TELEPHONE NETWORK
1'719Main telephone lines in operation..................112 10x3 1'6761'568 1'615 1'796 1'877 2'167 2'706 2'965 3'2339.42Main telephone lines per 100 inhabitants......91 9.439.26 9.31 9.54 9.63 10.74 12.95 13.72 14.48
...% households with a telephone.....................1111 ...... ... ... ... ... ... 61.0 68.046.9Residential main lines per 100 households...1111c 44.744.0 43.6 46.5 51.5 52.4 55.4 58.4 62.353.6% digital main lines........................................1142 % 53.046.0 51.0 54.5 55.5 63.6 93.0 100.0 100.072.0% residential main lines.................................116 %7 72.073.0 73.0 72.0 79.0 72.0 63.0 63.0 64.015.6Public payphones...........................................1112 10x3 7.57.2 7.3 16.8 34.4 42.5 43.9 49.3 57.5
1'262Waiting list for main lines...............................123 10x38 1'1901'048 1'044 1'188 1'409 927 511 206 86MOBILE SERVICES
16Cellular mobile telephone subscribers..........271 10x3 1616 16 191 332 627 837 1'376 2'529— - Digital cellular subscribers........................2712 10x3 —— — 175 316 612 837 1'376 2'529
0.09Cellular subscribers per 100 inhabitants.......911 0.090.09 0.09 1.01 1.70 3.11 4.00 6.37 11.33191Radio paging subscribers..............................275 10x3 18767 186 502 ... 771 781 600 514
OTHER SERVICES6'812Telex subscribers...........................................311 7'7769'395 8'513 5'868 5'278 4'745 ... ... ...
TRAFFIC838 - National trunk telephone (calls)............1312c 10x6 807499 599 1'043 1'338 1'365 1'663 1'758 ...
... - Local telephone (minutes)....................1311m 10x69 ...... ... ... ... 20'139 22'362 25'112 28'367
... - Mobile national (minutes).........................131wm 10x6 ...... ... ... ... ... 1'327 2'386 5'630537 - Int'l outgoing telephone (minutes)...........132m 10x6 477424 455 584 660 933 1'005 1'117 1'517360 - Int'l incoming telephone (minutes)...........132mi 10x610 340... 295 400 445 531 670 683 705897 - Int'l bothway telephone (minutes)............132mb 10x6 817... 750 984 1'105 1'464 1'675 1'800 2'222
STAFF20'503Full-time telecommunication staff..................51 20'76020'605 20'435 19'231 19'964 22'063 20'977 22'973 23'483
QUALITY OF SERVICE...Faults per 100 main lines per year................143 % ...... ... 2.0 2.2 2.8 2.4 2.0 2.0
TARIFFS500Residential teleph. connection charge..........151 300300 300 500 500 500 500 500 500500Business teleph. connection charge..............151b 300300 300 500 500 500 500 500 500
30.00Residential teleph. monthly subscription.......152 11 12.5012.50 12.50 30.00 30.00 30.00 30.00 30.00 30.0030.00Business teleph. monthly subscription..........152b 12 12.5012.50 12.50 30.00 30.00 30.00 30.00 30.00 30.000.073-minute local call (peak rate).......................153 0.050.05 0.05 0.08 0.07 0.06 0.06 0.13 0.13
50'300Cellular connection charge............................151c 50'30050'300 50'300 3'500 3'500 3'500 3'500 1'500 800430Cellular monthly subscription.........................152c 430430 430 60 60 60 60 60 600.15Cellular - 3-min. local call (peak rate)...........153c 0.150.15 0.15 4.80 4.80 4.50 4.50 3.60 2.850.15Cellular - 3-min. local call (off-peak rate).......153co 0.150.15 0.15 3.60 3.60 2.25 2.25 2.25 1.50
REVENUE AND EXPENSE6'793Total telecom services revenue.....................75 10x6 6'6286'865 6'348 7'892 9'650 12'701 14'437 16'930 19'7816'634 - Telephone service revenue......................71 10x6 6'4506'366 6'144 7'750 ... ... 9'617 11'020 10'905
115 - Mobile communication revenue................741 10x613 10752 72 168 ... ... 4'182 5'075 7'990CAPITAL EXPENDITURE
374Annual telecom. investment..........................81 10x6 551533 448 ... ... ... 8'316 5'742 5'230BROADCASTING
4'700Television receivers.......................................965 10x314 4'4554'260 4'370 4'900 5'100 5'300 5'500 5'700 5'9072'186Television equipped households...................965h 10x3 2'001... ... 2'388 2'609 2'832 3'054 3'187 3'205
502Home satellite antennas................................965s 10x3 310... ... 812 1'315 1'615 1'914 1'986 2'061INFORMATION TECHNOLOGY
650'000Personal computers.......................................422 15 540'000420'000 430'000 750'000 850'000 1'000'000 1'200'000 1'300'000 1'787'50027Internet hosts.................................................4211 16 2— — 275 37 319 4'160 3'745 11'422
2'000Estimated Internet users................................4212 ...... ... 5'000 10'000 20'000 100'000 460'000 1'016'208
Saudi Telecommunications Company.Source:(1) Source: UN; 1992: Latest census. (2) ITU estimate. (3) Source: IMF. (4) Source: IMF. (5) Source: IMF. (6) Source: IMF. (7) 1996: Estimate. (8) Estimated unsatisfied demand. (9) From 1998: Including Internet dial-up minutes. (10) Until 1996: Estimated. (11) Including 100 free air-time. (12) Including 100 free air-time. (13) Until 1996: Not including GSM revenue. (14) Source: Unesco. (15) Source: Computer Industry Almanac, ITU estimates. (16) Source: Internet Software Consortium. 1996=July. Since 1999: RIPE.

200120001996 1997 1998 19991995199419931992
Year Ending 31.12
Area: 630'000 km2 National currency: Shilling
Indicators Unit
SOMALIA
DEMOGRAPHY, ECONOMY9'077Population......................................................61 10x31 9'0778'902 8'954 9'822 9'772 9'722 9'672 9'940 10'0501'174Households....................................................62 10x32 1'1561'120 1'138 1'193 1'212 1'231 1'251 1'271 1'288
...Average annual exchange rate per US$.......652 3 ...... ... ... 7'850 7'930 9'810 10'280 22'557TELEPHONE NETWORK
15'000Main telephone lines in operation..................112 4 15'00015'000 15'000 15'000 15'000 20'000 35'000 35'000 35'0000.17Main telephone lines per 100 inhabitants......91 0.170.17 0.17 0.15 0.15 0.21 0.36 0.35 0.35
BROADCASTING124Television receivers.......................................965 10x35 121113 118 129 135 138 140 142 145
INFORMATION TECHNOLOGY—Internet hosts.................................................4211 6 —— — — — — 2 1 4—Estimated Internet users................................4212 ...... ... — — 100 200 500 1'000
Ministry of Posts and Telecommunications.Source:(1) Source: UN; ITU estimate. (2) 1985, 2000: UNCHS. Other years: ITU estimate. (3) From 1997, UN operational rate of exchange, end of period. (4) Estimate. (5) Source: Unesco, ITU estimate. (6) Source: Internet Software Consortium. Since 2001: RIPE.

200120001996 1997 1998 19991995199419931992
Year Ending 31.12
SUDAN
National currency: Pound
Indicators Unit
Area: 2'505'815 km2
DEMOGRAPHY, ECONOMY26'378Population......................................................61 10x31 25'64925'934 24'941 27'127 27'898 28'292 28'883 31'095 31'8094'500Households....................................................62 10x32 4'4134'183 4'297 4'539 4'650 4'810 5'054 5'124 5'2424'832Gross domestic product (GDP).....................63 10x93 1'680408 835 10'217 16'012 ... 27'104 28'785 32'517
580.87Average annual exchange rate per US$.......652 4 289.6197.43 159.31 1'250.79 1'575.74 2'008.02 2'557.00 2'570.12 2'580.70100Consumer price index (1995=100)................66_95 5 5914 28 233 341 400 464 ... 525
TELEPHONE NETWORK75'000Main telephone lines in operation..................112 6 64'00064'000 64'000 99'000 112'544 162'225 251'420 386'775 453'000
0.28Main telephone lines per 100 inhabitants......91 0.250.25 0.26 0.36 0.40 0.57 0.87 1.24 1.420.7Residential main lines per 100 households...1111c 0.60.6 0.6 0.9 1.2 1.6 2.7 5.7 7.8
25.0% digital main lines........................................1142 % 5.4... 0.1 50.0 89.0 90.0 95.0 100.0 100.040.0% residential main lines.................................116 % 40.040.0 40.0 40.0 48.0 48.0 55.0 75.0 90.0995Public payphones...........................................1112 750560 560 1'530 2'100 2'850 3'400 5'250 7'350300Waiting list for main lines...............................123 10x3 7540 55 309 320 340 355 405 444
MOBILE SERVICES—Cellular mobile telephone subscribers..........271 7 —— — 2'200 3'800 8'600 13'000 23'000 103'846— - Digital cellular subscribers........................2712 —— — 2'200 3'800 8'600 13'000 23'000 103'846—Cellular subscribers per 100 inhabitants.......911 —— — 0.01 0.01 0.03 0.05 0.07 0.33
OTHER SERVICES—ISDN subscribers...........................................28 —— — — — — — 215 250—ISDN B channel equivalents..........................28c 8 —— — — — — — 430 500
TRAFFIC... - Total national telephone (calls)...............131c 10x3 ...... ... ... 76'200 198'600 379'400 357'900 477'000... - Local telephone (calls)..........................1311c 10x3 ...... ... ... 63'200 170'000 343'400 290'400 380'000... - National trunk telephone (calls)............1312c 10x3 ...... ... ... 13'000 28'600 36'000 67'500 97'000
2'558 - Int'l outgoing telephone (calls).................132c 10x3 3'7062'450 2'351 4'296 7'691 9'217 12'474 10'612 12'0366'708 - Int'l incoming telephone (calls)................132ci 10x3 6'3892'760 5'150 10'117 8'550 17'679 35'099 51'916 65'267
10'499 - Int'l bothway telephone (calls).................132cb 10x3 10'0955'209 7'501 14'413 16'241 26'891 47'573 62'528 77'3037'456 - Int'l outgoing telephone (minutes)...........132m 10x39 11'6479'850 9'805 12'655 14'977 18'434 24'948 31'836 36'109
24'103 - Int'l incoming telephone (minutes)...........132mi 10x3 19'1667'470 15'449 30'416 43'198 70'000 105'286 155'747 195'80031'559 - Int'l bothway telephone (minutes)............132mb 10x3 30'81317'320 25'254 43'071 58'175 88'434 130'284 187'583 231'909
STAFF2'500Full-time telecommunication staff..................51 2'1008'650 8'678 2'635 2'468 2'488 2'657 2'804 3'021
QUALITY OF SERVICE18.0Faults per 100 main lines per year................143 % 20.040.0 40.0 15.8 12.0 12.0 5.0 ... ...
TARIFFS60'000Residential teleph. connection charge..........151 60'0009'000 9'000 80'000 100'000 100'000 70'000 70'000 70'00060'000Business teleph. connection charge..............151b 60'0009'000 9'000 80'000 100'000 100'000 125'000 100'000 100'00010'000Residential teleph. monthly subscription.......152 6'000... ... 1'000 4'000 4'000 5'000 5'000 5'00010'000Business teleph. monthly subscription..........152b 6'080... ... 1'060 4'000 4'000 5'000 5'000 5'000
30.03-minute local call (peak rate).......................153 15.03.0 3.0 36.0 45.0 45.0 60.0 60.0 90.0—Cellular connection charge............................151c —— — 1'500'000 1'500'000 1'500'000 1'500'000 1'250'000 500'000—Cellular monthly subscription.........................152c —— — 35'000 35'000 35'000 35'000 30'000 30'000—Cellular - 3-min. local call (peak rate)...........153c —— — 360 360 360 360 360 360
REVENUE AND EXPENSE...Total telecom services revenue.....................75 10x6 5'133... 325 48'147 99'805 199'423 259'385 335'664 425'407... - Telephone service revenue......................71 10x6 3'332... ... 31'018 68'452 188'666 241'039 302'312 377'444
CAPITAL EXPENDITURE...Annual telecom. investment..........................81 10x6 2'269... ... 27'958 96'567 111'960 172'213 238'971 279'074
BROADCASTING2'240Television receivers.......................................965 10x310 2'1802'060 2'120 2'300 2'380 2'450 5'000 8'500 12'265
...Television equipped households...................965h 10x3 ...... ... ... 3'200 3'200 4'060 4'200 4'377
...Home satellite antennas................................965s ...... ... ... 5'000 15'000 22'000 56'400 84'000INFORMATION TECHNOLOGY
10'000Personal computers.......................................422 11 5'000... ... 20'000 32'000 55'000 85'000 100'000 115'000—Internet hosts.................................................4211 12 —— — — 146 266 600 — ——Estimated Internet users................................4212 —... ... — 700 2'000 5'000 30'000 56'000
Sudan Telecommunications Company Ltd. (Sudatel).Source:(1) Source: UN; ITU estimate; 1991: Latest census. (2) 1983, 2000:UN. 1990-95: Estimate. (3) Source: IMF. From 1999: Break in comparability. World Bank. (4) Source: IMF. (5) Source: IMF. (6) 1988-90, 1992-93: Estimate. (7) 2002: August. (8) 2000: Estimate. (9) 1983-84: Estimate. (10) Source: Unesco, ITU estimate. From 2001: Sudan Telecom. (11) Source: Sudatel. (12) Source: Internet Software Consortium.

200120001996 1997 1998 19991995199419931992
Year Ending 31.12
Area: 185'680 km2 National currency: Pound
Indicators Unit
SYRIA
DEMOGRAPHY, ECONOMY14'150Population......................................................61 10x31 13'84012'960 13'390 14'620 15'100 15'600 16'112 16'189 16'6092'830Households....................................................62 10x32 2'8302'410 2'490 2'923 3'000 3'120 3'220 3'312 3'438
570'975Gross domestic product (GDP).....................63 10x63 506'101371'630 413'755 690'857 745'569 790'444 819'092 896'634 ...155'504Gross Fixed Capital Formation (GFCF).........64 10x64 151'62286'120 107'466 163'076 155'464 162'446 153'706 155'757 ...
26.60Average annual exchange rate per US$.......652 5 26.6026.60 26.60 45.00 45.00 45.00 46.50 46.73 46.74100Consumer price index (1995=100)................66_95 6 9371 80 108 110 109 107 107 107
TELEPHONE NETWORK958.5Main telephone lines in operation..................112 10x3 686.4513.4 567.0 1'199.0 1'312.6 1'477.0 1'600.4 1'675.2 1'817.06.77Main telephone lines per 100 inhabitants......91 4.963.96 4.23 8.20 8.69 9.47 9.93 10.35 10.94
...% households with a telephone.....................1111 ...... ... ... ... 50.0 50.0 50.0 ...25.4Residential main lines per 100 households...1111c 19.417.0 18.2 30.8 32.8 38.8 42.2 43.0 43.371.0% digital main lines........................................1142 % 74.032.0 35.0 77.0 82.0 87.0 87.0 99.0 99.075.0% residential main lines.................................116 % 80.080.0 80.0 75.0 75.0 82.0 85.0 85.0 87.03.2Public payphones...........................................1112 10x37 2.41.0 1.3 2.7 2.5 3.2 3.7 4.7 5.0
2'292Waiting list for main lines...............................123 10x3 2'8691'720 1'918 2'945 2'947 2'904 2'819 3'026 2'806MOBILE SERVICES
—Cellular mobile telephone subscribers..........271 8 —— — — — — 4'000 30'000 200'000— - Digital cellular subscribers........................2712 —— — — — — 3'000 30'000 200'000—Cellular subscribers per 100 inhabitants.......911 —— — — — — 0.02 0.19 1.20—Radio paging subscribers..............................275 —— — — — — 1'113 2'763 2'763
OTHER SERVICES—ISDN subscribers...........................................28 —— — 50 62 65 199 235 977—ISDN B channel equivalents..........................28c —— — 100 124 130 398 470 1'954
TRAFFIC1'539 - Total national telephone (calls)...............131c 10x6 1'138914 1'040 2'603 3'263 4'145 5'020 5'606 5'8981'829 - Local telephone (calls)..........................1311c 10x6 1'105895 1'011 2'456 3'100 3'953 4'800 5'341 5'556
108 - National trunk telephone (calls)............1312c 10x6 3319 29 147 163 192 220 265 342486 - National trunk telephone (minutes)......1312m 10x6 262111 141 588 660 760 850 951 1'10168 - Int'l outgoing telephone (minutes)...........132m 10x6 5422 37 84 90 103 122 169 163
110 - Int'l incoming telephone (minutes)...........132mi 10x69 8033 65 144 173 130 207 220 330178 - Int'l bothway telephone (minutes)............132mb 10x6 13455 102 228 263 233 329 389 493
STAFF17'202Full-time telecommunication staff..................51 16'66514'072 15'670 17'747 18'703 19'664 20'419 21'193 21'688
QUALITY OF SERVICE70.0Faults per 100 main lines per year................143 % 60.065.0 64.0 60.0 60.0 50.0 50.0 50.0 50.0
TARIFFS4'000Residential teleph. connection charge..........151 4'0004'000 4'000 4'000 4'000 5'000 5'000 5'000 5'0008'000Business teleph. connection charge..............151b 8'0008'000 8'000 8'000 8'000 10'000 10'000 10'000 10'00033.33Residential teleph. monthly subscription.......152 33.3333.33 33.33 33.33 33.33 33.00 33.00 33.00 33.0066.00Business teleph. monthly subscription..........152b 66.0068.00 66.00 66.66 66.66 66.00 66.00 66.00 66.000.603-minute local call (peak rate).......................153 0.600.60 0.60 0.60 0.60 0.60 0.60 0.60 0.600.603-minute local call (off-peak rate)..................153o 0.600.60 0.60 0.60 0.60 0.60 0.60 0.60 0.60
—Cellular connection charge............................151c —— — — — — — 20'000 20'000—Cellular monthly subscription.........................152c —— — — — — — 600 600—Cellular - 3-min. local call (peak rate)...........153c —— — — — — — 12.00 12.00—Cellular - 3-min. local call (off-peak rate).......153co —— — — — — — 12.00 12.00
REVENUE AND EXPENSE9'545Total telecom services revenue.....................75 10x6 6'4933'168 4'220 13'523 16'711 15'262 16'316 17'842 20'2179'108 - Telephone service revenue......................71 10x6 6'1122'706 3'761 13'130 16'245 14'798 15'836 15'813 16'909
— - Mobile communication revenue................741 10x6 —— — — — — — 1'574 2'496CAPITAL EXPENDITURE
3'200Annual telecom. investment..........................81 10x6 3'812663 503 3'564 4'099 4'545 6'465 10'377 8'190BROADCASTING
1'020Television receivers.......................................965 10x310 1'000850 915 1'040 1'893 2'163 2'433 2'640 2'860...Television equipped households...................965h 10x311 ...... ... ... 1'721 1'967 2'212 2'400 2'600
300Home satellite antennas................................965s 10x312 3... ... ... ... ... 435 600 900INFORMATION TECHNOLOGY
100'000Personal computers.......................................422 13 80'000... ... 130'000 170'000 200'000 230'000 250'000 270'000—Internet hosts.................................................4211 14 —— — — — 1 6 9 9—Estimated Internet users................................4212 —— — — 5'000 10'000 20'000 30'000 60'000
Syrian Telecommunications Establishment (STE).Source:(1) Source: UN; 1994: Latest census. (2) ITU estimate. (3) Source: IMF. (4) Source: IMF. (5) Source: STE. (6) Source: IMF. (7) Including public call offices from 1990. (8) 2000: STE estimate. (9) 1993-1995, 2000: Estimates. (10) 1995: Estimate. 1996: UNESCO. (11) Eutelsat, ITU estimates. (12) Eutelsat, ITU estimates. (13) 1995: Estimate. (14) Source: Internet Software Consortium. Since 1999: RIPE.
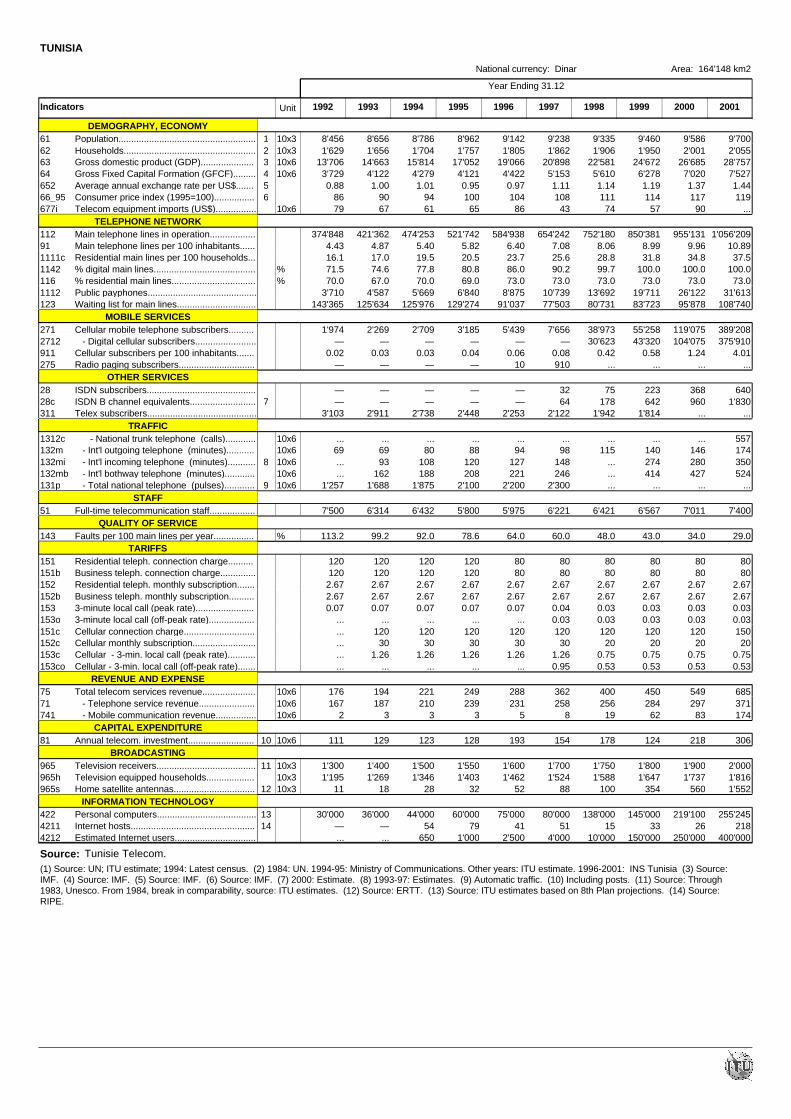
200120001996 1997 1998 19991995199419931992
Year Ending 31.12
TUNISIA
National currency: Dinar
Indicators Unit
Area: 164'148 km2
DEMOGRAPHY, ECONOMY8'962Population......................................................61 10x31 8'7868'456 8'656 9'142 9'238 9'335 9'460 9'586 9'7001'757Households....................................................62 10x32 1'7041'629 1'656 1'805 1'862 1'906 1'950 2'001 2'055
17'052Gross domestic product (GDP).....................63 10x63 15'81413'706 14'663 19'066 20'898 22'581 24'672 26'685 28'7574'121Gross Fixed Capital Formation (GFCF).........64 10x64 4'2793'729 4'122 4'422 5'153 5'610 6'278 7'020 7'5270.95Average annual exchange rate per US$.......652 5 1.010.88 1.00 0.97 1.11 1.14 1.19 1.37 1.44100Consumer price index (1995=100)................66_95 6 9486 90 104 108 111 114 117 11965Telecom equipment imports (US$)................677i 10x6 6179 67 86 43 74 57 90 ...
TELEPHONE NETWORK521'742Main telephone lines in operation..................112 474'253374'848 421'362 584'938 654'242 752'180 850'381 955'131 1'056'209
5.82Main telephone lines per 100 inhabitants......91 5.404.43 4.87 6.40 7.08 8.06 8.99 9.96 10.8920.5Residential main lines per 100 households...1111c 19.516.1 17.0 23.7 25.6 28.8 31.8 34.8 37.580.8% digital main lines........................................1142 % 77.871.5 74.6 86.0 90.2 99.7 100.0 100.0 100.069.0% residential main lines.................................116 % 70.070.0 67.0 73.0 73.0 73.0 73.0 73.0 73.0
6'840Public payphones...........................................1112 5'6693'710 4'587 8'875 10'739 13'692 19'711 26'122 31'613129'274Waiting list for main lines...............................123 125'976143'365 125'634 91'037 77'503 80'731 83'723 95'878 108'740
MOBILE SERVICES3'185Cellular mobile telephone subscribers..........271 2'7091'974 2'269 5'439 7'656 38'973 55'258 119'075 389'208
— - Digital cellular subscribers........................2712 —— — — — 30'623 43'320 104'075 375'9100.04Cellular subscribers per 100 inhabitants.......911 0.030.02 0.03 0.06 0.08 0.42 0.58 1.24 4.01
—Radio paging subscribers..............................275 —— — 10 910 ... ... ... ...OTHER SERVICES
—ISDN subscribers...........................................28 —— — — 32 75 223 368 640—ISDN B channel equivalents..........................28c 7 —— — — 64 178 642 960 1'830
2'448Telex subscribers...........................................311 2'7383'103 2'911 2'253 2'122 1'942 1'814 ... ...TRAFFIC
... - National trunk telephone (calls)............1312c 10x6 ...... ... ... ... ... ... ... 55788 - Int'l outgoing telephone (minutes)...........132m 10x6 8069 69 94 98 115 140 146 174
120 - Int'l incoming telephone (minutes)...........132mi 10x68 108... 93 127 148 ... 274 280 350208 - Int'l bothway telephone (minutes)............132mb 10x6 188... 162 221 246 ... 414 427 524
2'100 - Total national telephone (pulses)............131p 10x69 1'8751'257 1'688 2'200 2'300 ... ... ... ...STAFF
5'800Full-time telecommunication staff..................51 6'4327'500 6'314 5'975 6'221 6'421 6'567 7'011 7'400QUALITY OF SERVICE
78.6Faults per 100 main lines per year................143 % 92.0113.2 99.2 64.0 60.0 48.0 43.0 34.0 29.0TARIFFS
120Residential teleph. connection charge..........151 120120 120 80 80 80 80 80 80120Business teleph. connection charge..............151b 120120 120 80 80 80 80 80 802.67Residential teleph. monthly subscription.......152 2.672.67 2.67 2.67 2.67 2.67 2.67 2.67 2.672.67Business teleph. monthly subscription..........152b 2.672.67 2.67 2.67 2.67 2.67 2.67 2.67 2.670.073-minute local call (peak rate).......................153 0.070.07 0.07 0.07 0.04 0.03 0.03 0.03 0.03
...3-minute local call (off-peak rate)..................153o ...... ... ... 0.03 0.03 0.03 0.03 0.03120Cellular connection charge............................151c 120... 120 120 120 120 120 120 15030Cellular monthly subscription.........................152c 30... 30 30 30 20 20 20 20
1.26Cellular - 3-min. local call (peak rate)...........153c 1.26... 1.26 1.26 1.26 0.75 0.75 0.75 0.75...Cellular - 3-min. local call (off-peak rate).......153co ...... ... ... 0.95 0.53 0.53 0.53 0.53
REVENUE AND EXPENSE249Total telecom services revenue.....................75 10x6 221176 194 288 362 400 450 549 685239 - Telephone service revenue......................71 10x6 210167 187 231 258 256 284 297 371
3 - Mobile communication revenue................741 10x6 32 3 5 8 19 62 83 174CAPITAL EXPENDITURE
128Annual telecom. investment..........................81 10x610 123111 129 193 154 178 124 218 306BROADCASTING
1'550Television receivers.......................................965 10x311 1'5001'300 1'400 1'600 1'700 1'750 1'800 1'900 2'0001'403Television equipped households...................965h 10x3 1'3461'195 1'269 1'462 1'524 1'588 1'647 1'737 1'816
32Home satellite antennas................................965s 10x312 2811 18 52 88 100 354 560 1'552INFORMATION TECHNOLOGY
60'000Personal computers.......................................422 13 44'00030'000 36'000 75'000 80'000 138'000 145'000 219'100 255'24579Internet hosts.................................................4211 14 54— — 41 51 15 33 26 218
1'000Estimated Internet users................................4212 650... ... 2'500 4'000 10'000 150'000 250'000 400'000
Tunisie Telecom.Source:(1) Source: UN; ITU estimate; 1994: Latest census. (2) 1984: UN. 1994-95: Ministry of Communications. Other years: ITU estimate. 1996-2001: INS Tunisia (3) Source: IMF. (4) Source: IMF. (5) Source: IMF. (6) Source: IMF. (7) 2000: Estimate. (8) 1993-97: Estimates. (9) Automatic traffic. (10) Including posts. (11) Source: Through 1983, Unesco. From 1984, break in comparability, source: ITU estimates. (12) Source: ERTT. (13) Source: ITU estimates based on 8th Plan projections. (14) Source: RIPE.
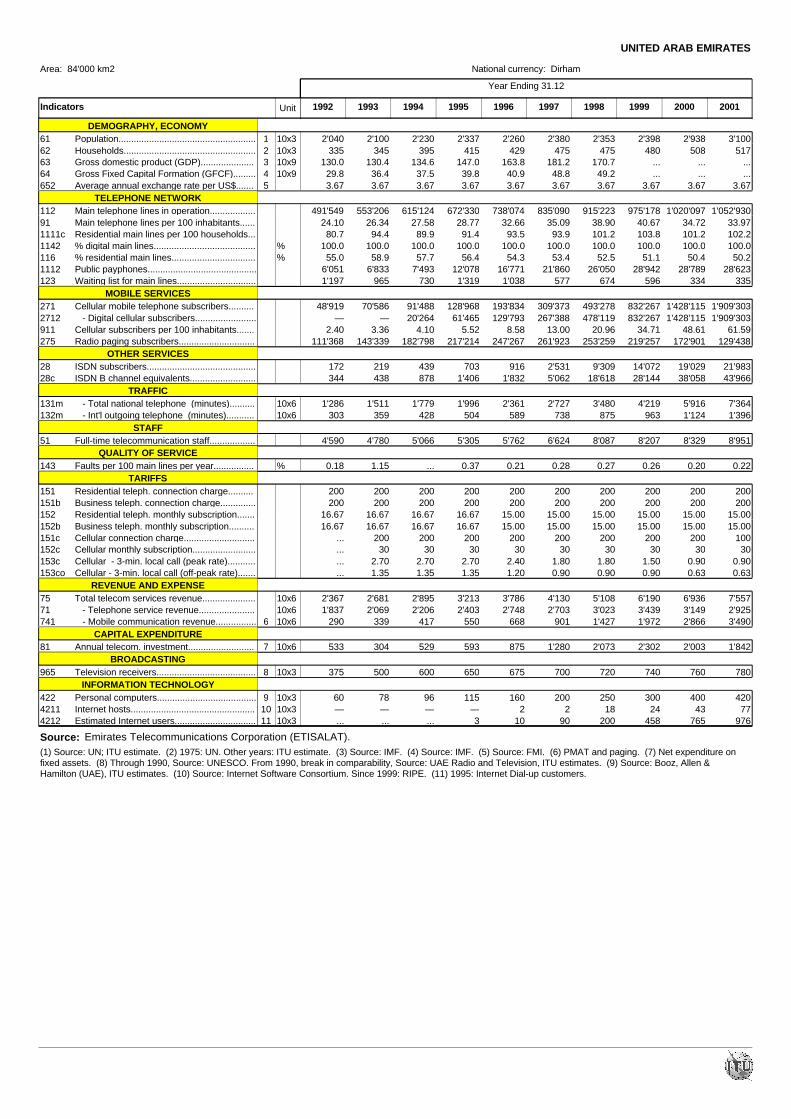
200120001996 1997 1998 19991995199419931992
Year Ending 31.12
Area: 84'000 km2 National currency: Dirham
Indicators Unit
UNITED ARAB EMIRATES
DEMOGRAPHY, ECONOMY2'337Population......................................................61 10x31 2'2302'040 2'100 2'260 2'380 2'353 2'398 2'938 3'100
415Households....................................................62 10x32 395335 345 429 475 475 480 508 517147.0Gross domestic product (GDP).....................63 10x93 134.6130.0 130.4 163.8 181.2 170.7 ... ... ...39.8Gross Fixed Capital Formation (GFCF).........64 10x94 37.529.8 36.4 40.9 48.8 49.2 ... ... ...3.67Average annual exchange rate per US$.......652 5 3.673.67 3.67 3.67 3.67 3.67 3.67 3.67 3.67
TELEPHONE NETWORK672'330Main telephone lines in operation..................112 615'124491'549 553'206 738'074 835'090 915'223 975'178 1'020'097 1'052'930
28.77Main telephone lines per 100 inhabitants......91 27.5824.10 26.34 32.66 35.09 38.90 40.67 34.72 33.9791.4Residential main lines per 100 households...1111c 89.980.7 94.4 93.5 93.9 101.2 103.8 101.2 102.2
100.0% digital main lines........................................1142 % 100.0100.0 100.0 100.0 100.0 100.0 100.0 100.0 100.056.4% residential main lines.................................116 % 57.755.0 58.9 54.3 53.4 52.5 51.1 50.4 50.2
12'078Public payphones...........................................1112 7'4936'051 6'833 16'771 21'860 26'050 28'942 28'789 28'6231'319Waiting list for main lines...............................123 7301'197 965 1'038 577 674 596 334 335
MOBILE SERVICES128'968Cellular mobile telephone subscribers..........271 91'48848'919 70'586 193'834 309'373 493'278 832'267 1'428'115 1'909'30361'465 - Digital cellular subscribers........................2712 20'264— — 129'793 267'388 478'119 832'267 1'428'115 1'909'303
5.52Cellular subscribers per 100 inhabitants.......911 4.102.40 3.36 8.58 13.00 20.96 34.71 48.61 61.59217'214Radio paging subscribers..............................275 182'798111'368 143'339 247'267 261'923 253'259 219'257 172'901 129'438
OTHER SERVICES703ISDN subscribers...........................................28 439172 219 916 2'531 9'309 14'072 19'029 21'983
1'406ISDN B channel equivalents..........................28c 878344 438 1'832 5'062 18'618 28'144 38'058 43'966TRAFFIC
1'996 - Total national telephone (minutes)..........131m 10x6 1'7791'286 1'511 2'361 2'727 3'480 4'219 5'916 7'364504 - Int'l outgoing telephone (minutes)...........132m 10x6 428303 359 589 738 875 963 1'124 1'396
STAFF5'305Full-time telecommunication staff..................51 5'0664'590 4'780 5'762 6'624 8'087 8'207 8'329 8'951
QUALITY OF SERVICE0.37Faults per 100 main lines per year................143 % ...0.18 1.15 0.21 0.28 0.27 0.26 0.20 0.22
TARIFFS200Residential teleph. connection charge..........151 200200 200 200 200 200 200 200 200200Business teleph. connection charge..............151b 200200 200 200 200 200 200 200 200
16.67Residential teleph. monthly subscription.......152 16.6716.67 16.67 15.00 15.00 15.00 15.00 15.00 15.0016.67Business teleph. monthly subscription..........152b 16.6716.67 16.67 15.00 15.00 15.00 15.00 15.00 15.00
200Cellular connection charge............................151c 200... 200 200 200 200 200 200 10030Cellular monthly subscription.........................152c 30... 30 30 30 30 30 30 30
2.70Cellular - 3-min. local call (peak rate)...........153c 2.70... 2.70 2.40 1.80 1.80 1.50 0.90 0.901.35Cellular - 3-min. local call (off-peak rate).......153co 1.35... 1.35 1.20 0.90 0.90 0.90 0.63 0.63
REVENUE AND EXPENSE3'213Total telecom services revenue.....................75 10x6 2'8952'367 2'681 3'786 4'130 5'108 6'190 6'936 7'5572'403 - Telephone service revenue......................71 10x6 2'2061'837 2'069 2'748 2'703 3'023 3'439 3'149 2'925
550 - Mobile communication revenue................741 10x66 417290 339 668 901 1'427 1'972 2'866 3'490CAPITAL EXPENDITURE
593Annual telecom. investment..........................81 10x67 529533 304 875 1'280 2'073 2'302 2'003 1'842BROADCASTING
650Television receivers.......................................965 10x38 600375 500 675 700 720 740 760 780INFORMATION TECHNOLOGY
115Personal computers.......................................422 10x39 9660 78 160 200 250 300 400 420—Internet hosts.................................................4211 10x310 —— — 2 2 18 24 43 773Estimated Internet users................................4212 10x311 ...... ... 10 90 200 458 765 976
Emirates Telecommunications Corporation (ETISALAT).Source:(1) Source: UN; ITU estimate. (2) 1975: UN. Other years: ITU estimate. (3) Source: IMF. (4) Source: IMF. (5) Source: FMI. (6) PMAT and paging. (7) Net expenditure on fixed assets. (8) Through 1990, Source: UNESCO. From 1990, break in comparability, Source: UAE Radio and Television, ITU estimates. (9) Source: Booz, Allen & Hamilton (UAE), ITU estimates. (10) Source: Internet Software Consortium. Since 1999: RIPE. (11) 1995: Internet Dial-up customers.
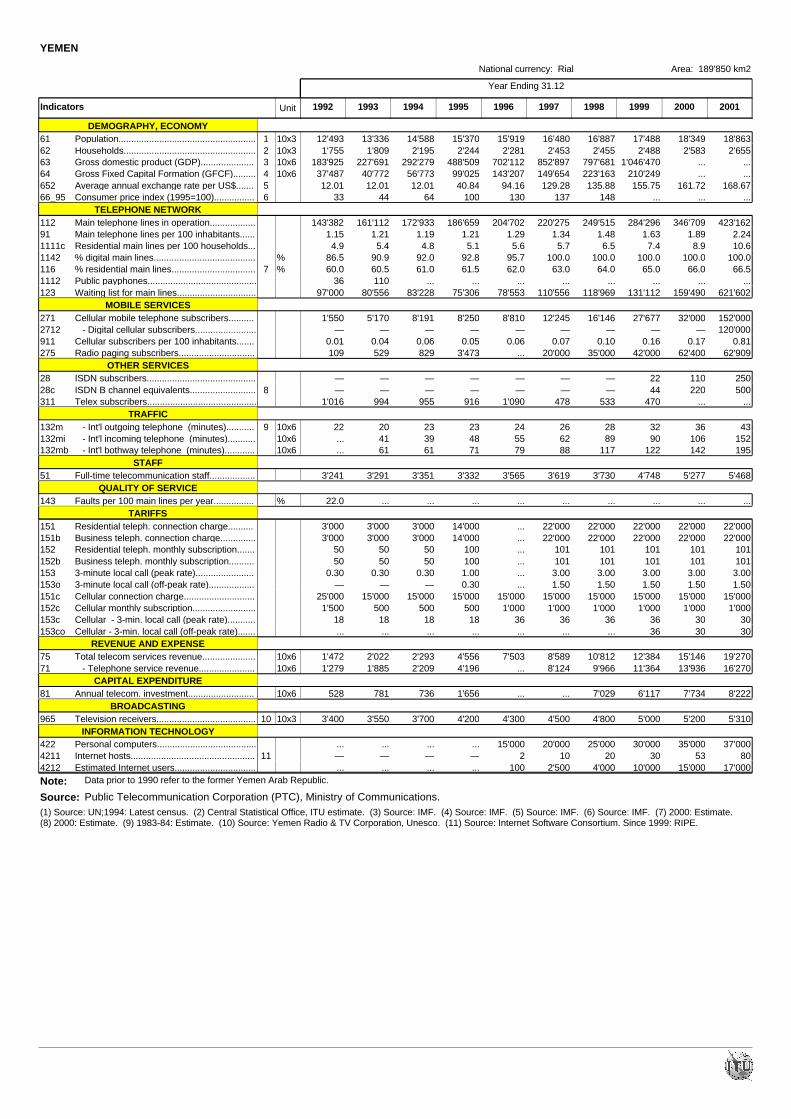
200120001996 1997 1998 19991995199419931992
Year Ending 31.12
YEMEN
National currency: Rial
Indicators Unit
Area: 189'850 km2
DEMOGRAPHY, ECONOMY15'370Population......................................................61 10x31 14'58812'493 13'336 15'919 16'480 16'887 17'488 18'349 18'8632'244Households....................................................62 10x32 2'1951'755 1'809 2'281 2'453 2'455 2'488 2'583 2'655
488'509Gross domestic product (GDP).....................63 10x63 292'279183'925 227'691 702'112 852'897 797'681 1'046'470 ... ...99'025Gross Fixed Capital Formation (GFCF).........64 10x64 56'77337'487 40'772 143'207 149'654 223'163 210'249 ... ...40.84Average annual exchange rate per US$.......652 5 12.0112.01 12.01 94.16 129.28 135.88 155.75 161.72 168.67
100Consumer price index (1995=100)................66_95 6 6433 44 130 137 148 ... ... ...TELEPHONE NETWORK
186'659Main telephone lines in operation..................112 172'933143'382 161'112 204'702 220'275 249'515 284'296 346'709 423'1621.21Main telephone lines per 100 inhabitants......91 1.191.15 1.21 1.29 1.34 1.48 1.63 1.89 2.245.1Residential main lines per 100 households...1111c 4.84.9 5.4 5.6 5.7 6.5 7.4 8.9 10.6
92.8% digital main lines........................................1142 % 92.086.5 90.9 95.7 100.0 100.0 100.0 100.0 100.061.5% residential main lines.................................116 %7 61.060.0 60.5 62.0 63.0 64.0 65.0 66.0 66.5
...Public payphones...........................................1112 ...36 110 ... ... ... ... ... ...75'306Waiting list for main lines...............................123 83'22897'000 80'556 78'553 110'556 118'969 131'112 159'490 621'602
MOBILE SERVICES8'250Cellular mobile telephone subscribers..........271 8'1911'550 5'170 8'810 12'245 16'146 27'677 32'000 152'000
— - Digital cellular subscribers........................2712 —— — — — — — — 120'0000.05Cellular subscribers per 100 inhabitants.......911 0.060.01 0.04 0.06 0.07 0.10 0.16 0.17 0.81
3'473Radio paging subscribers..............................275 829109 529 ... 20'000 35'000 42'000 62'400 62'909OTHER SERVICES
—ISDN subscribers...........................................28 —— — — — — 22 110 250—ISDN B channel equivalents..........................28c 8 —— — — — — 44 220 500
916Telex subscribers...........................................311 9551'016 994 1'090 478 533 470 ... ...TRAFFIC
23 - Int'l outgoing telephone (minutes)...........132m 10x69 2322 20 24 26 28 32 36 4348 - Int'l incoming telephone (minutes)...........132mi 10x6 39... 41 55 62 89 90 106 15271 - Int'l bothway telephone (minutes)............132mb 10x6 61... 61 79 88 117 122 142 195
STAFF3'332Full-time telecommunication staff..................51 3'3513'241 3'291 3'565 3'619 3'730 4'748 5'277 5'468
QUALITY OF SERVICE...Faults per 100 main lines per year................143 % ...22.0 ... ... ... ... ... ... ...
TARIFFS14'000Residential teleph. connection charge..........151 3'0003'000 3'000 ... 22'000 22'000 22'000 22'000 22'00014'000Business teleph. connection charge..............151b 3'0003'000 3'000 ... 22'000 22'000 22'000 22'000 22'000
100Residential teleph. monthly subscription.......152 5050 50 ... 101 101 101 101 101100Business teleph. monthly subscription..........152b 5050 50 ... 101 101 101 101 1011.003-minute local call (peak rate).......................153 0.300.30 0.30 ... 3.00 3.00 3.00 3.00 3.000.303-minute local call (off-peak rate)..................153o —— — ... 1.50 1.50 1.50 1.50 1.50
15'000Cellular connection charge............................151c 15'00025'000 15'000 15'000 15'000 15'000 15'000 15'000 15'000500Cellular monthly subscription.........................152c 5001'500 500 1'000 1'000 1'000 1'000 1'000 1'00018Cellular - 3-min. local call (peak rate)...........153c 1818 18 36 36 36 36 30 30...Cellular - 3-min. local call (off-peak rate).......153co ...... ... ... ... ... 36 30 30
REVENUE AND EXPENSE4'556Total telecom services revenue.....................75 10x6 2'2931'472 2'022 7'503 8'589 10'812 12'384 15'146 19'2704'196 - Telephone service revenue......................71 10x6 2'2091'279 1'885 ... 8'124 9'966 11'364 13'936 16'270
CAPITAL EXPENDITURE1'656Annual telecom. investment..........................81 10x6 736528 781 ... ... 7'029 6'117 7'734 8'222
BROADCASTING4'200Television receivers.......................................965 10x310 3'7003'400 3'550 4'300 4'500 4'800 5'000 5'200 5'310
INFORMATION TECHNOLOGY...Personal computers.......................................422 ...... ... 15'000 20'000 25'000 30'000 35'000 37'000—Internet hosts.................................................4211 11 —— — 2 10 20 30 53 80...Estimated Internet users................................4212 ...... ... 100 2'500 4'000 10'000 15'000 17'000
Public Telecommunication Corporation (PTC), Ministry of Communications.Source:(1) Source: UN;1994: Latest census. (2) Central Statistical Office, ITU estimate. (3) Source: IMF. (4) Source: IMF. (5) Source: IMF. (6) Source: IMF. (7) 2000: Estimate. (8) 2000: Estimate. (9) 1983-84: Estimate. (10) Source: Yemen Radio & TV Corporation, Unesco. (11) Source: Internet Software Consortium. Since 1999: RIPE.
Data prior to 1990 refer to the former Yemen Arab Republic.Note:

ARAB STATES TELECOMMUNICATION ORGANIZATIONS
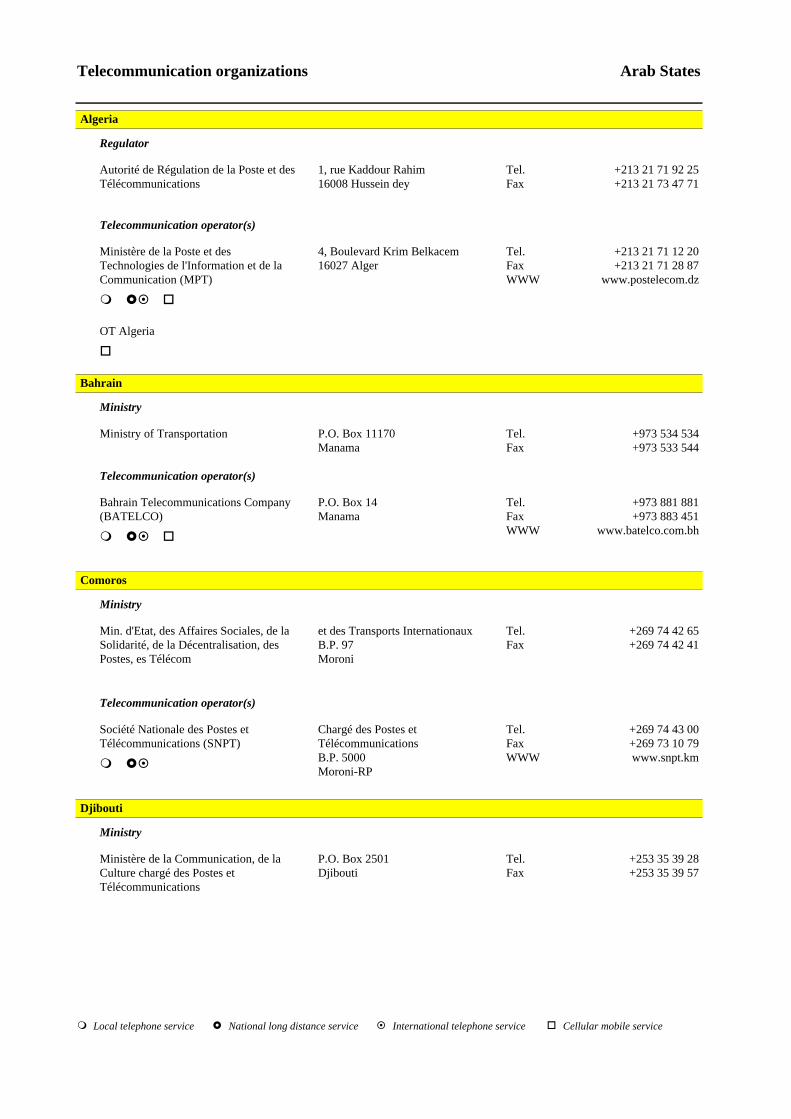
Telecommunication organizations Arab States
Algeria
Regulator
Tel. Fax
1, rue Kaddour Rahim16008 Hussein dey
Autorité de Régulation de la Poste et des Télécommunications
+213 21 71 92 25+213 21 73 47 71
Telecommunication operator(s)
Tel. Fax WWW
4, Boulevard Krim Belkacem16027 Alger
Ministère de la Poste et des Technologies de l'Information et de la Communication (MPT)
+213 21 71 12 20+213 21 71 28 87
www.postelecom.dz
m £¤ o
OT Algeria
o
Bahrain
Ministry
Tel. Fax
P.O. Box 11170Manama
Ministry of Transportation +973 534 534+973 533 544
Telecommunication operator(s)
Tel. Fax WWW
P.O. Box 14Manama
Bahrain Telecommunications Company (BATELCO)
+973 881 881+973 883 451
www.batelco.com.bhm £¤ o
Comoros
Ministry
Tel. Fax
et des Transports Internationaux B.P. 97Moroni
Min. d'Etat, des Affaires Sociales, de la Solidarité, de la Décentralisation, des Postes, es Télécom
+269 74 42 65+269 74 42 41
Telecommunication operator(s)
Tel. Fax WWW
Chargé des Postes et TélécommunicationsB.P. 5000Moroni-RP
Société Nationale des Postes et Télécommunications (SNPT)
+269 74 43 00+269 73 10 79www.snpt.kmm £¤
Djibouti
Ministry
Tel. Fax
P.O. Box 2501Djibouti
Ministère de la Communication, de la Culture chargé des Postes et Télécommunications
+253 35 39 28+253 35 39 57
Local telephone service National long distance servicem £ ¤ International telephone service o Cellular mobile service

Telecommunication organizations Arab States
Telecommunication operator(s)
Tel. Fax WWW
3, Avenue G. PompidouBP 2105Djibouti RDD
Djibouti Telecom SA +253 35 11 10/0669+253 35 5757
www.nic.djm £¤ o
Egypt
Ministry
Tel. Fax WWW
Ahmed Oraby, St. MohandeseenGiza
Ministry of Communications and Information Technology
+202 2 344 45 44+202 2 344 60 88www.mcit.gov.eg
Regulator
Tel. Fax WWW
27 Mosadak StreetEl DokkiCairo
Telecommunication Regulatory Authority (TRA)
+202 760 6670/6671+202 761 7880
www.tra.gov.eg
Telecommunication operator(s)
Tel. Fax WWW
17 Corniche El Nile, MaadiMirsfone Telecommunications Co. +202 529 20 15+202 529 20 30
www.clickgsm.como
Tel. Fax WWW
P.O. Box 2271Cairo 11511
Telecom Egypt +202 577 7551+202 579 7722
www.telecomegypt.com.egm £¤ o
Tel. Fax WWW
1191 Corniche El NilWorld Trade Center
The Egyptian Company for Mobile Services (MobiNil)
+202 12 320 00 00+202 12 320 00 29www.mobinil.como
Iraq
Ministry
Tel. Fax
P.O. Box 2450Baghdad
Ministry of Transport and Communications
+964 1 718 0400+964 1 718 2125
Jordan
Ministry
Tel. Fax WWW
P.O. Box 9903Amman 11191
Ministry of Information and Communications Technology (MOICT)
+962 6 585 9001+962 6 586 1059
www.moict.gov.jo
Regulator
Tel. Fax WWW
P.O. Box 850967Amman 11185
Telecommunications Regulation Commission
+962 6 586 2020+962 6 586 3641
www.trc.gov.jo
Local telephone service National long distance servicem £ ¤ International telephone service o Cellular mobile service

Telecommunication organizations Arab States
Telecommunication operator(s)
Tel. Fax WWW
PO Box 940821Amman 1194
Jordan Mobile Telephone Services Company (Fast Link)
+962 6 582 8100+962 6 582 8200
www.jmts-fastlink.com.joo
Tel. Fax WWW
P.O. Box 1689Amman 11118
Jordan Telecom Company (JTC) +962 6 461 8301+962 6 465 9666www.jtc.com.jo
m £¤ o
Tel. WWW
P.O. Box 851114Amman 11185
MobileCom +962 77 700177www.mobilecom.joo
Kuwait
Ministry
Tel. Fax WWW
P.O. Box 318111 11 Safat
Ministry of Communications +965 819 033+965 481 8696www.moc.kw
m £¤
Telecommunication operator(s)
Tel. Fax WWW
P.O. Box 318111 11 Safat
Ministry of Communications +965 819 033+965 481 8696www.moc.kw
m £¤
Tel. Fax WWW
P.O. Box 2224413083 Safat
Mobile Telecommunications Company (K.S.C.)
+965 484 6655+965 483 7755
www.mtc.com.kwm £¤ o
Tel. Fax WWW
Souk Al-KabirBlock-B 8th FloorKuwait City
National Mobile Telecommunications Company
+965 2435500+965 2436600
www.wataniya.como
Lebanon
Ministry
Tel. Fax WWW
Avenue Sami el Solh Beyrouth
Ministère des Télécommunications +961 1 888 088+961 1 427 111
www.mpt.gov.lbm £¤
Telecommunication operator(s)
Tel. Fax
Avenue Sami el SolhBeyrouth
Direction générale des télécommunications
+961 1 888 150+961 1 888 600
m £¤
Tel. Fax WWW
Palm CenterFurn El CheblakB.P. 50257Beyrouth
FTML Cellis +961 3 391 000+961 3 391 009
www.cellis.com.lbo
Local telephone service National long distance servicem £ ¤ International telephone service o Cellular mobile service

Telecommunication organizations Arab States
Tel. Fax WWW
Libancell BuildingAvenue Charles HelouB.O. Box 136406Beyrouth
Libancell s.a.l. +961 3 792 000+961 3 792 020
www.libancell.com.lbo
Libya
Ministry
Tel. Fax
P.O. Box 81686Tripoli
General Directorate of Posts and Telecommunications (GDPT)
+218 21 360 41 01+218 21 360 41 02
Telecommunication operator(s)
Tel. Fax
El Madar Telephone Co. +218 21 360 22 10+218 21 360 22 02o
Tel. Fax WWW
P.O. Box 886Tripoli
General Post and Telecommunication Company (GPTC)
+218 21 361 90 11-30+218 21 360 14 30
www.mpt.gov.lbm £¤
Mauritania
Ministry
Tel. Fax
P.O. Box 195Nouakchott
Ministère de l'Intérieur, des Postes et Télécommunications
+222 525 20 94+222 525 20 20
Regulator
Tel. Fax WWW
B.P. 4908Nouakchott
Autorité de Régulation +222 529 12 70+222 529 12 79
www.are.mr
Telecommunication operator(s)
WWW
Mauritel Mobiles www.mauritelmobiles.mr
o
Tel. Fax WWW
P.O. Box 7000Nouakchott
Société Mauritanienne des Télécommunications (MAURITEL)
+222 525 2340/7600+222 525 1700
www.opt.mrm £¤
Morocco
Ministry
Tel. Fax WWW
Boulevard Moulay El Hassan10000 Rabat
Secrétariat d'Etat chargé de la Poste et des Technologies des Télécommunications et de l'Information
+212 37 76 25 07+212 37 76 08 28
www.septi.gov.mawww.mincom.gov.ma
Regulator
Tel. Fax WWW
Centre d'affaire BD Ar-RyadHay Ryad B.p. 293910100 Rabat
Agence Nationale de Réglementation des Télécommunications (ANRT)
+212 3 7 71 84 00+212 3 7 71 64 89www.anrt.net.ma
Local telephone service National long distance servicem £ ¤ International telephone service o Cellular mobile service
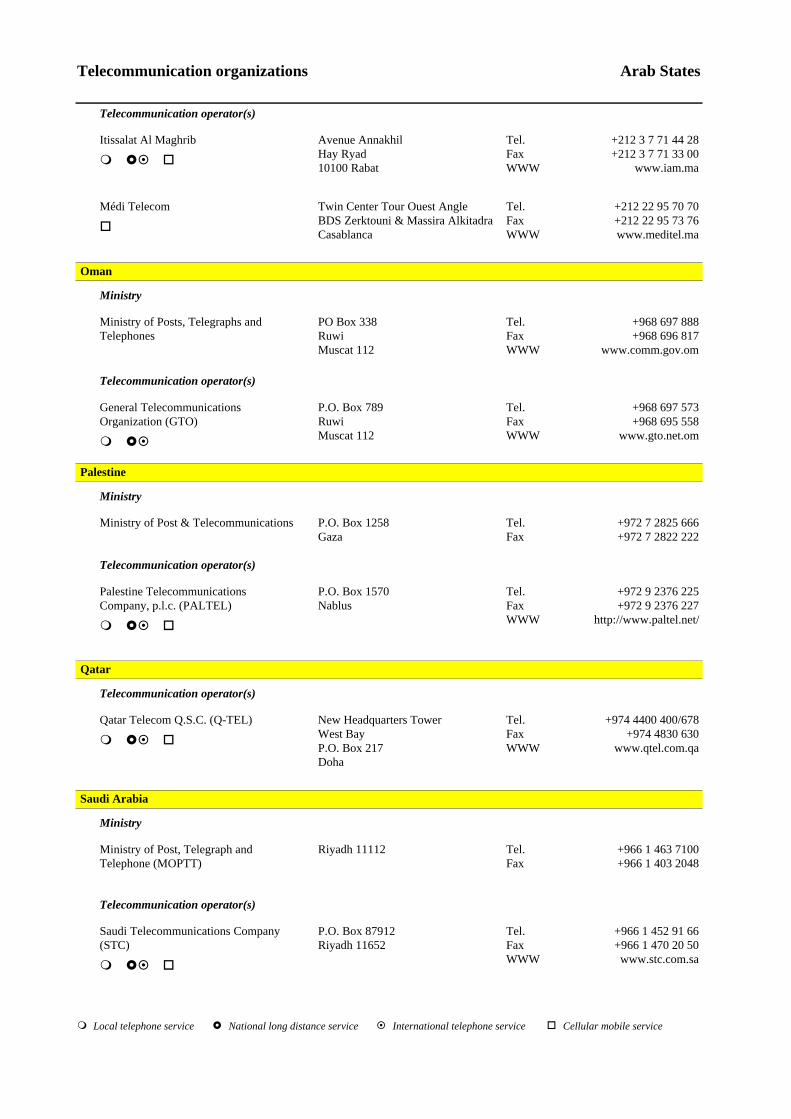
Telecommunication organizations Arab States
Telecommunication operator(s)
Tel. Fax WWW
Avenue AnnakhilHay Ryad10100 Rabat
Itissalat Al Maghrib +212 3 7 71 44 28+212 3 7 71 33 00
www.iam.mam £¤ o
Tel. Fax WWW
Twin Center Tour Ouest AngleBDS Zerktouni & Massira AlkitadraCasablanca
Médi Telecom +212 22 95 70 70+212 22 95 73 76www.meditel.ma
o
Oman
Ministry
Tel. Fax WWW
PO Box 338RuwiMuscat 112
Ministry of Posts, Telegraphs and Telephones
+968 697 888+968 696 817
www.comm.gov.om
Telecommunication operator(s)
Tel. Fax WWW
P.O. Box 789RuwiMuscat 112
General Telecommunications Organization (GTO)
+968 697 573+968 695 558
www.gto.net.omm £¤
Palestine
Ministry
Tel. Fax
P.O. Box 1258Gaza
Ministry of Post & Telecommunications +972 7 2825 666+972 7 2822 222
Telecommunication operator(s)
Tel. Fax WWW
P.O. Box 1570Nablus
Palestine Telecommunications Company, p.l.c. (PALTEL)
+972 9 2376 225+972 9 2376 227
http://www.paltel.net/m £¤ o
Qatar
Telecommunication operator(s)
Tel. Fax WWW
New Headquarters TowerWest BayP.O. Box 217Doha
Qatar Telecom Q.S.C. (Q-TEL) +974 4400 400/678+974 4830 630
www.qtel.com.qam £¤ o
Saudi Arabia
Ministry
Tel. Fax
Riyadh 11112Ministry of Post, Telegraph and Telephone (MOPTT)
+966 1 463 7100+966 1 403 2048
Telecommunication operator(s)
Tel. Fax WWW
P.O. Box 87912Riyadh 11652
Saudi Telecommunications Company (STC)
+966 1 452 91 66+966 1 470 20 50www.stc.com.sam £¤ o
Local telephone service National long distance servicem £ ¤ International telephone service o Cellular mobile service
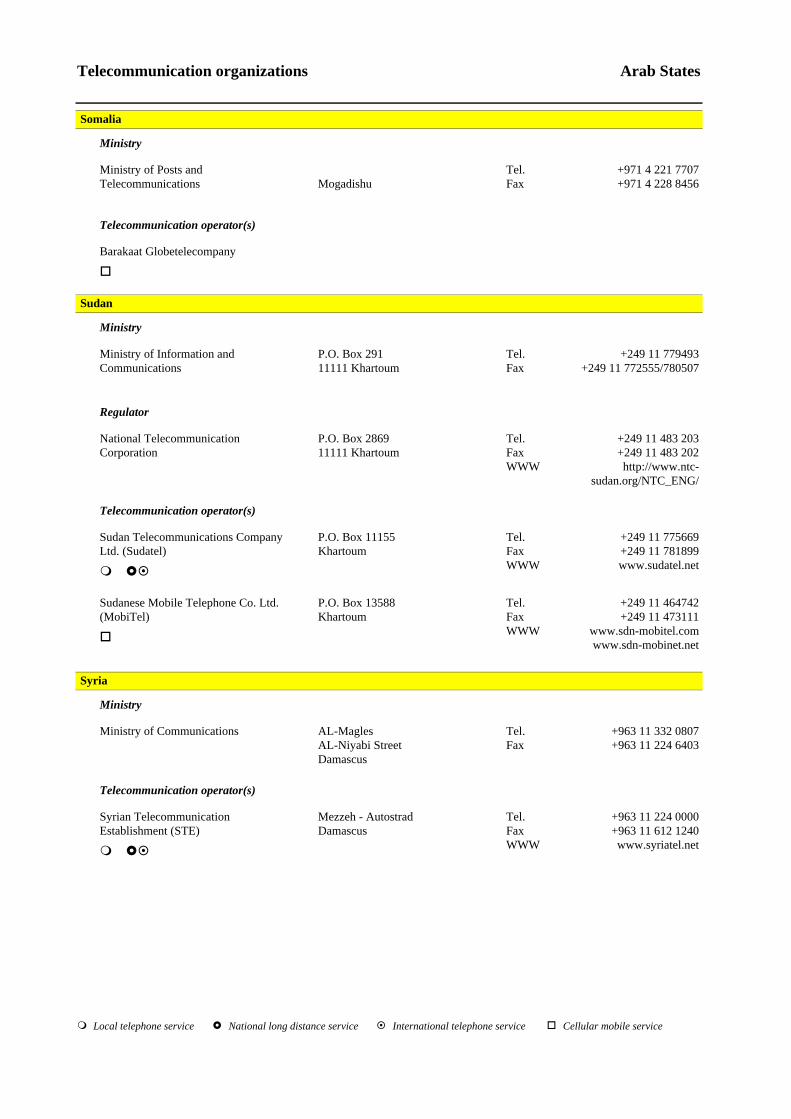
Telecommunication organizations Arab States
Somalia
Ministry
Tel. Fax
Mogadishu
Ministry of Posts and Telecommunications
+971 4 221 7707+971 4 228 8456
Telecommunication operator(s)
Barakaat Globetelecompany
o
Sudan
Ministry
Tel. Fax
P.O. Box 29111111 Khartoum
Ministry of Information and Communications
+249 11 779493+249 11 772555/780507
Regulator
Tel. Fax WWW
P.O. Box 286911111 Khartoum
National Telecommunication Corporation
+249 11 483 203+249 11 483 202http://www.ntc-
sudan.org/NTC_ENG/
Telecommunication operator(s)
Tel. Fax WWW
P.O. Box 11155Khartoum
Sudan Telecommunications Company Ltd. (Sudatel)
+249 11 775669+249 11 781899www.sudatel.netm £¤
Tel. Fax WWW
P.O. Box 13588Khartoum
Sudanese Mobile Telephone Co. Ltd. (MobiTel)
+249 11 464742+249 11 473111
www.sdn-mobitel.comwww.sdn-mobinet.net
o
Syria
Ministry
Tel. Fax
AL-MaglesAL-Niyabi StreetDamascus
Ministry of Communications +963 11 332 0807+963 11 224 6403
Telecommunication operator(s)
Tel. Fax WWW
Mezzeh - AutostradDamascus
Syrian Telecommunication Establishment (STE)
+963 11 224 0000+963 11 612 1240www.syriatel.netm £¤
Local telephone service National long distance servicem £ ¤ International telephone service o Cellular mobile service
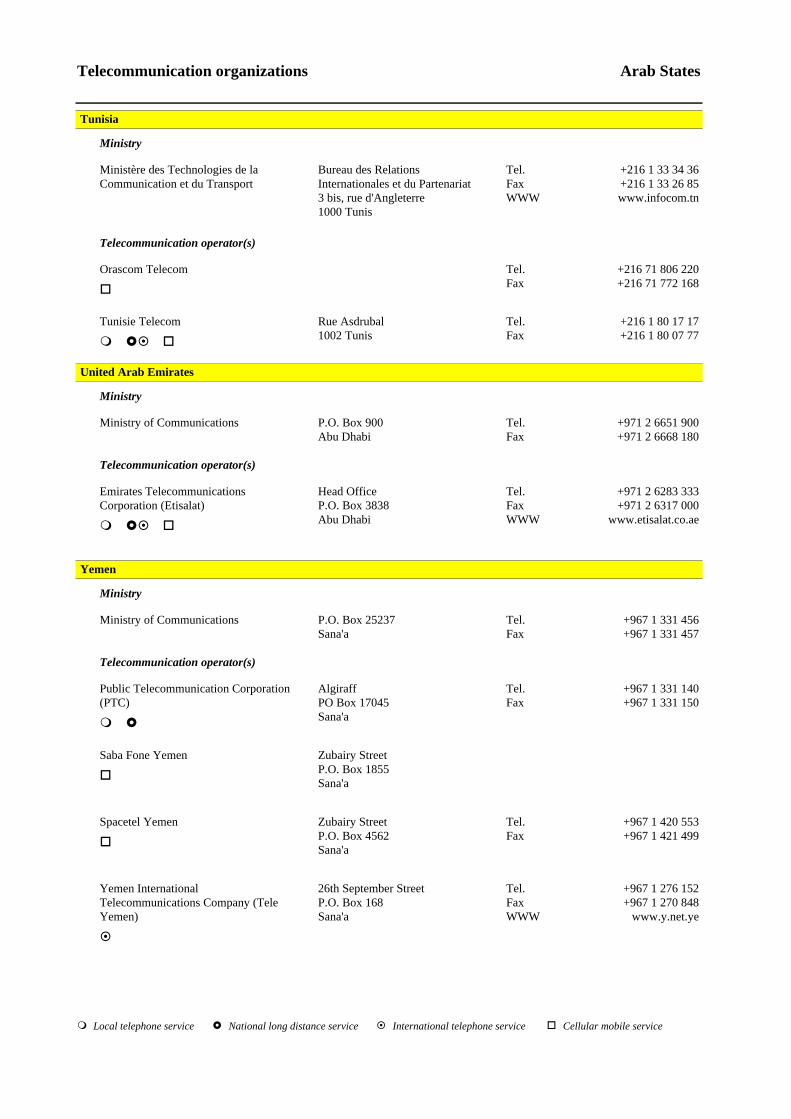
Telecommunication organizations Arab States
Tunisia
Ministry
Tel. Fax WWW
Bureau des Relations Internationales et du Partenariat3 bis, rue d'Angleterre1000 Tunis
Ministère des Technologies de la Communication et du Transport
+216 1 33 34 36+216 1 33 26 85www.infocom.tn
Telecommunication operator(s)
Tel. Fax
Orascom Telecom +216 71 806 220+216 71 772 168o
Tel. Fax
Rue Asdrubal1002 Tunis
Tunisie Telecom +216 1 80 17 17+216 1 80 07 77m £¤ o
United Arab Emirates
Ministry
Tel. Fax
P.O. Box 900Abu Dhabi
Ministry of Communications +971 2 6651 900+971 2 6668 180
Telecommunication operator(s)
Tel. Fax WWW
Head OfficeP.O. Box 3838Abu Dhabi
Emirates Telecommunications Corporation (Etisalat)
+971 2 6283 333+971 2 6317 000
www.etisalat.co.aem £¤ o
Yemen
Ministry
Tel. Fax
P.O. Box 25237Sana'a
Ministry of Communications +967 1 331 456+967 1 331 457
Telecommunication operator(s)
Tel. Fax
Algiraff PO Box 17045Sana'a
Public Telecommunication Corporation (PTC)
+967 1 331 140+967 1 331 150
m £
Zubairy StreetP.O. Box 1855Sana'a
Saba Fone Yemen
o
Tel. Fax
Zubairy StreetP.O. Box 4562Sana'a
Spacetel Yemen +967 1 420 553+967 1 421 499o
Tel. Fax WWW
26th September StreetP.O. Box 168Sana'a
Yemen International Telecommunications Company (Tele Yemen)
+967 1 276 152+967 1 270 848
www.y.net.ye
¤
Local telephone service National long distance servicem £ ¤ International telephone service o Cellular mobile service
Technical notes Demography, Economy The data for Population are mid-year estimates from the UN unless otherwise noted. The data for Gross Domestic Product (GDP) are generally from the IMF. They are current price data in national currency. Gross Fixed Capital Formation includes outlays of industries, producers of government services and producer of private non-profit services to households, on additions to their stocks of fixed assets less, net sales of similar second-hand and scrapped goods. Average exchange rate per US$ is the most frequently used conversion rate regularly published by the IMF and refers to annual average based on the exchanges rates communicated to the IMF by the monetary authority of each member country and agreed by the Fund. For countries where the IMF rate is unavailable or where the exchange rate typically applied to foreign exchange transactions differs markedly from the official IMF rate, a World Bank conversion rate is used. Consumer Price Index is the most frequently used indicator of inflation and reflect changes in the cost of acquiring a fixed basket of good and services by the average consumer. Telephone network Main telephone lines refer to telephone lines connecting a customer's equipment (e.g., telephone set, facsimile machine) to the Public Switched Telephone Network (PSTN) and which have a dedicated port on a telephone exchange. Note that for most countries, main lines also include public payphones but do not include mobile cellular subscribers. Main telephone lines per 100 inhabitants is calculated by dividing the number of main lines by the population and multiplying by 100. % digital main lines is calculated by dividing the number of main lines connected to digital exchanges by the total number of main lines. Waiting list shows the total number of applications for a connection to a main telephone line which have had to be held over owing to a lack of technical availability. It should be noted that the waiting list refers to applications received; it does not include figures for those who desire a telephone line but have not submitted an application. Public pay phones refers to the total number of all types of public telephones, including coin- and card-operated ones. Some countries include public phones installed in private establishments. No distinction is made between operational and not operational payphones. Mobile services Cellular telephone subscribers refers to users of portable telephones subscribing to an automatic public mobile telephone service which provides access to the Public Switched Telephone Network (PSTN) using cellular technology. This can include analogue and digital cellular systems but should not include non-cellular systems. Subscribers to public mobile data services or radio paging services should not be included in this definition. Staff Full-time telecommunication staff is the full-time staff employed by telecommunication network operators in the country for the provision of public telecommunication services. Part -time staff should be expressed in terms of full-time staff equivalents. As far as possible, staff not working principally for the provision of telecommunications services (e.g. those working in postal services or broadcast operations) should be excluded. Main telephone lines per employee is obtained by dividing the number of main telephone lines by the number of employee. Revenue and expense Total telecom revenue consists of the revenues (turnover) received from providing telecommunication services in each country and earned during the financial year under review. Telecom revenue as a % of GDP shows current telecommunication revenues divided by Gross Domestic Product (GDP) and expressed as a percentage. Capital expenditure Annual investment in telecom is the expenditure associated with acquiring the ownership of property (including intellectual and non-tangible property such as computer software) and plant. These include expenditure on initial installations and on additions to existing installations where the usage is expected to be over an extended period of time. Also referred to as "capital expenditure". Telecom investment as % of GFCF shows telecommunications investment divided by Gross Fixed Capital Formation (GFCF) and expressed as a percentage. Broadcasting Television receivers represent the estimated total number of both black and white and colour television sets in use. Some countries have a licensing scheme where television sets must be registered. Since households may have more than one television receiver or may not register, the number of licensed receivers may understate the true number especially if there is widespread avoidance of the licensing scheme. These data are generally submitted by annual questionnaire completed to broadcasting authorities; in a few instances data have been drawn from UNESCO. Television receivers per 100 inhabitants is obtained by dividing the number of television receivers by the total population and multiplying by 100.

Information Technology Number of Personal Computers shows the number of Personal Computers (PCs) in the economy. Internet users is based on reported estimates, derivations based on reported Internet subscriber counts, or calculated by multiplying the number of Internet hosts by a certain multiplier.

Data sources Demographic and economic Demographic and economic statistics were obtained from the following organizations:
International Monetary Fund. Various years. International Financial Statistics. Washington D.C. United Nations (UN). Various years. Monthly Bulletin of Statistics. New York. UNESCO. Various years. Statistical Yearbook . Paris
Telecommunications Telecommunications data are from the ITU/BDT's World Telecommunication Indicators database. The data are obtained by questionnaires sent to telecommunication ministries, regulators and operators as well as from annual reports issued by telecommunication entities and reports prepared by ITU staff.