arab republic of egypt agricultural...
TRANSCRIPT

ARAB REPUBLIC OF EGYPT MINISTRY OF AGRICULTURE AND LAND RECLAMATION
(MALR)
AGRICULTURAL RESEARCH CENTER (ARC)
SOILS & WATER AND ENVIRONMENT RESEARCH INSTITUTE (SWERI)
EGYPT FARM- LEVEL IRRIGATION MODERNIZATION PROJECT (EFIMP)
ENVIRONMENTAL IMPACT ASSESSMENT (EIA)
July 2010
E2521
Pub
lic D
iscl
osur
e A
utho
rized
Pub
lic D
iscl
osur
e A
utho
rized
Pub
lic D
iscl
osur
e A
utho
rized
Pub
lic D
iscl
osur
e A
utho
rized
Pub
lic D
iscl
osur
e A
utho
rized
Pub
lic D
iscl
osur
e A
utho
rized
Pub
lic D
iscl
osur
e A
utho
rized
Pub
lic D
iscl
osur
e A
utho
rized
I
Table of Contents
EXECUTIVE SUMMARY........................................................................................... X
1. INTRODUCTION ....................................................................................................1
1.1 Background.......................................................................................................2 1.2 Environmental Assessment Study ....................................................................4
1.2.1 EIA Concept and Rationale.........................................................................4 1.2.2 EIA Objectives ............................................................................................5 1.2.3 Approach and Methodology ........................................................................5
2. POLICY, LEGAL, AND ADMINISTRATIVE FRAME WORK.................................8
2.1 Policy Framework .............................................................................................8 2.2 Legal Framework and Guidelines ...................................................................10 2.3 World Bank Safeguard Policies.......................................................................15
3. PROJECT DESCRIPTION ...................................................................................17
3.1 Project Rationale.............................................................................................17 3.2 Proposed Objectives .......................................................................................18 3.3 Project Description..........................................................................................18 3.4 Project Areas .................................................................................................20
4. BASELINE ENVIRONMENTAL PROFILE...........................................................21
4.1 Description of Project Command areas...........................................................21 4.1.1 Middle Nile Delta - Wasat and Manaifa Command areas .........................21 4.1.2 Western Nile Delta - Mahmoudia Command Area ...................................22
4.2 Water Quality Status .......................................................................................26 4.2.1 Water Quality Assessment Parameters and Guidelines ...........................26 4.2.2 Meet Yazeed Irrigation Network................................................................26 4.2.3 Meet Yazeed Drainage Network ...............................................................32 4.2.4 Mahmoudia Irrigation Network ..................................................................36 4.2.5 Water Quality Status in Mahmoudia Drainage Network ............................39
4.2.5.1 Edko Drain System ............................................................................39 4.2.5.2 Oumum Drain System........................................................................40
4.3 Environmental Profile Mahmoudia Canal Command Area ..............................44 4.3.1 Water Resources ......................................................................................44 4.3.2 Soil Quality................................................................................................46 4.3.3 Air Quality and Meteorology......................................................................47 4.3.4 Biological Environment .............................................................................48
4.3.4.1 Lake Maryut .......................................................................................48 4.3.4.2 Lake Edku..........................................................................................48 4.3.4.3 Flora and Fauna................................................................................49
4.3.5 Socio-Economic and Cultural Environment...............................................50 4.3.5.1 Population and Human Settlements...................................................50 4.3.5.2 Agricultural Cropping Patterns ...........................................................52 4.3.5.3 Archeological Sites ............................................................................53 4.3.5.4 Industrial Areas and Activities ............................................................53

II
4.4 Environmental Profile Meet Yazid Command Area .........................................54 4.4.1 Water Resources ......................................................................................54 4.4.2 Soil Quality................................................................................................55 4.4.3 Air Quality and Meteorology......................................................................56 4.4.4 Biological Environment ............................................................................56
4.4.4.1 Lake Burullus .....................................................................................56 4.4.4.2 Fishing Areas.....................................................................................58
4.4.5 Socio-Economic and Cultural Environment...............................................58 4.4.5.1 Population and Human Settlements...................................................58 4.4.5.2 Agricultural Cropping Patterns ...........................................................60 4.4.5.3 Archeological Sites ............................................................................61 4.4.5.4 Industrial Areas and Activities ............................................................61
5. ENVIRONMENTAL IMPACT ASSESSMENT (EIA).............................................62
5.1 Soil Properties.................................................................................................62 5.2 Soil Salinity .....................................................................................................62 5.3 Water Quality ..................................................................................................63 5.4 Saline Drainage ..............................................................................................63 5.5 Saline Groundwater ........................................................................................63 5.6 Sedimentation .................................................................................................64 5.7 Fast-tracked sampling & analysis of the baseline water quality data in the FIMP command areas: ...................................................................................................64
5.7.1 Framework ................................................................................................64 5.7.2 Laboratory Analysis ..................................................................................65 5.7.3 Results......................................................................................................66
5.8 Significant Impact of FIMP ..............................................................................78 5.9 Public Consultation Feedback.........................................................................78 5.10 Mitigation Measures......................................................................................79
5.10.1 Agriculture Practice.................................................................................79 5.10.2 Monuments and historical property .........................................................80 5.10.3 Measures for Civil Works ........................................................................80
5.10.3.1 Protection of Environment................................................................80 5.10.3.2 Transportation..................................................................................81 5.10.3.3 Employment .....................................................................................81 5.10.3.4 Quarries and Areas of the Supply of Construction Materials ...........81 5.10.3.5 Earth Works .....................................................................................82 5.10.3.6 Disposal of Construction Waste.......................................................82
5.10.4 Socio-Economic ......................................................................................83
6. ANALYSIS OF ALTERNATIVES .........................................................................84
6.1 Project Site Alternatives ..................................................................................84 6.2 Technology and Design Alternatives...............................................................84 6.3 Operation Alternatives ....................................................................................84
7. ENVIRONMENTAL MANAGEMENT PLAN (EMP) .............................................85
7.1 Impacts and Measurements Associated with Irrigation and Drainage Schemes 85 7.2 Environmental Management Plan Elements for FIMP ....................................88 7.3 Management Plan Details for FIMP ................................................................88 7.4 Environmental Management Plan Budget.......................................................90
III
7.5 EIA/EMP Reporting During FIMP Implementation ..........................................96 7.6 Institutional Setup for EMP Implementation ....................................................97
8. PEST MANAGEMENT PLAN ..............................................................................99
8.1 Regulatory, Institutional and Policy Framework for Pest Control in Egypt ......99 8.1.1 Institutional Framework.............................................................................99 8.1.2 IPM Policy at the Ministry of Agriculture..................................................100
8.2 Pesticides Handling in the Project Areas ......................................................102 8.3 Integrated Pest Management (IPM) ..............................................................103
ANNEX (1): SCOPE OF WORK FOR THE EIA AND EMP OF EGYPT FIMP.......105
ANNEX (2): IRRIGATION WATER DEMAND AND REQUIREMENTS ................106
ANNEX (3): FIELD IRRIGATION AND DRAINAGE STATUS............................107
IV
List of Tables
Table (1.1): List of Interviewed Farmers from various locations .................................7
Table (2.1): Principal Environmental Laws, Decrees and Regulations .....................12 Table (2.2): Safe Guard Policy Applicability Table....................................................15
Table (4.1): Water Quality Monitoring Locations In Meet Yazeed Command Area...22 Table (4.2): Water Quality Monitoring Locations In Mahmoudyia Command Area ...23 Table (4.3): Drainage Fresh water quality standards/guidelines,, ............................26 Table (4.4): water quality standards/guideline .........................................................26 Table (4.5): Guidelines for interpretation of water quality………………………………………27 Table (4.6): Water Resources and Demand in MCA ................................................44 Table (4.7): Soil Characteristics in the MCA.............................................................47 Table (4.8): Prevalent Meteorological Conditions in Nile Delta.................................47 Table (4.9): Administrative Divisions, Population and Level of Income in MCA........51 Table (4.10): Marakez, Rural Units and Sub Villages in MCA ..................................51 Table (4.11): Summer and Winter Cropping Patterns in MCA..................................52 Table (4.12): Pesticides Estimated Consumption in Mahmoudia Area .....................53 Table (4.13):Power plants in the vicinity of the command area ................................53 Table (4.14): Water Resources and Sectoral Demand in MYC ................................54 Table (4.15): Zones of the lake Burullus..................................................................57 Table (4.16):Administrative Divisions, Population and Level of Income in MYC.......58 Table (4.17): Marakez, Rural Units and Sub Villages in MYC ..................................60 Table (4.18): Pesticides Estimated Consumption in Meet Yazeed ...........................61
Table (5.1): Chemical Analysis of Collected Water Samples of EIA/FIMP Areas ....68 Table (5.2): Macro, Micro-Nutrients and Heavy Metals Concentration in the Collected Water Samples of EIA/FIMP Areas ..........................................................................70 Table (5.3) : Microbial, Pesticides and Parasites Status of the Collected Water Samples of EIA/FIMP Areas....................................................................................72 Table (5.4) : Chemical Analysis of Collected Soil Samples of EIA/FIMP Areas........73 Table (5.5): Macro; Micro-Nutrients and Heavy Metals Concentration in the Collected Soil Samples of EIA/FIMP Areas ..............................................................................74 Table (5.6) : Bacteria Status of the Collected Soil Samples of EAI/FIMP Areas.......75 Table (5.7): Macro, Micro Nutrients and Heavy-Metal Concentrations in Plant Tissues Samples of EIA/FIMP Areas........................................................................76 Table (5.8): Bacteria Analysis of the Collected Plant Tissues Samples of EIA/FIMP Areas ........................................................................................................................77 Table (5.9): Rough Estimate of Significant Impact of FIMP ......................................78 Table (5.10): Percentage of consulted farmers agreeing on impacts of FIMP..........79
Table (7.1): Long list of General Impacts Associated with non-sustainable Irrigation and Drainage Schemes and the Related Mitigation at Farm Level...........................85 Table (7.2): FIMP likely Negative Impacts, Preventative Actions and Mitigations....87 Table (7.3): Summary Environmental Monitoring .....................................................89 Table (7.4): Summary EMP Activities and Budget....................................................91

V
Table (8.1): The pesticide consumption from 1985 to 1994 (Thousand tons).........101 Table (8.2): Main Pesticides Used in Egypt ............................................................103

VI
List of Figures
Figure (3.1): Marwa Improvment Process ................................................................19
Figure (4.1): National monitoring locations of the irrigation system in the Nile Delta Regions ....................................................................................................................24 Figure (4.2): National monitoring locations of the drainage system in the Nile Delta Regions ....................................................................................................................25 Figure (4.3): DO Box Plot at Meet Yazeed Irrigation network ...................................30 Figure (4.4): TDS Box Plot at Meet Yazeed Irrigation network .................................30 Figure (4.5): EC Box Plot at Meet Yazeed Irrigation network ...................................31 Figure (4.6): PH Box Plot at Meet Yazeed Irrigation network ...................................31 Figure (4.7): DO Box Plot at Meet Yazeed drainage network...................................34 Figure (4.8): TDS Box Plot at Meet Yazeed drainage network .................................34 Figure (4.9): EC Box Plot at Meet Yazeed drainage network ...................................35 Figure (4.10): PH Box Plot at Meet Yazeed drainage network .................................35 Figure (4.11): DO Box Plot at Mahmoudia Irrigation network ...................................37 Figure (4.12): TDS Box Plot at Mahmoudia Irrigation network .................................37 Figure (4.13): EC Box Plot at Mahmoudia Irrigation network....................................38 Figure (4.14): PH Box Plot at Mahmoudia Irrigation network....................................38 Figure (4.15): DO Box Plot at Edko and Omum Drainage network...........................42 Figure (4.16): TDS Box Plot at Edko and Omum Drainage network.........................42 Figure (4.17): EC Box Plot at Edko and Omum Drainage network ...........................43 Figure (4.18): PH Box Plot at Edko and Omum Drainage network ...........................43 Figure (4.19): Administrative Boundary of the Various Marakez and main human settlements ...............................................................................................................51 Figure (4.20): Administrative Boundary of the MYC Marakez and Main Settlements...............................................................................................................59
Figure (7.1): Institutional Setup for Emp Implementation..........................................98
Figure (8.1): Classification of IPM Alternatives .......................................................104
VII
LIST OF ABBREVIATIONS
SBR Sugar beet Root ARC Agriculture Research Center SBS Sugar beet Shoot B Boron WG Wheat Grain BOD Biochemical Oxygen Demand WS Wheat Straw Ber Berseem CA Canal Command Area Ca Calcium CAAE Central Administration for Agriculture Extension CASWE Central Administration for Soil, Water and Environment CCREM Canadian Council of Resource and Environment Ministers Cd Cadmium CDA The Environment Controlled Droplet Application Cfu Colony Forming Unit Cl Chloride CLEQM Central Laboratory for Environmental Quality Monitoring Co Cobalt COD Chemical Oxygen Demand Cr Chromium Cu Copper DW Drain Water DO Dissolved Oxygen DRI Drainage Research Institute EA Environmental Assessment EALIP The Executive Authority for Land Improvement Projects EC Electrical Conductivity ECw Mean Electrical Conductivity EEAA Egyptian Environment and Affairs Agency EFIMP Egypt Farm-Level Irrigation Modernization Project EIA Environmental Impact Assessment EMP Environmental Management Plan EMU Environmental Management Unit EPA Environmental Protection Agency ETo Evapotranspiration EUR Europe FAO Food and Agriculture organization FC Fecal Coliform Fe Iron FIMP EG-Farm-Level Irrigation Modernization Project GDP The Gross Domestic Product GOE The Government of Egypt GW Ground Water HCO3 Bicarbonate IBRD International Bank for Reconstruction and Development IDOS Institutional Development and Organizational Strengthening IIIMP Integrated Irrigation Improvement and Management Project
VIII
IIP The Completed Irrigation Improvement Project ILO International Labour Organization IPCS The International Programme on Chemical Safety IPM Integrated Pest Management Irw Irrigation Water K Potassium MALR Ministry of Agriculture and Land Reclamation MCA The Mahmoudia Canal Command Area Mg Magnesium MG03 Mahlet Ruh P.S. for mixing drainage water with Miet Yazeed canal MG04 Outfall of Samtay drain into Gharbia drain MG07 Outfall of drain no.6 into of Gharbia drain MG14 Outfall of into of Gharbia drain MHUUC Ministry of Housing, Utilities and Urban Comminuting MI07 Miet Yazeed Canal downstream Mahlet Ruh drain reuse P.S. MI11 Miet Yazeed Canal downstream Kafr el-Sheikh city Mn Manganese MOEA Ministry of Environmental Affairs MOHP Ministry of Health and Population MSEA Ministry of state for Environmental Affairs MSL Mean Sea Level MWRI Ministry of Water Resources and Irrigation MYC Meet Yazid Command Area M701 Outfall of drain no.7 into Lake Brullus M801 Outfall of lower drain no.8 into Lake Brullus Na Sodium NaHCO3 Bicarbonate Soduim Nd Not detected NEAP National Environmental Action Plan NH4-N Ammonium- Nitrogen Ni Nickel NO3-N Nitrate-Nitrogen NWRP National Water Resource Plan OP The World Bank’s Operational Policy P Phosphorus Pb Lead PBDAC Principal Bank for Development and Agricultural Credit pH Hydrogen ion Activity PHIs The Pre-harvest Intervals PIM Participatory Irrigation Management PMP Pest Management Plan PT The Preparation Study Team Q Discharge RIGW Research Institute for Groundwater RSC Residual Sodium Carbonate SAR Sodium Adsorption Ratio SO4 Sulphate SWERI Soils & Water and Environment Research Institute TDS Total Dissolved Solids TOR Term of Reference
IX
UNDP The United Nations Development Programme UNEP United Nations Environment Programme ULV The Ultra Volume Sprayers USA United States of America
USAID United States Agency for International Development
WE03 Zarkon P.S for Lifting Drainage water to Edko downstream Shubrakhit P.Sł
WE07 Khairy P.S.for Lifting drainage water from Khairy drain to Edko drain
WE08 Halq El-Gammal P.S for Lifting drainage water from Halq El-Gammal drain to Edko drain
WHO World Health Organization WI08 Mahmoudyia canal upstream the Kafr El-Dawar drinking water intake WI09 Mahmoudyia canal upstream Alex-andria drinking water intake WI11 Mahmoudyia canal upstream of Edko reuse pump Station WM Water Quantity Management WQMPC Water Quality Management and Pollution Control WT Water Table
WTO World Trade Organization
WU01 Abo Hommes P.S for lifting drainage water from Abo Hommes drain to Omum drain
WU05 Dishidi P.S.for lifting drainage water from Dishudi drain to Omum drain
WU07 Abies P.S for lifting drainage water for lifting drainage water from Abies drain to Omum drain
Zn Zinc

X
Executive Summary Egypt Farm-level Irrigation Modernization Project (EFIMP) Environmental Impact Assessment and Management Plan
Introduction Given the current water shortages in Egypt, the most important output of On-Farm Water Management interventions is improving water productivity by saving water while improving crop yield and quality, together with mitigating the negative impacts on the environment. The benefits to farmers stem from reduction of production costs due to reducing the water applied and hence reducing energy costs and labor for irrigation. The saved water can be used to eliminate water shortage in the old-lands tail ends or to serve the new lands. As the potential for mobilizing additional water resources is very limited in Egypt, water saving constitutes the most promising option for meeting increasing water demands for agricultural expansion and for the agriculture sector to release water to other users. Another untraditional water resource that can be used is reusing agricultural drainage. However, it results in lower yield and adverse impacts on the environment due to its low quality. Project objectives The project development objective is to increase the irrigation efficiency and productivity of around 200,000 feddans. Improvements water productivity and reduction in energy and labor costs have been demonstrated in the “W10 pilot area” of IIIMP, the ongoing WB-supported MWRI project. The EFIMP project would also help to strengthen the delivery of farmer support services. The project’s success would be measured by the following indicators:
� reduced water consumption and increased irrigation efficiency as measured by water use per unit area (m3/feddan) and net return per unit of water used;
� increased farmer income as measured by real annual net return from crop production per unit land area (LE/feddan); and
� improved extension service delivery and performance monitoring. Project Description and components The GOE/MALR is mobilizing donors to support GOE strategy, and requested Bank’s assistance to address farm-level irrigation modernization on about 200,000 feddans as a first phase of the longer-term GOE program. The Bank’s objectives in the agriculture sector, as consistently expressed over the last three CASs, have included improving the management and efficiency of the use of water and land resources. The FIMP is explicitly in line with these objectives. The proposed project would be implemented through two components over five-year period:
� Component 1: Farm-Level Irrigation Improvements (approximately US$80 million). This component would support marwa and farm-level irrigation modernization for farmers on 200,000 feddans primarily in three Delta old-land irrigation command areas (Mahmoudia, Manaifa and Meet Yazid).
� Component 2: Farm-level Technology Development and Dissemination (approximately US$20 million). The component would strengthen relevant MALR agencies and organizations responsible for implementation and O&M of the irrigation systems through training and improved information and monitoring systems, and would encompass project management including monitoring and evaluation (M&E).

XI
EIA objectives The environmental impact of irrigation at the farm level is of increasing importance to the Egyptian agriculture. The aim of Environmental Impact Assessment (EIA) is to identify and mitigate the impacts of the proposed irrigation improvements on soil, water and surrounding environment. EFIMP will explore ways in which farmers could improve productivity by using less chemical fertilizers and irrigation water and will monitor potential changes in the agriculture environment.
The main objective of this environmental study is to furnish the appropriate information about the outcome and environmental impacts of this project so that decision-makers can take proper remedial/prevention actions if needed. Furthermore, the decision maker will want to know if the proposed project is likely to produce the targeted positive results. Thus, the following are the study directives:
� Investigate the impact of the proposed interventions on the EFIMP areas, on the agricultural and human environment.
� Assess both the positive and negative environmental impacts during construction and operation of the proposed EFIMP.
� Suggest mitigation measures to enhance positive impacts and reduce negative impacts through compensation plans for the impacted areas, careful design, construction and operation of the project features.
� Enhance capacity building in the field of environmental impacts and improve public awareness.
Approach for the performance of the EIA & EMP The basic approach for the performance of the EIA & EMP study included:
� Experience Review: particularly those environmental experiences gained by the MALR previous and ongoing project. All these projects were reviewed and a commentary on the experiences gained and lessons learned were reflected in the EIA study’s inception report.
� Document Review: Existing and relevant research studies relevant to the scope of the EIA was compiled and reviewed by the consultants. The aim is to develop and build on the baseline information.
� Interviews: the consultant during the course of the study has interviewed key MALR officials, district engineers, and community representatives in addition to various experts involved with the MWRI projects and the IIIMP in specific. This enabled taking a first-hand, in-depth look at the factors influencing the key environmental conditions and threats in the command area and how the perceived interventions would alleviate and/or add to those pressures.
� Field Visits: To formulate a complete picture of the existing environmental profile in each area, the team performed several field visits to all the command areas during which discussions were held with farmers and local administration officials.
� Public Consultations: One public consultation was held during the study timeline, with farmer representatives.
� Conduct EIA/EMP for preparation/appraisal of EFIMP. During EFIMP preparation, a baseline data collection and analysis was carried out focusing on water quality (irrigation and drainage) and soil characteristics. A field study has been carried out on EFIMP command areas at the farm and merwa levels. SWERI coordinated with EALIP to identify the locations. This study

XII
aimed at collecting samples in water (irrigation and drainage streams); soil; cultivated crops and groundwater (subsurface water). The analysis of samples included the following parameters:
o pH, EC, Cations, Anions, RSC and SAR. o Zn , Fe , Mn , Cu , B, k, P, NO3-N and NH4-N. o Pb, Cd , Cr, Co and Ni. o Pesticides residues (Positive / Negative). o COD and BOD. o Bacteria (Total Coliforms, Feacal Coliforms, Salmonella and Shigella). o Parasites.
� Public Consultation to Community and Stakeholders. SWERI team visited the selected areas in EL-Wasat & Al- manaifa & Al Mahmoudia at Kafr El-Sheikh and El-Behira governorates on 9 June 2010. Ten farmers have been interviewed about:
o The best options for meraw improvement. o The expected benefits from EFIMP. o Create appropriate environmental conditions (EIA/EMP).
WB safeguards policies relevant to project Based on consultation with MALR and the WB appraisal mission, and in accordance with the TOR for this EIA, an analysis was conducted for the WB safeguard policies, as well as the extent to which each policy applies to EFIMP. The analysis was benchmarked against the environmental profile prepared for each command area. The consultant is under the opinion that the safeguard policy on Environmental Assessment (OP4.01) applies to EFIMP, which was designated a Category B project. The EIA has further assessed the extent of safeguard policy on Pest Management (OP 4.09) applicability to EFIMP, taking into consideration that EFIMP will not finance/procure pesticides nor bring new lands into production. The GoE is already applying an Integrated Pest Management (IPM) system where the use of pesticides is reduced considerably. Nevertheless, OP4.09 has been triggered, and a basic Pest Management Plan (PMP) was prepared as part of the EMP in order to ensure compliance with OP4.09 and to contribute to the pool of mitigation/prevention measures needed to control water pollution. Environmental impacts (positive and negative) The EIA conducted by SWERI has noted (from the chemical and biological analysis of collected soil, irrigation, drainage, and plant samples) the following impacts:
� Shallow groundwater table in some areas, which EFIMP can improve. � High salinity in some groundwater samples, which EFIMP can improve. � Irrigation and drainage waters contaminated with bacteria and parasites.
FIMP can improve this. � Positive pesticide residues (i.e. above zero) detected in all irrigation water
samples. However, "positive" does not mean "violating" the permissible standards. For instance, the baseline data from the samples taken in the crop tissues (shoots and roots) indicated that there is sufficient content of macro and micro nutrients in the samples taken from the three EFIMP command areas. This implies that the positive presence of pesticide residues in irrigation water has not negatively impacted crop growth. Control of pesticides application is already an ongoing policy of MALR, and the success of

XIII
enforcing this policy is observed in the general long-term downward trend in misusing pesticides throughout the last two decades.
Benefits due to implementing FIMP would therefore include:
� Improve equity, reliability and convenience of on-farm freshwater delivery; � Increase crop yields at canal tail ends due to reducing soil-water salinity
and/or due to increasing the fresh-water quantity which have direct impact on increasing farm income;
� Improve public health (reduce morbidity and mortality) and water-related recreation.
� Improve soil property due to decreasing soil salinity and water table depth. � Reduce water & soil contamination due to decreasing:
o Losses of NO3 to drains. o Leached chemical pesticides.
� Reduce human health risk from direct contact with contaminated water (Bilharzias).
� Reduce weeds growth. � Reduce drainage flow and load due to deep water table depth, water losses
through seepage and leakage from earth merwas. � Reduce earth Borer risk. � Increase farm income due to lowering the cost of farm inputs, and raising
production due to soil and water quality improvements. Negative impacts due to implementing EFIMP would include:
� The construction sites are largely uninhabited. So, it is expected that there will be minor significant impacts in terms of noise, dust or visual intrusion on the residential areas within the project construction sites.
� During construction, dust production by excavation and transport of construction material will cause slight impact.
� None of the endangered birds and mammals is known to occupy or range into EFIMP areas.
� It is not generally anticipated that any toxic or hazardous materials will be used during this project. Most of the needed materials generally are available from the local market.
EMP implementation
The budget allocated for the EMP subcomponent of EFIMP (housed by EMU in SWERI) may be within US$900,000 from GOE and GSCD grants, because all of the above-listed EMP mitigations are already part of the mandate of SWERI and MALR/EALIP (in coordination with MWRI/IIIMP). The EMP activities include:
Monitoring, Assessment and Mitigation � Assess and mitigate any site-specific excess residues from fertilizers &
pesticides and per the above-mentioned existing national mandate/program of MALR.
� Assess and mitigate any site-specific increase in water salinity and soil salinity & alkalinzation or erosion.
� Ensure that the civil-works contractors abide by the EMP-related clauses of the contract.

XIV
� Evaluate water table depth, salinity and contaminated levels of groundwater, and suggest solutions.
� Monitor soil fertility and crop quality and production.
Technical Assistance � Develop nutrient management practice at farm level. � Develop pest management practice at farm level. � Support EFIMP (EALIP) by providing the M&E indicators on the EMP-related
negative and positive impacts. Public Awareness � Improve farmer public awareness on on-farm environmental management. Capacity Building � Enhance capacity building of SWERI and EALIP in the field of environmental
impact assessment and management, through: o Study tours o Conferences/workshops and tailored training programs.
� Enhance knowledge transfer through o Develop knowledge transfer plan o Conduct meetings and workshops with relevant stakeholders.
Institutional Setup for EMP Implementation Executive Authority for Land Improvement Projects (EALIP) would be responsible for farm-level irrigation improvements at the marwa level, and would coordinate with the Ministry of Water Resources and Irrigation (MWRI) at the interface with the mesqa level. The Agricultural Research Center (ARC) through Soils & Water and Environment Research Institute (SWERI) will lead the EMP implementation with support of other institution of MALR such as:
� Central Administration for Soil, Water and Environment (CASWE) � Central Administration for Agriculture Extension (CAAE) � Environment Quality Sector, Egyptian Environment and Affairs Agency
(EEAA)
SWERI in coordination of the supportive institutions will report to the Executive Authority for Land Improvement Projects (EALIP).
Conclusion The proposed EFIMP interventions and design criteria indicate that there will be no long-term negative impacts. Nevertheless, unavoidable minor negative impacts that are often associated with construction works should be expected and they are likely to result from excavation, transport of construction material. Such undesirable impacts are limited, and should be cleared upon the commissioning of the project. The contractors will follow a wide range of management and construction techniques and procedures to minimize and/or eliminate the pollution hazard, including: adopt suppression measures during the processing and filling operation; minimize visual intrusion and noise during construction by following the national recommendations; maximize daylight operations to minimize noise

XV
disturbance to residents of village; provide sanitation facilities and safeguard health of laborers and conduct environmental monitoring during and after construction for concerned ecological elements. The EFIMP in the Western and Middle Delta Regions is expected to be an environmentally-feasible project, as it will positively impact water resources, crop productivity, soil features, farmers income, and ambient environment.
XVI
:–
�ł�%� �%.�
.�� � �.
� �žžłžžž ��.
.
� �)(�.
�:� �:)�ž(žž
.� �:� �)�
.(
�:- �������
XVII
..
)--(�
.
–�.
�������:
o
.o.o� � �.o� �
.�
–�ž−ž )-–(.
.:�.��.�:––---–-
.�:---�.�.�.�–-.�.

XVIII
... :-�.�.�.�
ož−ž �)--(�
�--.�.
���
o
o
(A, B and C) �)ž−-()B(
�.)ž-(.
�...: �.
�� �)–(
.�� �
�.�� � �
.�.��.

XIX
�� �.�.��
.�.�
)(
���
�����
��
� � ��.
�:−-
������� � �
��
-���� � �

XX
�:-��
.�.
� �:��:
o
o–�–
�� � � � �
�.
� � � ��� �.
� � � ��.� �
� � �.
�� �
.
1
1. INTRODUCTION Irrigated agriculture is crucial to the economy, health and welfare of very large part of the developing world. It is important to be marginalized as it is vital for world food security. However, irrigated agriculture often radically changes land use and is a major consumer of freshwater. Irrigation development has a major impact on the environment. The impacts may be on natural and physical environment and on the human environment as well. All major donors consider large irrigation and drainage developments to be environmentally sensitive. Under water scarcity conditions, the most important output of On-Farm Water Management interventions is the improvement of water productivity by increasing water savings while improving crop yields and quality, in addition to reduce negative impacts on the environment. The benefits to farmers stem from reduction of production costs due to the less water applied and hence reduced energy costs, and also to less labors for irrigation. The saved water can be used for horizontal expansion of newly irrigated area. As the potential for mobilizing additional water resources is very limited in Egypt,
water saving constitutes the most promising option for meeting increasing water demands for agricultural expansion and for the agriculture sector to release water to other users. Another untraditional water resource that can be used is the agricultural drainage water. But it results in lower yield and an adverse impact on the environment due to its low quality. Environment Impact Assessment (EIA) is a management tool for planners and decision makers in project evaluation. It is now accepted as an essential part of development planning and management. EIA is concerned with both impacts of irrigation and drainage on the environment and sustainability of irrigation and drainage itself. Clearly an EIA will not resolve all problems. There will be trade-off between economic development and environmental protection as in all development activities. However, without objectives of EIA, informed decision making would be impossible. The EIA can address environmental issues such as: (i) mitigation measures focusing on environmental impacts of EFIMP implementation on farm level; (ii) water quality for integrated irrigation and drainage systems in the EFIMP areas; (iii) strengthening of environmental capacity of the EFIMP and associated organizations and groups; (iv) coordination between EIA and different Environmental Units, Water Quality Unit, key agencies and ministries, etc. and communication process; and (v) development of options and investments to address external sources of pollution and solid wastes discharged to canals and
2
drains or contamination with agriculture chemicals (mineral fertilizers and pesticides, etc…). 1.1 Background Egypt has an estimated population of 81.7 million people with an annual growth rate of 1.68%.The agricultural sector’s share in the Gross Domestic Product (GDP) is approximately about 14.1%. The working labors in this sector are 30% of the total labor force. Due to fast population and economic growth, governmental policy aims to reclaim desert land for agriculture, and to establish new cities and industrial sites. By 2017, the new cities are expected to house 8.8 million people and the planned old and newly reclaimed land for agriculture will cover about 4.6 million ha. Due to population growth all agricultural production, industrial expansion and water demand will increase. By 2025, the total water demand is estimated to be about 81.9 billion m³/year and will represent a major threat to all areas of development in Egypt. Agriculture in Egypt is almost entirely dependent on irrigation from the River Nile, since there is no significant rainfall except in a narrow strip along the Mediterranean Cost. Most of the cultivated land is located close to the banks of the River Nile, its main branches and canals as well as in the Nile Delta. Rangeland and rain fed areas are restricted to a narrow strip, only a few kilometers wide along the Mediterranean coast and its bearing capacity is quite low. The total cultivated area (arable land plus permanent crops) is 3.6 million ha (8.6 million feddans) (2005/06), or about 3 percent of the total area of the country. The agricultural areas increased by about 1.0 million ha during the period 1981/82 – 2005/06 with an average agricultural growth rate of 2.6% in the 1980s to reach 3.6% in 2006/07. Almost all land is double-cropped, giving a cropping intensity of close to 178%. Most crops are grown in the Delta and the Valley, with the exception of rice which is grown in Delta mainly and sugarcane which is cultivated in the Valley. The main winter crops are wheat and berseem (Trifolium alexandrinum, L) .Berseem is grown either over 3 months with 2 cuts as a soil improver (short berseem), usually preceding cotton, or grown over 6-7 months, either with 4-5 cuts as a fodder crop or grazed by gathered cattle (long berseem). Minor winter crops are, amongst others, pulses, barley and sugar beet. The main summer crops are maize, cotton and rice, the latter being the most important Egyptian export crop. In 2008, yields were 8 million tones for wheat, 6.3 million tones for maize, 7.2 million tones for rice. The productivity of “old land” is relatively high but additional yield gains could be achieved with improved seed quality, more mechanization, strengthened extension support and better land and soil management. The area under cultivation will increase from 3.3 million ha in the year 1997 to about 4.7 million ha by the year 2017 with an increase of 1.4
3
million ha according the objectives of the sustainable agricultural development strategy 2030.
Soils, Water & Environment Res. Inst.(SWERI)
SWERI is one of sixteen research institutes under the Agricultural Research Center (ARC) of the Ministry of Agriculture and Land Reclamation (MALR). Its vision is to be recognized as a lead organization for integrated management and conservation of soils and water resources in a sustainable manner, as well as being considered as a national and regional consultant of natural resources management. In the light of SWERI’s vision, the main mission is to execute applied researches and to provide direct services to farmers, extension specialists, and public and private organizations. To achieve SWERI’s mission, the following objectives should be met:
� Surveying and classifying available soils and water resources. � Improving productivity of old and newly reclaimed lands to increase the
overall agriculture productivity. � Conserving soils and water resources. � Optimizing fertilizer use. � Monitoring the pollution of soils and water resources and its impact on
plants and the environment (Environmental Impact Assessment is included).
� Studying climate change and its impact on crop water requirements, desertification and land degradation.
Soils, Water & Environment Research Institute consists of 10 research departments. The Environment Research Department is the most recent one, it was established in 1994.
The main activities of the department are: � Environmental impact assessment of agriculture projects. � Monitoring pollution of soils, water, and plant and its impact on
environment on farm level. � Environmental impact assessment of overuse of chemical fertilizers on
soils, plant and groundwater. � Applied technical remediation methods for soil improvement (natural,
physical, biological, and chemical). � Applied technical method for heavy metal removal from reused
wastewater in agriculture. � Technical cooperation with national and international organizations in the
field of environmental protection. SWERI’s contributions to EIA activities
SWERI will contribute to EIA's activities by the following inputs:

4
� All available documents, reports, including output of water quality monitoring programs, soil structure and texture, environmental aspect, soil mapping, cropping pattern, etc. to enable the consultants to carry out assignments.
� Make the necessary arrangements for field visits and meetings with various institutions and stakeholders.
� Participate in meetings, discussions, consultations and reviewing all submitted documents.
� Experts of different disciplines e.g : soils, water, plant and environment topics, i.e., pollution, laboratory analysis, field researches, agricultural microbiology.
� Update the related studies available in ARC. � Facilities and equipments: SWERI has new laboratories which have the
following instruments: • Plasma (ICP) - GC Mass and HPLC. - EC and pH meters. • Atomic Absorption. - BOD and COD sets. - Spectrophotometer.
1.2 Environmental Assessment Study 1.2.1 EIA Concept and Rationale
The most common environmental impacts (positive and negative) associated with irrigation and drainage schemes are: Salinization / alkalinization, water logging, soil acidification, poor water quality, ecological degradation, aquatic weeds, sedimentation and reduced socio-economic conditions. The opportunity to identify positive impacts and to propose measures in order to enhance such impacts should not be neglected. Human health has been included, in order to present the human health dimensions of the environmental impacts. EIA has three main functions
� Predict problems, � Find ways to control or avoid them, and � Enhance positive effects.
The environmental impact assessment (EIA) is expected, with respect to improve canals and drains in Nile Delta at farm level through EFIMP plan, improve soil structure, decrease water table depth, prevent water logging and soil salinity, management of irrigation water as well as increase crop yields. The application of chemical fertilizers, pesticides products and other soil inputs and the contamination with pathogenic indicators and bacteria due to sewage discharges and solid wastes in the main canals and drains, are resulted in low quality water for irrigation. Therefore, the most significant environmental analysis is the management of water quality, quantity, soil properties and human health through integrated management for soils and water on farm level. This is aligned with developing irrigation efficiency and productivity around 200,000 fed. primarily in Delta old land.
5
The EIA will support the implementation of the recently completed strategy of sustainable agricultural development 2030. One of the main elements of the strategy is to gradually improve farm- level irrigation efficiency from 50 to 80% by the year 2030 by modernizing farm- level irrigation, improving water quality and environment protection on 5.0 million feddan. 1.2.2 EIA Objectives The environmental impact of irrigation water at farm level is an issue of increasing importance to the Egyptian agriculture. The aim of Environmental Impact Assessment (EIA) is to identify the impacts of the improvement in irrigation process on soil characteristics. EFIMP actually will explore ways in which farmers could improve productivity by using less chemical fertilizers and irrigation water and will monitor potential changes in the agriculture environment.
Environmental impacts can result from excessive water use, agricultural runoff and soil leaching. The environmental impact of irrigation development projects depends on the quantity and the quality of the water source, and how water is delivered to irrigated farms. The environmental impacts arising from irrigation water at farm level can be due to :
� Water pollution from chemical fertilizers and pesticides. � Increased erosion of cultivated soils. � Salinization, alkalinzation or contamination of water by heavy metals. � Leakage from irrigation system in some localized areas.
Objectives of EIA Component :
� Investigate the effect of irrigation and drainage systems in EIA areas. � Identify the environmental impacts (positive and negative) of irrigation
development projects on soil and plant. � Evaluate the contaminated levels of ground water and suggest the best
management practices for solving the problems. � Monitoring soil fertility and ground water salinity to ascertain the extent of
Salinization problems. � Develop nutrient management practice at farm level. � Enhance capacity building in the field of environmental impacts. � Improve public awareness to raise farmer knowledge.
1.2.3 Approach and Methodology The basic approach for the performance of the EA study had included:
� Experience Review: particularly those environmental experiences gained by the MALR previous and on going project. All these projects were reviewed and a commentary on the experiences gained and lessons learned were reflected in the EA study’s inception report.

6
� Document Review: Existing and relevant research studies relevant to the scope of the EA was compiled and reviewed by the consultants. The aim was to develop a baseline of existing knowledge and information such that the study would build on the body of existing knowledge and not to replicate it. (annex 1 cites some of the documents reviewed for this study)
� Interviews: the consultant during the course of the study has interviewed key MALR officials, district engineers, and community representatives in addition to various experts involved with the MWRI projects and the IIIMP in specific. This enabled evaluators to take a first-hand, in-depth look at the factors influencing the key environmental conditions and threats at a command area basis and how the perceived interventions would alleviate and or add on to those pressures.
� Field Visits: To formulate a complete picture of the existing environmental profile in each area, the team performed several field visits to all the command areas during which discussions were held with the farmers and local administration officials.
� Public Consultations: One public consultation was held during the study, with farmer representatives.
� Fast-tracked EIA/EMP for preparation/appraisal of FIMP. During FIMP preparation, a baseline data collection and analysis was carried out focusing on water quality (irrigation and drainage) and soil characteristics. A field study has been carried out on FIMP command areas at the farm and merwa levels. SWERI coordinated with EALIP to identify the related locations. This study includes collecting samples from the following:
o Water (irrigation and drainage streams). o Soil. o Cultivated crops. o Groundwater (subsurface water).
The analysis of samples included the following parameters o pH, EC, Cations, Anions, RSC and SAR. o Zn , Fe , Mn , Cu , B, k, P, NO3-N and NH4-N. o Pb, Cd , Cr, Co and Ni. o Pesticides residues (Positive / Negative). o COD and BOD. o Bacteria (Total Coliforms, Feacal Coliforms, Salmonella and
Shigella). o Parasites.
� Public Consultation to Community and Stakeholders: SWERI team
visited the FIMP command areas in EL-Wasat, Al- manaifa, & Al-Mahmoudia in Kafr El-Sheikh and El-Behira governorates on 9 June 2010. Ten farmer representatives (cooperatives) have been interviewed about:
o The best method of maraw improvement. o The expected benefits from FIMP. o Create appropriate environmental conditions (EIA & EMP results).
7
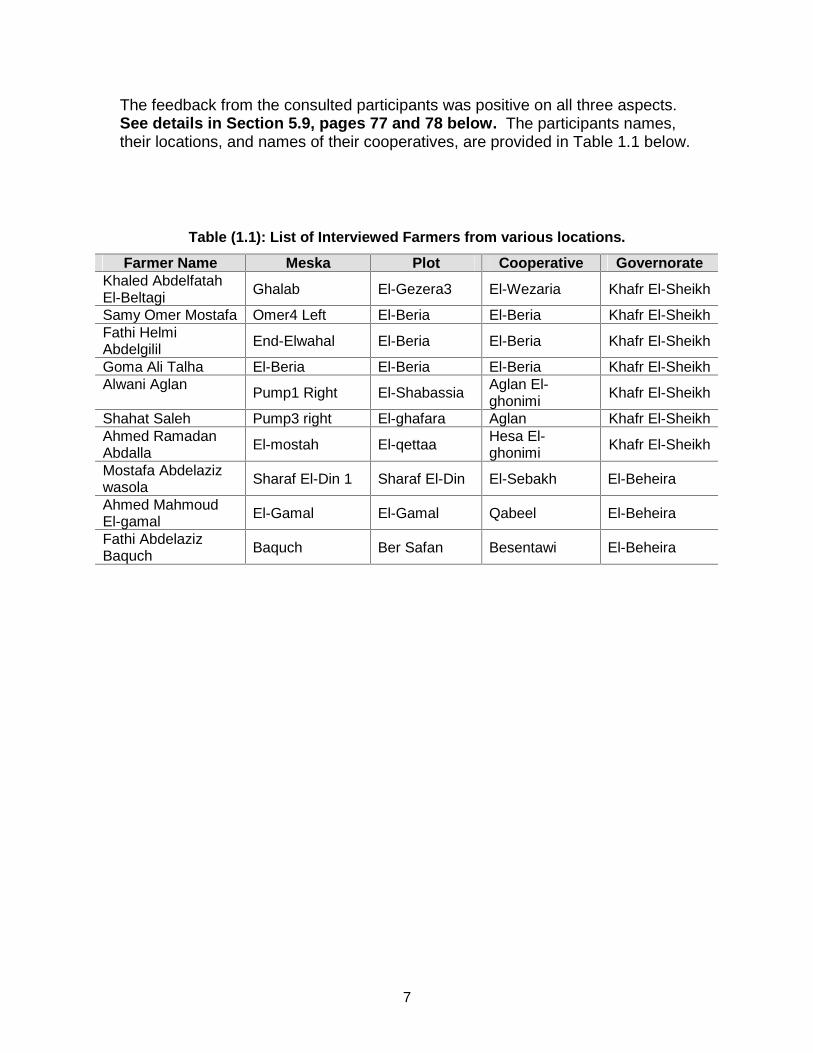
The feedback from the consulted participants was positive on all three aspects. See details in Section 5.9, pages 77 and 78 below. The participants names, their locations, and names of their cooperatives, are provided in Table 1.1 below.
Table (1.1): List of Interviewed Farmers from various locations.
Farmer Name Meska Plot Cooperative Governorate Khaled Abdelfatah El-Beltagi Ghalab El-Gezera3 El-Wezaria Khafr El-Sheikh
Samy Omer Mostafa Omer4 Left El-Beria El-Beria Khafr El-SheikhFathi Helmi Abdelgilil End-Elwahal El-Beria El-Beria Khafr El-Sheikh
Goma Ali Talha El-Beria El-Beria El-Beria Khafr El-SheikhAlwani Aglan Pump1 Right El-Shabassia Aglan El-
ghonimi Khafr El-Sheikh
Shahat Saleh Pump3 right El-ghafara Aglan Khafr El-SheikhAhmed Ramadan Abdalla El-mostah El-qettaa Hesa El-
ghonimi Khafr El-Sheikh
Mostafa Abdelaziz wasola Sharaf El-Din 1 Sharaf El-Din El-Sebakh El-Beheira
Ahmed Mahmoud El-gamal El-Gamal El-Gamal Qabeel El-Beheira
Fathi Abdelaziz Baquch Baquch Ber Safan Besentawi El-Beheira

8
2. POLICY, LEGAL, AND ADMINISTRATIVE FRAME WORK The Egyptian institutional and legal framework for water quality management has been described by several projects as extremely complex, mainly because of the large number of government agencies with related responsibilities for water quality management activities, each of which is guided by its set of laws, decrees and operating policy. This section of the report establishes a baseline identification of the major policies with bearing on the environmental component of the FIMP, institutional bodies with direct quality management responsibility (highlighting the area of quality management mandated), as well as the regulatory framework within each agency operates. The section also addresses the identification process of the World Bank’s applicable operational policies and the relevant international environmental agreements applicable to the environmental dimension of the project. 2.1 Policy Framework Three main policies relevant to the FIMP environmental component have been identified. Each of these policies represents the objectives of the originating/implementing authority to address environmental aspects relevant to the FIMP. Agricultural Policy Ministry of Agriculture and Land Reclamation has completed its policy for agricultural development for the period 1997/up to 2016/2017 and 2030. This policy development has been the center of support by the Agricultural Policy Reform Program funded by the USAID. The consultants have noted that the policy, although focuses on the reduction of agricultural chemicals and pesticides in general and efficient water use, it does not seem to include environmental conservation - pollution prevention and sustainable development as a main and dedicated objective. At all rates, the main objectives of the existing policy include:
� Increase the annual rate of growth of agricultural production to 4.1%. � Sustain the increase in cereals production which amounts recently to 18
million tons yearly through the contrivance of high yielding varieties, national campaigns, and setting optional floor price for targeted crops so as to be consistent with border price and maintain rice acreage around 900 thousand feddans a year.
� Increase edible oil crops production to substitute imports through the expansion of sunflower, soybeans and Canola areas and setting acceptable optional floor price of such crops.
9
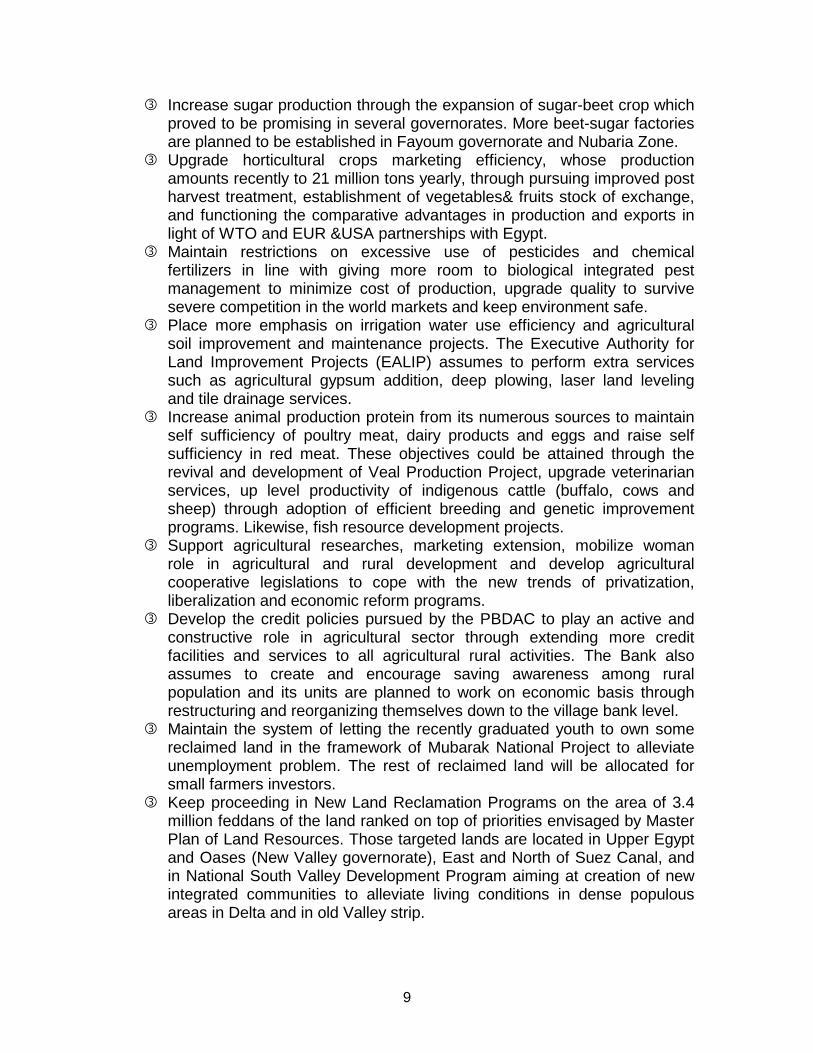
� Increase sugar production through the expansion of sugar-beet crop which proved to be promising in several governorates. More beet-sugar factories are planned to be established in Fayoum governorate and Nubaria Zone.
� Upgrade horticultural crops marketing efficiency, whose production amounts recently to 21 million tons yearly, through pursuing improved post harvest treatment, establishment of vegetables& fruits stock of exchange, and functioning the comparative advantages in production and exports in light of WTO and EUR &USA partnerships with Egypt.
� Maintain restrictions on excessive use of pesticides and chemical fertilizers in line with giving more room to biological integrated pest management to minimize cost of production, upgrade quality to survive severe competition in the world markets and keep environment safe.
� Place more emphasis on irrigation water use efficiency and agricultural soil improvement and maintenance projects. The Executive Authority for Land Improvement Projects (EALIP) assumes to perform extra services such as agricultural gypsum addition, deep plowing, laser land leveling and tile drainage services.
� Increase animal production protein from its numerous sources to maintain self sufficiency of poultry meat, dairy products and eggs and raise self sufficiency in red meat. These objectives could be attained through the revival and development of Veal Production Project, upgrade veterinarian services, up level productivity of indigenous cattle (buffalo, cows and sheep) through adoption of efficient breeding and genetic improvement programs. Likewise, fish resource development projects.
� Support agricultural researches, marketing extension, mobilize woman role in agricultural and rural development and develop agricultural cooperative legislations to cope with the new trends of privatization, liberalization and economic reform programs.
� Develop the credit policies pursued by the PBDAC to play an active and constructive role in agricultural sector through extending more credit facilities and services to all agricultural rural activities. The Bank also assumes to create and encourage saving awareness among rural population and its units are planned to work on economic basis through restructuring and reorganizing themselves down to the village bank level.
� Maintain the system of letting the recently graduated youth to own some reclaimed land in the framework of Mubarak National Project to alleviate unemployment problem. The rest of reclaimed land will be allocated for small farmers investors.
� Keep proceeding in New Land Reclamation Programs on the area of 3.4 million feddans of the land ranked on top of priorities envisaged by Master Plan of Land Resources. Those targeted lands are located in Upper Egypt and Oases (New Valley governorate), East and North of Suez Canal, and in National South Valley Development Program aiming at creation of new integrated communities to alleviate living conditions in dense populous areas in Delta and in old Valley strip.

10
� Creation of conducive environment for Egyptian, Arab and Foreign investors.
Water Resources Policy The MWRI in coordination with MALR and other ministries has developed a national policy with three major pillars of: 1) increasing water use efficiency; 2) water quality protection; and 3) pollution control and water supply augmentation. Detailed national water resources management and investment plans were also developed by the National Water Resources Plan Project (NWRP). The MWRI have also initiated over the past few years various activities in
collaboration with different donor organizations designed to revise and update water policies and to strengthen key institutions (Some of which were presented in section 2). As a generalization, these policy support initiatives could be classified into supporting four categories: Participatory Irrigation Management (PIM); Institutional Development and Organizational Strengthening (IDOS); Water Quantity Management (WM); and Water Quality Management and Pollution Control (WQMPC).
The MWRI finalized the National Water Resources Plan project, with support from the Dutch government. The project had the main goal of supporting the water sector in developing a National Water Resources Plan to the year 2017 that describes how Egypt will safeguard its water resources in the future both with respect to quantity and quality. The project also involved developing a coordination mechanism to develop consensus on the objectives and directives of the NWRP prepared and approved. National Environmental Action Plan (NEAP) The first NEAP for Egypt was developed in 1999 with major support from the World Bank and other donors. Based on the recommendations of the 92 NEAP, the Law 4 was introduced, the MSEA was promulgated and large number of donor projects was implemented to support the environmental objectives and actions needed to address the deteriorating quality of the natural environment and its consequential impacts on sustained development and human health. In 2002, via support from Capacity 21 project, a new NEAP has been developed for Egypt. The NEAP addresses a number of pertinent issues and does recommend a host of interventions (policy related, regulatory, and technical/institutional) particularly relevant to solid waste management, fresh water resources management, and rural sanitation. To the best of the consultants’ knowledge, the 2002 NEAP has not yet been approved by the MSEA. 2.2 Legal Framework and Guidelines

11
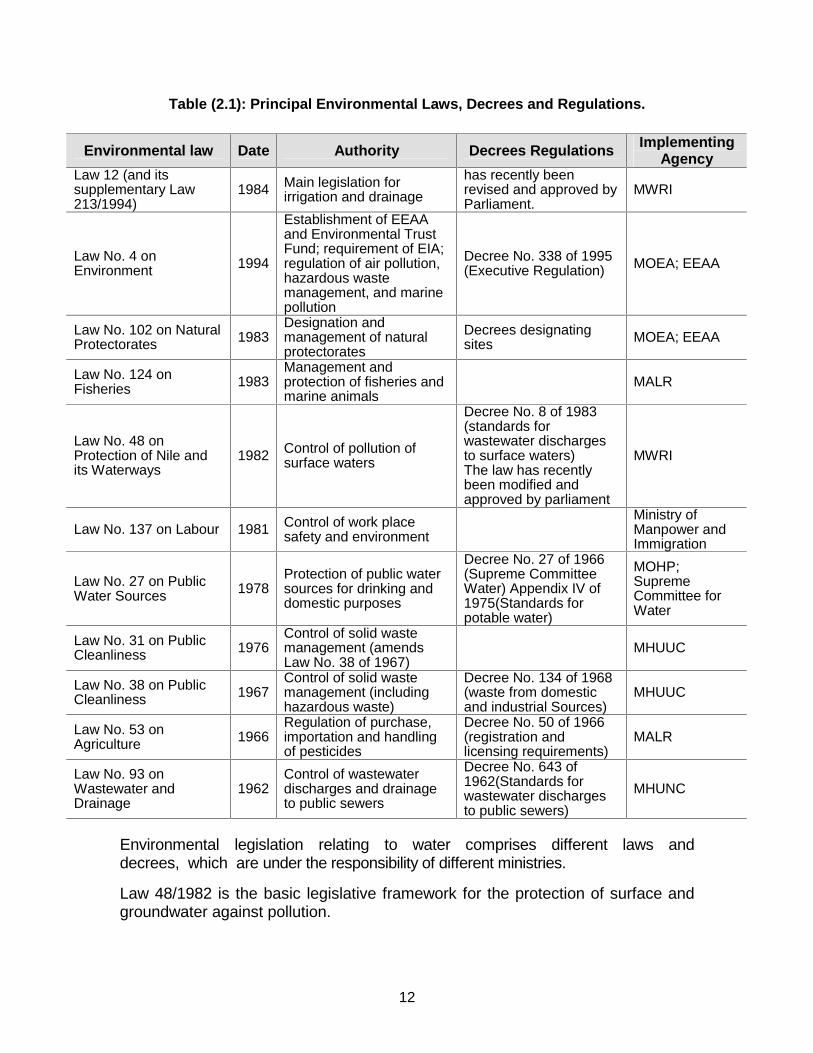
The framework of laws and regulations has been surveyed during the reporting stage. Table ( 2.1) gives an overview of the laws and decrees regulating water quality.
12
Table (2.1): Principal Environmental Laws, Decrees and Regulations.
Environmental law Date Authority Decrees Regulations Implementing Agency
Law 12 (and its supplementary Law 213/1994)
1984 Main legislation for irrigation and drainage
has recently been revised and approved by Parliament.
MWRI
Law No. 4 on Environment 1994
Establishment of EEAA and Environmental Trust Fund; requirement of EIA; regulation of air pollution, hazardous waste management, and marine pollution
Decree No. 338 of 1995 (Executive Regulation) MOEA; EEAA
Law No. 102 on Natural Protectorates 1983
Designation and management of natural protectorates
Decrees designating sites MOEA; EEAA
Law No. 124 on Fisheries 1983
Management and protection of fisheries and marine animals
MALR
Law No. 48 on Protection of Nile and its Waterways
1982 Control of pollution of surface waters
Decree No. 8 of 1983 (standards for wastewater discharges to surface waters) The law has recently been modified and approved by parliament
MWRI
Law No. 137 on Labour 1981 Control of work place safety and environment
Ministry of Manpower and Immigration
Law No. 27 on Public Water Sources 1978
Protection of public water sources for drinking and domestic purposes
Decree No. 27 of 1966 (Supreme Committee Water) Appendix IV of 1975(Standards for potable water)
MOHP; Supreme Committee for Water
Law No. 31 on Public Cleanliness 1976
Control of solid waste management (amends Law No. 38 of 1967)
MHUUC
Law No. 38 on Public Cleanliness 1967
Control of solid waste management (including hazardous waste)
Decree No. 134 of 1968 (waste from domestic and industrial Sources)
MHUUC
Law No. 53 on Agriculture 1966
Regulation of purchase, importation and handling of pesticides
Decree No. 50 of 1966 (registration and licensing requirements)
MALR
Law No. 93 on Wastewater and Drainage
1962Control of wastewater discharges and drainage to public sewers
Decree No. 643 of 1962(Standards for wastewater discharges to public sewers)
MHUNC
Environmental legislation relating to water comprises different laws and decrees, which are under the responsibility of different ministries.
Law 48/1982 is the basic legislative framework for the protection of surface and groundwater against pollution.

13
In the law a distinction is made between the Nile and the irrigation canals which are referred to as “fresh”, and the drains, lakes and ponds, which are referred to as “brackish”. The responsibility for licensing of wastewater discharge is granted to the MWRI, whereas the Ministry of Health and Population is responsible for monitoring of the effluents. Only discharge of treated industrial wastewater is permitted into fresh water bodies, while treated municipal wastewater can only be discharged to “brackish” water bodies. Moreover, the reuse of drainage water is also regulated.
Law 48/1982 establishes a fund from the revenues of levies, fines and costs, which can be used for the administration, donations, research and incentives.
Executive regulations of Law 48 provide water quality standards for industrial discharges to the Nile and canals, domestic and industrial discharges to drains and brackish lakes, reuse of drainage water to be mixed with canals, and receiving water bodies. Discharge of treated sanitary effluents to the Nile River and canals is not allowed at all (article 63, Decree 8/1983) and any discharge of sanitary waste into other water bodies should be chlorinated (article 67, Decree 8/1983).
Law 4 of 1994 & Law 9 of 2009 Editing Environmental Law4/1994
(Environmental Framework Law) Law 4/1994 deals with enforcement for all but fresh water resources, those are with MWRI. It concerns the environment in general. Law 48/1982 is not integrated into the new law. Instead, Law 4/1994 refers to Law 48/1982 for specific regulations on water quality. An important element of Law 4/1994 is the establishment of the Egyptian Environmental Affairs Agency (EEAA). From the viewpoint of Integrated Water Resources Management Law 4/1994 provides regulations for the protection against pollution of seashores, ports, etc. that are not covered by Law 48/1982.
The legal basis for irrigation and drainage is set in Law No. 12/1982 and its supplementary Law No. 213/1994 which defines the use and management of public and private sector irrigation and drainage systems including main canals, feeders and drains. Law 12/1982 defines public properties related to irrigation and drainage, for example the River Nile, the main canals, public feeders and public drains and their embankments.
The law regulates the use of groundwater and drainage water (construction of wells or the use of drainage water and water pumps). It provides the regulations for the development of new land and the price that has to be paid for the irrigation and drainage of land. Section VII of the Law describes the penalties for violations. Finally, some provisions are given to settle disputes and a fund for the repair of irrigation works is established.
Law 12/1982 is primarily aimed at irrigation as the dominant water user and the Ministry of Irrigation (now MWRI) as the water manager that has to give permission for all abstractions of water. Other water users are not mentioned in particular.
14
Law 213 (1994): Farmer Participation
Law 213/1994 provides the legal basis for the establishment of farmer participation for improved irrigation systems. The Law enables the recovery of costs in case of landowner neglects his duties with respect to the maintenance of the irrigation or drainage system or if he violates the authorization for irrigation of new land. A new law regulating the legal basis of Water User Associations is drafted and is approved by parliament. Law 93/1962 regulates Wastewater Disposal and Reuse Decree No. 649/1962 of the Minister of Housing issues the executive regulations of Law 93/1962. It specifies regulatory standards for wastewater disposal. It was updated in 1989 by Decree No. 9/1989 in which a distinction was made between wastewater disposal on sandy soils and clay silt soils. In 1995 an amendment was made by both the Ministry of Irrigation and the Ministry of Agriculture and approved by the Ministry of Health. It has been issued by the Minister of Housing decree No 44/2000. This amendment set standards for quality of wastewater discharged in the public sewer network and determined the minimum degree required for wastewater treatment for the various reuse aspects. In 2005, new standards for the reuse of wastewater were set in the Egyptian Code for the Use of Treated Wastewater in Agriculture and the previous standards for reuse, defined in decree 44/2000, are not valid anymore.
Decree No. 649/1962 of the Minister of Housing issues the executive regulations of Law 93/1962. It specifies regulatory standards for wastewater disposal. It was updated in 1989 by Decree No. 9/1989 in which a distinction was made between wastewater disposal on sandy soils and clay silt soils. Reuse of effluent in the irrigation of vegetables, fruits or any other crops eaten uncooked is strictly prohibited. The same restriction is imposed on grazing of animals or milking cattle on the fields irrigated with wastewater. In 1995 an amendment was made by both the Ministry of Irrigation and the Ministry of Agriculture and approved by the Ministry of Health. It has been issued by the Minister of Housing by Decree No. 44/2000. This practically very important amendment determined the minimum degree required for wastewater treatment for the various reuse aspects. It corresponds to the WHO guidelines of 1989.Within the framework of Law 48, Ministry of Health and Population (MOHP) samples and analyses drain waters to be mixed with irrigation waters, industrial and domestic wastewater treatment plant effluents and wastes discharged from river vessels. In case of non-compliance of discharges, the MWRI generally takes action upon notification from the MOHP.
15
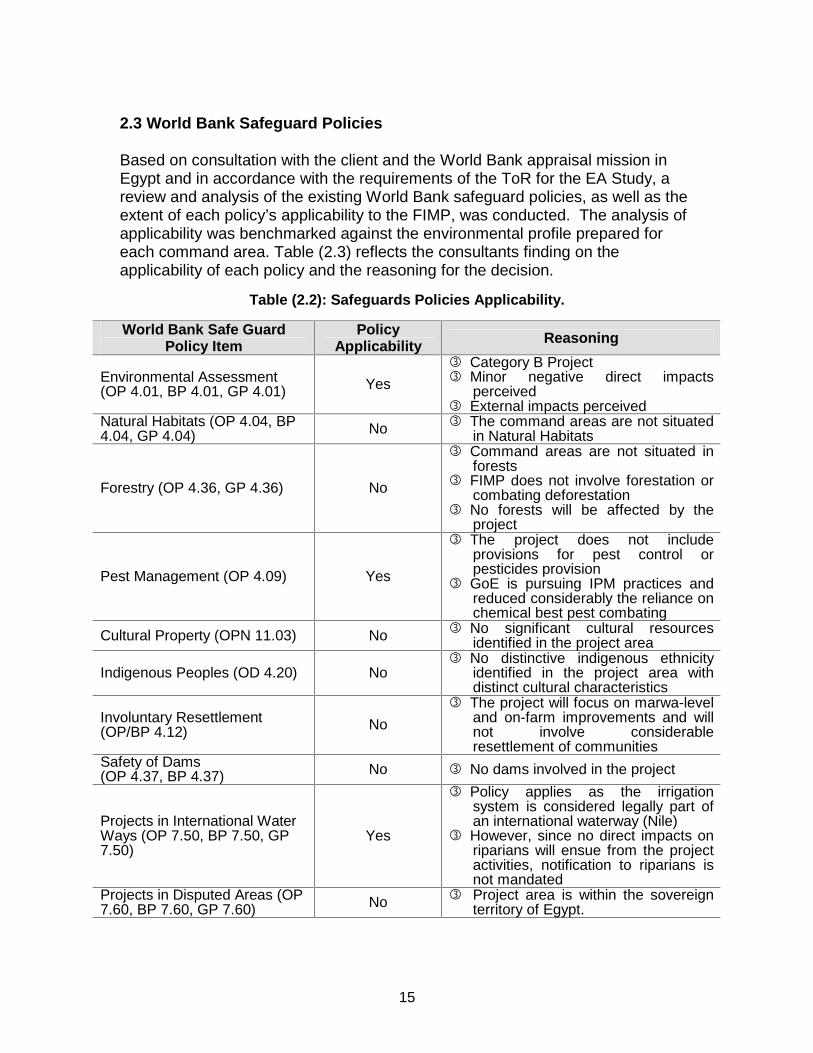
2.3 World Bank Safeguard Policies Based on consultation with the client and the World Bank appraisal mission in Egypt and in accordance with the requirements of the ToR for the EA Study, a review and analysis of the existing World Bank safeguard policies, as well as the extent of each policy’s applicability to the FIMP, was conducted. The analysis of applicability was benchmarked against the environmental profile prepared for each command area. Table (2.3) reflects the consultants finding on the applicability of each policy and the reasoning for the decision.
Table (2.2): Safeguards Policies Applicability.
World Bank Safe Guard Policy Item
Policy Applicability Reasoning
Environmental Assessment (OP 4.01, BP 4.01, GP 4.01) Yes
� Category B Project � Minor negative direct impacts
perceived � External impacts perceived
Natural Habitats (OP 4.04, BP 4.04, GP 4.04) No � The command areas are not situated
in Natural Habitats
Forestry (OP 4.36, GP 4.36) No
� Command areas are not situated in forests
� FIMP does not involve forestation or combating deforestation
� No forests will be affected by the project
Pest Management (OP 4.09) Yes
� The project does not include provisions for pest control or pesticides provision
� GoE is pursuing IPM practices and reduced considerably the reliance on chemical best pest combating
Cultural Property (OPN 11.03) No � No significant cultural resources identified in the project area
Indigenous Peoples (OD 4.20) No � No distinctive indigenous ethnicity
identified in the project area with distinct cultural characteristics
Involuntary Resettlement (OP/BP 4.12) No
� The project will focus on marwa-level and on-farm improvements and will not involve considerable resettlement of communities
Safety of Dams (OP 4.37, BP 4.37) No � No dams involved in the project
Projects in International Water Ways (OP 7.50, BP 7.50, GP 7.50)
Yes
� Policy applies as the irrigation system is considered legally part of an international waterway (Nile)
� However, since no direct impacts on riparians will ensue from the project activities, notification to riparians is not mandated
Projects in Disputed Areas (OP 7.60, BP 7.60, GP 7.60) No � Project area is within the sovereign
territory of Egypt.
16
The consultants are under the opinion that the safeguard policy on Environmental Assessment (OP 4.01) applies to the FIMP, which was designated a Category B project. The EA has further assessed the extent of safeguard policy on Pest Management (OP 4.09) applicability to the FIMP, taking into consideration that the FIMP will not finance the procurement of any pesticides nor bring new lands into agricultural production. The GoE is already applying an Integrated Pest Management (IPM) system where the use of pesticides is reduced considerably. Nevertheless, OP4.09 has been triggered, and a basic Pest Management Plan (PMP) is prepared as part of the EMP in order to ensure compliance with OP 4.09 and potentially contribute to the pool of mitigation measures recommended to prevent and control water pollution, knowing that:
� the project does not attempt to expand on the existing cultivated lands within its command areas; (mainly focusing on improved productivity)
� the proposed on-farm sub-component (fostering Laser land-leveling and a more timely irrigation-scheduling) will help ration the application of pesticides and fertilizers, thus minimizing their residues;
� export-oriented crop diversification is not a prime outcome of the project.
17
3. PROJECT DESCRIPTION 3.1 Project Rationale The Government of Egypt (GOE) has recently completed its Strategy of Sustainable Agricultural Development 2030. One of the main elements of the strategy is to gradually improve farm-level irrigation efficiency1 from 50 to 80 percent by the year 2030 by modernizing farm-level irrigation on 5 million feddans. Since water resources are essential for agricultural production and rural livelihoods, improvements in irrigation efficiency will greatly benefit the sector, which plays a critical role in the Egyptian economy. The sector contributes to national income (17 percent) and exports (about 20 percent of total exports). Sector development could also help reduce rural poverty, which is relatively high (52 percent) compared to urban poverty (26 percent), with many of the rural poor depending on agriculture as their primary income source. Water use in Egypt is limited to about 68 billion m3 per year from different sources, including groundwater and drainage water reuse, with the present 850 m3 per capita share decreasing rapidly due to an annual population increase of 2.1 percent. Eighty five percent of the available water irrigates about 8.5 million feddans, but irrigation efficiency is low with both physical and operational factors resulting in large water wastages. Conveyance and distribution efficiencies do not exceed 70 percent, while farm-level efficiencies average about 50 percent with application levels usually in excess of crop and soil water needs. Irrigation efficiency improvements will thus increase productivity and could help alleviate rural poverty. The Bank’s interventions in agriculture and water resources have played a central role in the development of the sector, with almost 85 percent of the irrigated area served through its irrigation, drainage and pump station projects. These projects have focused on improving water delivery and drainage, reducing water logging and salinity, and improving capacity to operate and manage the infrastructure. For example, the completed Irrigation Improvement Project (IIP) and the ongoing Integrated Irrigation Improvement and Management Project (IIIMP) have primarily addressed improvements to the irrigation system at the mesqa2 level. Lessons learned from the IIP indicated a need to focus on irrigation system improvement at the marwa3 level as well as farm-level improvements to build on these upstream investments, resulting in pilot and demonstration areas covering some 6,000 feddans being established under the IIIMP. The Farm-level Irrigation Modernization Project (FIMP) would focus on scaling-up these ongoing pilot activities coupled with improvements in extension service delivery to prepare MALR for implementation of the national program for farm-level irrigation improvement. The GOE/MALR is mobilizing donors to support their strategy, and has requested the Bank’s assistance to address farm-level irrigation modernization on about 200,000 feddans as a first phase of the
1 Measured by reduction in water use per unit area (m3/feddan) 2 Tertiary channels that receive water from branch canals 3 Quaternary farm-level ditches

18
longer-term GOE program. The Bank’s objectives in the agriculture sector, as consistently expressed over the last three CASs, have included improving the management and efficiency of the use of water and land resources. The FIMP is explicitly in line with these objectives. 3.2 Proposed Objectives The project development objective is to increase the irrigation efficiency and productivity of around 200,000 feddans primarily in the Delta old lands. This would be achieved through modernization of farm-level irrigation systems and improved water management in areas where upstream irrigation improvement interventions, both physical and institutional, have occurred and are fully functional. Such improvements have demonstrated significant positive impacts on water use and productivity, energy use, labor requirements and net financial returns to farmers. The project would also help to strengthen the delivery of farmer support services to help them achieve these goals. The success of the project would be measured by the following indicators:
� Reduced water consumption and increased irrigation efficiency as measured by water use per unit area (m3/feddan) and net returns per unit of water used (LE/m3);
� Increased farmer incomes as measured by real annual net returns from crop production per unit land area (LE/feddan); and
� Improved extension service delivery and performance monitoring. 3.3 Project Description The proposed project would provide a sector investment loan of US$ 100 million over a five year period, Component 1: Farm-Level Irrigation Improvements (approximately US$ 80 million). This component would support marwa and farm-level irrigation modernization for farmers on 200,000 feddans primarily in three Delta old land irrigation command areas (Mahmoudia, Manaifa and Meet Yazid). 4 These locations are where branch canal and mesqa improvements have been carried out or are currently ongoing and where local organizations have been formed for sustainable O&M and irrigation management. This component would provide financing for the following activities: (i) marwa and off-farm improvements comprising various pipe and hydrant systems, open channels and small gated outlets, with options designed and implemented in accordance with farmer needs and agreement; (ii) demand-driven farm-level improvements such as laser land-leveling, reshaping field drains, soil improvements, flexible hose systems, gated pipes or localized systems appropriate for horticultural crops; (iii) provision of machinery and equipment for land improvement, including support for the establishment of small private workshops for installation and maintenance; and (iv) field surveys, designs, and construction supervision and management.
4 Activities will be done on a cost-sharing basis.
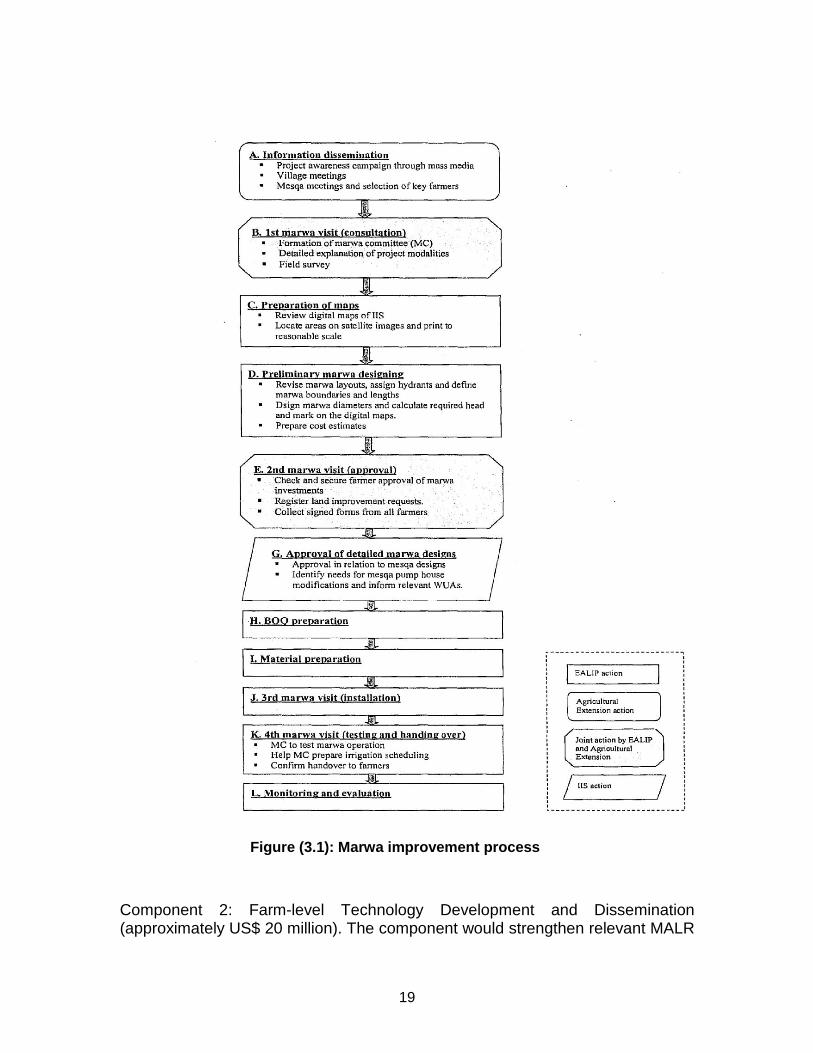
19
Figure (3.1): Marwa improvement process
Component 2: Farm-level Technology Development and Dissemination (approximately US$ 20 million). The component would strengthen relevant MALR
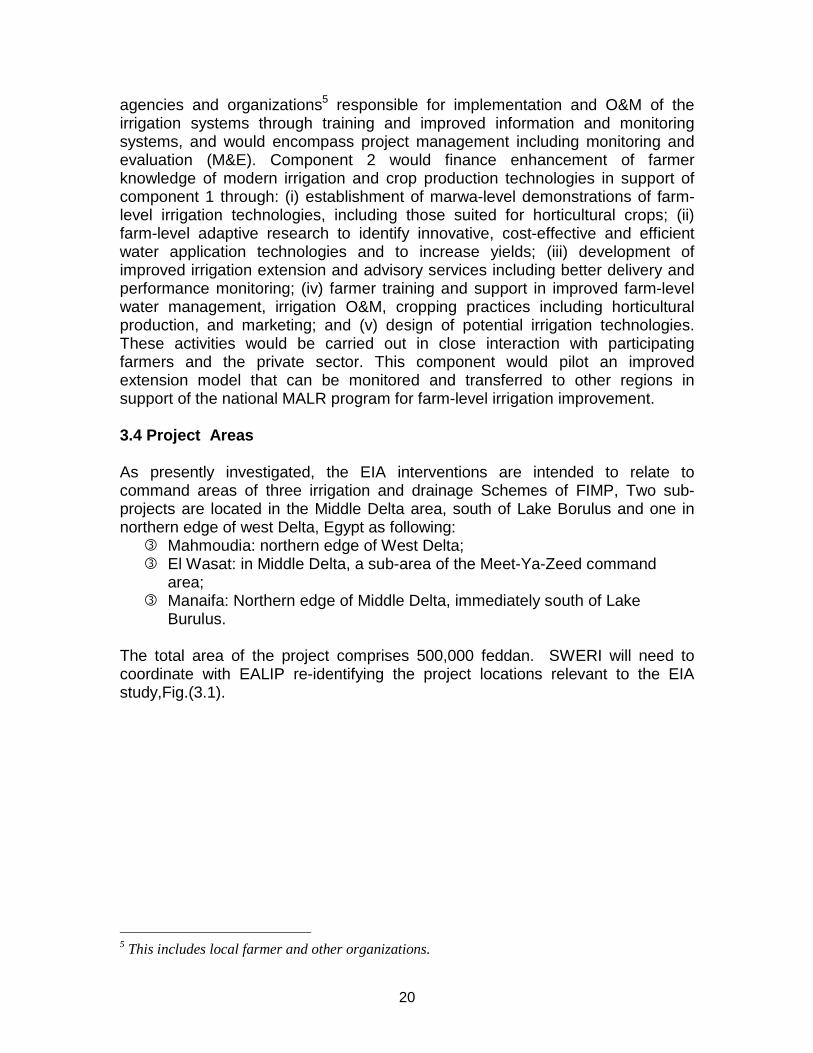
20
agencies and organizations5 responsible for implementation and O&M of the irrigation systems through training and improved information and monitoring systems, and would encompass project management including monitoring and evaluation (M&E). Component 2 would finance enhancement of farmer knowledge of modern irrigation and crop production technologies in support of component 1 through: (i) establishment of marwa-level demonstrations of farm-level irrigation technologies, including those suited for horticultural crops; (ii) farm-level adaptive research to identify innovative, cost-effective and efficient water application technologies and to increase yields; (iii) development of improved irrigation extension and advisory services including better delivery and performance monitoring; (iv) farmer training and support in improved farm-level water management, irrigation O&M, cropping practices including horticultural production, and marketing; and (v) design of potential irrigation technologies. These activities would be carried out in close interaction with participating farmers and the private sector. This component would pilot an improved extension model that can be monitored and transferred to other regions in support of the national MALR program for farm-level irrigation improvement. 3.4 Project Areas As presently investigated, the EIA interventions are intended to relate to command areas of three irrigation and drainage Schemes of FIMP, Two sub-projects are located in the Middle Delta area, south of Lake Borulus and one in northern edge of west Delta, Egypt as following:
� Mahmoudia: northern edge of West Delta; � El Wasat: in Middle Delta, a sub-area of the Meet-Ya-Zeed command
area; � Manaifa: Northern edge of Middle Delta, immediately south of Lake
Burulus.
The total area of the project comprises 500,000 feddan. SWERI will need to coordinate with EALIP re-identifying the project locations relevant to the EIA study,Fig.(3.1).
5 This includes local farmer and other organizations.

21
4. BASELINE ENVIRONMENTAL PROFILE The three project areas are geographically distributed in the Middle and Western Delta regions. The common feature among the command areas is that they are all situated in a densely populated rural environment intermittent with peri-urban settlements. This rural/peri-urban environment in Egypt has very similar physical, biological, and socio-economic characteristics all of which have been influenced by each area’s local needs to exploit the natural environment to the extent possible to sustain an ever increasing population. 4.1 Description of Project Command areas 4.1.1 Middle Nile Delta - Wasat and Manaifa Command areas Gharbia Drain is by far the largest drainage system in the Middle Delta, running from south to north. In the upstream part of the catchment, a considerable part of its drainage water is municipal drainage. Some secondary drains flows its drainage water into Gharbia main drain. These drains are such as Samatay drain and Drain No. 6. Samatay drain discharges its water into Gharbia drain by Samatay Pump Station. Meanwhile, Pump Station No. 6 lifts the drainage water of Drain No. 6 into Gharbia drain. Numbers of Pump Stations are operational for reusing the catchment’s drainage water in irrigation. Menufeya Reuse pump Station in the south is returning drainage water to Bahr Abassy, just downstream of its intake from Damietta Branch. Mahallet Ruh Reuse Pump Station is discharging water into Mit Yazeed Canal (Table 4.1). Mahalle Kubra Reuse Pump Station is lifting Gharbia water into Damietta Branch downstream of Zifta Barrage. Finally, Hamul Reuse Pump Station is mixing Gharbia drainage water into Bahr Teera, just downstream of the drinking water intake of Hamul City. The remaining part of Gharbia Drain catchment discharge, with an exception of Hafir Shehab Eddin Pump Station, is intended to be reused in the downstream reaches of the irrigation canals near Lake Burullus and the Kalbsho reclamation area. For this purpose a dam has been constructed in Gharbia Main Drain, just upstream of the confluence with Hafir Shehab Eddin Drain. Drains 7&8 in the central-northern part of the Middle Delta drain mainly agricultural areas. In this northern part of the Nile Delta, much saline seepage is attracted by the drainage system (sometimes referred to as seawater intrusion). Both drains are connected by the Moheet Drain at the suction side of the Pump Stations. Drains 7&8 discharge into Lake Burullus, which is in open connection with the Mediterranean Sea. At the delivery side of the Lifting Pump Stations, many farmers have settled to reclaim lands on the shore of Lake Burullus, using the drainage water. Many fish farms have also been started here.

22
Table (4.1): Water Quality Monitoring Locations in Meet Yazed Command Area
Location Code Monitored Sites Water Quality Status in Meet Yazeed Irrigation network
MI07 Miet Yazeed Canal downstream Mahlet Ruh drain reuse P.S. MI11 Miet Yazeed Canal downstream Kafr el-Sheikh city
Water Quality Status in Miet Yazeed Drainage Network
MG03 Mahlet Ruh P.S. for mixing drainage water with Miet Yazeed canal MG04 Outfall of Samtay drain into Gharbia drain M701 Outfall of drain no.7 into Lake Brullus M801 Outfall of lower drain no.8 into Lake Brullus MG07 Outfall of drain no.6 into of Gharbia drain MG14 Outfall of into of Gharbia drain
Fig.(4.1) shows the sites of monitoring location of irrigation systems in Nile Delta. Fig.(4.2) shows the sites of monitoring location of drainage systems in Nile Delta. 4.1.2 Western Nile Delta - Mahmoudia Command Area Edko main drainage system is taking care of the drainage requirements of the Eastern part of the Western Nile Delta. In the south, through Khandak Reuse Pump Station and Etay Barud Reuse Pump Station, drainage water is reused in the Khandak Sharqy and Khandak Gharbi Canals. Further downstream, where the proportion of municipal drainage has increased, Edko Irrigation Pump Station is lifting part of its discharge into Mahmoudeya Canal where it crosses Edko Drain ( Table 4.2) . Mahmoudeya Canal is providing drinking water to Alexandria City and surroundings. The remaining part of drainage from the Edko catchment is ending up in Lake Edko, where recently fish cultures have been started on a considerable scale using the water from Edko Drain and Bosseily Pump Station. The second large drainage system in the Western Nile Delta is the Umum drainage system running from the south to the north-west in the Western Nile Delta. Its drainage water is dominated by agricultural drainage and the drainage system most probably attracts saline seepage from the upstream irrigated areas in Nubareya. Plans have been made in the past to reuse the upstream part of Umum catchment drainage for reuse through the Nubareya Canal in the Western Desert for land reclamation projects. The water of three sub-catchments was planned to be used for this: Abu Hummus, Shereishra and Truga sub-catchments. For two of these sub-catchments part of the infrastructure has been constructed. For Truga the salinity is very high and it is doubtful whether the discharge of this sub-catchment can be used sustainable in agriculture. The project has been called to stop due to expected salinity problems for the drinking water production in Borg El Arab. South of Alexandria, Umum main drain passes through Lake Mariut, which has largely dried up and is finally pumped, together with the discharge of some minor catchments into the Mediterranean Sea.
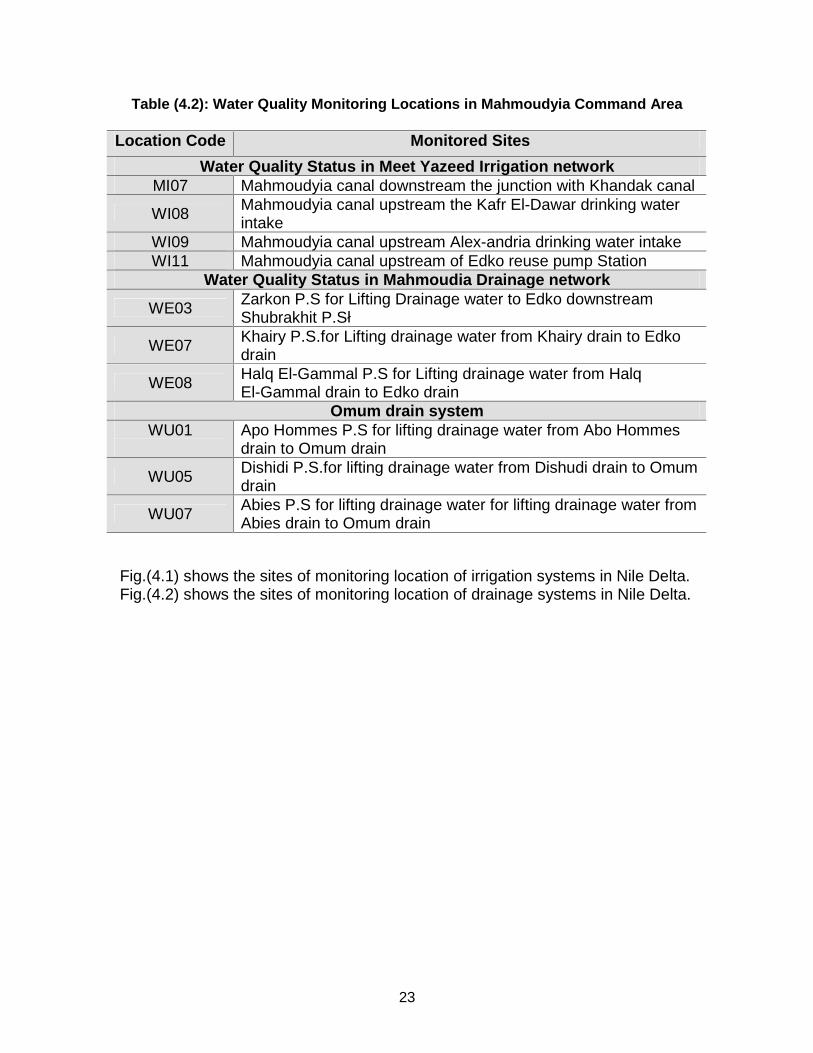
23
Table (4.2): Water Quality Monitoring Locations in Mahmoudyia Command Area
Location Code Monitored Sites
Water Quality Status in Meet Yazeed Irrigation network MI07 Mahmoudyia canal downstream the junction with Khandak canal WI08 Mahmoudyia canal upstream the Kafr El-Dawar drinking water
intake WI09 Mahmoudyia canal upstream Alex-andria drinking water intake WI11 Mahmoudyia canal upstream of Edko reuse pump Station
Water Quality Status in Mahmoudia Drainage network
WE03 Zarkon P.S for Lifting Drainage water to Edko downstream Shubrakhit P.Sł
WE07 Khairy P.S.for Lifting drainage water from Khairy drain to Edko drain
WE08 Halq El-Gammal P.S for Lifting drainage water from Halq El-Gammal drain to Edko drain
Omum drain system WU01 Apo Hommes P.S for lifting drainage water from Abo Hommes
drain to Omum drain
WU05 Dishidi P.S.for lifting drainage water from Dishudi drain to Omum drain
WU07 Abies P.S for lifting drainage water for lifting drainage water from Abies drain to Omum drain
Fig.(4.1) shows the sites of monitoring location of irrigation systems in Nile Delta. Fig.(4.2) shows the sites of monitoring location of drainage systems in Nile Delta.
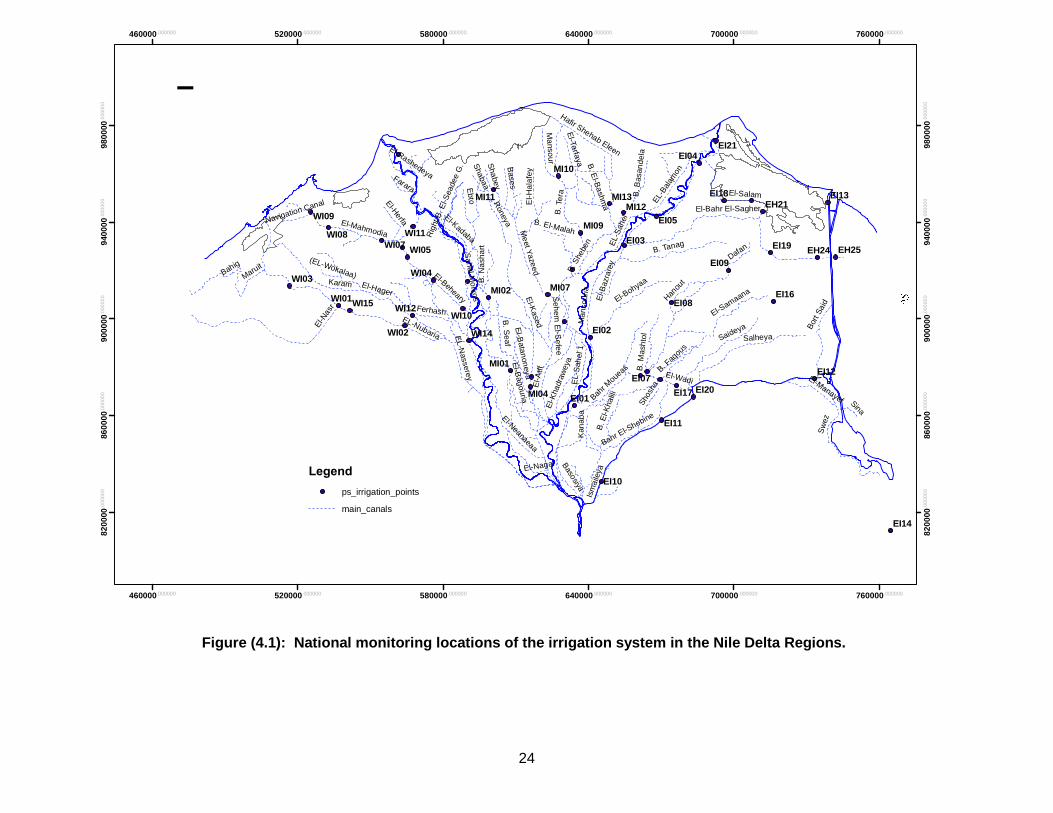
24
Figure (4.1): National monitoring locations of the irrigation system in the Nile Delta Regions.
Ism
aile
ya
El-Beheary
Man
sour
ia
Sw
ez
EL-Nubaria
B. T
era
El-N
asr
B.S
hebe
n
El-Salam
EL-
Sah
el
El-A
tff
SalheyaEL-N
asserey
El-Neanaeaa
El-B
agouria
B. S
eaf
B. Tanag
Ferhash
Saideya
El-Hager
Dafan
Meet Y
azeedE
l-Kased
Karam
El-Mahmodia
El-Bohya
a
Bahr M
oueas
Basosiya
EL-
Sah
el1
Sahel M
orkosE
bto
Bor
t Sai
d
Bahig
El-Bahr El-SagherEl-Kadaba
EL-B
alam
on
Bases
Roneya
Shabaa
Hanou
t
B. Faq
ous
El-Nagar
Mansour
B. M
ash
tol
Bahr El-Shebine
El-Samaana
Maruit
El-K
hadr
awey
aS
habey
El-Rashedeya
Kan
a ba
Hafir Shehab Eleen
B. El-Malah
Sina
El-Manayef
El-H
ala
fey
B. E
l-Kha
lili
El-Herfa
El-Wadi
B. B
asan
dela
El-Tarfaya
B. N
asha
rt
Farara
El-B
azra
rey
El-B
atanoneya
Shos
ha
Rig
htB
. El-S
eade
eG
. B. E
l-Bashm
a
Sehem
El -S
efee
Navigation Canal
(EL-Wokalaa)
MI10
EI20
WI11
WI03
MI09
EI21
EH21
EH24 EH25
EI13
EI19
EI18
EI17
EI16
EI14
EI12
EI11
EI10
EI09
EI08
EI07
EI05
EI04
EI03
EI02
EI01
MI13MI12
MI11
MI07
MI04
MI02
MI01
WI12
WI09
WI08WI07
WI10
WI05
WI04
WI15
WI14WI02
WI01
460000.000000
460000.000000
520000.000000
520000.000000
580000.000000
580000.000000
640000.000000
640000.000000
700000.000000
700000.000000
760000.000000
760000.000000
8200
00.0
0000
0
8200
00.0
0000
0
8600
00.0
0000
0
8600
00.0
0000
0
9000
00.0
0000
0
9000
00.0
0000
0
9400
00.0
0000
0
9400
00.0
0000
0
9800
00.0
0000
0
9800
00.0
0000
0
��
¯
Legendps_irrigation_points
main_canals

25
Figure (4.2): National monitoring locations of the drainage system in the Nile Delta Regions.
#Y
#Y
#Y
#Y
#Y
#Y
#Y
#Y
#Y
#Y
#Y
#Y
#Y
#Y
#Y
#Y
#Y
#Y
#Y
#Y
#Y
#Y
#Y #Y
#Y
#Y
#Y
#Y
#Y #Y
#Y
#Y
#Y
#Y
#Y
#Y
#Y
#Y
#Y
#Y
#Y
#Y
#Y
#Y
#Y
#Y#Y#Y
#Y
#Y#Y#Y
#Y
#Y
#Y
#Y #Y
#Y
#Y#Y
#Y
#Y#Y
#Y#Y#Y
#Y
#Y
#Y
#Y
#Y
#Y
#Y
#Y
#Y
#Y
#Y
#Y
#Y
#Y
#Y#Y
#Y
#Y
#Y
#Y
#Y
#Y#Y#Y #Y #Y
#Y
#Y#Y
#Y
#Y
#Y
#Y#Y
#Y
#Y
#Y
#Y
#Y#Y
#Y
#Y
#Y #Y
#Y
#Y
#Y
#Y
#Y
#Y
#Y
#Y
#Y
#Y
#Y
#Y
#Y
#Y
#Y
MN60
MG20
MG28
MS07
WE21
M104
WN10
MT55
MK04
EB14
ET01
ES02MG05
MT01MB01
MG02
M103
MN01
WE11
WU08
WE02
WU09
WU03
WU02
WB01
EH17
WE19
WU57
MK02
MK03
MZ01
EB47
M109
EB31
MG15
WU01
WE13
WR03
WU56
ES01
ET02
WE06
MS01
MK01 MG01
WU06WU05
WU04WU07
WK28
WK30 WT01
WN13
WU10
WE04
WN01
WN03
WE05
EM02
EM01
EB15
EH10EH09
EH08EH11
EH07EH06
EH15EH05
EH03EH18
EH02
EH14
EH12
EB05EB06
EB43
EB40
EB38
EB07
EB10
EB08
M116
MG12
MG11
MG10
MG09
MN03M111
MN04
M801M701
MG07MG08MN02
MN62
MN59MG04
MG17
MG18
M101
ET03
EB09
EB36
EB04EB03
EB11EH04
MG25
MG03
MG14
WR01
WE08
WE10
WE03
WE07
WE20
WB23
WE01
EH16
MM01
WU11
WN11
EF01
MB02
Figure 1: The drainage System of the Nile Delta and the Monitoring Locations
Legend
Main Drains#Y Monitoring Locations
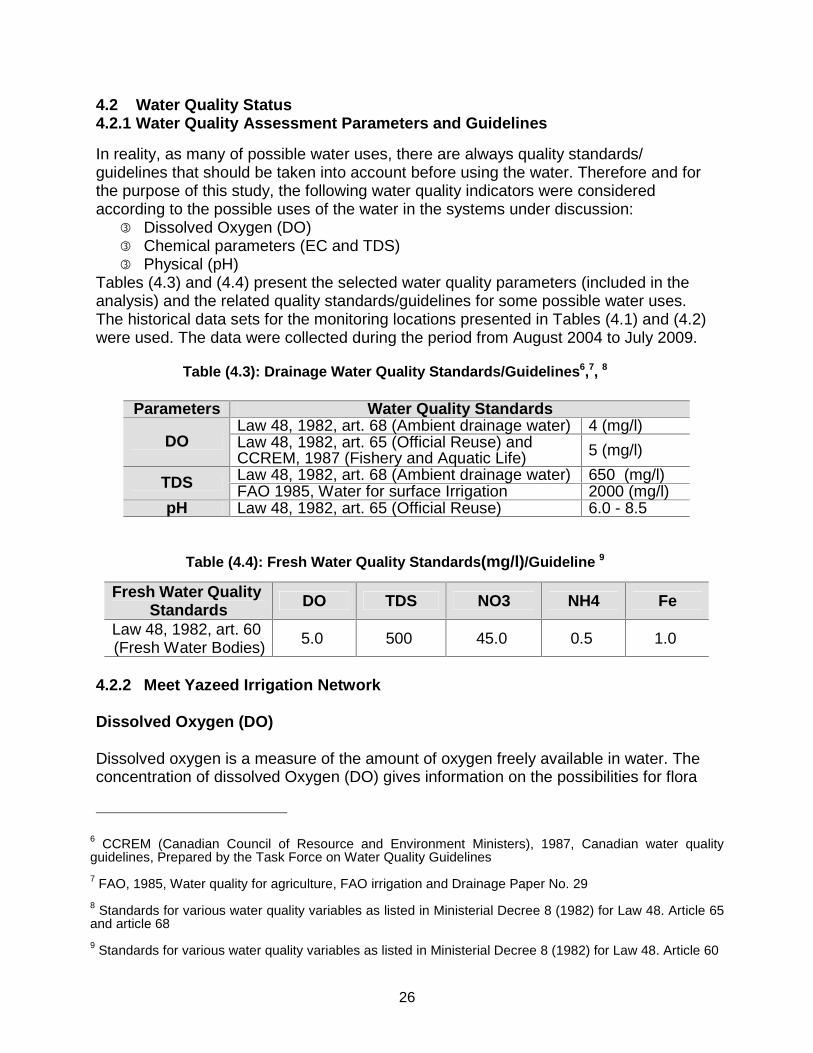
26
4.2 Water Quality Status 4.2.1 Water Quality Assessment Parameters and Guidelines
In reality, as many of possible water uses, there are always quality standards/ guidelines that should be taken into account before using the water. Therefore and for the purpose of this study, the following water quality indicators were considered according to the possible uses of the water in the systems under discussion:
�� Dissolved Oxygen (DO) �� Chemical parameters (EC and TDS) �� Physical (pH)
Tables (4.3) and (4.4) present the selected water quality parameters (included in the analysis) and the related quality standards/guidelines for some possible water uses. The historical data sets for the monitoring locations presented in Tables (4.1) and (4.2) were used. The data were collected during the period from August 2004 to July 2009.
Table (4.3): Drainage Water Quality Standards/Guidelines 6,7, 8
Parameters Water Quality Standards Law 48, 1982, art. 68 (Ambient drainage water) 4 (mg/l)
DO Law 48, 1982, art. 65 (Official Reuse) and CCREM, 1987 (Fishery and Aquatic Life) 5 (mg/l)
Law 48, 1982, art. 68 (Ambient drainage water) 650 (mg/l) TDS FAO 1985, Water for surface Irrigation 2000 (mg/l) pH Law 48, 1982, art. 65 (Official Reuse) 6.0 - 8.5
Table (4.4): Fresh Water Quality Standards (mg/l) /Guideline 9
4.2.2 Meet Yazeed Irrigation Network Dissolved Oxygen (DO) Dissolved oxygen is a measure of the amount of oxygen freely available in water. The concentration of dissolved Oxygen (DO) gives information on the possibilities for flora
6 CCREM (Canadian Council of Resource and Environment Ministers), 1987, Canadian water quality guidelines, Prepared by the Task Force on Water Quality Guidelines 7 FAO, 1985, Water quality for agriculture, FAO irrigation and Drainage Paper No. 29 8 Standards for various water quality variables as listed in Ministerial Decree 8 (1982) for Law 48. Article 65 and article 68 9 Standards for various water quality variables as listed in Ministerial Decree 8 (1982) for Law 48. Article 60
Fresh Water Quality Standards DO TDS NO3 NH4 Fe
Law 48, 1982, art. 60 (Fresh Water Bodies) 5.0 500 45.0 0.5 1.0

27
Table (4.5): Guidelines for Interpretation of Water Quality for Irrigation 1 (Source: FAO, 1985)
Degree of Restriction on Use
Potential Irrigation Problem Units None Slight to
Moderate Severe
Salinity (affects crop water availability)2 ECw dS/m <0.7 0.7-3.0 >3.0 (or) TDS mg/l <450 450-2000 >2000 Infiltration (affects infiltration rate of water into the soil. Evaluate using ECW and SAR
together)3 SAR and = 0-3 ECw = >0.7 0.7-0.2 <0.2 SAR =3-6 ECw = >1.2 1.2-0.3 <0.3 SAR =6-12 ECw = >1.9 1.9-0.5 <0.5 SAR =12-20 ECw = >2.9 2.9-1.3 <1.3 SAR =20-40 ECw = >5.0 5.0-2.9 <2.9
Specific Ion Toxicity (affects sensitive crops) Sodium (Na) 4
surface irrigation SAR <3 3-9 >9
sprinkler irrigation me/l <3 >3
Chloride (Cl) 4 surface
irrigation me/l <4 4-10 >10
sprinkler irrigation me/l <3 >3
Boron (B) mg/l < 0.7 < 0.7 0.7 - 3.0 Miscellaneous Effects (affects susceptible crops)
Nitrogen (NO 3 - N)5 mg/l <5 5-30 >30 Bicarbonate (HCO 3) (overhead sprinkling only) me/l <1.5 1.5 - 8.5 > 8.5
pH Normal Range 6.5-8.4 1 Adapted from University of California Committee of Consultants 1974. 2 ECw mean electrical conductivity, a measure of the water salinity, reported in (dS/m) at 25. TDS means total dissolved solids, reported in (mg/l). 3 SAR means sodium adsorption ratio. At a given SAR, infiltration rate increases as water salinity increases. Adapted from Rhoades 1977, and Oster and Schroer 1979. 4 For surface irrigation, most tree crops and woody plants are sensitive to sodium and chloride. Most annual crops are not sensitive. With overhead sprinkler irrigation and low humidity (<30 %), sodium and chloride may be absorbed through the leaves of sensitive crops. 5 NO3 - N means nitrate nitrogen reported in terms of elemental nitrogen (NH4 - N and Organic -N should be included when wastewater is being tested).
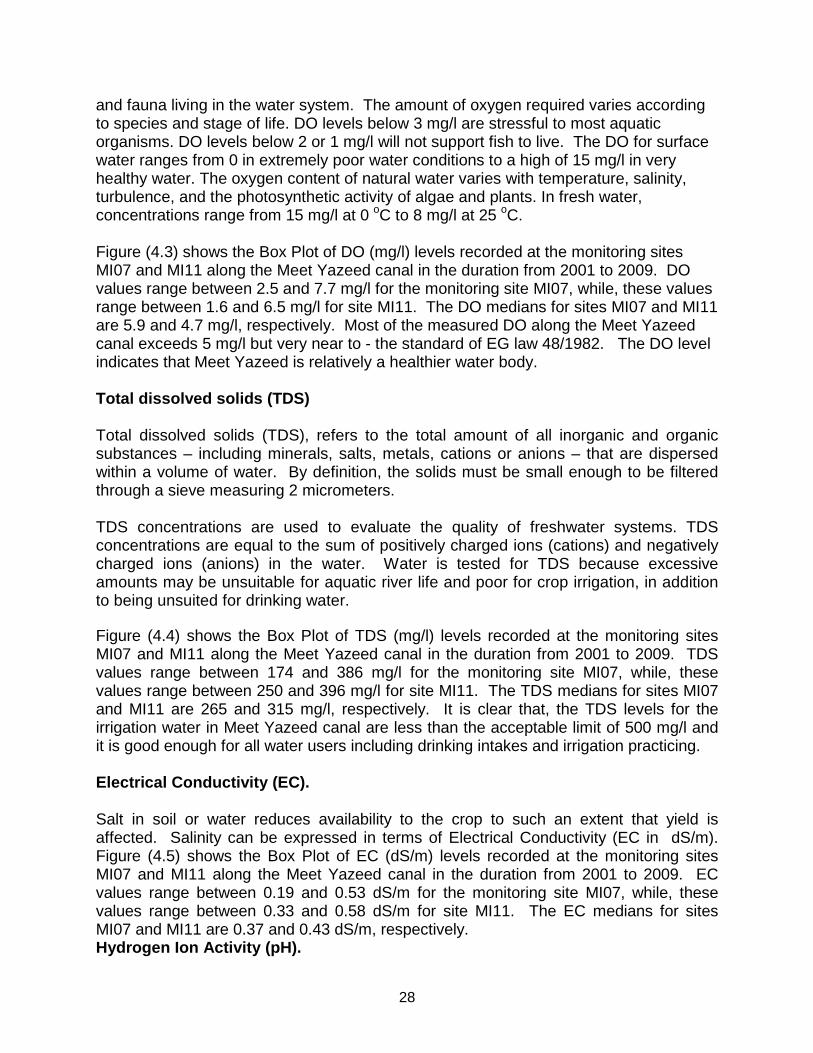
28
and fauna living in the water system. The amount of oxygen required varies according to species and stage of life. DO levels below 3 mg/l are stressful to most aquatic organisms. DO levels below 2 or 1 mg/l will not support fish to live. The DO for surface water ranges from 0 in extremely poor water conditions to a high of 15 mg/l in very healthy water. The oxygen content of natural water varies with temperature, salinity, turbulence, and the photosynthetic activity of algae and plants. In fresh water, concentrations range from 15 mg/l at 0 oC to 8 mg/l at 25 oC. Figure (4.3) shows the Box Plot of DO (mg/l) levels recorded at the monitoring sites MI07 and MI11 along the Meet Yazeed canal in the duration from 2001 to 2009. DO values range between 2.5 and 7.7 mg/l for the monitoring site MI07, while, these values range between 1.6 and 6.5 mg/l for site MI11. The DO medians for sites MI07 and MI11 are 5.9 and 4.7 mg/l, respectively. Most of the measured DO along the Meet Yazeed canal exceeds 5 mg/l but very near to - the standard of EG law 48/1982. The DO level indicates that Meet Yazeed is relatively a healthier water body. Total dissolved solids (TDS) Total dissolved solids (TDS), refers to the total amount of all inorganic and organic substances – including minerals, salts, metals, cations or anions – that are dispersed within a volume of water. By definition, the solids must be small enough to be filtered through a sieve measuring 2 micrometers. TDS concentrations are used to evaluate the quality of freshwater systems. TDS concentrations are equal to the sum of positively charged ions (cations) and negatively charged ions (anions) in the water. Water is tested for TDS because excessive amounts may be unsuitable for aquatic river life and poor for crop irrigation, in addition to being unsuited for drinking water. Figure (4.4) shows the Box Plot of TDS (mg/l) levels recorded at the monitoring sites MI07 and MI11 along the Meet Yazeed canal in the duration from 2001 to 2009. TDS values range between 174 and 386 mg/l for the monitoring site MI07, while, these values range between 250 and 396 mg/l for site MI11. The TDS medians for sites MI07 and MI11 are 265 and 315 mg/l, respectively. It is clear that, the TDS levels for the irrigation water in Meet Yazeed canal are less than the acceptable limit of 500 mg/l and it is good enough for all water users including drinking intakes and irrigation practicing. Electrical Conductivity (EC). Salt in soil or water reduces availability to the crop to such an extent that yield is affected. Salinity can be expressed in terms of Electrical Conductivity (EC in dS/m). Figure (4.5) shows the Box Plot of EC (dS/m) levels recorded at the monitoring sites MI07 and MI11 along the Meet Yazeed canal in the duration from 2001 to 2009. EC values range between 0.19 and 0.53 dS/m for the monitoring site MI07, while, these values range between 0.33 and 0.58 dS/m for site MI11. The EC medians for sites MI07 and MI11 are 0.37 and 0.43 dS/m, respectively. Hydrogen Ion Activity (pH).
29
The pH test is one of the most common analyses in water testing. An indication of the sample’s acidity, pH is actually a measurement of the activity of hydrogen ions in the sample. pH measurements run on a scale from 0 to 14, with 7.0 considered neutral. Solutions with a pH below 7.0 are considered acids; those between 7.0 and 14.0 are designated as bases. A range of 6.0 to 8.5 is optimal for most organisms. Figure (4.6) shows the Box Plot of pH levels recorded at the monitoring sites MI07 and MI11 along the Meet Yazeed canal in the duration from 2001 to 2009. pH values range between 7.15 and 8.3 for the monitoring site MI07, while, these values range between 6.8 and 8.35 for site MI11. The pH medians for sites MI07 and MI11 are 7.7 and 7.55, respectively. It is clear that, the pH levels for the irrigation water in Meet Yazeed canal are in the acceptable range of Law 48.

30
Box & Whisker Plot
Median 25%-75% Min-Max
MI07 MI111
2
3
4
5
6
7
8
DO
(m
g/l)
Box & Whisker Plot
Median 25%-75% Min-Max
MI07 MI11160
180
200
220
240
260
280
300
320
340
360
380
400
420
TD
S (
mg/
l)
Figure (4.3): DO Box Plot at Meet Yazeed Irrigation network
Figure (4.4): TDS Box Plot at Meet Yazeed Irrigation network
Law 48 Limit
Law 48 limit for TDS < 500 (mg/l)

31
Box & Whisker Plot
Median 25%-75% Min-Max
MI07 MI110.15
0.20
0.25
0.30
0.35
0.40
0.45
0.50
0.55
0.60
0.65
EC
(m
mho
s)
Box & Whisker Plot
Median 25%-75% Min-Max
MI07 MI116.6
6.8
7.0
7.2
7.4
7.6
7.8
8.0
8.2
8.4
8.6
PH
Figure (4.5): EC Box Plot at Meet Yazeed Irrigation network
Figure (4.6): pH Box Plot at Meet Yazeed Irrigation network
Law 48 limit for PH (6-8.5)
32
4.2.3 Meet Yazeed Drainage Network. There are three important main drains in Meet Yazeed command area; the first one is El-Gharbia main drain and its secondary drains Mahlet Ruh, Drain No. 6, and Samtay, which creates the eastern boundary of the command area. Mahlet Ruh drain mixed its water with Meet Yazeed canal, while, Drain No. 6 and Samatay flows their water into Gharbia drain. The other two important main drains are the Drain No. 7 and the Lower Drain no.8. The water quality analysis at the six monitoring stations MG03, MG04, M701, M801, MG07, and MG14 at Mahlet Ruh, Samtay, Drain No.7, lower Drain no.8, Drain No. 6, and Gharbia drains, respectively, will be discussed as follows: Dissolved Oxygen (DO). Figure (4.7) shows the Box Plot of DO levels (mg/l) recorded at the monitoring sites MG03, MG04, M701, M801, MG07, and MG14 in the duration from 2001 to 2009. DO values range between: (0.1 and 4.9 mg/l for MG03), (0.3 and 2.9 mg/l for MG04), (1.2 and 6.9 mg/l for M701), (1.3 and 7.5 mg/l for M801), (0.2 and 4.3 mg/l for MG07), and (0.2 and 3.9 mg/l for MG14). The DO medians are (1.4 mg/l for MG03), (1.5 mg/l for MG04), (3.9 mg/l for M701), (4.4 mg/l for M801), (1.9 mg/l for MG07), and (2 mg/l for MG14). Many of the DO levels at the monitoring locations MG03, MG04, MG07, and MG14 comply with the guidelines of EG law 48/1982 and the CCREM /1987 – while others not due to the high organic loads along Mahlet Ruh, Samtay, Drain No. 6, and Gharbia drains. Meanwhile, the monitoring locations M701 and M801 (Drain No.7 and lower drain no.8) showed relatively better DO levels. This again indicates that the Drain No.7 and the lower drain no.8 carry lower levels of organic loads. Total dissolved solids (TDS). Figure (4.8) shows the Box Plot of TDS levels (mg/l) recorded at the monitoring sites MG03, MG04, M701, M801, MG07, and MG14 in the duration from 2001 to 2009. TDS values range between: (400 and 800 mg/l for MG03), (600 and 850 mg/l for MG04), (1500 and 3200 mg/l for M701), (750 and 3150 mg/l for M801), (800 and 2950 mg/l for MG07), and (650 and 3350 mg/l for MG14). The TDS medians are (600 mg/l for MG03), (750 mg/l for MG04), (2500 mg/l for M701), (2550 mg/l for M801), (1900 mg/l for MG07), and (1750 mg/l for MG14). The analysis of the total dissolved solids TDS indicates that All the six sites exceeded EG law 48/82 limit of 500 mg/l. Moreover, the salinity of drainage water in lower drain no.8 and Gharbia drain (M801 and MG14) is very high such that it cannot be reused any more. In addition, the salinity of Drains No. 7 and 6 (M701 and MG07) was more than 1000 mg/l, which is not recommended to be reused because this will imply limitations on the cropping pattern and yields in the irrigated areas. Since more than 1000 ppm is considered too high for a number of crops such as most vegetables, maize, berseem, flax and a number of fruit trees. Other option is mixing with fresh water so the overall

33
salinity can be reduced after mixing to be below 1000 mg/l. However, this saline water can be used with some cautions according to FAO (1985) guidelines for irrigation water. On the other hand, the received drainage water from Mahlet Ruh drain (MG03) to Miet Yazeed canal has salinity less than 1000 (mg/l). Also, the drainage water of Samtay drain (MG04) has salinity less than 1000 (mg/l). Electrical Conductivity (EC). Figure (4.9) shows the Box Plot of EC (dS/m) levels recorded at the monitoring sites MG03, MG04, M701, M801, MG07, and MG14 in the duration from 2001 to 2009. EC values range between: (0.55 and 1.2 dS/m for MG03), (0.75 and 1.3 dS/m for MG04), (2.25 and 5.75 dS/m for M701), (1.05 and 5.05 dS/m for M801), (1.0 and 4.3 dS/m for MG07), and (0.9 and 5.8 dS/m for MG14). The EC medians are (0.8 dS/m for MG03), (1.1 dS/m for MG04), (4.0 dS/m for M701), (4.0 dS/m for MG01), (2.8 dS/m for MG07), and (2.9 dS/m for MG14). Hydrogen Ion Activity (pH). Figure (4.10) shows the Box Plot of PH levels recorded at the monitoring sites MG03, MG04, M701, M801, MG07, and MG14 in the duration from 2001 to 2009. PH values range between: (7.0 and 8.2 for MG03), (7.0 and 8.15 for MG04), (6.3 and 8.3 for M701), (7.2 and 8.2 for M801), (6.1 and 8.2 for MG07), and (6.9 and 8.25 for MG14). The PH medians are (7.5 for MG03), (7.55 for MG04), (7.7 for M701), (7.65 for M801), (7.5 for MG07), and (7.6 for MG14). It is clear that, the PH levels for the irrigation water in Meet Yazeed canal are in the acceptable range of Law 48.
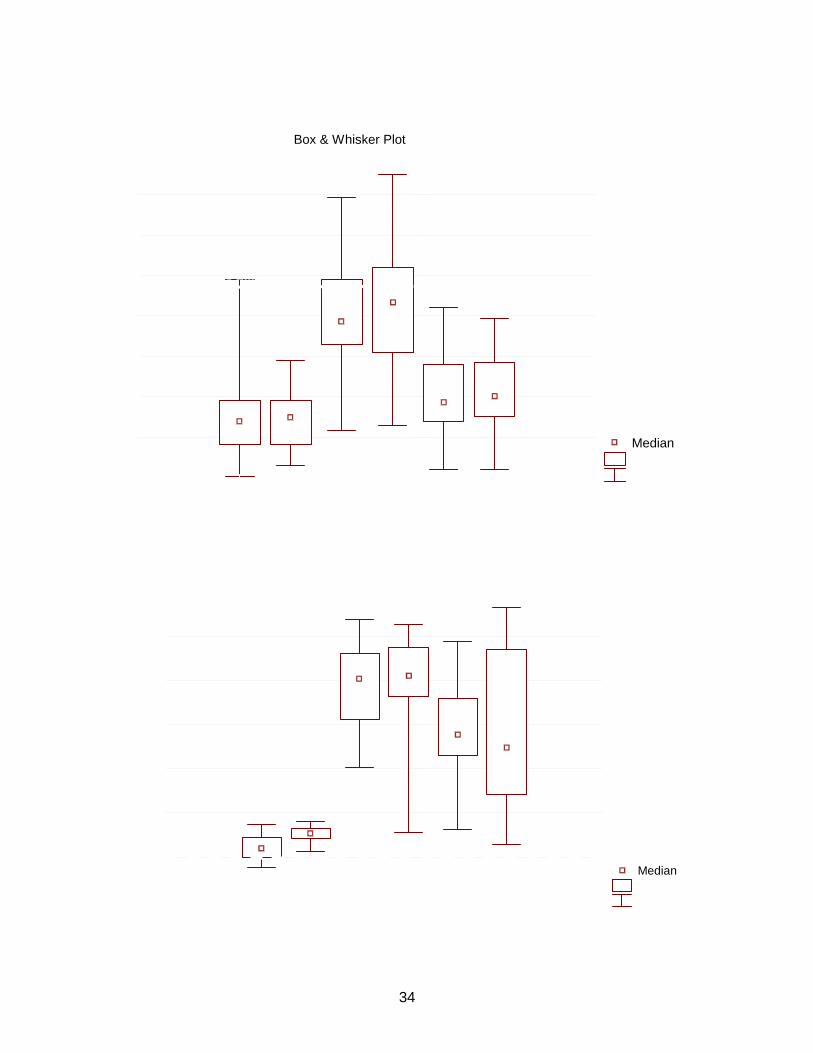
34
Box & Whisker Plot
Median 25%-75% Min-Max
MG03 MG04 M701 M801 MG07 MG140
1
2
3
4
5
6
7
8
DO
(m
g/l)
Box & Whisker Plot
Median 25%-75% Min-Max
MG03 MG04 M701 M801 MG07 MG140
500
1000
1500
2000
2500
3000
3500
TD
S (
mg/
l)
Figure (4.7): DO Box Plot at Meet Yazeed drainage network.
Figure (4.8): TDS Box Plot at Meet Yazeed drainage network.
Law 48 Limit
Law 48 Limit
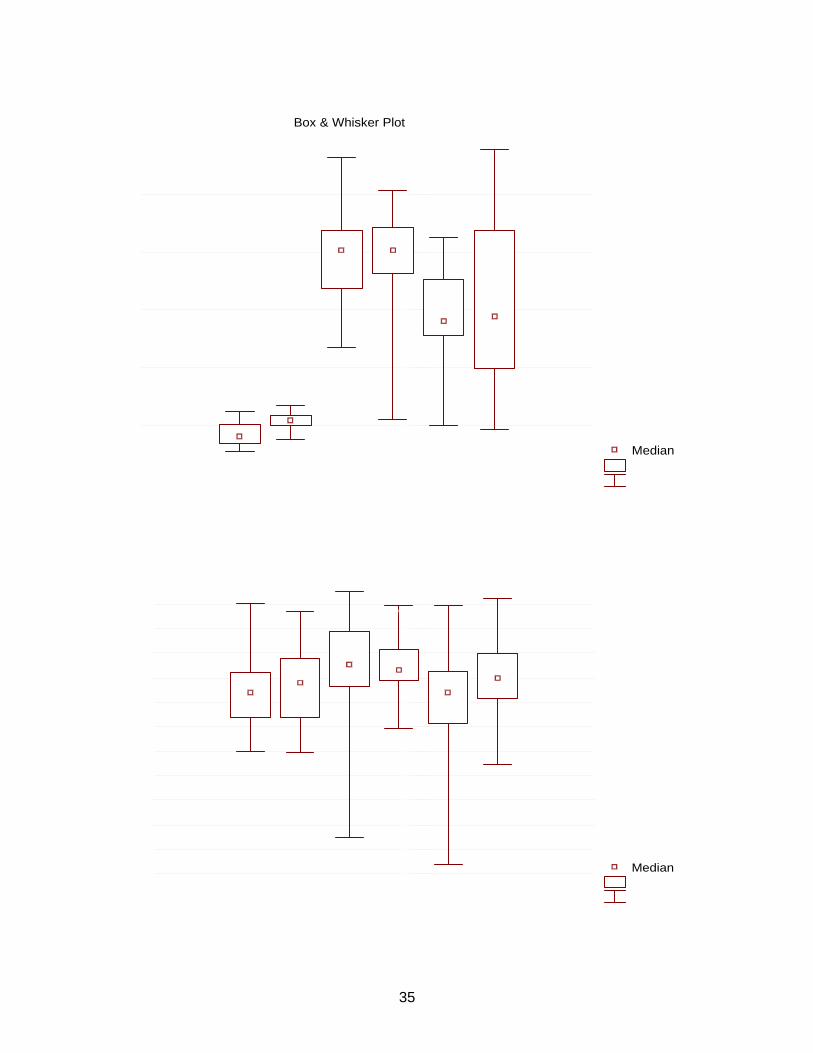
35
Box & Whisker Plot
Median 25%-75% Min-Max
MG03 MG04 M701 M801 MG07 MG140
1
2
3
4
5
6
EC
(m
mho
s)
Box & Whisker Plot
Median 25%-75% Min-Max
MG03 MG04 M701 M801 MG07 MG145.8
6.0
6.2
6.4
6.6
6.8
7.0
7.2
7.4
7.6
7.8
8.0
8.2
8.4
PH
Figure (4.9): EC Box Plot at Meet Yazeed drainage network.
Figure (4.10): pH Box Plot at Meet Yazeed drainage network.
Law 48 limit for PH (6-8.5)
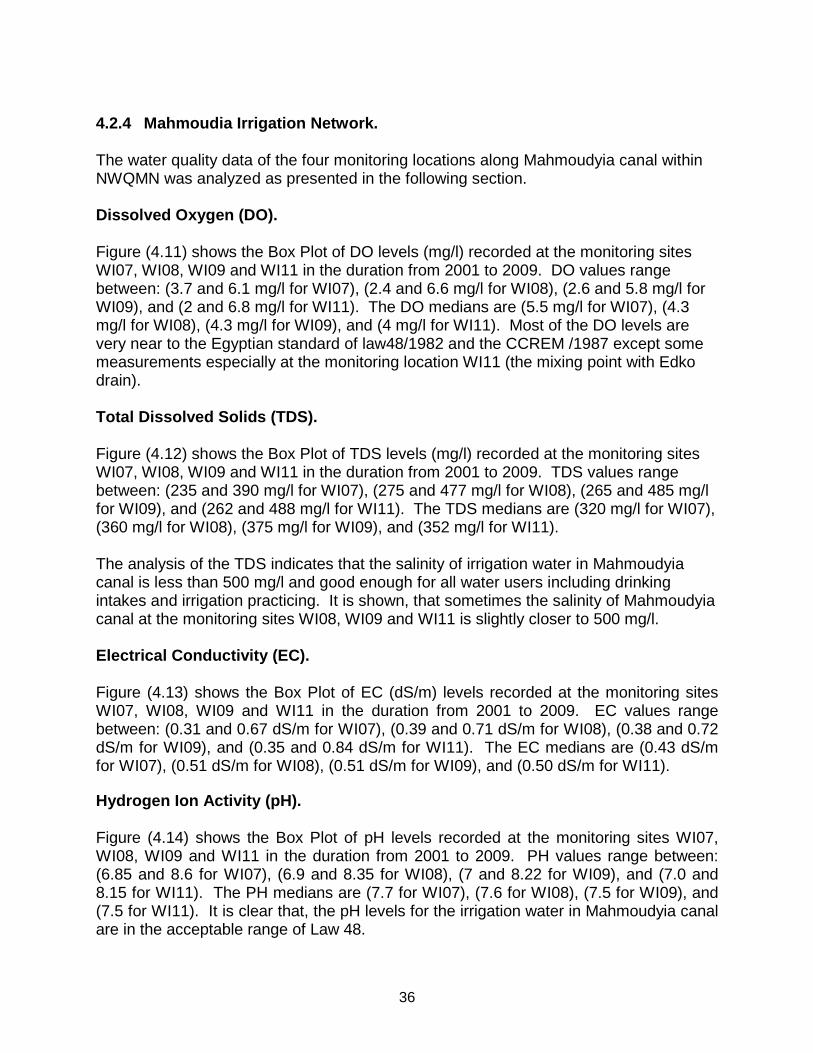
36
4.2.4 Mahmoudia Irrigation Network. The water quality data of the four monitoring locations along Mahmoudyia canal within NWQMN was analyzed as presented in the following section. Dissolved Oxygen (DO). Figure (4.11) shows the Box Plot of DO levels (mg/l) recorded at the monitoring sites WI07, WI08, WI09 and WI11 in the duration from 2001 to 2009. DO values range between: (3.7 and 6.1 mg/l for WI07), (2.4 and 6.6 mg/l for WI08), (2.6 and 5.8 mg/l for WI09), and (2 and 6.8 mg/l for WI11). The DO medians are (5.5 mg/l for WI07), (4.3 mg/l for WI08), (4.3 mg/l for WI09), and (4 mg/l for WI11). Most of the DO levels are very near to the Egyptian standard of law48/1982 and the CCREM /1987 except some measurements especially at the monitoring location WI11 (the mixing point with Edko drain). Total Dissolved Solids (TDS). Figure (4.12) shows the Box Plot of TDS levels (mg/l) recorded at the monitoring sites WI07, WI08, WI09 and WI11 in the duration from 2001 to 2009. TDS values range between: (235 and 390 mg/l for WI07), (275 and 477 mg/l for WI08), (265 and 485 mg/l for WI09), and (262 and 488 mg/l for WI11). The TDS medians are (320 mg/l for WI07), (360 mg/l for WI08), (375 mg/l for WI09), and (352 mg/l for WI11). The analysis of the TDS indicates that the salinity of irrigation water in Mahmoudyia canal is less than 500 mg/l and good enough for all water users including drinking intakes and irrigation practicing. It is shown, that sometimes the salinity of Mahmoudyia canal at the monitoring sites WI08, WI09 and WI11 is slightly closer to 500 mg/l. Electrical Conductivity (EC). Figure (4.13) shows the Box Plot of EC (dS/m) levels recorded at the monitoring sites WI07, WI08, WI09 and WI11 in the duration from 2001 to 2009. EC values range between: (0.31 and 0.67 dS/m for WI07), (0.39 and 0.71 dS/m for WI08), (0.38 and 0.72 dS/m for WI09), and (0.35 and 0.84 dS/m for WI11). The EC medians are (0.43 dS/m for WI07), (0.51 dS/m for WI08), (0.51 dS/m for WI09), and (0.50 dS/m for WI11). Hydrogen Ion Activity (pH). Figure (4.14) shows the Box Plot of pH levels recorded at the monitoring sites WI07, WI08, WI09 and WI11 in the duration from 2001 to 2009. PH values range between: (6.85 and 8.6 for WI07), (6.9 and 8.35 for WI08), (7 and 8.22 for WI09), and (7.0 and 8.15 for WI11). The PH medians are (7.7 for WI07), (7.6 for WI08), (7.5 for WI09), and (7.5 for WI11). It is clear that, the pH levels for the irrigation water in Mahmoudyia canal are in the acceptable range of Law 48.
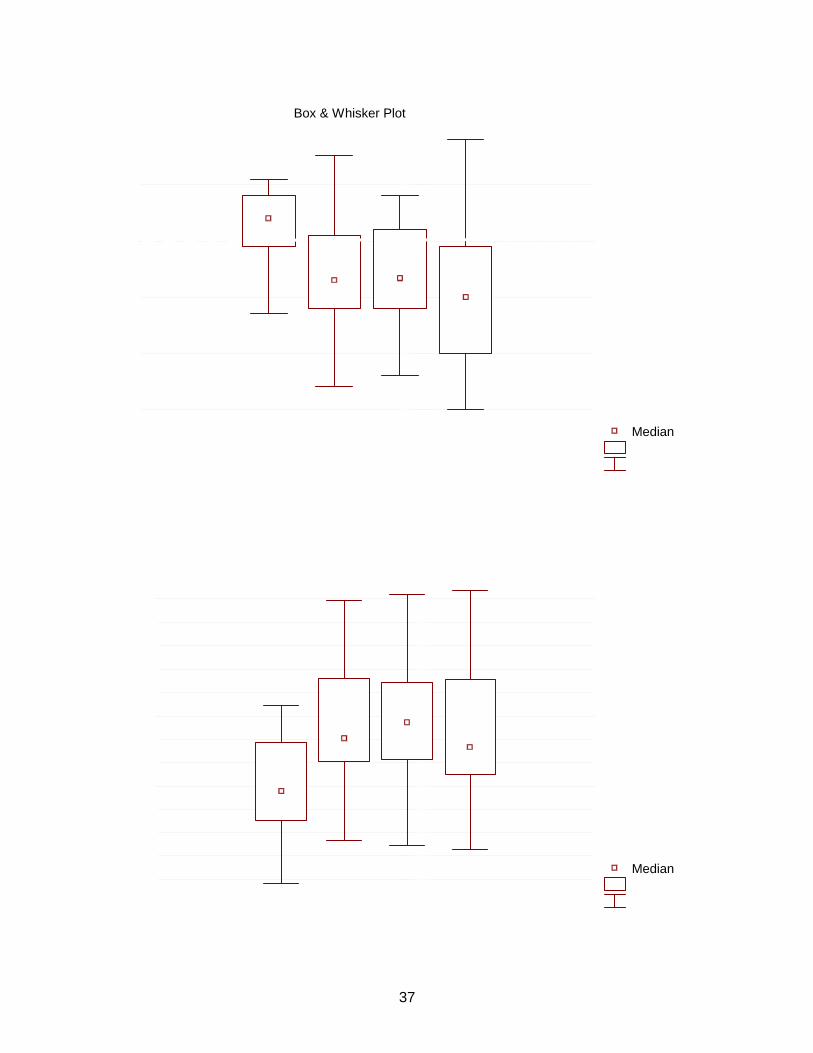
37
Box & Whisker Plot
Median 25%-75% Min-Max
WI07 WI08 WI09 WI111
2
3
4
5
6
7
DO
(m
g/l)
Box & Whisker Plot
Median 25%-75% Min-Max
WI07 WI08 WI09 WI11220
240
260
280
300
320
340
360
380
400
420
440
460
480
500
TD
S (
mg/
l) Figure (4.11): DO Box Plot at Mahmoudia Irrigation network.
Figure (4.12): TDS Box Plot at Mahmoudia Irrigation network.
Law 48 Limit
Law 48 Limit for TDS ‹ 500

38
Box & Whisker Plot
Median 25%-75% Min-Max
WI07 WI08 WI09 WI110.2
0.3
0.4
0.5
0.6
0.7
0.8
0.9E
C (
mm
hos)
Box & Whisker Plot
Median 25%-75% Min-Max
WI07 WI08 WI09 WI116.8
7.0
7.2
7.4
7.6
7.8
8.0
8.2
8.4
8.6
8.8
PH
Figure (4.13): EC Box Plot at Mahmoudia Irrigation network.
Figure (4.14): pH Box Plot at Mahmoudia Irrigation network.
Law 48 limit for PH (6-8.5)

39
4.2.5 Water Quality Status in Mahmoudia Drainage Network.
There are two major main drains in Mahmoudyia command. The first one is Edko drain system and its secondary drains Zarkon, Khairy, and Halq El-Gammal. The second drain system is Omum drain and its secondary drains are Abo Hommes and Dishudi, which serves Sidi Ghazi area, and Abies drain, which services El-Ramel area. The analysis of the water quality monitoring data of the two drain systems will be presented as follows.
4.2.5.1 Edko Drain System.
Edko drain water is mixed with Mahmoudyia canal with a mixing ratio of 8.4% according to the official data. The water quality analysis at the three monitoring stations WE03, WE05, and WE07 will be discussed only because the measurements of the monitoring station WE04 (Edko drain before mixing with Mahmoudyia canal) are not available.
Dissolved Oxygen (DO). Figure (4.15) shows the Box Plot of DO levels (mg/l) recorded at the monitoring sites WE03, WE07 and WE08 in the duration from 2001 to 2009. DO values range between: (1.0 and 3.4 mg/l for WE03), (0.6 and 2.2 mg/l for WE07), and (0.8 and 4.8 mg/l for WE08). The DO medians are (2.1 mg/l for WE03), (1.1 mg/l for WE07), and (2.4 mg/l for WE08). All of the DO levels along Zarkon, Khairy, and Edko drains did not comply with the Egyptian standard of law 48/1982 and the CCREM /1987 - due to the high organic loads.
Total Dissolved Solids (TDS). Figure (4.16) shows the Box Plot of TDS (mg/l) levels recorded at the monitoring sites WE03, WE07 and WE08 in the duration from 2001 to 2009. TDS values range between: (600 and 900 mg/l for WE03), (650 and 900 mg/l for WE07), and (800 and 1200 mg/l for WE08). The TDS medians are (800 mg/l for WE03), (800 mg/l for WE07), and (1000 mg/l for WE08). The analysis of the TDS indicates that the values of TDS for all of the three locations were higher than the EG law 48/1982 limit of 500 mg/l, while they were within the FAO limit of 2000 mg/l for use in surface water irrigation. Moreover, it is clear that the TDS averages in Zarkon and Edko before mixing with Mahmoudyia canal ranges from 500 to 900 mg/l, while the salinity of Edko drain after Halq El-Gamal P.S. exceeds 1000 mg/L, which cannot be reused any more because this will imply limitations on the cropping pattern and yields in the irrigated areas, since more than 1000 mg/l is considered too high for a number of crops such as most vegetables, maize, berseem, flax and a number of fruit trees.
Electrical Conductivity (EC).

40
Figure (4.17) shows the Box Plot of EC (dS/m) levels recorded at the monitoring sites WE03, WE07 and WE08 in the duration from 2001 to 2009. EC values range between: (0.50 and 1.8 dS/m for WE03), (0.60 and 1.2 dS/m for WE07), and (0.9 and 2.0 dS/m for WE08). The EC medians are (1.0 dS/m for WE03), (1.0 dS/m for WE07), and (1.50 dS/m for WE08).
Hydrogen Ion Activity (pH). Figure (4.18) shows the Box Plot of PH levels recorded at the monitoring sites WE03, WE07 and WE08 in the duration from 2001 to 2009. PH values range between: (7.0 and 8.4 for WE03), (6.9 and 8.10 for WE07), and (7.1 and 8.35 for WE08). The pH medians are (7.4 for WE03), (7.4 for WE07), and (7.5 for WE08). It is clear that, the PH levels for the irrigation water in Edko drain are in the acceptable range of Law 48.
4.2.5.2 Oumum Drain System.
Abo Hommes, Dishudi, and Abies are secondary drains of Omum drain, which serve Abo Hommes, Sidi Ghazi, Abies and El-Ramel areas. The water quality analysis at the three monitoring stations WU01, WU05, and WU07 will be discussed as follows:
Dissolved Oxygen (DO). Figure (4.15) shows the Box Plot of DO levels (mg/l) recorded at the monitoring sites WU01, WU05, and WU07 in the duration from 2001 to 2009. DO values range between: (2.1 and 4.8 mg/l for WU01), (0.8 and 4.3 mg/l for WU05), and (1.3 and 5.8 mg/l for WU07). The DO medians are (3.5 mg/l for WU01), (2 mg/l for WU05), and (3.2 mg/l for WU07).
Most of the dissolved Oxygen concentrations along Abo Hommes, and Dishudi, are less than the Egyptian standard of law 48/1982 and the CCREM /1987 due to their high organic loads. However, there is an improvement in the measured DO values in Abies drain, which serves the El-Ramel district.
Total Dissolved Solids (TDS). Figure (4.16) shows the Box Plot of TDS (mg/l) levels recorded at the monitoring sites WU01, WU05, and WU07 in the duration from 2001 to 2009. TDS values range between: (1000 and 1400 mg/l for WU01), (1500 and 3500 mg/l for WU05), and (3050 and 7050 mg/l for WU07). The TDS medians are (1200 mg/l for WU01), (2600 mg/l for WU05), and (5200 mg/l for WU07).
The analysis of the total dissolved solids TDS indicates that Measured values at the three locations violated the EG law 48/1982 limit of 500 mg/l. Meanwhile, locations WU05 and WU07 violated the FAO limit of 2000 (mg/l), and location WU01 complied with that limit most of the time.
Furthermore, it is found that all of the TDS concentrations exceed 1000 mg/L in Abo Hommes, Sidi Ghazi, Abies and El-Ramel drains and it can not be reused for agriculture

41
because this will imply limitations on the cropping pattern and yields in the irrigated areas, since more than 1000 mg/l is considered too high for a number of crops such as most vegetables, maize, berseem, flax and a number of fruit trees. The TDS levels reach more than 7000 mg/l in El-Ramel district. Electrical Conductivity (EC). Figure (4.17) shows the Box Plot of EC (dS/m) levels recorded at the monitoring sites WU01, WU05, and WU07 in the duration from 2001 to 2009. EC values range between: (1.4 and 2.3 dS/m for WU01), (2.9 and 5.4 dS/m for WU05), and (4.8 and 11.2 dS/m for WU07). The EC medians are (1.6 dS/m for WU01), (4.4 dS/m for WU05), and (8.3 dS/m for WU07). Hydrogen Ion Activity (pH). Figure (4.18) shows the Box Plot of pH levels recorded at the monitoring sites WU01, WU05, and WU07 in the duration from 2001 to 2009. pH values range between: (6.1 and 8.25 for WU01), (6.95 and 8.15 for WU05), and (7.3 and 8.25 for WU07). The pH medians are (7.5 for WU01), (7.5 for WU05), and (7.55 for WU07). It is clear that, the pH levels for the irrigation water in Omum drain are in the acceptable range of Law 48.
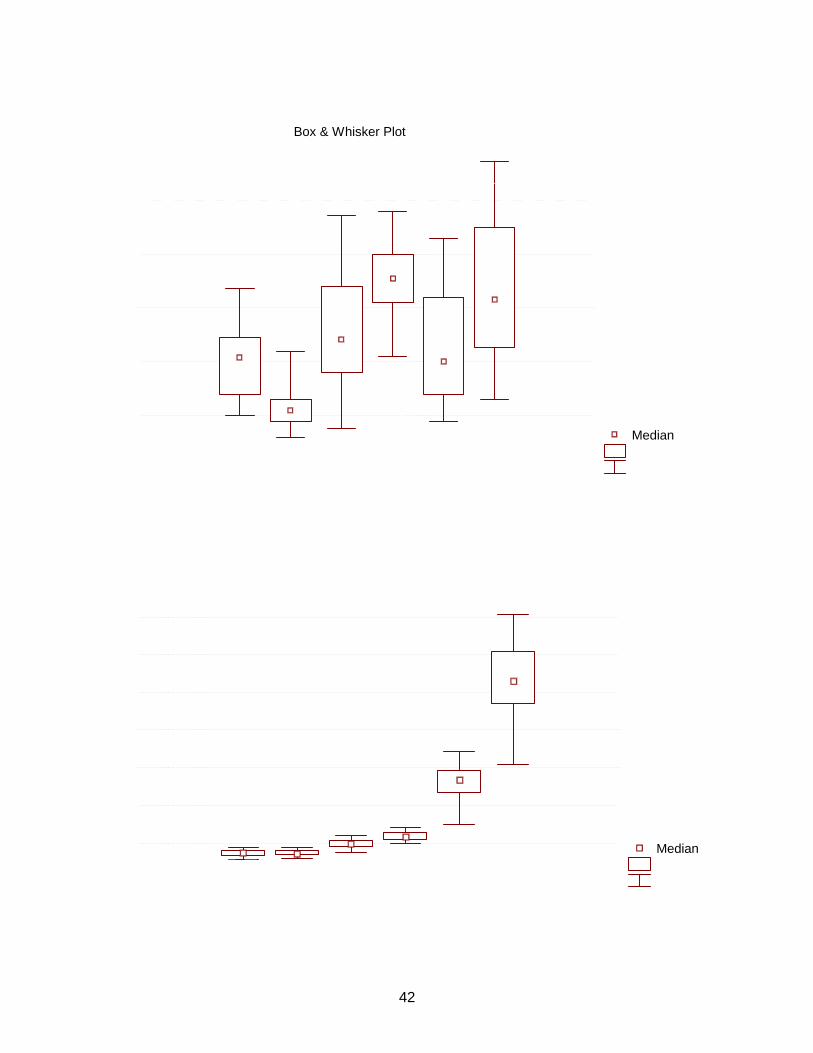
42
Box & Whisker Plot
Median 25%-75% Min-Max
WE03 WE07 WE08 WU01 WU05 WU070
1
2
3
4
5
6
DO
(m
g/l)
Box & Whisker Plot
Median 25%-75% Min-Max
WE03 WE07 WE08 WU01 WU05 WU070
1000
2000
3000
4000
5000
6000
7000
8000
TD
S (
mg/
l)
Figure (4.15): DO Box Plot at Edko and Omum Drainage network.
Figure (4.16): TDS Box Plot at Edko and Omum Drainage network.
Law 48 Limit
Law 48 Limit
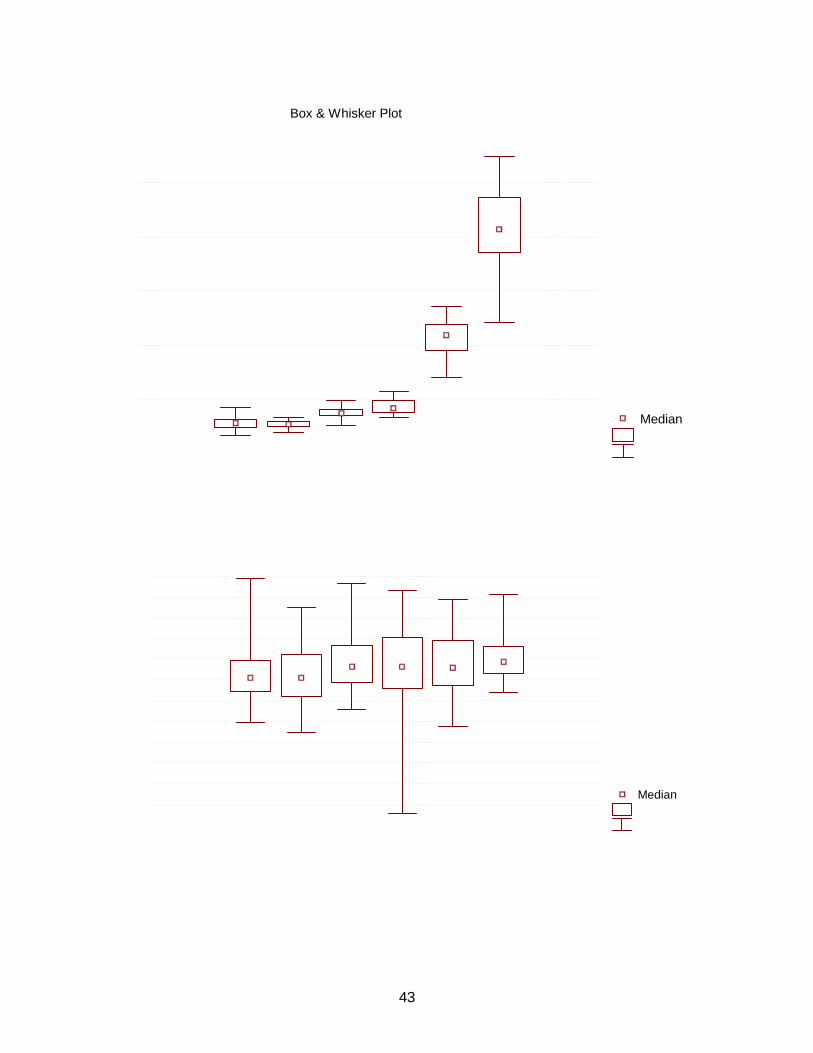
43
Box & Whisker Plot
Median 25%-75% Min-Max
WE03 WE07 WE08 WU01 WU05 WU070
2
4
6
8
10
12
EC
(m
mho
s)
Box & Whisker Plot
Median 25%-75% Min-Max
WE03 WE07 WE08 WU01 WU05 WU076.0
6.2
6.4
6.6
6.8
7.0
7.2
7.4
7.6
7.8
8.0
8.2
8.4
8.6
PH
Figure (4.17): EC Box Plot at Edko and Omum Drainage network.
Figure (4.18): pH Box Plot at Edko and Omum Drainage network.
Law 48 limit for PH (6-8.5)

44
4.3 Environmental Profile Mahmoudia Canal Command Area. The Mahmoudia Canal command area (MCA) is located on the northern edge of the West Delta region in Behera Governorate. The Mahmoudia Canal is a 77.1 kilometers long canal which runs from the Rosetta Branch of the River Nile close to the town of El Mahmoudia in a North West direction to Alexandria and the Mediterranean Sea. Mahmoudia is a navigable canal and is the only source of municipal and industrial water for Alexandria, the second largest city in Egypt, and five other cities and 85 mother villages. The physical environment of relevance to the project environmental management component is that typical of a rural/peri-urban environment. 4.3.1 Water Resources Being the largest of the project focus areas of interventions, the MCA is the highest in relation to the availability and consumption of water resources. As opposed to the other command areas, the Mahmoudia canal is also used for navigation purposes. The total volume of available water resources and their consumption patterns are reflected in ( Table 4.6).
Table (4.6): Water Resources and Demand in MCA.
Resources Volume (million m 3/ year)
Surface 2973.910 Ground Water 30 Re-use 227.211 Total 3,231.1
Sector Demand and Use Volume (million m 3/ year)
Irrigation 2540 Municipal 983.212 Industry 2-3 Power Not quantified Navigation Not quantified
The irrigation system composed of the Mahmoudia canal, more than 55 branch canals with cumulative length of 700 km delivers water relatively polluted in nature. The water quality in the branch canals is similar to or in a worse condition than that of the Mahmoudia canal itself.
10 The surface water is mainly provided by El- Atf pumping station and El Khandaq canal 11 Official only un official re-use is around 300 million m3/year 12 Alexandria, and Kafr El Dawar Plants

45
The open drain system in MCA (a network of 400 kms open drains) receives the excess of irrigation water that flows through the soil or via the constructed subsurface drainage system. The quality of drainage water is affected by chemical composition of the soils, toxic substances used for pest or herb control and domestic effluents from the banks. Most of the drainage system of MCA discharges to the Mediterranean Sea, Lake Idku or Lake Maryut. Water quality in the main drains of MCA where provided by the Drainage Research Institute (DRI) for the year 2003. The DRI performs a comprehensive environmental monitoring system for drainage water quality in the Nile Delta’s principal drainage canals with about 150 sampling locations. The sampling frequency is monthly. The Oxygen concentrations in most drains are below the saturation level. Typical average values lie between 3 and 6 mg/l, with a large variability especially towards the lower values. Nutrients occur in the drainage water as a result of the application of fertilizers in agriculture as well as from domestic wastewater. Average Nitrate (N03-N) and Ammonium (NH4-N) do not show large spatial variations over the MCA with concentrations around 1 to 2 mg N/l. Phosphorus is generally around 0.5 mg P/l. Heavy and trace metals mainly occur in drainage water as a result of industrial discharges or from impurities in fertilizers and from rock leaching (mainly Fe and Mn). Available data indicate average Cadmium concentrations values around 0.01 mg/l in the MCA (with similar patterns in the Middle Delta). The concentrations are also in the range of 0.02 to 0.03 mg/l in the Eastern Delta. Iron concentrations are around 0.25 mg/l, Copper around 0.08 mg/l and Zinc 0.03 mg/l. These levels of pollutants are generally not limiting for direct agricultural use, except for Cd, for which the FAO recommends a standard of 0.01 mg/l. Salts reach drains with the percolating irrigation water, enriched through evaporation as well as through flushing of salts from soils and aquifers. Total Dissolved Solids (TDS) concentrations are a good indicator for the salt concentrations. Generally, TDS increases from the south to the north due to repeated use of water and also due to the local presence of saline groundwater in the north. TDS is also high as a result of flushing from higher soils. The lowest concentrations in drains in the MCA can be found in the north with values of around 650 mg/l. Most of the remaining northern region has a TDS concentration of around 1,000 mg/l. Near the coast and the Delta fringes the concentrations rapidly increase to values up to 5,000 to 6,000 mg/l. There is a gradual increasing trend in salt content of the drainage water over time as a result of increases in official and unofficial reuse, which abstracts the relatively good water and increases the evaporative enrichment. According to the NWRP13, such patterns are similar in the entire delta with no drains of significant size meet TDS standard specified by law 48.
13 NWRP TR No. 5 – Water Quality and Resource Planning.

46
In a recent survey conducted by the Agricultural Policy reform Programme, Water Policy Reform Component, the main drains in MCA are subjected to both domestic (point and non-point) sewage discharge as well as industrial point sources discharge. Although, the largest contributor yet remains agricultural drainage. The final source of water in the MCA is the ground water resources. The MCA resources, as is the case in the western delta in general, is a part of the Nile Deposit Basin. The overall capacity of the aquifer in the west delta portion is about 1,425 million m3/year. On the average, 1,365 million m3 (only 30 million of which is within MCA) is withdrawn every year (about 96% of the annual recharge volume). The west delta also borders the Moghra Aquifer containing about 1 billion m3 of water reported at a salinity equal to or greater than 3000ppm.
An IIP sponsored study conducted on the shallow groundwater table and the salt concentration in the groundwater revealed that: 0.09% of the Mahmoudia area had a water table level of 120 cm from the surface, 83.92% of the area had a water table level between 70- 120cm from the surface. 0.37% of the area had a water table level of less than 70cm from the surface. According to RIGW, the main characteristic of groundwater utilization in MCA involves that:
��Number of licensed wells is 120, average wells depth (70m), Depth to static W.T. Level (3 to 4m)
��Well pumping rate (700 m3/day), with salinity increase to the North ��GW potential med - high , GW Vulnerability is med – low, GW quality is Na
Mixed NaHCO3
During the public consultation held in MCA, the irrigation officials have confirmed that although ground water abstraction in Mahmoudia CA is currently restricted, it is still widely practiced, particularly at the tail end of un-improved areas.
4.3.2 Soil Quality
The soil of the lands served by Mahmoudia Canal is alluvial-clayey soil, similar to the rest of the delta, which is formed from sediments deposited by the River Nile during the annual floods. Soil Section of the Ministry of Agriculture and Land Reclamation (MALR) conducts land survey annually. The data for the project area comes from a compilation of land surveys carried out in the years 1986-93. Some data was also obtained from the MALR’s Soil Amelioration Project. A summary of soil related properties (Table 4.7) follows (however, worth highlighting that the soil suffering from salinity in Behera governorate in general is almost 80%).
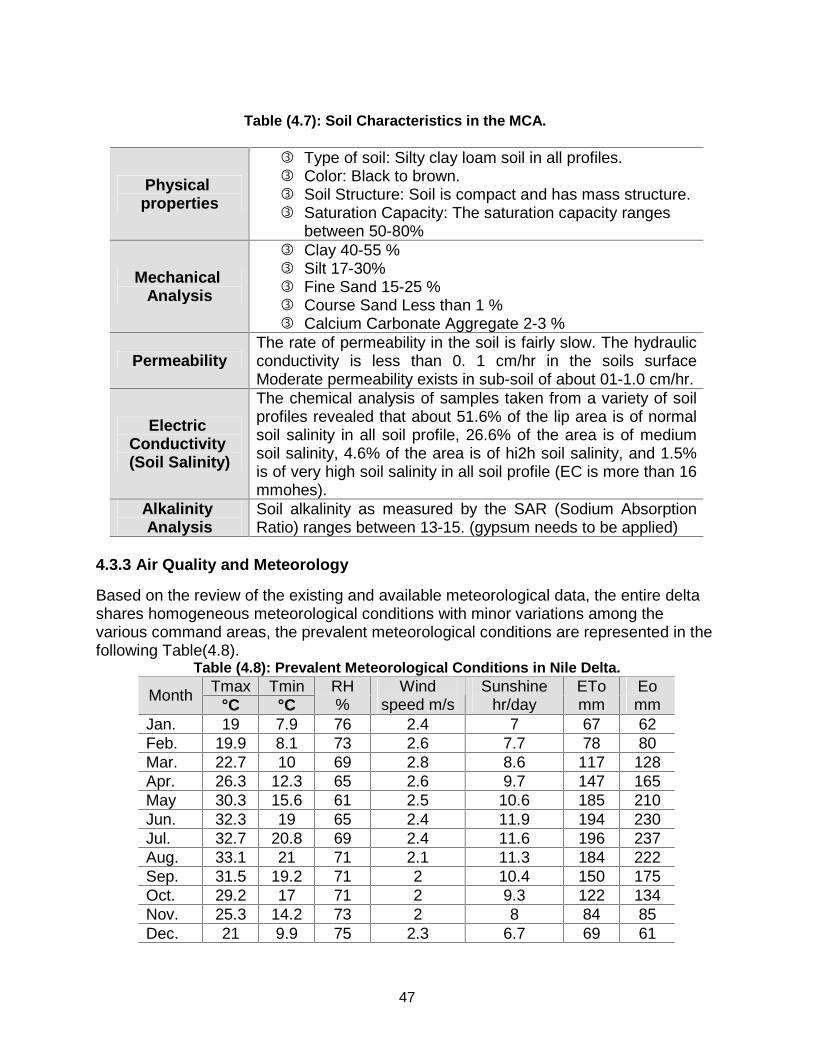
47
Table (4.7): Soil Characteristics in the MCA.
Physical properties
��Type of soil: Silty clay loam soil in all profiles. ��Color: Black to brown. ��Soil Structure: Soil is compact and has mass structure. ��Saturation Capacity: The saturation capacity ranges
between 50-80%
Mechanical Analysis
��Clay 40-55 % ��Silt 17-30% ��Fine Sand 15-25 % ��Course Sand Less than 1 % ��Calcium Carbonate Aggregate 2-3 %
Permeability The rate of permeability in the soil is fairly slow. The hydraulic conductivity is less than 0. 1 cm/hr in the soils surface Moderate permeability exists in sub-soil of about 01-1.0 cm/hr.
Electric Conductivity (Soil Salinity)
The chemical analysis of samples taken from a variety of soil profiles revealed that about 51.6% of the lip area is of normal soil salinity in all soil profile, 26.6% of the area is of medium soil salinity, 4.6% of the area is of hi2h soil salinity, and 1.5% is of very high soil salinity in all soil profile (EC is more than 16 mmohes).
Alkalinity Analysis
Soil alkalinity as measured by the SAR (Sodium Absorption Ratio) ranges between 13-15. (gypsum needs to be applied)
4.3.3 Air Quality and Meteorology
Based on the review of the existing and available meteorological data, the entire delta shares homogeneous meteorological conditions with minor variations among the various command areas, the prevalent meteorological conditions are represented in the following Table(4.8).
Table (4.8): Prevalent Meteorological Conditions in Nile Delta. Tmax Tmin Month
°C °C RH %
Wind speed m/s
Sunshine hr/day
ETo mm
Eo mm
Jan. 19 7.9 76 2.4 7 67 62 Feb. 19.9 8.1 73 2.6 7.7 78 80 Mar. 22.7 10 69 2.8 8.6 117 128 Apr. 26.3 12.3 65 2.6 9.7 147 165 May 30.3 15.6 61 2.5 10.6 185 210 Jun. 32.3 19 65 2.4 11.9 194 230 Jul. 32.7 20.8 69 2.4 11.6 196 237 Aug. 33.1 21 71 2.1 11.3 184 222 Sep. 31.5 19.2 71 2 10.4 150 175 Oct. 29.2 17 71 2 9.3 122 134 Nov. 25.3 14.2 73 2 8 84 85 Dec. 21 9.9 75 2.3 6.7 69 61

48
The quality of air in both the agricultural and peri-urban environment is somewhat deteriorated. The types of pollutants differ across the command area depending upon the activities:
��Industrial areas, such as Kafr El Dawar City, and Mahmoudia city (electric power stations); the main pollutants are ammonia, nitrogen oxides and particulates;
��In the main cities the main pollutants are particulates, sulfur dioxide and nitrogen oxides emitted from heavy traffic;
��In rural areas, particulates originating from fertilizer and pesticide dust and plant residues burning are the main pollutants.
4.3.4 Biological Environment. The biological environment within the boundaries of the command area is mainly cultivations with typical delta flora associated with the irrigation drainage system. However, two lakes of biological significance border the command area and is directly connected with and affected by the main drains. These lakes are Lake Maryut and lake Idku. 4.3.4.1 Lake Maryut. The El-Mex Pump Station controls the water level in Lake Maryut, which is typically kept between 2.2 and 2.4 m below MSL. Where the Omoum Drain crosses the Nubariyah Canal, a siphon was built to convey Omoum Drain waters under the Nubariyah Canal, but the siphon is now largely plugged with debris and Omoum Drain waters flow around the siphon through side channels and breaches and also through sections of the Main and Northwest basins. In general, the four basins of lake Maryut now range from meso-to hyper-eutrophic (i.e. very high nutrient content). Eutrophication is a main threat to the survival of the remaining fisheries usable habitat, since there are still significant populations of four species of tilapia, two species of mullet, one species of catfish and one species of eel. According to the NWRP14, any decrease of flow (as a result of reuse of drainage water) will shift the production since both will be heavily contaminated by toxicants, there is no economic gain. 4.3.4.2 Lake Edku.
Lake Idku is situated 30 km east of Alexandria. It is a shallow brackish water lake, with one connection to the sea. Large areas of the originally 150 km3 have disappeared due to land reclamation. The lake receives water from 3 major drains along the southern and eastern shores. There is a gradient of nearly salt water close to the inlet, to nearly fresh water in the south. With the increase of drainage water the salinity was pushed back, and the once profitable high-valued fish species were replaced by mainly low-valued
14 NWRP- Report No. 10: Fisheries and Water Resources
49
tilapias: presently 80% of the catch. The lake is considered hypertrophic; other water quality data are not available. Pollution is from domestic waste and especially from agricultural chemicals. Lake Edku is reported to produce some 10,000 t yearly. Pen culture did not come into development, and the main limiting factor for capture fisheries is the extensive reed growth, slowly turning more of the lake into land. The lake has a slightly negative water balance; further development of reuse of drainage water will result in additional Salinization, albeit not to a level suitable for marine fish species. Decreasing the inflow from drains would increase salinity (from the sea) further, and would also be detrimental for the excessive reed stands, now hampering fisheries activities. 4.3.4.3 Flora and Fauna. The habitats of the MCA command area (as well as for the majority of the delta region) is mainly symbolized in aquatic canals, drainage channels, swampy areas, canal banks, cultivated lands and the northern shallow lakes. The aquatic habitat is home to some 35 species of aquatic weed. The plants are either entirely submerged, free floating or may have roots which penetrate the soil at the bottom of shallow channels. Before the establishment of the Aswan High Dam, these water weeds were not especially troublesome. However, the Dam has caused a number of significant ecological changes. These include generally lower water levels and decreased water velocities. These, combined with the extensive use of inorganic fertilizers to compensate for the absence of formerly-plentiful silt, has resulted in the phenomenon of eutrophication - both an unnatural increase in fertility caused by nutrients leaching into the water bodies and lower oxygen levels - throughout most of the water channels in the Nile System. This frequently leads to large areas of water weeds, the most notorious being the Water Hyacinth or Nile Lily (Eichhornia crassipes), a native plant of Brazil which is now naturalized in Egypt. In places throughout the Delta its growth can be so dense that a person can actually walk across the water body in which it is growing. Many of these weeds also harbor pests serious to health, such as the water snail which is host to the Bilharzia parasite. In summary, aquatic weeds cause serious adverse impacts on irrigation, drainage, navigation, fishing, health and crop cultivation. In addition, significant financial resources are used to control these weeds mechanically and chemically.
Swampy areas involve shallow and very slow moving waters. They are the preferred habitat of several reed species and tall grasses. Many of these plants, such as the grass Echinochloa stagnina or the reed Typha domingensis, can spread from the swampy areas and choke adjacent water courses. In parts of the Governorate E. stagnina is cultivated as a fodder crop. This can exacerbate the spread of the plant as a noxious weed if it is not carefully controlled.

50
Canal bank habitat includes vegetation with bank-holding qualities, the roots of which bind soil and can shade out some of the aggressive water weeds at the seedling stage. These, under other conditions, would choke the water course. Plants in this category include cultivated trees and shrubs, such as acacia, fig and tamarix, as well as certain ,smothering, undershrubs, herbs and grasses. Other plants can tolerate and partly stabilise drift sand. They are also especially good for forming wind breaks. One common canal bank herb, Kochia indica, is salt tolerant and drought resistant, as well as being rich in nutritive value as green or dry fodder for livestock. Canal and drain banks are usually cleared of weeds once or twice each year, with shrubs such as tamarix being cut to ground level for fuel and making mats or shelters. Cutting weeds or pulling them at an early stage promotes the bank retainers and smotherers, thereby both reducing the chances of aquatic weeds establishing and preventing the serious problem of bank slip. Cultivated and irrigated lands form the largest single habitat in the command area, with the majority of the water being supplied through a perennial irrigation system. Rain-fed agriculture is restricted to the winter and spring months, as well as being confined to a narrow strip of land (approx. 25 km wide) running parallel to the Mediterranean coast.
Two crops are grown annually. Among each set of crops, there is at least a cereal and a leguminous or oil crop. Most of the weeds of these crops are short-lived herbs.
4.3.5 Socio-Economic and Cultural Environment.
The population within the rural and peri-urban areas of the MCA are approximately around 1.4 million, 65 % of which live in highly clustered mother and satellite villages. The majority of the population is engaged in agriculture, while peri-urban dwellers are mainly engaged in the provision of services and government employment with minor portion involved in industrial activities.
4.3.5.1 Population and Human Settlements.
MCA is within the administrative boundaries of Behera governorate. 95 % of the total area is covered mainly by three Marakez (Egyptian Designation of Local Administrative Units). The Marakez are Mahmoudia, Abou Hommos, and Kafr El Dawar. The level of income varies between the Marakez and between rural and peri-urban settlements as presented in Table ( 4.9 ) and illustrated in Fig. (4.19 ).
The following table presents the population break down in each Markaz as well as the surveyed level of income.
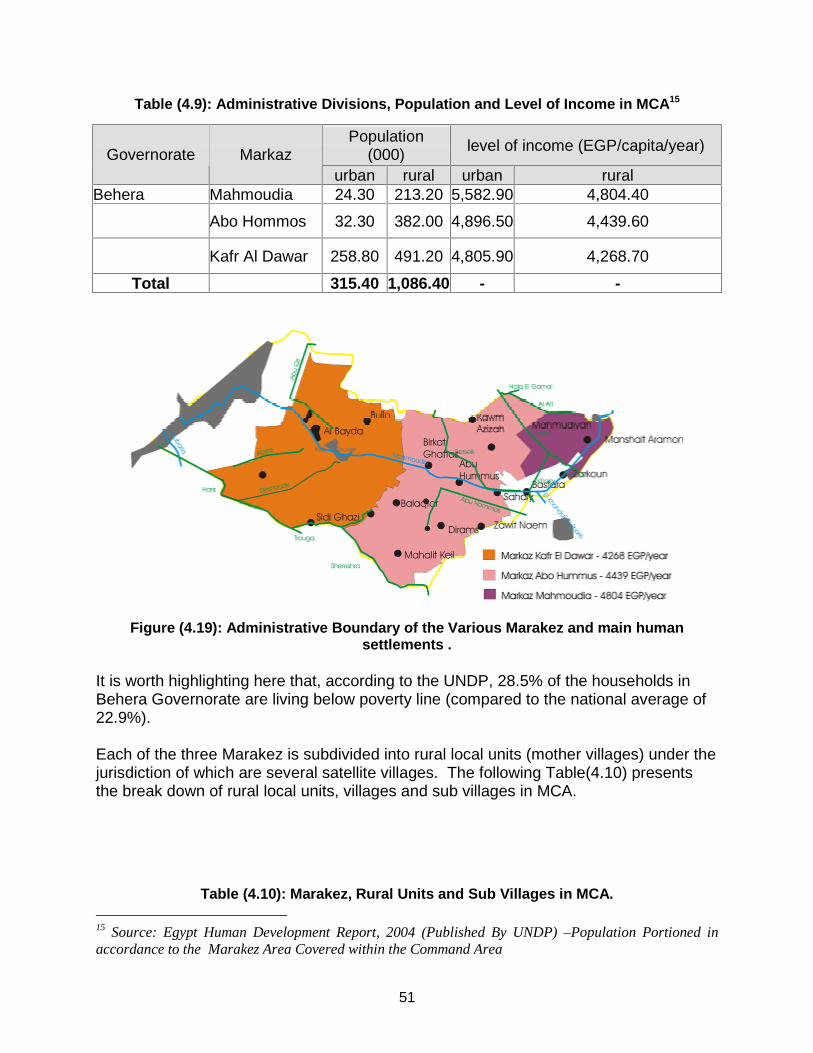
51
Table (4.9): Administrative Divisions, Population and Level of Income in MCA 15
Population (000) level of income (EGP/capita/year) Governorate Markaz
urban rural urban rural Behera Mahmoudia 24.30 213.20 5,582.90 4,804.40
Abo Hommos 32.30 382.00 4,896.50 4,439.60
Kafr Al Dawar 258.80 491.20 4,805.90 4,268.70
Total 315.40 1,086.40 - -
Figure (4.19): Administrative Boundary of the Various Marakez and main human settlements .
It is worth highlighting here that, according to the UNDP, 28.5% of the households in Behera Governorate are living below poverty line (compared to the national average of 22.9%). Each of the three Marakez is subdivided into rural local units (mother villages) under the jurisdiction of which are several satellite villages. The following Table(4.10) presents the break down of rural local units, villages and sub villages in MCA.
Table (4.10): Marakez, Rural Units and Sub Villages in MCA. 15 Source: Egypt Human Development Report, 2004 (Published By UNDP) –Population Portioned in accordance to the Marakez Area Covered within the Command Area

52
Governorate Markaz Rural
Local Units number of
villages No. Sub Villages
Behera Mahmoudia 6 20 282
Abo Hommos 7 31 849
Kafr Al Dawar 7 33 687
Total 20.00 84.00 1,818.00
4.3.5.2 Agricultural Cropping Patterns The total cultivated area within the MCA is around 280 thousand. Land holdings in MCA were classified into three categories, namely:
��Small holdings (1 feddan or less): which represents 13 % of the total area held by 38 % of the farmers in MCA
��Medium Holdings (1-3 feddans): which represents 32 % of the total area held by 38 % of the farmers in MCA
��Large Holdings (more than 3 feddans): which represents 55 % of the total area, held by 24 % of the farmers in MCA
These numbers suggest that more than half of the cultivated area in MCA is held by almost quarter of the farmers. It is worth noting here that 96 % of the holdings are owned by the holders while 4 % is either rented or shared with other farmers.
The major crops cultivated in the MCA are typical of the Delta region. These crops are presented in the following Table (4.11).
Table (4.11): Summer and Winter Cropping Patterns in MCA
Crop Percentage of the Cropped Area (MALR, 2002)
Winter Crops: Berseem 33 Wheat 40 Beans 11 Sugarbeet 0.0 Others 0.0 Summer Crops: Rice 40 Cotton 27 Maize 18 Others 0.0 Orchards (mainly citrus) 15
The estimated volumes of pesticides used is reflected in the following Table (4.12).

53
Table (4.12): Pesticides Estimated Consumption in Mahmoudia Area (Behera governorate ).
Crop Area (feddan) estimated quantity of pesticide (ton)
Berseem 103600 3- 5 Wheat 100800 96 Broad beans 14000 6 Rice 100800 108 Cotton 89600 270 Maize 50000 12 Citrus 120 Others (vegetables), not specified 22400 60
Total 675-677 4.3.5.3 Archeological Sites. There are almost no important archeological locations in the command area. The exceptions are 20-30 sites under supervision by the Ministry of Tourism (Antiquities) each of an average of 5 feddans and are mainly used as cemeteries. These sites are around 10-15 meters in elevation from the predominant land elevation. 4.3.5.4 Industrial Areas and Activities. Industrial activities are mainly concentrated in Kafr El-dawar city which has 6 large factories (Chemicals, Textile, ceramics, etc) and a large number of small workshops and they discharge their water to Abu-Qir Drain. It was commented that there was a reduction in the pollution due to reduction in production. There are also some cheese factories in Mahmoudia city that discharge their effluents directly to canals and drains without treatment.
In the middle of Mahmoudia Command Area, and bordering the command area from the east, are two power plants (Mahmoudia and Kafr El Dawar). The two plants represent 5 % of installed capacity in Egypt ( Table 4.13)..
Table (4.13): Power plants in the vicinity of the command area.
Station Capacity
(MW)
Forced Outage
Rate Type
Kafr El Dawar 440 0.054 steam Mahmoudia 488 0.001 gas
Sanitation services is absent in all the MCA villages however, there are some WWTP serving some cities. The cities covered by sanitation include: Mahmoudia, Kafr El-dawar, Damanhour, and Abu Homos with the treated wastewater discharged to drains.

54
(Mahmoudia-Discharge to Al Atf Drain, Kafr El-dawar Discharge to Al Deshoudy Drain, and Abu Homos Discharge to Abu Hommos Drain.
4.4 Environmental Profile Meet Yazeed Command Area.
Meet Yazeed Command Area (MYC) is located in two Egyptian Governorates, El-Gharbeya (54,000 feddan) and Kafr El-sheikh (143,000 feddan) with total area of 197,000 feddan. About 73,000 feddan (37.0 % of the total area of Meet Yazeed command area) are improved in the second Irrigation Improvement Project IIP2 while 124,000 feddan (63.0 %) are to be improved in the Integrated Irrigation Improvement Management Project IIIMP. Meet Yazeed main canal gets its water from Bahr Shebin principal canal and serves through 60 branch canals.
The drainage water resulting from the area is discharged into Lake Burulus through Main Gharbia drain, Drain No. 6, lower Drain No. 7, Lower Drain No. 8 and Nashart drain. The main drainage pumping stations are number 6, 7, and 8. The total command area is covered by subsurface drainage. The physical environmental characteristics in the MYC is almost typical to that of the entire delta and almost comparable to the two other delta command areas. Of noticeable interest is that the command area exhibits higher rates of water shortages when compared to Mahmoudia and Tanah command areas. 4.4.1 Water Resources. Meet Yazeed command area is located at the tail end of the Middle Delta and experiences shortage of water due to excessive water use in Meet Yazeed Command area in the summer due to excessive rice and cotton cultivation, illegal fish farms and water required for leaching reclamation areas. There is a poor distribution pattern between head and tail reaches resulting in water shortage at the tail. Also loss of water to drains due to excessive irrigation and tail escape losses to drains. The analysis of water budget indicates that about 50% of the irrigation water supplies are lost to the drains.Table (4.14) is presented water resources and sectorial demand in MYC.
Table (4.14): Water Resources and Sectorial Demand in MYC.
Resources Volume (million m3/ year)
Surface 1669.2 Ground Water 6.3 Re-use (official) 110
Other Un-official re-use from drains at the tail ends of canals.
Sector Demand and Use
Volume (million m3/ year)
Irrigation 1819.9 Municipal 44.1 Industry negligible

55
The water quality of the canals and drains are generally poor in Meet Yazid command area mainly due to the discharge of raw sewage into canals and drains without treatment due to the lack of rural sanitation services to most villages in the command area. Also since several of the main canals and drains pass through heavily populated areas, dumping municipal solid waste into the canals and drains deteriorates the water quality. Solid waste accumulation in the canals and drains disrupt the flow and decrease conveyance capacity. Flow leaching from the piles of wastes adds more pollutants to the water. Also, the waste cause operational problems for the control structures and pumping stations.
The general layout of the irrigation and drainage systems of Meet Yazid Command area follows a quite well defined pattern of branching and sub-branching canals on both sides of Meet Yazid Canal. Side slope protection in the form of pitching stones has been provided along some lengths of the main and branching canals. The drainage system has a corresponding layout with branch drain between two canals. Weed growth is a problem in the spring months from February to April. The branch drains in the command area are relatively deep. The groundwater in the middle delta in general is a part of the Nile Deposit Basin. The overall capacity of the aquifer in the east delta portion is about 2,410 million m3/year. On the average, 1,570 million m3 is withdrawn every year (about 65% of the annual recharge volume), only 6 million of which is pumped out in MYC.
According to RIGW, the main characteristics of groundwater utilization in MYC involve that:
��Number of licensed wells is around 35, average Wells depth (60 m), Depth to static W.T. Level (2 to 4 m),
��Well pumping rate (700 m3/day), Salinity (450-600 ppm), ��GW potential high , GW Vulnerability (med-low), GW quality NaHCO3
4.4.2 Soil Quality
The soil of the middle Delta of the Nile is generally derived from the Nile alluvium. The top soil is predominately clay with some layers of lighter silt soil. The top soil has high capacity for water holding and low water intake rate.
Generally these soils are deep and poorly drained and structured. Natural drainage conditions are very poor over most of the command area (Soil suffering from salinity in Kafr El Sheikh is about 85%). Soil salinity is relatively high even in areas with improved drainage. Generally, around 50 % of the command area soils has soluble salt content less than 0.2%, 15 % between 0.2 and 0.5% and 25% of the command area’s soil has a high salinity (measured by the soluble salt content) from 0.5 to 1.0%. 10 % of the command area is Alkaline with more than 1.0% soluble salt content16.
16 Data Source: Reconnaissance Study “Meet Yazid Command Area” by the Feasibility Study Directorate, Irrigation Improvement Project, August 1997
56
4.4.3 Air Quality and Meteorology. Meteorological conditions in BTC is similar to the rest of the Delta region as reflected in section 4.1.1.5, with the minor exception that Evapo-transpiration rate (ETo) is an average of 1540 and 1680 mm/year in Kafr El Sheikh and Gharbiya governorates, respectively. The quality of air is expected to follow similar patterns as those described for the MCA. Main industrial air emissions will be found at areas close to Kafr El Sheikh, Tanta, and El Mahala El Kobra Industrial cities. The quality of air in rural areas will mainly be affected by the open incineration of agricultural waste and the inappropriate application of pesticides. 4.4.4 Biological Environment The biological environment in the MYC is very similar to the MCA in relation to the canal/drain systems habitat. In addition the MYC is bordered from the North by one of Egypt’s most important wetlands, namely the Burullus Lake, which has received international care under the RAMSAR and Bonn conventions being a wetland of significance for fish habitats and migratory birds. The lake is a declared natural protectorate within the regulations of law 102. 4.4.4.1 Lake Burullus
Lake Burullus is the arched part of the Delta northern coast and it is rectangular in shape. The lake is separated from the sea by a narrow strip of land. Its area about 100,000 feddan (420 km2) and the depth ranges from 0.42 to 2.1 m with 1.0 m average depth.
Decades ago, Lake Burullus has been experiencing seasonal variation in water levels and in water quality and quantity as a result of unregulated floods of River Nile. High Aswan Dam took over the role of controlling and regulating the entire national water budget. Lake Burullus plays balancing role to take care of other vivid activities.
The area surrounding the lake has witnessed active land reclamation programmers with all the associate sequences of salinity leaching and nutrient rich draining activities. The southern part of the lake receives slight saline drainage water of about 70 m3/sec (2.2 *109 m3/year) from six drains( Table 4.15).
The hydrological balance and the ecosystem productivity of Lake Burullus strictly depend on the water exchange between sea and lakes water. The exchange capacity between the lake and Mediterranean Sea through the tight inlet is considered limited. Based on the available data, Lake Burullus is divided into four zones, as shown in, each of them represented by a number measuring station. The following Table (4.16) shows the surface area and the inflow for year 2002 (DRI, 2002) of each zone.

57
Table (4.15): Zones of the lake Burullus.
Zone No.
Annual Inflow (million m3)
Area in (km2)* Inflow sources
1 573 92 Drain 11 2 788 97 Drain 9, Drain 8 3 - 118 - 4 894 113 Drain 7, Tira P.S, Burullus PS
Total 2255 420 Six outfalls * Defined area for year 1994 Several water quality parameters are contributing to eutrophication process. The most relevant parameters, physical, chemical and biological, will be discussed below. The water temperature of such shallow lake follows the air temperature pattern. Thus, the water temperature is subject to diurnal as well as seasonal variations. The mean temperature varies between 14.4oC in January to 26.5oC in August. The average hydrogen ion concentration of lake water is on the alkaline side and ranges from 8.08 to 8.6 with and annual average of 8.34. The highest pH is observed in western and eastern zones while the lowest is observed in the middle zones near the drain’s outfalls. Transparency of the lake water is relatively low with an average value of 35 cm. This is due to the suspended silt particles stirred up by water current as well as the turbid drainage water inflow. The higher transparency is recorded in the eastern zone and decreases gradually towards the western zone. The highest transparency was recorded during autumn and low pattern was recorded rest of the year as shown in. In general, Nitrate concentrations are relatively low in Lake Burullus all over the year. It is relatively high near the drain outfall reaching 11.1 µg/l l to 1.8 µg/l in the northeast zone as shown in. The maximum NO3 level is observed in January while the minimum is observed in summer. The phosphate in the lake is presented in lower concentrations than nitrate. Moreover, it follows the nitrate spatial distribution pattern in the lake as shown in. The phosphate temporal pattern in lake water depends on the hydrodynamic feature of the lake. The highest concentration is observed during October and January while the lowest is found during July and September. Chlorophyll in Lake Burullus is relatively low and tends to increase from east to west. Its value varies between 2.0 µg/l to 8.0 µg/l and the peak in May. Comparing with the other Egyptian costal lakes (Lake Manzala and Lake Maryut), Lake Burullus has the lowest chlorophyll levels as well as the nutrients levels. The evaluation of Lake Burullus trophy17 state shows that the lake water body varies between Oligotrophic (East and West zones) to Mesotrophic state (Middle zones). These levels sustain the lake in good to fair trophic conditions. Middle zone is the most trophic while east of the Lake is least one. Middle zone receives the major nutrients loads from drainage water. Eastern zone is subject to highest water exchange between the lake and the sea through the inlet at the northern part.
17 Trophy state based on the United States, Environmental Protection Agency’s (EPA) ‘Trophic State Index Classification System’

58
4.4.4.2 Fishing Areas.
Commercial fishing in the downstream catchment is intensively practiced and represents about 10 to 15% of the total command area. The main practices are to establish fish farms relying on drainage water particularly in the northern parts of the MYC south of Lake Burullus marshes. Rice fields are also considered as important fish farming areas and are a widely practiced technique for fish growth with a dual advantage of increasing rural income and improving the quality of nutrients delivered to the rice crop.
4.4.5 Socio-Economic and Cultural Environment
The population within the rural and peri-urban areas of the MYC is approximately around 1.1 million, 85 % of which live in highly clustered mother and satellite villages. The majority of the population is engaged in agriculture, while peri-urban dwellers are mainly engaged in the provision of services and government employment with minor portion involved in industrial activities. In addition, fish farming and aquaculture is an important occupation particularly in the northern region of MYC.
4.4.5.1 Population and Human Settlements
MYC is within the administrative boundaries of Gharbiya and Kafr El Sheikh Governorates (71 % of the total area is within Kafr El sheikh Administrative boundaries). The total area is covered mainly by six Marakez. The level of income varies between the Marakez and between rural and peri-urban settlements. The following Table (4.14) and Fig. (4.20) present the population break down in each Markaz as well as the surveyed level of income.
Table (4.16):Administrative Divisions, Population and Level of Income in MYC 18
Population
(000) level of income
(EGP/capita/year) Governorate Markaz urban rural urban rural
Kafr El Sheikh Saidy salem 46.00 151.50 4,808.80 4,674.10 Riad 15.60 131.00 5,062.20 5,242.60 Hamool 10.98 54.05 4,812.40 4,908.20 Kafr El Sheikh 69.55 344.63 5,538.50 5,057.40
Gharbia An Mahala Al Kobra 0 128.45 5,718.60 5,333.40
Qutour 11.55 132.10 5,049.40 4,850.40 Total 153.68 941.73
18 Source: Egypt Human Development Report, 2004 (Published By UNDP) –Population Portioned in accordance to the Marakez Area Covered within the Command Area

59
Figure (4.20): Administrative Boundary of the MYC Marakez and Main Settlements.
It is worth highlighting here that, according to the UNDP, 10.1% of the households in Kafr El-Sheikh Governorate (and 9.4% in Gharbia), are living below poverty line (compared to the national average of 22.9%). However, as a general observation, MYC probably hosts the highest earners both rural and peri-urban in comparison with the four other IIIMP command areas. Each of the Marakez is subdivided into rural local units (mother villages) under the jurisdiction of which are several satellite villages. The following Table (4.17) presents the break down of rural local units, villages and sub villages in MYC.

60
Table (4.17): Marakez, Rural Units and Sub Villages in MYC.
Governorate Marakaz Rural Local
Units number of
villages No. Sub Villages
Kafr El Sheikh Saidy salem 3 14 105 Riad 2 16 179 Hamool 1 2 79
Kafr El Sheikh 7 35 232
Gharbia An Mahala Al Kobra
3 13 87
Qutour 3 15 104 Total 17 94 785
The above Table (4.16) indicates that, in comparison with the MCA, MYC has far much higher population density in rural settlements. This is considered as a stronger pressure in relation to human induced threats to the environment in comparison with Mahmoudia. 4.4.5.2 Agricultural Cropping Patterns The total cultivated area within the MYC is around 197 thousand feddans. Land holdings in MYC were classified into three categories, namely:
��Small holdings feddan or less: which represents 17 % of the total area held by 40 % of the farmers in MYC
��Medium Holdings 1-3 feddans: which represents 38 % of the total area held by 38 % of the farmers in MYC
��Large Holdings more than 3 feddans: which represents 45 % of the total area, held by 22 % of the farmers in MYC.
These numbers suggest that more than half of the cultivated area in MYC is held by almost quarter of the farmers. It is worth noting here that 99 % of the holdings are owned by the holders while 1 % is either rented or shared with other farmers. Estimated volume of pesticides used is reflected in volume estimated on the basis of pesticide consumption (Table 4.18).
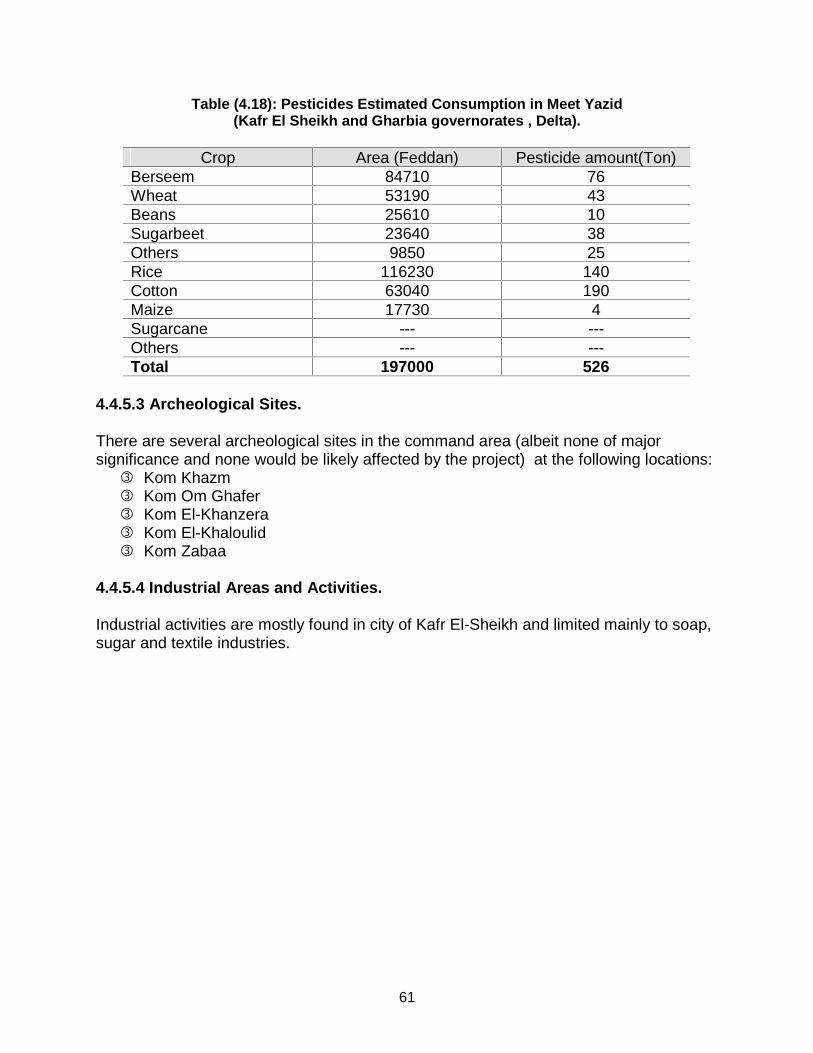
61
Table (4.18): Pesticides Estimated Consumption in Meet Yazid (Kafr El Sheikh and Gharbia governorates , Delta).
Crop Area (Feddan) Pesticide amount(Ton)
Berseem 84710 76 Wheat 53190 43 Beans 25610 10 Sugarbeet 23640 38 Others 9850 25 Rice 116230 140 Cotton 63040 190 Maize 17730 4 Sugarcane --- --- Others --- --- Total 197000 526
4.4.5.3 Archeological Sites. There are several archeological sites in the command area (albeit none of major significance and none would be likely affected by the project) at the following locations:
��Kom Khazm ��Kom Om Ghafer ��Kom El-Khanzera ��Kom El-Khaloulid ��Kom Zabaa
4.4.5.4 Industrial Areas and Activities. Industrial activities are mostly found in city of Kafr El-Sheikh and limited mainly to soap, sugar and textile industries.

62
5. ENVIRONMENTAL IMPACT ASSESSMENT (EIA). Environmental impacts of irrigation and drainage schemes are concerned with˜changes in quantity and quality of irrigation water as well as in soil physical and chemical characteristics. The intensification of agriculture and use of excess water can lead to groundwater pollution related to the increased use of pesticides and fertilizers. Impacts will also vary according to the stage of implementation. Later, once the project has been operating, cumulative impacts may begin to present environmental constraints to project sustainability. Such issues must be predicted by the EIA and mitigation measures should be prepared. It is also important to recognize the interrelationship between canal flows and the water table. During high flow periods, recharge tends to occur through the river bed whereas groundwater often contributes to low flows. 5.1 Soil Properties. On-going comprehensive soil studies are essential to the successful management of irrigated areas. A wide range of activities associated with an increased intensity of production can contribute to reduced soil fertility. Soil salinity is probably the most important issue. A reduction in organic content will contribute to a soil’s erodability. The increased use of agro-chemicals, needed to retain productivity under intensification, can introduce toxic elements that occur in fertilizers and pesticides. 5.2 Soil Salinity. On irrigated lands salinization is the major cause of land leading to production losses. It is one of the most prolific adverse environmental impacts associated with irrigation. Saline conditions severely limit the choice of crop, adversely affect crop germination and yields. Careful management can reduce the rate of salinity build up and minimize the effects on crops. Management strategies include: leaching; altering irrigation methods and schedules; sub-surface drainage; changing tillage techniques; adjusting crop patterns; and incorporating soil ameliorates. All such actions, which may be very costly, would require careful study to determine their local suitability. There are three main reasons for an increase in soil salinity on irrigation scheme:
��Salts in the irrigation water are liable to build up in the soil profile, as water is removed by plants and the atmosphere.
��Solutes applied to the soil in the form of artificial and natural fertilizers as well as some pesticides will not all be utilized by the crop;
�� Salts which occur naturally in soil may be dissolved and contaminate the groundwater. This problem is often severe in arid areas where natural flushing of salts (leaching) does not occur. Where the groundwater level is both shallow and saline, water will rise by capillary action and then evaporate, leaving salts on the surface and in the upper layers of the soil. The accumulation of salts in soils can lead to irreversible damage to soil structure essential for irrigation and crop production. Effects are most extreme in clay soils where the presence of sodium can bring about soil structural collapse. This makes growing conditions very poor,

63
makes soils very difficult to work and prevents reclamation by leaching using standard techniques. Gypsum in the irrigation water or mixed into the soil before irrigation is a practice that is used to reduce the sodium content of sodic soils.
5.3 Water Quality. Dissolved salts may be present in high enough concentrations to be toxic .. Persistent chemicals are a threat to aquatic systems even when not soluble, as many bond chemically to soil particles and may be transported by erosion. Chemicals have become an essential part of agricultural production and the benefits are enormous. However, when misused, the adverse impacts can be extensive. Contamination of soil or water by the following heavy metals are particular concern: Pb, Cd , Cr, Co and Ni . Other elements can cause toxicity to plants in high concentration but are also plant nutrients, namely: K,B,P,NO3-N, NH4-N, Cu, Fe, Mn, and Zn. The use of water for irrigation containing sewage or industrial wastes should be of particular concern in EIA and the WHO Health Guidelines for the Use of Wastewater in Agriculture and Aquaculture (1989) will be very helpful. The industrial processing of crops, or preparation of agricultural inputs, may involve or produce toxic substances, the safe disposal of which should fall within the remit of any EIA. The International Programmer on Chemical Safety (IPCS), a joint WHO/ILO/UNEP program, produces standards and guidelines on safety. Egypt has established Egyptian Code No.501/2005 for the safe use of sewage water in agriculture sector. 5.4 Saline Drainage. The consumption of water for irrigated agriculture and the reduced quality of return flows is likely to adversely impact on downstream ecosystems. Reduced flows, increased salt concentrations, low oxygen levels, high water temperatures and increased pollution and silt loads all tend to favor vigorous, tolerant species (aquatic weeds). The demands of different ecotypes will change through the year both in quantity and quality. There may be scope to modify construction methods to minimize disruptions to the flow and to prevent very heavy sediment loads. 5.5 Saline Groundwater An increase in the salinity of the groundwater is often associated with water logging. An appropriate and well-maintained drainage network will mitigate against such effects. Drainage may not be required initially but it should be allowed for if there is insufficient natural drainage. Areas have a flat topography or with high water tables would have a low hydraulic gradient at risk from Salinization and low permeability which are difficult to leach. Groundwater drains, either pipe (tile) drains or deep ditches, carry out the dual task of controlling the water table and through leaching, counteracting the build up of salts in the soil profile. Normally water is applied in excess of the crop water

64
requirement and soluble salts are carried away in the drainage water although in some areas leaching can be achieved during the rainy season. 5.6 Sedimentation. Irrigation schemes can fail if the sediment load of the water supply is higher than the capacity of the irrigation canals to transport sediment. Sediment excluders/extractors at the head works can mitigate this effect to some extent. Sedimentation from within the scheme itself can also be a problem, for example, wind-blown soil filling canals. Canal desalting is an extremely costly element of irrigation maintenance and design measures should minimize sediment. 5.7 Fast-tracked sampling & analysis of the baseline water quality data in the FIMP command areas: This fast-tracked work focuses on the analysis of water, soil and plant samples collected by SWERI team (where the Environmental Management Unit resides) from three representative sites selected in the three FIMP command areas.
5.7.1 Framework.
Field work was carried out in four days at representative sub-basins of the three sites of EIA/FIMP areas as follows : Site(I): Wasat: in Middle Delta, a sub-area of the Meet-Ya-Zeed command area; District Al-Riad,Kafr El-Sheikh Governorate. Site(II) : Manaifa: Northern edge of Middle Delta, a sub-area of the Manaifa command area immediately south of Lake Burulus. District Desooq, Kafr El-Sheikh Governorate. Site(III) : Mahmoudia: northern edge of West Delta; a sub-area of the Mahmoudia command area.District Kafr El-Dawar, Al -Beheira Governorate. The representative samples of irrigation water source, groundwater, soils, cultivated plants were collected at the beginning and tail-end of each mesqas located on the branch canals as follows: I-Wasat
��Main canal: Meet-Ya-Zeed canal. ��Branch canal : Koom Al-Wahal.
A- At beginning of the canal:
��Pump station No.1 right, namely Abu Ghalab (A-1). ��Pump station No.4 left , namely Mostafa Omer (A-2). ��Pump station No.6 left , namely Albat village( A-3).
B- At tail –end of the canal: ��Pump station No.1 right (B-1). ��Pump station No.2 left (B-2). ��Pump station No.3 left ( B-3).

65
II-Maniafa : ��Main canal : Manaifa canal . ��Branch canal : Al-Shabassia Al-Qeblia .
A - At beginning of the canal: ��Pump station No.1 right (A-1). ��Pump station No.3 right (A-2). ��Pump station No.5 right (A-3).
B - At tail –end of the canal: ��Mesqa Almousatah at ”head” (B-1). ��Mesqa Almousatah at ”middle” (B-1). ��Mesqa Almousatah at ”end” (B-1).
III-Mahmoudia: ��Main canal: Mahmoudia canal. ��Branch canal : Bisentawy .
A - At beginning of the canal:
��Pump station No.1 right, namely mesqa Sharaf Al-Din (A-1). ��Pump station No.2 right ,namely mesqa Sharaf Al-Din (A-2). ��Pump station No.3 right, namely mesqa Al-Gamal (A-3).
B - At tail –end of the canal: ��Pump station Altabakh (B-1). ��Pump station Baquoosh (B-2). ��Pump station Hussien Alarabi (B-3).
* Drainage water samples were collected from the main drains at the three sites.
5.7.2 Laboratory Analysis
SWERI has undertaken in-situ sampling for the determination of following parameters: ��pH, EC, Cations, Anions, RSC and SAR. ��Zn , Fe , Mn , Cu ,K, B, P, NO3-N and NH4-N. � Pb, Cd , Cr, Co and Ni. � Pesticides residues (Positive / Negative). ��COD and BOD. ��Bacteria (Total Coliforms, Feacal Coliforms, Salmonella and Shigella). ��Parasites.
These parameters were estimated from samples taken at several parts of the water cycle: (A) soil, (B) crops, and (C) ambient canal and drain in-stream waters.
66
5.7.3 Results From the results of laboratory analysis ( Tables 5.1 to 5.8), it could be concluded that:
1- Water samples ; 1-1 Chemical analysis( Table 5.1) ��Irrigation water salinity values varied from 0.45 to 0.63,0.40 to 0.58, and 0.63
to 0.69 dS/m for sites I,II, and III, respectively. It classified suitable for irrigation according to Ayers &Westcot(1985).
��Groundwater salinity values varied from 3.95 to 18.07, 1.75 to 6.93, and 1.23 to 8.64 dS/m for sites I,II, and III, respectively. It is classified as high saline and moderately to highly saline for irrigation according to Ayers &Westcot(1985).
��Drainage water salinity are 1.64 ,1.77, and 1.44 dS/m for sites I,II, and III respectively. It is classified as moderately saline for irrigation according to Ayers&Westcot(1985).
�� Groundwater depths varied from 45-175 ,70-190, and 58-85 cm for sites I,II, and III, respectively. It is classified as shallow to deep water table depth.
1-2 Macro , micro nutrients, and heavy metals analysis (Table 5.2)
Macro , micro nutrients, and heavy metals values in all water samples are below permissible limits in all sites according guidelines of FAO (1985).
1-3 Biological analysis (Table 5.3)
The results are based on guidelines of WHO, (1989):
��Parasitis: all irrigation water and drainage water samples are contaminated with Balantidium Coli, Trichours Trichours ,Entemobia Histoytica and Euglina. Ground water samples are free from parsities in the three selected sites.
�� Pesticidies residues: all water samples are contaminated with pesticides residues in the three selected sites.
��Salmonila and Sheglla bacteria: all irrigation and groundwater samples are free from Salmonila and Sheglla. The drainage water samples in the three main drains of the representative sites are contaminated.
��Fecal Coliform bacteria: all irrigation and groundwater samples in II and III sites are free. The sample from main drain 2 of site II is contaminated. At site I, irrigation water , groundwater and drainage water samples of the head of mesqa are contaminated, while sample are free at tail-end.
��Total Coliform bacteria: all irrigation water and groundwater samples of sites II and III are free. The sample from main drain 2 of site II is contaminated. At site I, irrigation water , groundwater and drainage water samples of the head of mesqa are contaminated while it is free at tail-end.
��Chemical Oxygen Demand (COD): The concentration in all water samples are below the permissible limits (40 mg/L), except, the main drains of sites I and II.

67
��Biological Oxygen Demand ( BOD): The concentration in all water samples are below the permissible limits (20 mg/L), except , the irrigation water samples and drainage water of site II.
2- Soil samples ;
��Chemical analysis (Table 5.4): Soil salinity of collected samples for sites I,II,and III are in range from 1.61 to 3.27 dS/m . It is classified as slightly saline soils according to Richared(1954).
��Soil fertility (Table 5.5): All collected samples from sites I,II, and III have no deficient content of macro and micro nutrients .
��Soil heavy metals content (Table 5.5): Heavy metals content values are below the permissible limits in all collected samples from sites I,II,and III .
��Bacteria analysis ( Table 5.6): All collected samples from sites I,II, and III are free from Total Coliform , Fecal Coliform ,Salmonilla and Shegella bacteria.
3- Plant samples;
��Chemical analysis of plant tissues (Table 5.7): All collected plants ( shoots and roots ) samples have a sufficient content of macro and micro nutrients at the three sites I,II,and III .
��Biological analysis of plant tissues (Table 5.8): All collected samples of palnt tissues are free from Total Coliform , Fecal Coliform , Salmonilla and Shegella bacteria from sites I,II, and III.
4- From the obtained results, it could be concluded that: The main issues noticed in the sampled areas are: ��Shallow groundwater table in some areas. FIMP can improve this. ��High salinity levels of some groundwater samples.
FIMP can improve this. Irrigation and drainage waters are contaminated with bacteria and parasites. FIMP can improve this.
��Positive pesticide residues (i.e. above zero) have been detected in all irrigation water samples. However, "positive" does not mean "violating" the permissible standards. For instance, the baseline data from the samples taken in the plant tissues (shoots and roots) indicated that there is sufficient content of macro and micro nutrients in the samples taken from the three FIMP command areas. This implies that the positive presence of pesticide residues in irrigation water has not negatively impacted crop growth. Nevertheless, as mentioned below under the EMP, during FIMP implementation if SWERI determines that in specific sites the pesticide residues tend to approach the permissible standards (e.g. due to intensifying cultivation as a result of FIMP) in irrigation water, in soil or in plant tissues, MALR/SWERI will respond by strictly applying the current "Integrated Pest Management" program of MALR, which
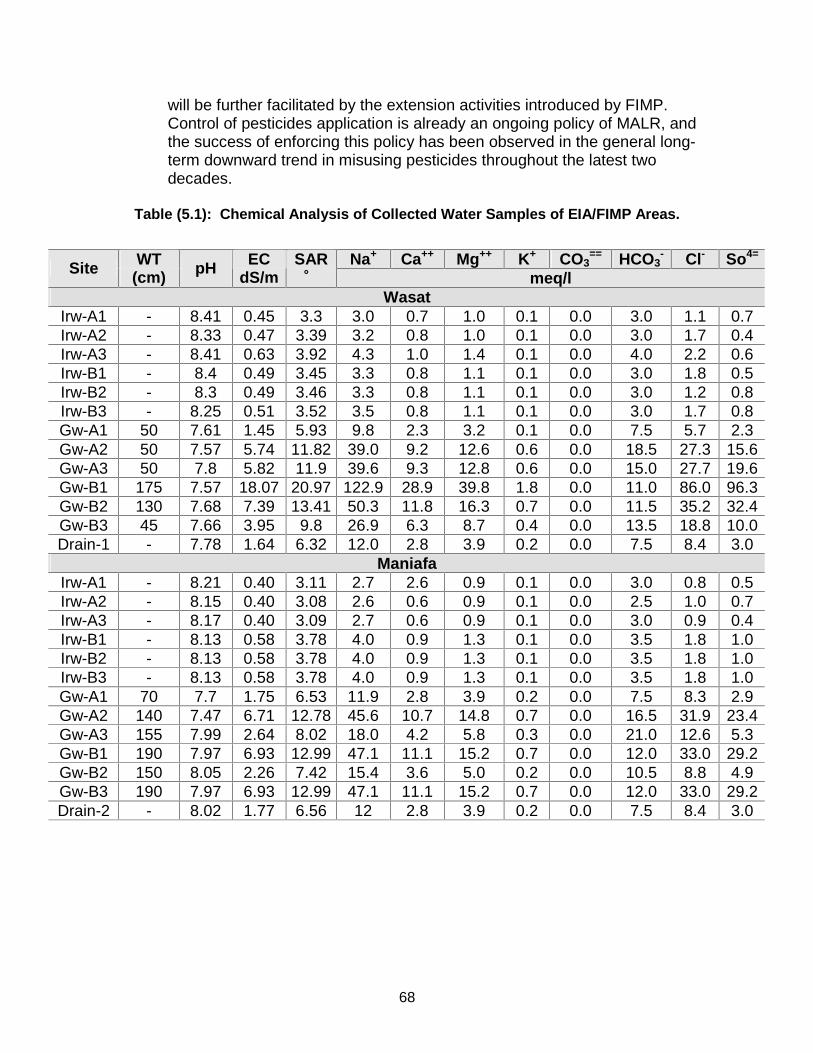
68
will be further facilitated by the extension activities introduced by FIMP. Control of pesticides application is already an ongoing policy of MALR, and the success of enforcing this policy has been observed in the general long-term downward trend in misusing pesticides throughout the latest two decades.
Table (5.1): Chemical Analysis of Collected Water Samples of EIA/FIMP Areas.
Na+ Ca++ Mg++ K+ CO3
== HCO3- Cl- So4= Site WT
(cm) pH EC dS/m
SAR ˚ meq/l
Wasat Irw-A1 - 8.41 0.45 3.3 3.0 0.7 1.0 0.1 0.0 3.0 1.1 0.7 Irw-A2 - 8.33 0.47 3.39 3.2 0.8 1.0 0.1 0.0 3.0 1.7 0.4 Irw-A3 - 8.41 0.63 3.92 4.3 1.0 1.4 0.1 0.0 4.0 2.2 0.6 Irw-B1 - 8.4 0.49 3.45 3.3 0.8 1.1 0.1 0.0 3.0 1.8 0.5 Irw-B2 - 8.3 0.49 3.46 3.3 0.8 1.1 0.1 0.0 3.0 1.2 0.8 Irw-B3 - 8.25 0.51 3.52 3.5 0.8 1.1 0.1 0.0 3.0 1.7 0.8 Gw-A1 50 7.61 1.45 5.93 9.8 2.3 3.2 0.1 0.0 7.5 5.7 2.3 Gw-A2 50 7.57 5.74 11.82 39.0 9.2 12.6 0.6 0.0 18.5 27.3 15.6 Gw-A3 50 7.8 5.82 11.9 39.6 9.3 12.8 0.6 0.0 15.0 27.7 19.6 Gw-B1 175 7.57 18.07 20.97 122.9 28.9 39.8 1.8 0.0 11.0 86.0 96.3 Gw-B2 130 7.68 7.39 13.41 50.3 11.8 16.3 0.7 0.0 11.5 35.2 32.4 Gw-B3 45 7.66 3.95 9.8 26.9 6.3 8.7 0.4 0.0 13.5 18.8 10.0 Drain-1 - 7.78 1.64 6.32 12.0 2.8 3.9 0.2 0.0 7.5 8.4 3.0
Maniafa Irw-A1 - 8.21 0.40 3.11 2.7 2.6 0.9 0.1 0.0 3.0 0.8 0.5 Irw-A2 - 8.15 0.40 3.08 2.6 0.6 0.9 0.1 0.0 2.5 1.0 0.7 Irw-A3 - 8.17 0.40 3.09 2.7 0.6 0.9 0.1 0.0 3.0 0.9 0.4 Irw-B1 - 8.13 0.58 3.78 4.0 0.9 1.3 0.1 0.0 3.5 1.8 1.0 Irw-B2 - 8.13 0.58 3.78 4.0 0.9 1.3 0.1 0.0 3.5 1.8 1.0 Irw-B3 - 8.13 0.58 3.78 4.0 0.9 1.3 0.1 0.0 3.5 1.8 1.0 Gw-A1 70 7.7 1.75 6.53 11.9 2.8 3.9 0.2 0.0 7.5 8.3 2.9 Gw-A2 140 7.47 6.71 12.78 45.6 10.7 14.8 0.7 0.0 16.5 31.9 23.4 Gw-A3 155 7.99 2.64 8.02 18.0 4.2 5.8 0.3 0.0 21.0 12.6 5.3 Gw-B1 190 7.97 6.93 12.99 47.1 11.1 15.2 0.7 0.0 12.0 33.0 29.2 Gw-B2 150 8.05 2.26 7.42 15.4 3.6 5.0 0.2 0.0 10.5 8.8 4.9 Gw-B3 190 7.97 6.93 12.99 47.1 11.1 15.2 0.7 0.0 12.0 33.0 29.2 Drain-2 - 8.02 1.77 6.56 12 2.8 3.9 0.2 0.0 7.5 8.4 3.0
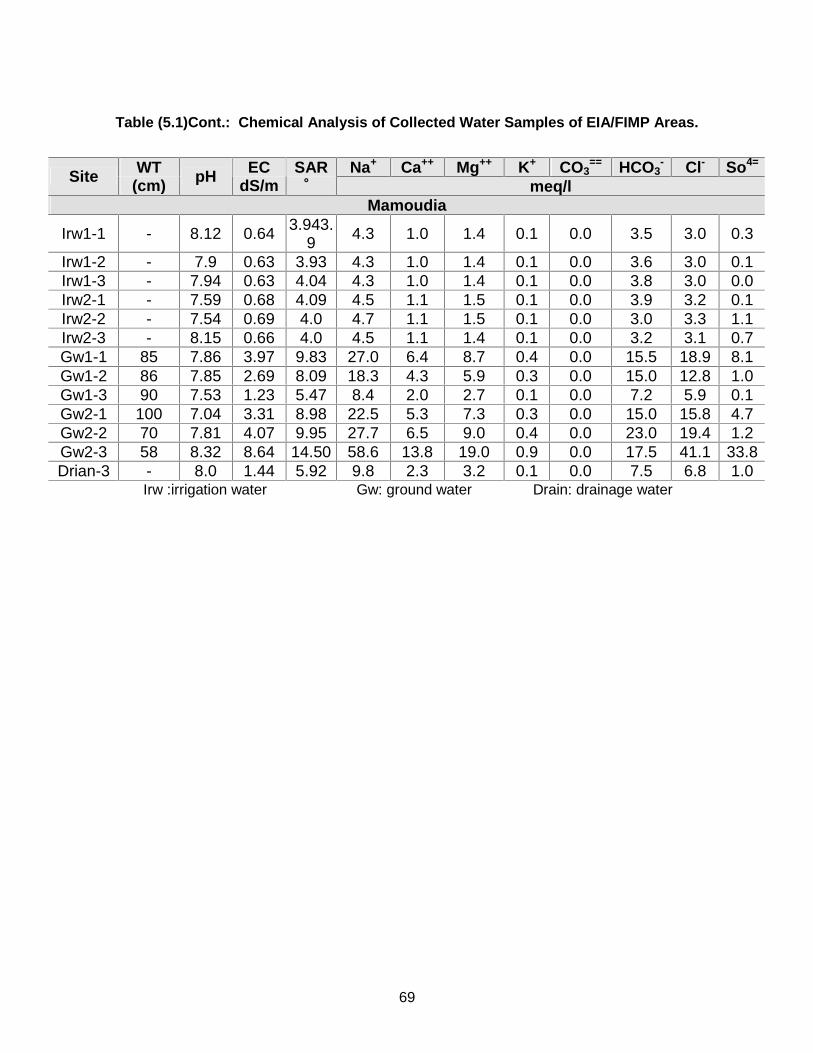
69
Table (5.1)Cont.: Chemical Analysis of Collected Water Samples of EIA/FIMP Areas.
Na+ Ca++ Mg++ K+ CO3
== HCO3- Cl- So4= Site WT
(cm) pH EC dS/m
SAR ˚ meq/l
Mamoudia
Irw1-1 - 8.12 0.64 3.943.9
4.3 1.0 1.4 0.1 0.0 3.5 3.0 0.3
Irw1-2 - 7.9 0.63 3.93 4.3 1.0 1.4 0.1 0.0 3.6 3.0 0.1 Irw1-3 - 7.94 0.63 4.04 4.3 1.0 1.4 0.1 0.0 3.8 3.0 0.0 Irw2-1 - 7.59 0.68 4.09 4.5 1.1 1.5 0.1 0.0 3.9 3.2 0.1 Irw2-2 - 7.54 0.69 4.0 4.7 1.1 1.5 0.1 0.0 3.0 3.3 1.1 Irw2-3 - 8.15 0.66 4.0 4.5 1.1 1.4 0.1 0.0 3.2 3.1 0.7 Gw1-1 85 7.86 3.97 9.83 27.0 6.4 8.7 0.4 0.0 15.5 18.9 8.1 Gw1-2 86 7.85 2.69 8.09 18.3 4.3 5.9 0.3 0.0 15.0 12.8 1.0 Gw1-3 90 7.53 1.23 5.47 8.4 2.0 2.7 0.1 0.0 7.2 5.9 0.1 Gw2-1 100 7.04 3.31 8.98 22.5 5.3 7.3 0.3 0.0 15.0 15.8 4.7 Gw2-2 70 7.81 4.07 9.95 27.7 6.5 9.0 0.4 0.0 23.0 19.4 1.2 Gw2-3 58 8.32 8.64 14.50 58.6 13.8 19.0 0.9 0.0 17.5 41.1 33.8 Drian-3 - 8.0 1.44 5.92 9.8 2.3 3.2 0.1 0.0 7.5 6.8 1.0
Irw :irrigation water Gw: ground water Drain: drainage water

70
Table (5.2): Macro, Micro-Nutrients and Heavy Metals Concentration in the Collected Water Samples of EIA/FIMP Areas.
NH4 NO3 P Fe Mn Zn Cu Ni Pb B Cd Co Cr Site
mg/l Wasat
Irw-A1 2.52 1.89 0.222 0.032 0.005 0.000 0.003 0.000 00.017 0.011 0.000 0.002 0.005 Irw-A2 3.15 0.00 0.000 0.060 0.004 0.000 0.021 0.000 00.000 0.010 0.000 0.004 0.000 Irw-A3 2.52 0.00 0.000 0.115 0.004 0.000 0.007 0.000 00.014 0.019 0.000 0.000 0.004 Irw-B1 2.52 0.00 0.000 0.083 0.004 0.000 0.012 0.000 00.000 0.012 0.000 0.000 0.003 Irw-B2 3.78 0.00 0.000 0.079 0.005 0.000 0.006 0.000 0.027 0.011 0.000 0.004 0.004 Irw-B3 2.52 0.00 0.000 0.080 0.005 0.000 0.005 0.000 0.129 0.013 0.000 0.007 0.003 Gw-A1 1.89 0.00 0.000 0.181 0.022 0.002 0.068 0.000 0.020 0.054 0.000 0.000 0.004 Gw-A2 1.26 0.63 0.000 0.059 0.001 0.000 0.004 0.000 0.000 0.448 0.000 0.005 0.001 Gw-A3 1.89 0.00 0.000 0.060 0.002 0.000 0.005 0.000 0.000 0.483 0.000 0.002 0.001 Gw-B1 2.52 0.00 0.000 0.072 1.602 0.000 0.036 0.000 0.000 0.193 0.000 0.006 0.001 Gw-B2 2.52 0.00 0.000 0.097 0.761 0.025 0.216 0.000 0.002 0.180 0.000 0.005 0.002 Gw-B3 2.52 0.00 0.000 0.047 0.110 0.003 0.010 0.000 0.000 0.301 0.000 0.003 0.003 Drain1 1.26 1.26 0.409 0.058 0.017 0.002 0.007 0.000 0.000 0.084 0.000 0.002 0.003
Manaifa Irw-A1 1.26 0.00 0.000 0.028 0.004 0.001 0.011 0.000 0.035 0.005 0.000 0.001 0.006 Irw-A2 1.89 0.00 0.000 0.038 0.005 0.000 0.007 0.000 0.009 0.013 0.000 0.004 0.000 Irw-A3 1.26 0.00 0.000 0.031 0.003 0.000 0.006 0.000 0.000 0.008 0.000 0.002 0.001 Irw-B1 1.89 0.00 0.000 0.292 0.014 0.006 0.016 0.000 0.022 0.022 0.000 0.004 0.004 Irw-B2 1.89 0.00 0.000 0.292 0.014 0.006 0.016 0.000 0.022 0.022 0.000 0.004 0.004 Irw-B3 1.89 0.00 0.000 0.292 0.014 0.006 0.016 0.000 0.022 0.022 0.000 0.004 0.004 Gw-A1 2.52 0.00 0.000 0.296 0.063 0.000 0.020 0.000 0.000 0.043 0.000 0.005 0.001 Gw-A2 1.89 0.63 0.000 0.035 0.449 0.001 0.005 0.000 0.000 0.156 0.000 0.006 0.004 Gw-A3 1.89 0.63 0.000 0.065 0.008 0.000 0.009 0.000 0.000 0.174 0.000 0.006 0.004 Gw-B1 1.89 0.63 0.000 0.065 0.008 0.000 0.009 0.000 0.000 0.174 0.000 0.006 0.004 Gw-B2 1.89 0.63 0.000 0.219 0.010 0.000 0.013 0.000 0.000 0.189 0.000 0.003 0.000 Gw-B3 1.89 0.63 0.000 0.219 0.010 0.000 0.013 0.000 0.000 0.189 0.000 0.003 0.000 Drain2 1.26 1.26 0.000 0.051 0.016 0.000 0.023 0.000 0.021 0.083 0.000 0.006 0.001
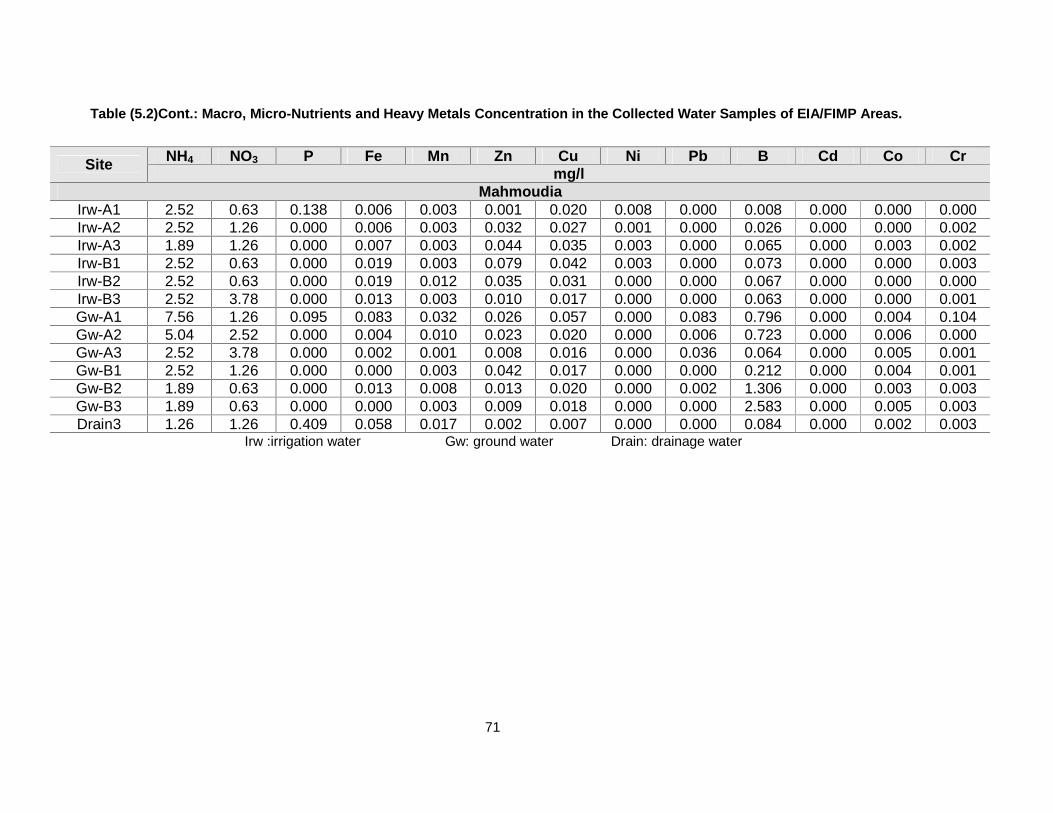
71
Table (5.2)Cont.: Macro, Micro-Nutrients and Heavy Metals Concentration in the Collected Water Samples of EIA/FIMP Areas.
NH4 NO3 P Fe Mn Zn Cu Ni Pb B Cd Co Cr Site
mg/l Mahmoudia
Irw-A1 2.52 0.63 0.138 0.006 0.003 0.001 0.020 0.008 0.000 0.008 0.000 0.000 0.000 Irw-A2 2.52 1.26 0.000 0.006 0.003 0.032 0.027 0.001 0.000 0.026 0.000 0.000 0.002 Irw-A3 1.89 1.26 0.000 0.007 0.003 0.044 0.035 0.003 0.000 0.065 0.000 0.003 0.002 Irw-B1 2.52 0.63 0.000 0.019 0.003 0.079 0.042 0.003 0.000 0.073 0.000 0.000 0.003 Irw-B2 2.52 0.63 0.000 0.019 0.012 0.035 0.031 0.000 0.000 0.067 0.000 0.000 0.000 Irw-B3 2.52 3.78 0.000 0.013 0.003 0.010 0.017 0.000 0.000 0.063 0.000 0.000 0.001 Gw-A1 7.56 1.26 0.095 0.083 0.032 0.026 0.057 0.000 0.083 0.796 0.000 0.004 0.104 Gw-A2 5.04 2.52 0.000 0.004 0.010 0.023 0.020 0.000 0.006 0.723 0.000 0.006 0.000 Gw-A3 2.52 3.78 0.000 0.002 0.001 0.008 0.016 0.000 0.036 0.064 0.000 0.005 0.001 Gw-B1 2.52 1.26 0.000 0.000 0.003 0.042 0.017 0.000 0.000 0.212 0.000 0.004 0.001 Gw-B2 1.89 0.63 0.000 0.013 0.008 0.013 0.020 0.000 0.002 1.306 0.000 0.003 0.003 Gw-B3 1.89 0.63 0.000 0.000 0.003 0.009 0.018 0.000 0.000 2.583 0.000 0.005 0.003 Drain3 1.26 1.26 0.409 0.058 0.017 0.002 0.007 0.000 0.000 0.084 0.000 0.002 0.003
Irw :irrigation water Gw: ground water Drain: drainage water

72
Table (5.3) : Microbial, Pesticides and Parasites Status of the Collected Water Samples of EIA/FIMP Areas.
Parasites Pesticides residues COD BOD Total Coliform
Fecal Coliform
Salmonila& Shegila Site
Ova/ml Positive Negative mg/l mg/l Cfu/ml Cfu/ml Cfu/ml Wasat
Irw-A1 + + - 16 8.0 53 x 10 2 31 x 10 2 nd Irw-A2 ++ + - 14.0 7.0 48 x 10 2 31 x 10 2 nd Irw-A3 +++ + - 10 5.0 55 x 10 2 30 x 10 2 nd Irw-B1 +++ + - 10 5.0 nd nd nd Irw-B2 + + - 12 6.0 nd nd nd Irw-B3 ++ + - 10 5.0 nd nd nd Gw-A1 Nil + - 7.0 4 10 x 10 2 6 x 10 2 nd Gw-A2 Nil + - 7.0 4 9 x 10 2 3 x 10 2 nd Gw-A3 Nil + - 7.0 4 8 x 10 2 4 x 10 2 nd Gw-B1 Nil + - 39 20 7 x 10 2 nd nd Gw-B2 Nil + - 20.0 10 6 x 10 2 nd nd Gw-B3 Nil + - 17.0 9 nd nd nd
Drain-1 ++ + - 77 3 148 x 102 92 x 102 1040
Maniafa Irw-A1 + + - 22 11 nd nd nd Irw-A2 ++ + - 52 26 nd nd nd Irw-A3 + + - 46 23 nd nd nd Irw-B1 + + - 77 35 nd nd nd Irw-B2 + + - 77 35 nd nd nd Irw-B3 + + - 77 35 nd nd nd Gw-A1 Nil + - 7.0 3.0 nd nd nd Gw-A2 Nil + - 26.0 13.0 nd nd nd Gw-A3 Nil + - 17.0 9.0 nd nd nd Gw-B1 Nil - - 17.0 9.0 nd nd nd Gw-B2 Nil + - 17.0 9.0 nd nd nd Gw-B3 Nil - - 17.0 9.0 nd nd nd Drain-2 +++ + - 58 23 42 x 102 22 x 102 650
Mahmodia Irw-A1 ++ + - 12 6 60 50 10 Irw-A2 ++ + - 10 5 70 30 20 Irw-A3 + + - 13 6 110 40 30 Irw-B1 + + - 14 7 40 60 30 Irw-B2 ++ + - 16 8 50 70 30 Irw-B3 ++ + - 10 5 60 40 30 Gw-A1 Nil + - 12 6 120 30 nd Gw-A2 Nil + - 14 7 130 50 nd Gw-A3 Nil + - 10 5 150 40 nd Gw-B1 Nil + - 13 6 190 20 nd Gw-B2 Nil + - 9 5 200 30 nd Gw-B3 Nil + - 20 10 180 40 nd Drain-3 ++ + - 18 9 280 13 10
Irw :irrigation water Gw: ground water D:drain water +pesticides are found nd: not found Cfu: colony forming unit

73
Table (5.4) : Chemical Analysis of Collected Soil Samples of EIA/FIMP Areas
Na+ Ca++ Mg++ K+ CO3
== HCO3- Cl- So4= Site pH EC
dS/m SAR
˚ meq/l Wasat
A1 8.2 2.16 7.3 14.7 3.5 4.8 0.2 0.0 4.5 10.3 8.3 A2 7.81 2.21 7.3 15.0 3.5 4.9 0.2 0.0 5.5 10.5 7.6 A3 8.02 2.79 8.2 19.0 4.5 6.1 0.3 0.0 4.5 13.3 12.1 B1 8.45 2.46 7.7 16.7 3.9 5.4 0.2 0.0 5.5 11.7 9.1 B2 8.41 2.47 7.8 16.8 4.0 5.4 0.2 0.0 4.5 11.8 10.2 B3 8.31 2.22 7.4 15.1 3.6 4.9 0.2 0.0 5.5 10.6 7.7
Maniafa A1 8.05 2.42 7.7 16.5 3.9 5.3 0.2 0.0 4.5 11.5 9.9 A2 8.18 2.17 7.3 14.8 3.5 4.8 0.2 0.0 4.0 10.3 8.9 A3 8.05 2.38 7.6 16.2 3.8 5.2 0.2 0.0 5.0 11.3 9.1 B1 8.32 2.39 7.6 16.3 3.8 5.3 0.2 0.0 5.5 11.4 8.7 B2 8.3 2.15 7.2 14.6 3.4 4.7 0.2 0.0 6.0 10.2 6.8 B3 8.21 1.61 6.3 10.9 2.6 3.5 0.2 0.0 5.5 7.7 4.1
Mamoudia A1 8.12 2.09 7.1 14.2 3.3 4.6 0.2 0.0 3.0 9.9 9.4 A2 8.2 2.18 7.3 14.8 3.5 4.8 0.2 0.0 2.0 10.4 10.9 A3 7.96 1.86 6.7 12.6 3.0 4.1 0.2 0.0 2.5 8.9 8.5 B1 8.35 2 7.0 13.6 3.2 4.4 0.2 0.0 2.5 9.5 9.4 B2 8.41 3.27 8.9 22.2 5.2 7.2 0.3 0.0 2.5 15.6 16.9 B3 8.28 1.76 6.5 12.0 2.8 3.9 0.2 0.0 3.0 8.4 7.5
- A1,A2,A3: Locations for soil samples at the beginning of the canal. - B1,B2,B3: Locations for soil samples at the end tail of the canal.
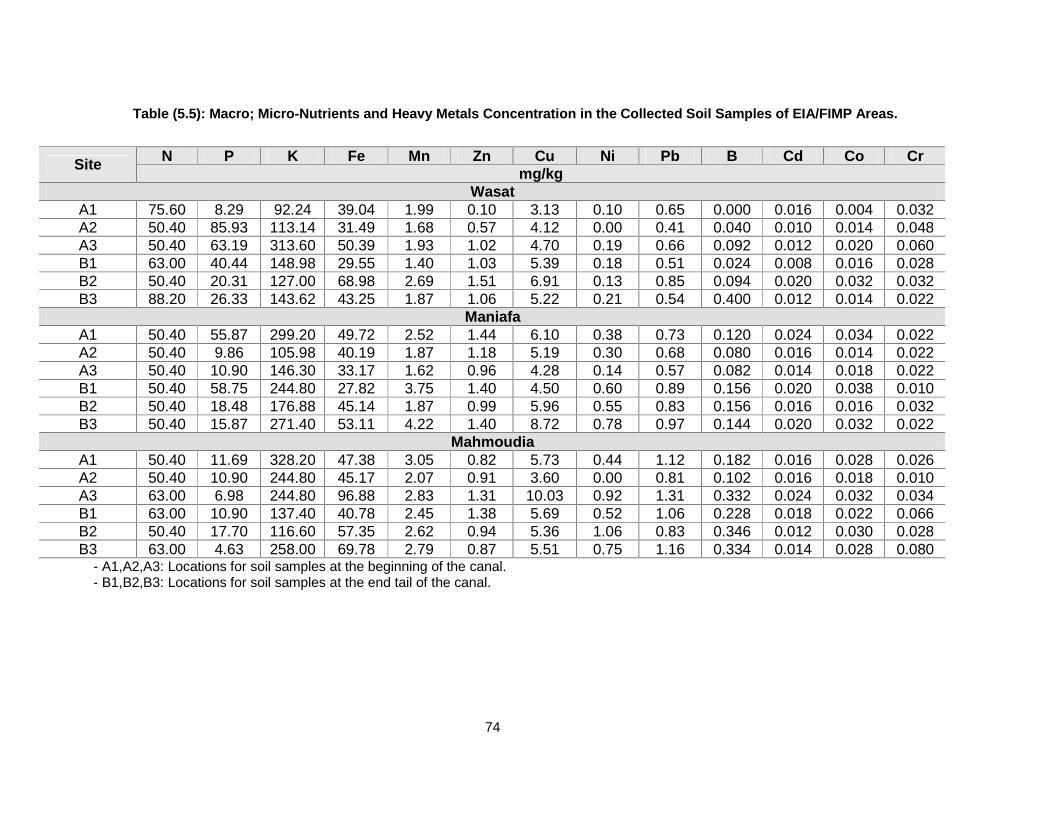
74
Table (5.5): Macro; Micro-Nutrients and Heavy Metals Concentration in the Collected Soil Samples of EIA/FIMP Areas.
N P K Fe Mn Zn Cu Ni Pb B Cd Co Cr Site
mg/kg Wasat
A1 75.60 8.29 92.24 39.04 1.99 0.10 3.13 0.10 0.65 0.000 0.016 0.004 0.032 A2 50.40 85.93 113.14 31.49 1.68 0.57 4.12 0.00 0.41 0.040 0.010 0.014 0.048 A3 50.40 63.19 313.60 50.39 1.93 1.02 4.70 0.19 0.66 0.092 0.012 0.020 0.060 B1 63.00 40.44 148.98 29.55 1.40 1.03 5.39 0.18 0.51 0.024 0.008 0.016 0.028 B2 50.40 20.31 127.00 68.98 2.69 1.51 6.91 0.13 0.85 0.094 0.020 0.032 0.032 B3 88.20 26.33 143.62 43.25 1.87 1.06 5.22 0.21 0.54 0.400 0.012 0.014 0.022
Maniafa A1 50.40 55.87 299.20 49.72 2.52 1.44 6.10 0.38 0.73 0.120 0.024 0.034 0.022 A2 50.40 9.86 105.98 40.19 1.87 1.18 5.19 0.30 0.68 0.080 0.016 0.014 0.022 A3 50.40 10.90 146.30 33.17 1.62 0.96 4.28 0.14 0.57 0.082 0.014 0.018 0.022 B1 50.40 58.75 244.80 27.82 3.75 1.40 4.50 0.60 0.89 0.156 0.020 0.038 0.010 B2 50.40 18.48 176.88 45.14 1.87 0.99 5.96 0.55 0.83 0.156 0.016 0.016 0.032 B3 50.40 15.87 271.40 53.11 4.22 1.40 8.72 0.78 0.97 0.144 0.020 0.032 0.022
Mahmoudia A1 50.40 11.69 328.20 47.38 3.05 0.82 5.73 0.44 1.12 0.182 0.016 0.028 0.026 A2 50.40 10.90 244.80 45.17 2.07 0.91 3.60 0.00 0.81 0.102 0.016 0.018 0.010 A3 63.00 6.98 244.80 96.88 2.83 1.31 10.03 0.92 1.31 0.332 0.024 0.032 0.034 B1 63.00 10.90 137.40 40.78 2.45 1.38 5.69 0.52 1.06 0.228 0.018 0.022 0.066 B2 50.40 17.70 116.60 57.35 2.62 0.94 5.36 1.06 0.83 0.346 0.012 0.030 0.028 B3 63.00 4.63 258.00 69.78 2.79 0.87 5.51 0.75 1.16 0.334 0.014 0.028 0.080
- A1,A2,A3: Locations for soil samples at the beginning of the canal. - B1,B2,B3: Locations for soil samples at the end tail of the canal.

75
Table (5.6) : Bacteria Status of the Collected Soil Samples of EAI/FIMP Areas
Total
Coliform Fecal Coliform Salmonila& Shegila Site
Cfu/g Cfu/g Cfu/g Wasat
A1 nd nd nd A2 nd nd nd A3 nd nd nd B1 nd nd nd B2 nd nd nd B3 nd nd nd
Maniafa A1 nd nd nd A2 nd nd nd A3 nd nd nd B1 nd nd nd B2 nd nd nd B3 nd nd nd
Mahmodia A1 330 110 nd A2 510 150 nd A3 410 100 nd B1 280 110 nd B2 310 130 nd B3 330 170 nd
nd: not found Cfu:colony forming unit - A1,A2,A3: Locations for soil samples at the beginning of the canal. - B1,B2,B3: Locations for soil samples at the end tail of the canal.

76
Table (5.7): Macro, Micro Nutrients and Heavy-Metal Concentrations in Plant Tissues Samples of EIA/FIMP Areas.
N P K Fe Mn Zn Cu Ni Pb B Cd Co Cr Site plant
% mg/kg dry matter Wasat
A1 SBS 0.85 0.12 4.07 0.03 58.70 27.00 20.60 1.30 57.80 5.60 0.29 0.30 4.80 A1 SBR 2.50 0.05 0.91 0.02 40.40 76.00 131.90 0.10 3.10 0.90 0.79 0.20 2.90 A2 WS 1.15 0.05 2.70 0.05 15.00 37.70 16.50 4.60 6.10 3.60 0.19 0.30 15.00 A2 WG 2.65 0.37 0.39 0.00 17.20 22.60 15.50 0.30 0.50 0.00 0.19 0.00 6.00 A3 SBS 2.25 0.21 3.86 0.04 40.40 20.60 14.30 0.30 158.70 10.80 0.19 0.10 2.60 A3 SBR 4.35 1.01 11.53 0.31 286.30 91.00 49.00 10.60 56.30 37.60 0.59 1.50 18.90 B1 WS 1.00 0.03 3.07 0.02 15.70 25.90 8.40 1.60 2.20 0.00 0.19 0.00 5.80 B1 WG 2.50 0.30 0.30 0.00 17.90 23.30 12.30 0.20 85.30 7.90 0.99 0.00 2.70 B2 Ber 1.75 0.25 2.27 0.05 25.90 28.00 16.50 2.00 174.90 57.70 0.39 0.20 8.60 B3 Ber 2.55 0.27 1.57 0.02 29.10 39.50 21.70 2.40 122.10 36.30 0.39 0.20 6.70
Maniafa
A1 WS 0.75 4.90 1.22 0.04 203.00 288.40 156.90 3.60 3.00 43.00 0.69 0.10 10.60
A2 WG 2.10 0.12 6.53 0.11 49.90 22.10 17.00 190.60 90.00 79.00 0.59 0.00 165.80 A3 Ber 2.45 0.05 1.43 0.02 8.40 31.80 6.90 4.50 91.20 15.60 -0.01 1.10 13.00 B1 WS 0.80 0.03 1.36 0.07 21.00 100.50 20.40 3.70 24.30 46.80 -0.01 0.10 10.90 B1 WG 1.75 3.07 5.42 0.07 142.50 207.10 47.90 3.80 77.50 46.70 0.89 0.00 20.80 B2 WS 0.90 0.03 3.86 0.04 10.30 19.10 6.00 0.90 4.10 2.30 0.29 0.00 3.70 B2 WG 2.04 4.69 3.86 0.11 208.50 182.40 57.10 2.90 35.10 13.20 0.69 0.40 8.40 B3 Ber 2.40 0.26 2.98 0.03 18.40 33.90 11.60 1.50 2.90 18.10 0.59 0.30 4.50
Mahmoudia A1 Ber 2.80 0.35 2.27 0.04 27.90 65.50 37.10 1.60 2.80 22.00 0.39 0.30 4.70 A2 Ber 0.50 0.11 2.88 0.03 16.10 85.40 8.90 2.50 2.40 1.10 0.49 0.10 4.60 A3 WS 1.35 0.12 2.10 0.04 17.20 29.70 9.00 0.40 83.20 2.40 0.19 0.00 4.10 A3 WG 1.50 0.35 0.44 0.01 22.30 20.90 11.00 2.00 107.80 0.00 0.09 0.00 6.30 B1 Ber 4.85 0.35 0.85 0.08 34.70 46.60 23.90 2.00 190.10 19.10 0.09 0.80 10.20 B2 Ber 3.10 0.26 0.85 0.00 25.70 30.40 13.90 0.60 182.10 14.60 0.07 0.83 4.60 B3
Ber 3.30 0.19 0.64 0.00 31.90 23.70 ????? 0.00 0.00 17.60 0.03 0.63 1.90
SBS: Sugar beet shoot, SBR: Sugar beet root; WS: Wheat Straw WG: Wheat Grain; Ber: Berseem
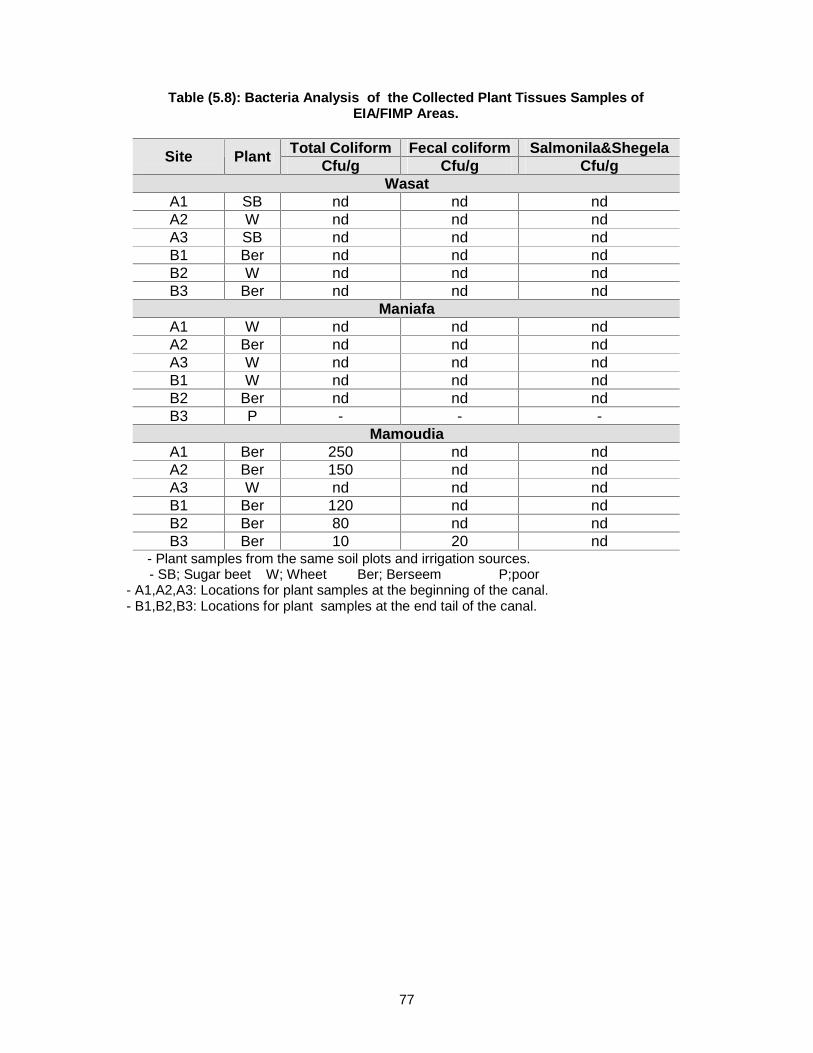
77
Table (5.8): Bacteria Analysis of the Collected Plant Tissues Samples of EIA/FIMP Areas.
Total Coliform Fecal coliform Salmonila&Shegela Site Plant
Cfu/g Cfu/g Cfu/g Wasat
A1 SB nd nd nd A2 W nd nd nd A3 SB nd nd nd B1 Ber nd nd nd B2 W nd nd nd B3 Ber nd nd nd
Maniafa A1 W nd nd nd A2 Ber nd nd nd A3 W nd nd nd B1 W nd nd nd B2 Ber nd nd nd B3 P - - -
Mamoudia A1 Ber 250 nd nd A2 Ber 150 nd nd A3 W nd nd nd B1 Ber 120 nd nd B2 Ber 80 nd nd B3 Ber 10 20 nd
- Plant samples from the same soil plots and irrigation sources. - SB; Sugar beet W; Wheet Ber; Berseem P;poor - A1,A2,A3: Locations for plant samples at the beginning of the canal. - B1,B2,B3: Locations for plant samples at the end tail of the canal.
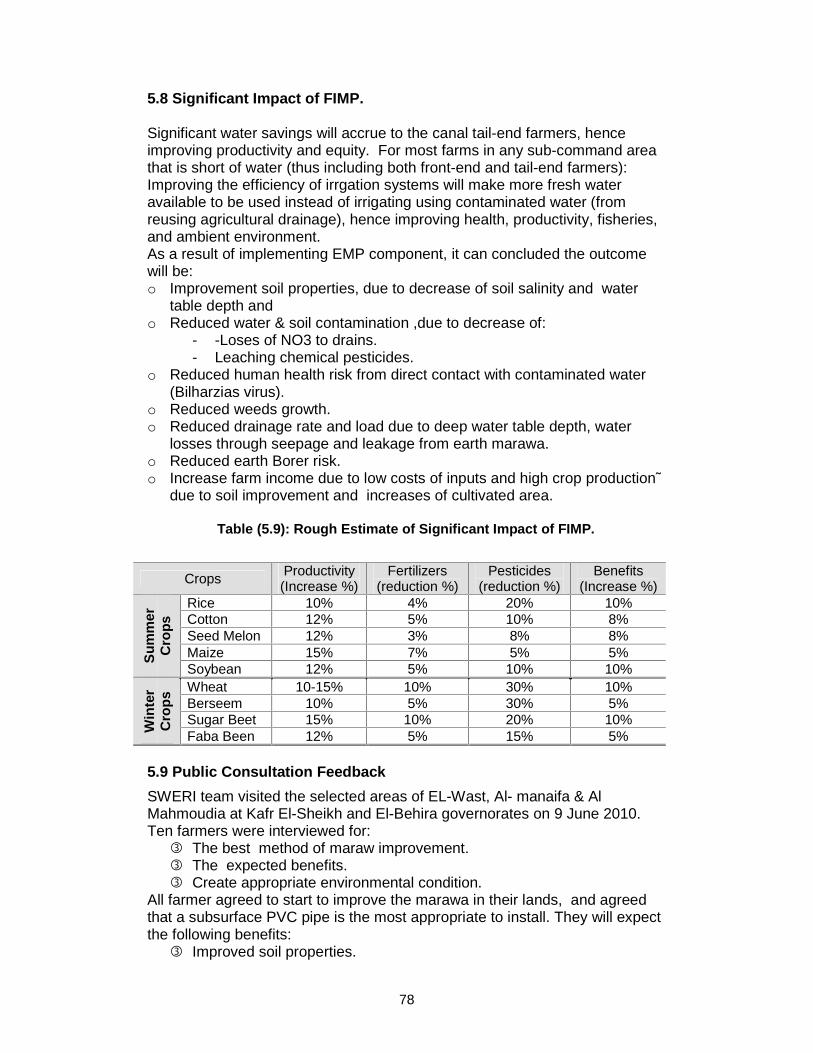
78
5.8 Significant Impact of FIMP. Significant water savings will accrue to the canal tail-end farmers, hence improving productivity and equity. For most farms in any sub-command area that is short of water (thus including both front-end and tail-end farmers): Improving the efficiency of irrgation systems will make more fresh water available to be used instead of irrigating using contaminated water (from reusing agricultural drainage), hence improving health, productivity, fisheries, and ambient environment. As a result of implementing EMP component, it can concluded the outcome will be: o Improvement soil properties, due to decrease of soil salinity and water
table depth and o Reduced water & soil contamination ,due to decrease of:
- -Loses of NO3 to drains. - Leaching chemical pesticides.
o Reduced human health risk from direct contact with contaminated water (Bilharzias virus).
o Reduced weeds growth. o Reduced drainage rate and load due to deep water table depth, water
losses through seepage and leakage from earth marawa. o Reduced earth Borer risk. o Increase farm income due to low costs of inputs and high crop production˜
due to soil improvement and increases of cultivated area.
Table (5.9): Rough Estimate of Significant Impact of FIMP.
Crops Productivity (Increase %)
Fertilizers (reduction %)
Pesticides (reduction %)
Benefits (Increase %)
Rice 10% 4% 20% 10% Cotton 12% 5% 10% 8% Seed Melon 12% 3% 8% 8% Maize 15% 7% 5% 5% S
um
mer
C
rop
s
Soybean 12% 5% 10% 10% Wheat 10-15% 10% 30% 10% Berseem 10% 5% 30% 5% Sugar Beet 15% 10% 20% 10%
Win
ter
Cro
ps
Faba Been 12% 5% 15% 5% 5.9 Public Consultation Feedback
SWERI team visited the selected areas of EL-Wast, Al- manaifa & Al Mahmoudia at Kafr El-Sheikh and El-Behira governorates on 9 June 2010. Ten farmers were interviewed for:
��The best method of maraw improvement. ��The expected benefits. ��Create appropriate environmental condition.
All farmer agreed to start to improve the marawa in their lands, and agreed that a subsurface PVC pipe is the most appropriate to install. They will expect the following benefits:
��Improved soil properties.
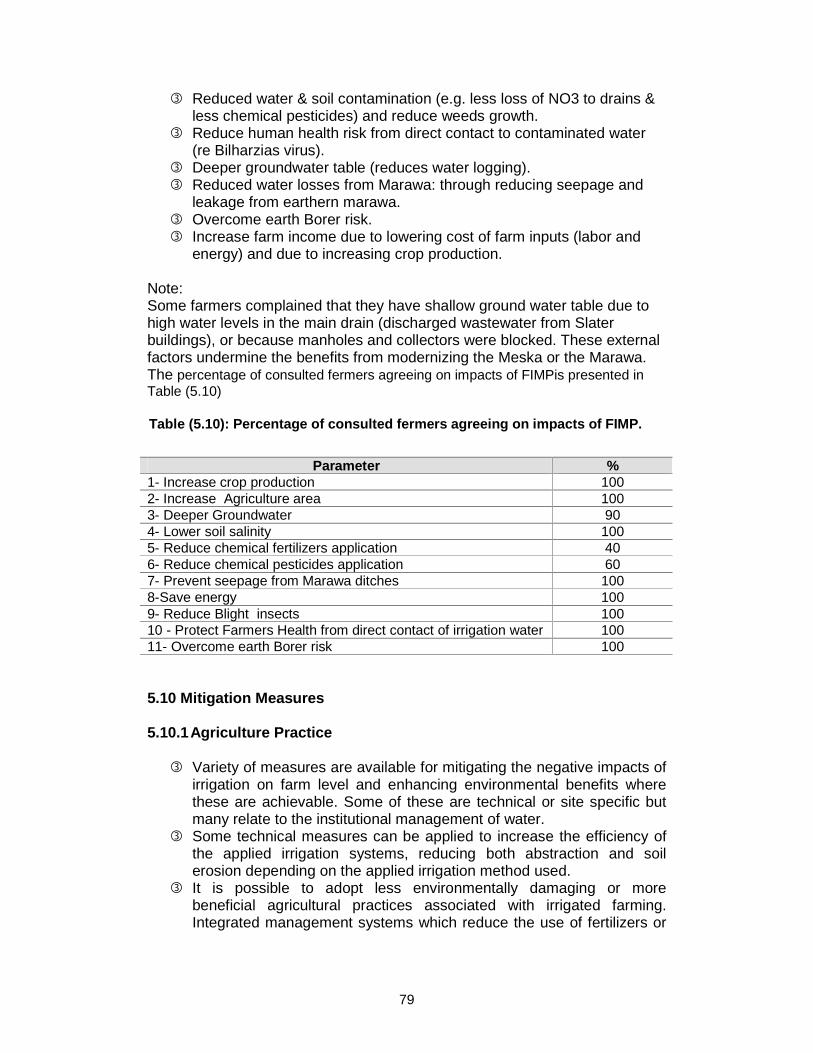
79
��Reduced water & soil contamination (e.g. less loss of NO3 to drains & less chemical pesticides) and reduce weeds growth.
��Reduce human health risk from direct contact to contaminated water (re Bilharzias virus).
��Deeper groundwater table (reduces water logging). ��Reduced water losses from Marawa: through reducing seepage and
leakage from earthern marawa. ��Overcome earth Borer risk. ��Increase farm income due to lowering cost of farm inputs (labor and
energy) and due to increasing crop production. Note: Some farmers complained that they have shallow ground water table due to high water levels in the main drain (discharged wastewater from Slater buildings), or because manholes and collectors were blocked. These external factors undermine the benefits from modernizing the Meska or the Marawa. The percentage of consulted fermers agreeing on impacts of FIMPis presented in Table (5.10)
Table (5.10): Percentage of consulted fermers agreeing on impacts of FIMP.
Parameter %
1- Increase crop production 100 2- Increase Agriculture area 100 3- Deeper Groundwater 90 4- Lower soil salinity 100 5- Reduce chemical fertilizers application 40 6- Reduce chemical pesticides application 60 7- Prevent seepage from Marawa ditches 100 8-Save energy 100 9- Reduce Blight insects 100 10 - Protect Farmers Health from direct contact of irrigation water 100 11- Overcome earth Borer risk 100
5.10 Mitigation Measures 5.10.1 Agriculture Practice
��Variety of measures are available for mitigating the negative impacts of irrigation on farm level and enhancing environmental benefits where these are achievable. Some of these are technical or site specific but many relate to the institutional management of water.
��Some technical measures can be applied to increase the efficiency of the applied irrigation systems, reducing both abstraction and soil erosion depending on the applied irrigation method used.
��It is possible to adopt less environmentally damaging or more beneficial agricultural practices associated with irrigated farming. Integrated management systems which reduce the use of fertilizers or

80
pesticides, and mixed cropping, can both bring benefits. Farmers can switch to organic or integrated production methods.
5.10.2 Monuments and historical property
��Taking into account the law of the protection of monuments Act No. 117 of 1983, all movable monuments which may be found by the contractor or one of his followers during drilling must be handed over immediately to the employer otherwise the contractor will be a violator to the monuments law by possession of the monuments without a license.
��if an antique is found, the contractor should inform the administrative agency which shall notify the Supreme Council of Antiquities.
��In the event of implementing works in an archaeological area or next to these areas, the Supreme Council of Antiquities should hire technicians at the expense of the contractor to observe the location and is its monuments, and the contractor should take such precautions and he is the guarantor of the prevention of damage of any monuments. The monument is in all cases, the property of the state
5.10.3 Measures for Civil Works The Contractor shall not harm the surrounding environment during the period of implementation of the contract and ensure that contamination of waterways will not occur as a result of any activities by disposal of the excavated materials and the remnants of construction materials should not be in the agricultural land or the waterways. In the case of damage to the environment by the contractor, the project manager should estimate the value of the environmental damage and restore the thing to its original state at the expense of the contractor against receivables in accordance with item 12 contractor risks and item 48 of the General Conditions of the contract. 5.10.3.1 Protection of Environment The contractor should undertake the implementation of any measures to prevent the damage to the environment and take all the precautions required by the project manager to prevent damage and reduce the impact on the environment and works to make sure that employees and workers are committed to these measures and precautions as follows:
��The roads should not be occupied as a result of the contractor works ��The finishing works should be done as quickly as possible and return
the situation to its original state and the minutes of the final receipt will be signed unless the supervisor committee is sure that waterways are clean from any construction materials and the banks of the canals are clear from any obstacles resulting from the construction and ensure the flow of water.
��The Contractor shall limit the construction work between the hours of 6 am to 7 pm if it exists in a residential area or close to it.
�� The Contractor shall avoid the use of heavy equipment in certain areas during the night or in sensitive areas such as near hospitals.

81
��The contractor must prevent dust pollution during periods of drought by spraying water on dust and gravel sub bases on a regular basis and the transporting vehicles should be covered to prevent the spilling over of the construction materials to the roads.
5.10.3.2 Transportation.
��The contractor must use selected roads in agreement with the project manager and vehicles with the proper size for the type of road and determine the load to prevent damage of roads and bridges used in the transport process to the project site, the contractor carries over the responsibility for any damage to roads and bridges due to overloading the transporting vehicles by construction materials and should be asked to repair the damage in agreement with the project manager.
��The contractor should not use any polluting vehicles, resulting in excess of pollution from exhaust or noise to the environment especially in the dwelling zones (residential areas)
�� The contractor should use appropriate controls to traffic safety in the project site throughout the implementation of the contract and these controls should subject to prior approval of the project manager
5.10.3.3 Employment.
��The Contractor should provide the necessary training for his workers on the environmental safe guard issues.
��The Contractor shall install and maintain a temporary septic tanks to collect sewage waste from labor camps and to ensure no contamination will dumped into the nearby watercourses
��the contractor must establish a system for collection and disposal of all solid waste resulting from labor camps or administration offices.
��The Contractor should not be allowed to use trees as fuel wood for cooking or heating in any of the overnight workers or administration offices, and must use other alternatives non-polluting the environment.
��The Contractor shall ensure that the office and warehouse site and especially the storage sites for diesel fuel, bitumen and asphalt, is located at a distance (500) meters away, at least, from waterways and managed so as not to result in pollutants reaching the waterways, both surface and groundwater, especially during periods of rain. This requires the recycling of lubricants and digging a trench around the area for collecting oils when necessary.
5.10.3.4 Quarries and Areas of the Supply of Construction Materials.
��The contractor should get an approval from project manager to get a
soil or stones from outside the approved quarries without any violations of the technical specifications and laws and should avoid getting such materials from any areas of conflict with the natural drainage paths or planned. And should avoid sites near waterways, where it can lead to the decline or destruction of bridges or cause the fall of large amounts of materials to the waterways

82
��the contractor must ensure that any used areas as quarries were left in the case of constant and stable side slopes and dry to ensure that no accumulation of stagnant water leading to mosquito breeding.
��The project manager should approve the sites of crushing machines in the quarries site and the environmentally sensitive areas or residential areas should be avoided.
5.10.3.5 Earth Works.
��The earth works must be controlled in an appropriate manner in the earth and especially during the rainy season.
��The contractor should protect the stability of slopes in the areas of cutting and filling at all times and to reduce as much as possible from the surrounding areas affected by the work area.
��The contractor should complete the excavation and filling of the final cross sections at any site as soon as possible, preferably in one continuous process, and not to leave an incomplete part of the work and especially in the rainy season,
��Ditches must be implemented in the upper and lower top and bottom of the slopes in order to protect it from erosion, in conformity with the designs and planting it by grass or other cover green.
�� The contractor must get rid of any inappropriate materials in the public landfill areas in agreement with the project manager.
5.10.3.6 Disposal of Construction Waste
��The contractor must re-use the construction wastes resulting from the removal of any facilities existing as much as possible in the construction of the proposed (such as the use of materials filling) if they are in conformity with the specifications and approved by project manager, and should dispose the rest of the construction wastes in the public landfill and the contractor must guarantee that these sites (a) does not exist in environmentally sensitive areas or forest areas, (b) does not affect the natural drainage paths, (c) does not affect rare wildlife and endangered species.
�� In the case of the disposal of any garbage or waste sludge in the building or neighboring land, the contractor must react immediately to remove them and clean the affected area and return it to its original condition in accordance with the guidance of project manager and so at the expense of the contractor.
��The contractor must get rid of clayey materials resulting from excavation or other construction activities so that no pollution will reach the surface water and no mud blocks will be built up in the region.
��All transport arrangements during construction, including supply, maintenance, dismantling and removal of waste if necessary, will be considered complementary to the work and included in the contract cost and should be planned and executed by the contractor and approved and instructed by the project manager.
��All the transporting vehicles, machines must be run, and maintained in a manner not conducive to spilled fuel and lubricants and

83
contamination to the ground. And buffers for oil must be provided in the areas of washing and refueling. fuel tanks must also be at a suitable venue and isolated.
��The contractor must get rid of all petroleum spills in accordance with the procedures / instructions of environmental standards. The fuel storage tanks must be located at a distance of at least (300) meters from drainage facilities and water sources as instructed by the project manager.
5.10.4 Socio-Economic.
��No land acquisition and no compensation and relocation issue will be involved.
��Vehicles and equipment that will be used during the construction of dam including dump trucks, lorry trucks and machines will remain confined within the project area and will be properly tuned up. Pressure horns will not be allowed.
��All safety measures to avoid accident will be adopted. ��Project will create temporary opportunity for the local population.
Unskilled employment will be reserved for local residents. ��Project activities will not bring about any disturbance to the privacy of
women, because all the crew will be monitored properly not to disturb the local women in the area.
84
6. ANALYSIS OF ALTERNATIVES. Up to the date of submission of this report, no alternative sites, designs, nor operations are developed for the FIMP considering it is at a preparatory feasibility assessment stage. 6.1 Project Site Alternatives. Alternatives considered and rejected: (i) Other locations in the Delta and in Middle and Upper Egypt were considered. However, to achieve rapid delivery of cost-effective and sustainable results, it is considered better to focus on areas where improved irrigation systems and effective water user organizations are already in place at the mesqa level. (ii) The possibility of scaling up the pilot IIIMP farm-level activities through a project jointly managed by the MALR and MWRI comprising integrated mesqa/marwa and farm-level improvements, along the lines of the IIIMP, was considered. However, this option was rejected because of the greater institutional complexity and the need to focus on improved extension service delivery. Finally, no alternative project sites were proposed. The IIIMP has pre-defined and designated areas in which the projects will be implemented. 6.2 Technology and Design Alternatives. No technology alternatives are devised for the interventions at the conceptual level. Such alternatives may develop during the implementation stage of the IIIMP and would be more appropriately addresses on a project by project base by the environmental component. 6.3 Operation Alternatives. No alternative operational mechanisms are proposed at the conceptual stage. Such alternatives may be developed in conjunction with the development of designs during the FIMP implementation.

85
7. ENVIRONMENTAL MANAGEMENT PLAN (EMP). 7.1 Impacts and Measured Associated with Irrigation and Drainage Schemes
Updating the EIA and the results of the monitoring process will be used to manage the environmental impacts, particularly to highlight problems early so that actions can be taken. The range of monitored parameters will be dictated by the “prediction and mitigation” stage of the EIA.
Different types of irrigation systems will have different impacts and it should not be assumed that modern systems will have less impacts. Impacts will also vary according to the stage of implementation. Such issues must be predicted by the EIA and mitigation measures prepared.
The construction and operation of irrigation systems may have variety of impacts on the environment. These include the destruction or alteration of habitat, water erosion, and salinity buildup. The most common problems associated with irrigation and drainage schemes are listed in Table (7.1) below with their potential preventions/mitigations. Table (7.2) lists the FIMP-specific likely impacts and their preventive/mitigation measures.
Table (7.1): Long list of General Impacts Associated with non-sustainable Irrigation and Drainage Schemes and the Related Mitigation at Farm Level
Problem Mitigation measures
Degradation of irrigated land: �� Improve irrigation &drainage operation to match demand both 'how much & when'.
Salinization
�� Provide drainage including disposal of water to evaporation ponds or the sea if quality of canal flow adversely affected by drainage water.
Alkalization
�� Maintain channels to prevent seepage, and reduce inefficiencies resulting from siltation and weeds. Allow for access to channels for maintenance in design.
Water logging �� Provide water for leaching as a specific operation.
Reduced socio-economic conditions: �� Manage irrigation &drainage to prevent disease spread.
Increased incidence of water related disease
�� Educate about causes of disease.
Poor water quality: �� Define and enforce return water quality levels (including monitoring).
Reduction in irrigation water quality �� Control industrial pollutants. Water quality problems for downstream users caused by irrigation return flow quality
�� Designate land for saline water disposal; build separate disposal channels.
Water quality problems for downstream users caused by irrigation return flow quality
�� Designate land for saline water disposal; build separate disposal channels.
�� Educate for pesticide or sewage contamination dangers.
�� Monitor irrigation water quality.

86
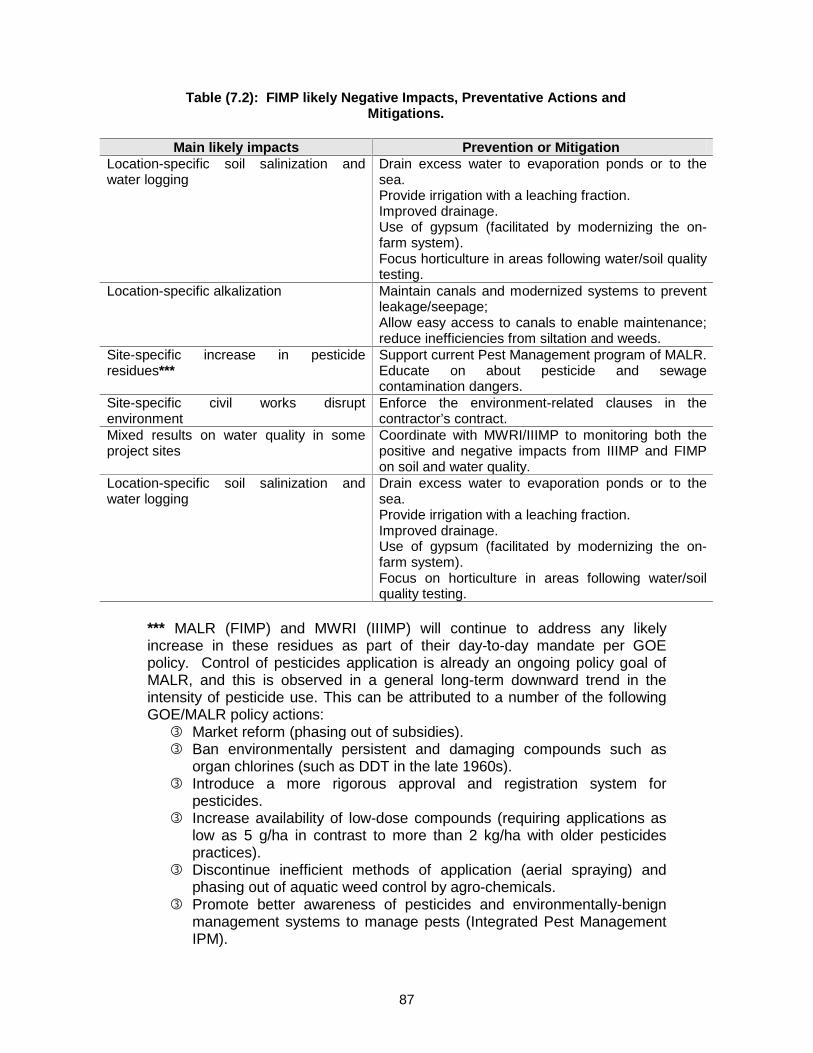
87
Table (7.2): FIMP likely Negative Impacts, Preventative Actions and Mitigations.
Main likely impacts Prevention or Mitigation
Location-specific soil salinization and water logging
Drain excess water to evaporation ponds or to the sea. Provide irrigation with a leaching fraction. Improved drainage. Use of gypsum (facilitated by modernizing the on-farm system). Focus horticulture in areas following water/soil quality testing.
Location-specific alkalization
Maintain canals and modernized systems to prevent leakage/seepage; Allow easy access to canals to enable maintenance; reduce inefficiencies from siltation and weeds.
Site-specific increase in pesticide residues***
Support current Pest Management program of MALR. Educate on about pesticide and sewage contamination dangers.
Site-specific civil works disrupt environment
Enforce the environment-related clauses in the contractor’s contract.
Mixed results on water quality in some project sites
Coordinate with MWRI/IIIMP to monitoring both the positive and negative impacts from IIIMP and FIMP on soil and water quality.
Location-specific soil salinization and water logging
Drain excess water to evaporation ponds or to the sea. Provide irrigation with a leaching fraction. Improved drainage. Use of gypsum (facilitated by modernizing the on-farm system). Focus on horticulture in areas following water/soil quality testing.
*** MALR (FIMP) and MWRI (IIIMP) will continue to address any likely increase in these residues as part of their day-to-day mandate per GOE policy. Control of pesticides application is already an ongoing policy goal of MALR, and this is observed in a general long-term downward trend in the intensity of pesticide use. This can be attributed to a number of the following GOE/MALR policy actions:
��Market reform (phasing out of subsidies). ��Ban environmentally persistent and damaging compounds such as
organ chlorines (such as DDT in the late 1960s). ��Introduce a more rigorous approval and registration system for
pesticides. ��Increase availability of low-dose compounds (requiring applications as
low as 5 g/ha in contrast to more than 2 kg/ha with older pesticides practices).
��Discontinue inefficient methods of application (aerial spraying) and phasing out of aquatic weed control by agro-chemicals.
��Promote better awareness of pesticides and environmentally-benign management systems to manage pests (Integrated Pest Management IPM).

88
7.2 Environmental Management Plan Elements for FIMP. The activities under this EMP subcomponents include: Monitoring, Assessment and Mitigation
��Assess and mitigate any site-specific excess residues from fertilizers & pesticides and per the above-mentioned existing national mandate/program of MALR.
��Assess and mitigate any site-specific increase in water salinity and soil salinity & alkalinzation or erosion.
�� Ensure that the civil-work contractors abide by the EMP-related clauses of the contract.
��Evaluate water table depth, salinity and contaminated levels of groundwater, and suggest solutions.
��Monitor soil fertility and crop quality and production. Technical Assistance
��Develop nutrient management practice at farm level. ��Develop pest management practice at farm level. ��Support FIMP (EALIP) with obtaining the M&E indictors on the EMP-
related negative and positive impacts. Public Awareness
��Improve farmer public awareness on on-farm environmental management
Capacity Building ��Enhance capacity building of SWERI and EALIP in the field of
environmental impact assessment and management. Through: o Study tours o Conference and workshop and tailored training program
��Enhance knowledge transfer plan through o Develop knowledge transfer plan o Conduct meetings and workshops with the relevant stakeholders
7.3 Management Plan Details for FIMP. The indicators proposed for environmental monitoring have mainly include:
��Shallow groundwater levels (water table) throughout the project area particularly, in low areas where water logging is most likely to Occur. Observation will be constructed to monitor the water table level.
��Soil quality to ensure that the measures carried out are not degrading the soil within the project area characteristics such as salinity, alkalinity, pesticides, fertilizers and nutrients analysis.
��Irrigation and drainage water quality including salinity, alkalinity and pesticides.
��Crop quantity through crop productivity and crop quality through pesticides, fertilizers and nutrients analysis.
��The three project areas will be monitored including: • Mahmoudia • Wasat • Manayfa

89
��Three monitored sites will be selected for each sub project area: • Upstream zone • Middle zone • Downstream zone
��Three monitored sites will be selected for each zone of sub-project area, so, in total 27 sites will be monitored for the project.
The following Table(7.3) reflects the proposed indicators, methods used, frequency of measurement and monitored sites.
Table (7.3): Summary of Environmental Monitoring: Parameters Monitored and
Monitoring Frequency.
Indicators Methods and frequency Monitored sites
Pesticides
Soil Crop
Water
��Sampling for lab analysis ��Sampling twice a year for two
seasons ��(First and last year will be sampled
once a year for one season)
27 sites
Salinity and Alkalinity
Soil
��Sampling for lab analysis ��Sampling twice a year for two
seasons ��(First and last year will be samples
once a year for one season)
27 sites
Water
��Portable EC meter & Sampling for lab analysis
��Sampling four time a year ��(First and last year will be sampled
twice a year for one season)
27 sites
Fertilizers & Nutrients
Soil
Crop
��Sampling for lab analysis ��Sampling twice a year for two
seasons ��(First and last year will be samples
once a year for one season) ��Five crops per season will be
sampled
27 sites
Water Microbiology
Summer
Winter
��Sampling twice a year for two seasons
��(First and last year will be samples once a year for one season)
��27 sites
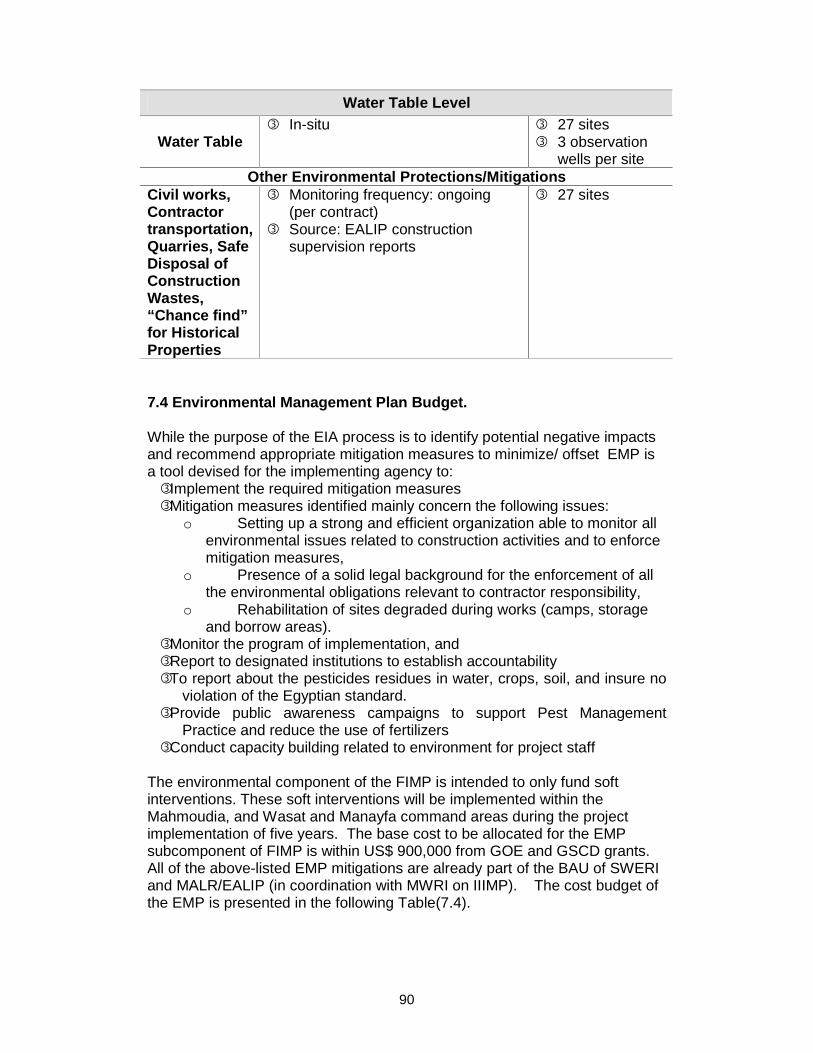
90
Water Table Level
Water Table ��In-situ ��27 sites
��3 observation wells per site
Other Environmental Protections/Mitigations Civil works, Contractor transportation, Quarries, Safe Disposal of Construction Wastes, “Chance find” for Historical Properties
��Monitoring frequency: ongoing (per contract)
��Source: EALIP construction supervision reports
��27 sites
7.4 Environmental Management Plan Budget. While the purpose of the EIA process is to identify potential negative impacts and recommend appropriate mitigation measures to minimize/ offset EMP is a tool devised for the implementing agency to: ��Implement the required mitigation measures ��Mitigation measures identified mainly concern the following issues:
o Setting up a strong and efficient organization able to monitor all environmental issues related to construction activities and to enforce mitigation measures,
o Presence of a solid legal background for the enforcement of all the environmental obligations relevant to contractor responsibility,
o Rehabilitation of sites degraded during works (camps, storage and borrow areas).
��Monitor the program of implementation, and ��Report to designated institutions to establish accountability ��To report about the pesticides residues in water, crops, soil, and insure no
violation of the Egyptian standard. ��Provide public awareness campaigns to support Pest Management
Practice and reduce the use of fertilizers ��Conduct capacity building related to environment for project staff
The environmental component of the FIMP is intended to only fund soft interventions. These soft interventions will be implemented within the Mahmoudia, and Wasat and Manayfa command areas during the project implementation of five years. The base cost to be allocated for the EMP subcomponent of FIMP is within US$ 900,000 from GOE and GSCD grants. All of the above-listed EMP mitigations are already part of the BAU of SWERI and MALR/EALIP (in coordination with MWRI on IIIMP). The cost budget of the EMP is presented in the following Table(7.4).

91
Table (7.4): Summary of EMP Activities, Responsibility and Budget Monitoring
Year Media
First Second Third Fourth Fifth Number of samples
Cost/sample US$
Cost US$
Remarks/ Responsibility
Pesticides Soil 1 * 27 2 * 27 2 * 27 2 * 27 1 * 27 216 200 43� ž0 Crop 1 * 27 2 * 27 2 * 27 2 * 27 1 * 27 216 200 43� ž0 Water 1 * 27 2 * 27 2 * 27 2 * 27 1 * 27 216 200 43� ž0
Total 648 129600
SWERI
Year Media First Second Third Fourth Fifth
Number of samples
Cost/sample US$
Cost US$
Remarks/ Responsibility
Salinity and Alkalinity Soil 1 * 27 2 * 27 2 * 27 2 * 27 1 * 27 216 15 3240 Water 2 * 27 4* 27 4 * 27 4 * 27 2 * 27 432 15 6480
Total 9720 SWERI
Year Media First Second Third Fourth Fifth
Number of samples
Cost/sample US$
Cost US$
Remarks/ Responsibility
Fertilizers & Nutrients Soil 1 * 27 2 * 27 2* 27 2 * 27 1 * 27 216 25 5400 Crop 1 *5* 27 2* 5*27 2 *5 *27 2 *5 *27 2 *5 *27 1080 25 27000
Total 32400 SWERI

92
Year Media
First Second Third Fourth Fifth
Number of
samples
Cost/sample US$
Cost US$
Remarks/ Responsibility
Water Microbiology Summer 27 27 27 27 108 50 5400 Winter 27 27 27 27 108 50 5400
Total 10800 SWERI
Year Media First Second Third Fourth Fifth
Number of wells
Cost/sample US$
Cost US$
Remarks/ Responsibility
Water Table Level Groundwater 3*27 3*27 162 30 4860
Total 4860
Total cost in-situ and sample analysis 187380
Cost for construction of
observation wells (SWERI)
Year Media First Second Third Fourth Fifth
Number of samples
Cost/trip US$
Cost US$ Remarks
Field trip (allowance & Car fuel) Sampling 3* 24 3 * 48 3 * 48 3 * 48 3* 24 576 150 86250 Follow up, evaluation and meetings
3*4 *6 3*4*12 3*4*12 3*4*12 3*4*12 576 150 86250
Total 172500
3 project areas 5 staff per trip Cost include car fuel (EALIP, CAAE, CASWE and SWERI)
Public awareness campaigns

93
Year
Media First Second Third Fourth Fifth
Number of Campaign
Cost/ Campaign
US$
Cost US$
Remarks/ Responsibility
Public awareness campaigns Fertility 15 27 27 � � 15 111 300 33300 PMP 15 27 27 � � 15 111 300 33300 Env. 15 27 27 � � 15 111 300 33300
Total 99900
Cost includes logistic for participants and campaigns crew (CAAE, CASWE and
SWERI Technical Assistant (Consultation)
Year Media
First Second Third Fourth Fifth Number of
Consultation
Fees/ Consultation
US$
Cost US$
Remarks
Consultation Soil Fertility 1 1 1 1 1 5 5,000 25000 Monitoring Assessment 1 1 1 1 1 5 � flžžž 25000 Pest Management 1 1 1 1 1 5 5,000 25000
CAAE, CASWE and SWERI
Total 15 75,000
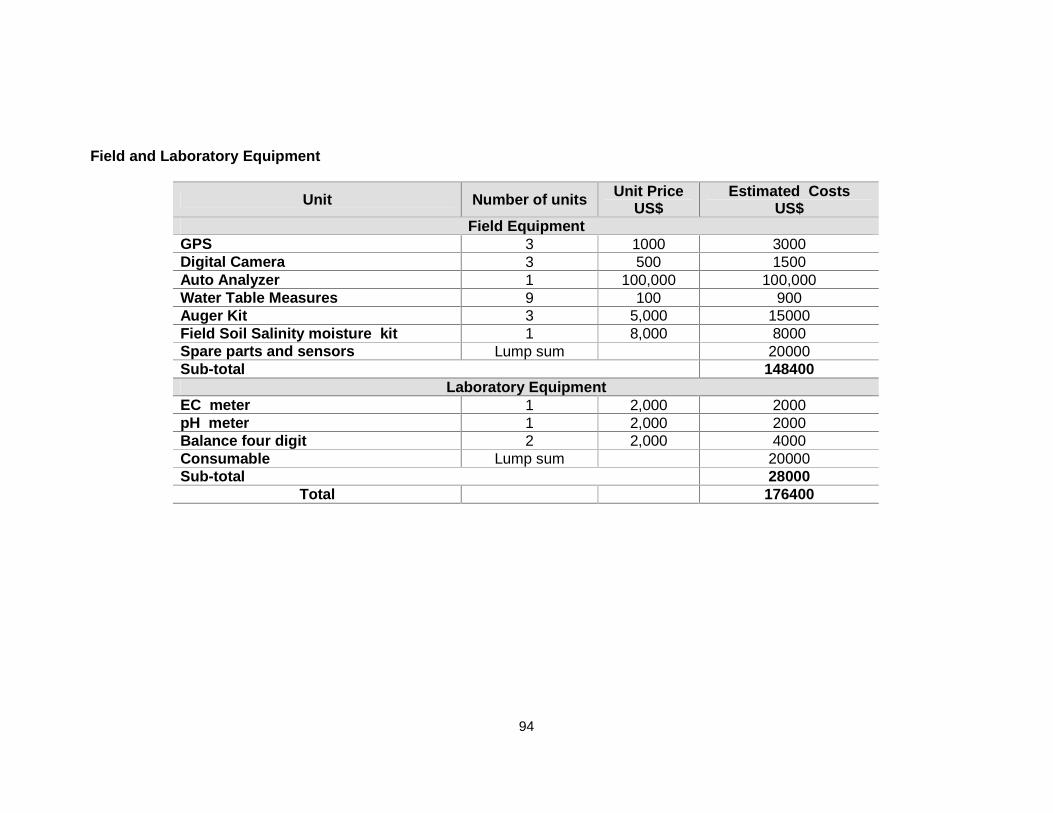
94
Field and Laboratory Equipment
Unit Number of units Unit Price US$
Estimated Costs US$
Field Equipment GPS 3 1000 3000 Digital Camera 3 500 1500 Auto Analyzer 1 100,000 100,000 Water Table Measures 9 100 900 Auger Kit 3 5,000 15000 Field Soil Salinity moisture kit 1 8,000 8000 Spare parts and sensors Lump sum 20000 Sub-total 148400
Laboratory Equipment EC meter 1 2,000 2000 pH meter 1 2,000 2000 Balance four digit 2 2,000 4000 Consumable Lump sum 20000 Sub-total 28000
Total 176400

95
In relation to physical capacity building, the needs and costs are limited to the necessary funds for refurbishing the field area offices including: office furniture, office equipment, vehicles and running costs. The following are details of each cost line item. Refurbishing
Cost line item Estimated Costs US$
Painting 2500 Curtains 2500 Air condition units 5000 Total 10,000
Office Furniture
Unit Number of units
Unit Price US$
Estimated Costs US$
Desk and Side table 5 200 1000 Desk chair 10 100 1000 Meeting table 2 400 800 Refrigerator 4 400 1600
Total 4400 Office Equipment
Unit Number of units
Unit Price US$
Estimated Costs US$
Computer Set 5 1,000 5000 Printers 5 500 2500 Software 2000 Copy Machine 1 3500 Office supply 20000
Total 33,000 Vehicles for field trips
Unit Number of units
Unit Price US$
Estimated Costs US$
Vehicle (double cabin) 3 35000 105,000 Total 105,000
Proposed Training Plan To develop the training schedule the team considered that the project will be implemented during the period January 2011– December 2015. The stat-up date is recommended to allow appropriate time for completion of the inception stage and maintaining appropriate approvals. The following section demonstrating the training plan and proposed implementation dates as well as associated cost for each training program. This plan is prepared for the five years.
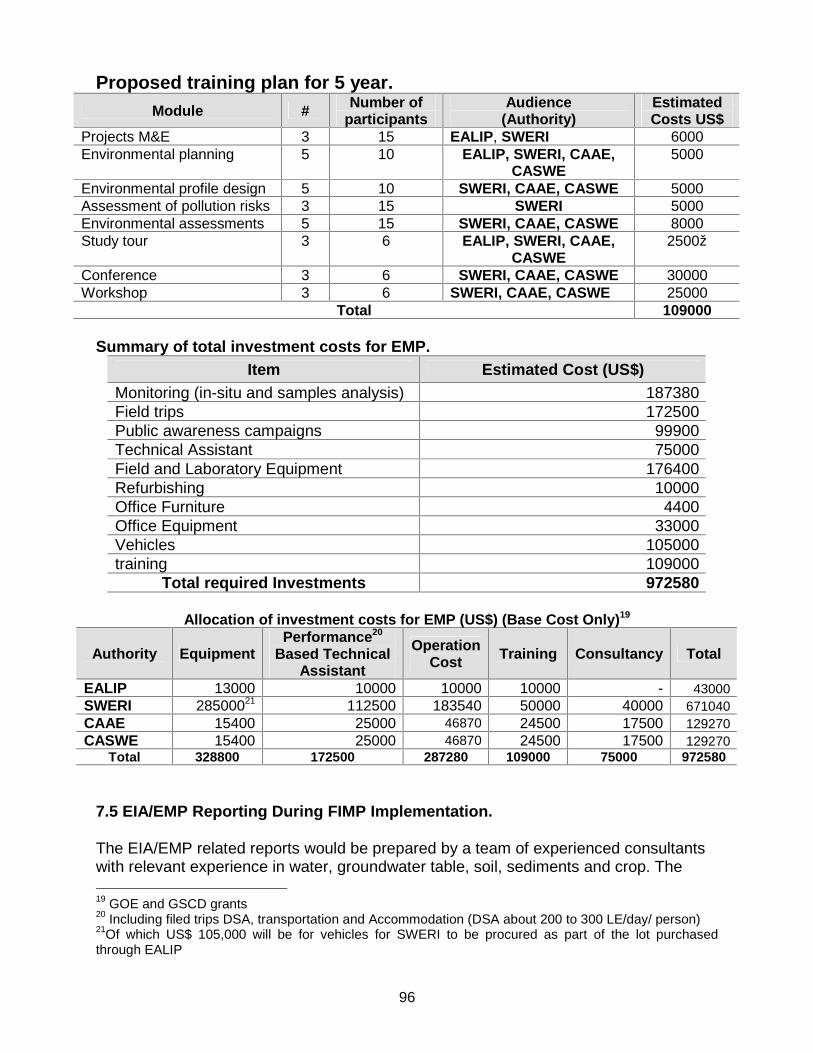
96
Proposed training plan for 5 year. Module # Number of
participants Audience
(Authority) Estimated Costs US$
Projects M&E 3 15 EALIP , SWERI 6000 Environmental planning 5 10 EALIP, SWERI, CAAE,
CASWE 5000
Environmental profile design 5 10 SWERI, CAAE, CASWE 5000 Assessment of pollution risks 3 15 SWERI 5000 Environmental assessments 5 15 SWERI, CAAE, CASWE 8000 Study tour 3 6 EALIP, SWERI, CAAE,
CASWE 2500ž
Conference 3 6 SWERI, CAAE, CASWE 30000 Workshop 3 6 SWERI, CAAE, CASWE 25000
Total 109000 Summary of total investment costs for EMP.
Item Estimated Cost (US$) Monitoring (in-situ and samples analysis) 187380 Field trips 172500 Public awareness campaigns 99900 Technical Assistant 75000 Field and Laboratory Equipment 176400 Refurbishing 10000 Office Furniture 4400 Office Equipment 33000 Vehicles 105000 training 109000
Total required Investments 972580
Allocation of investment costs for EMP (US$) (Base Cost Only) 19
Authority Equipment Performance 20
Based Technical Assistant
Operation Cost Training Consultancy Total
EALIP 13000 10000 10000 10000 - 43000 SWERI 28500021 112500 183540 50000 40000 671040 CAAE 15400 25000 46870 24500 17500 129270 CASWE 15400 25000 46870 24500 17500 129270
Total 328800 172500 287280 109000 75000 972580 7.5 EIA/EMP Reporting During FIMP Implementation. The EIA/EMP related reports would be prepared by a team of experienced consultants with relevant experience in water, groundwater table, soil, sediments and crop. The 19 GOE and GSCD grants 20 Including filed trips DSA, transportation and Accommodation (DSA about 200 to 300 LE/day/ person) 21Of which US$ 105,000 will be for vehicles for SWERI to be procured as part of the lot purchased through EALIP

97
team is familiar with World Bank Safeguard procedures. The EMP component will deliver a bi-annual progress report. The progress reports of EIA/EMP work will cover the following:
��Activities to be done (planned) during the reporting period ��Conducted field trips ��Monitoring activities and summary analysis results ��Conducted public Awareness Campaigns ��Conducted capacity building activities including local training, workshops and
study tours ��Pesticides analysis and pest management practice in the project area ��Provided technical assistant ��Monitoring of civil works under Component 1 of the project ��Summary procurement ��Red flags and constraints ��Next bi-annual plan.
7.6 Institutional Setup for EMP Implementation and Reporting (“who does what”)
MALR agencies would lead project implementation. A Project Steering Committee will be established, chaired by the ARC (which includes SWERI), with membership of MALR, MWRI (mainly IIIMP), project area governorates, private sector and civil society, farmer associations and others. Its Executive Director would be responsible for project management and supported by staff responsible for M&E, financial management, procurement, and reporting. MALR’s EALIP would be responsible for farm-level irrigation improvements at the marwa level, and hence would coordinate with the MWRI at the interface with the mesqa level. The ARC (primarily through the EMU in SWERI) will lead the EMP implementation with support from EALIP and other MALR entities, each per its mandate, as follows (Fig. 7.1):
��SWERI: To take the water-quality samples, do the lab and desk analysis of the samples, undertake TA studies, and hence provide recommendations to guide the implementation of the EMP. SWERI will also provide training (for MALR staff) in-situ as well as on its premises, and will provide EALIP (PMU) with the M&E progress reports of the EMP.
��CAAE of MALR: To reach out to farmers to help SWERI and EALIP to execute the farmer-level training/extension/awareness activities of the EMP.
��CASWE of MALR: To help MALR/EALIP to enforce the on-farm water-quality regulations as per the EMP.
��MWRI (from IIIMP budget): To enforce the off-farm water-quality regulations as per the EMPs of FIMP and IIIMP.
��EALIP (PMU): will synthesize the progress reports received from SWERI, and will be responsible for the EMP prevention/mitigation measures related to civil works.
��EEAA: will provide overall oversight for the EMP, as per its ongoing national mandate.
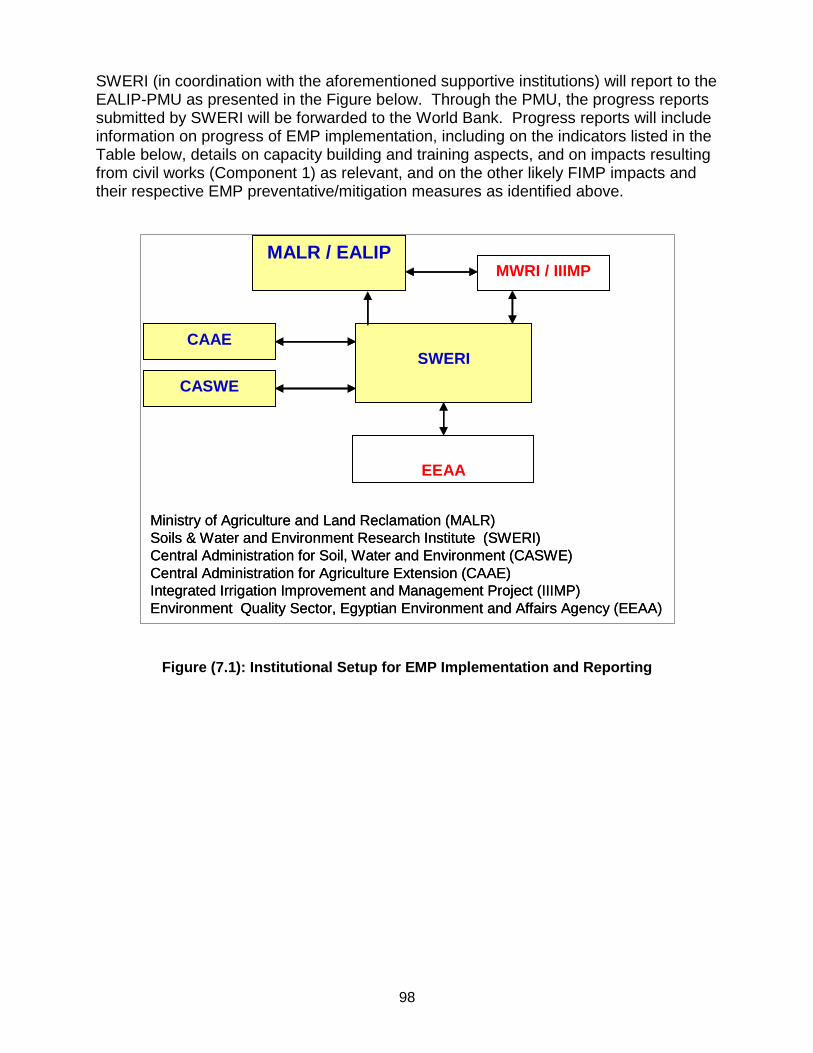
98
SWERI (in coordination with the aforementioned supportive institutions) will report to the EALIP-PMU as presented in the Figure below. Through the PMU, the progress reports submitted by SWERI will be forwarded to the World Bank. Progress reports will include information on progress of EMP implementation, including on the indicators listed in the Table below, details on capacity building and training aspects, and on impacts resulting from civil works (Component 1) as relevant, and on the other likely FIMP impacts and their respective EMP preventative/mitigation measures as identified above.
Figure (7.1): Institutional Setup for EMP Implementation and Reporting
MALR / EALIPMWRI / IIIMP
SWERICAAE
CASWE
EEAA
Ministry of Agriculture and Land Reclamation (MALR)Soils & Water and Environment Research Institute (SWERI)Central Administration for Soil, Water and Environment (CASWE)Central Administration for Agriculture Extension (CAAE)Integrated Irrigation Improvement and Management Project (IIIMP)Environment Quality Sector, Egyptian Environment and Affairs Agency (EEAA)
99
8. PEST MANAGEMENT PLAN The TOR for the EA study has specified that the consultants are to verify if the World Bank’s Operational Policy (OP 4.09) on pest management is applicable to the project, and if applicable to prepare mitigation measures. Based on the consultants’ analysis of the project’s interventions, OP 4.09 was found not applicable to the situation for the project components and structure, given that:
��The project does not attempt to expand on the existing cultivated lands within its command areas; (mainly focusing on improved productivity). Only minor land could be added due to Merwa improvement.
��The proposed farm- level irrigation modernization will help optimizing the application of pesticides and fertilizers, thus minimizing their residues;
��The pesticide analysis showed positive values but doesn't mean that the values exceed the permissible limits (further analysis is needed to confirm compliance/noncompliance of pesticide level on soil).
Nevertheless, with due consideration to the project leading comprehensive environmental management, measures were prepared as part of the EMP in order to ensure compliance with OP 4.09 and potentially contribute to the pool of mitigation measures recommended to prevent and control pollution to water channels. The major aspects of the PMP are to influence the shift from the current use of toxic pesticides to environmentally friendly integrated pest management techniques with proven results in Egypt. 8.1 Regulatory, Institutional and Policy Framework for Pest Control in Egypt. The first legislation regulating the dangerous chemicals was established in 1954 under the law No 453.The law established the procedures of handling the dangerous chemicals including pesticides trade and uses. The agricultural law No 53 issued in 1966 managed all agricultural practices including the legislation and regulation of pesticides .This law is considered the corner stone of in agriculture regulation and legislation. In response to the establishment of the Ministry of State for Environmental Affairs (MSEA), the Committee of Dangerous Chemicals and Pesticides was established in 1995 (the act No 1303) and was re-formulated in 1997 according to the act No 1006. 8.1.1 Institutional Framework. There are several stakeholders involved in the field of pesticides registration, regulation, research and monitoring in Egypt, including:
100
Pesticides Committee, MALR. Main body responsible for registration and testing for the efficacy of new pesticides. The committee consists of the directors of plant protection institute, central pesticides lab, cotton institute, plant disease institute, some selected professors from faculty of agriculture and national research center beside the staff of pest control from the ministry of agriculture. When a pesticide is introduced to control a target different samples are distributed among different research stations for testing on a small scale for two years .If succeeded it can go through the test on large scale if they were effective against the target under the inspection it is integrated as a candidate product for the national pest control program. Plant Protection Institute, Agriculture Research Center (ARC), MALR: It is responsible for field experiments of pesticides regarding the efficacy of the pesticides against their targets, the behavior of insects, the rearing of predators and parasites and the biological control. Plant Pathology Institute, ARC. It is responsible for the plant pathogens and nematodes studies in the lab or the field. Central Pesticide Residue and Heavy Metal Lab, ARC. Its main responsibility is monitoring the pesticide residues in food commodity either imported or exported. The two central labs are equipped with high and advanced instruments and qualified staff to analyze high quantity of samples either in water, soil biological systems or food commodity. The Central Laboratory for Environmental Quality Monitoring (CLEQM) . The Ministry of Water Resources and Irrigation has recently established and equipped with high and sophisticated instruments and is able to analyze pesticide residues in water or sediments. The problem may be the lack in the qualified and well trained staff for pesticide residue analysis. The same case is in the Ministry of Environmental Affairs. 8.1.2 IPM Policy at the Ministry of Agriculture. There is a strong policy to reduce pesticide use, as described earlier, and there has been a general decline in the volume of pesticides used since 1980’s and now only organophosphates, carbamates and pyrethroids are used on farms rather than the more persistent organochlorines which were used previously. However, there appears to be no system for recording actual use and it was not possible to obtain reliable data on actual pesticide consumption at any level. Farmers were also reluctant to discuss the issue in detail, and possibly under-reported their use. Retailers reported a sharp decline in sales of insecticide (although not of fungicides or herbicides).

101
The MALR initiated an IPM program to reduce the pesticide use in Egypt since the 1990s. The following Table (8.1) expresses the reduction of pesticides during that time.
Table (8.1): The Pesticide Consumption from 1985 to 1994 (Thousand tons)
Year 1985 1986 1987 1988 1989 1990 1991 1992 1993 1994
Pesticide consumption 27 20 17 16 16 12 8 6 6 5
Such case was stable until 1998 where the use of pheromones was replaced by the insecticides to control the pink boll worm or spiny boll worm. The MALR implemented the following measures in the pest control program:
��Severe and highly toxic pesticides were excluded from the pest control program. ��The use of pheromones as monitoring or insect control measures. ��The intensive use of mineral oils in the control program particularly on the fruit or
vegetable crops. ��The application of lower toxic minerals especially copper or sulfur in the pest
control. ��The use of botanical oils and plant extracts to reduce the pest population. Neem
oil, cotton seed oil, garlic and hot pepper extract. ��The improvement of mass rearing for different parasites and predators . ��Improvement of sprayers and equipment to reduce pesticide losses and
environmental pollution. ��The introduction of pesticides extracted from micro organisms , dispel or a grin
from Bt are as example. ��The selection of resistant varieties to a specific pest.
• Rice variety resistant to blast fungus which significantly reduce the yield is successfully grown in different areas in Egypt.
• Different varieties of cotton were selected by rearing stations and were found to tolerate the pest infestation in Egypt. Genetic Engineering Institute, MOA, is developing several varieties of different plants to resist pest infestation and proved some success in this area.
• IPM for different varieties of crops. There are many different examples for using pest resistant plants which are planned to tolerate the pest infestation. The MALR enforced the pesticides companies to include the Pre-harvest Intervals (PHIs) (the safe time required to harvest the crop a after pesticide application) when they introduce the registration file of a pesticide. The PHI of any pesticide is written on the label of pesticide container to tell the farmer the safe time for crop harvest post application of the pesticide. The Central Pesticides Lab, MALR, is currently in the process of setting PHIs for the various pesticides used on the market and for different crops under the Egyptian environment.

102
8.2 Pesticides Handling in the Project Areas. It is worth highlighting here that Pesticides application is a common agriculture practice in the command areas as revealed by consultations with the target communities. Based on a recent household survey conducted in Mahmoudia area, Basantawy canal (the majority of the farmers (68%) are not using pesticides in excessive manner while about 21% are using pesticides in excessive manner. Only about 9% of the farmers never use pesticides for agriculture uses. The farmers have several alternatives for places to dispose the pesticides’ empty containers including canal, drain, empty places and agriculture field. A large number (48%) disposes the empty containers in empty places while about 16% and 6% are using the canal and drain respectively. The empty pesticides containers have pesticides residuals that are often considered toxic. Disposing the empty containers in the canal or drain is damaging to the environment and causing a health risk to users of the canal or drain water. Moreover, the pesticides are accumulative in the food chain (example: Fish production from the canal or the drain, irrigated crops). Such consumption and disposal patterns may potentially negatively affect the water quality in the drainage and canal system (ultimately impacting drinking water if the drainage water is re-used in fresh water channels), lead to bio-accumulation of heavy metals and toxins in fish (as in-land fisheries are abundantly existing and rely on drainage water), and pose a direct health hazard to humans directly via exposure the pesticides and their containers or in-directly through consuming the fish and crops. The range of common pesticides (herbicides, insecticides, and fungicides) used in Egypt is summarized in Table 8.2 The pesticides used by farmers in the study area are summarized in Table 4.8. Herbicides are the most widely used (by 13 out of 15 farmers) and were applied to wheat and berseem to control weeds. This was closely followed by insecticides which were used (9 examples of application) to control pests in cotton, moonflower, onion, maize and guinea corn. Finally, fungicides were used to control disease outbreaks in maize and guinea corn.
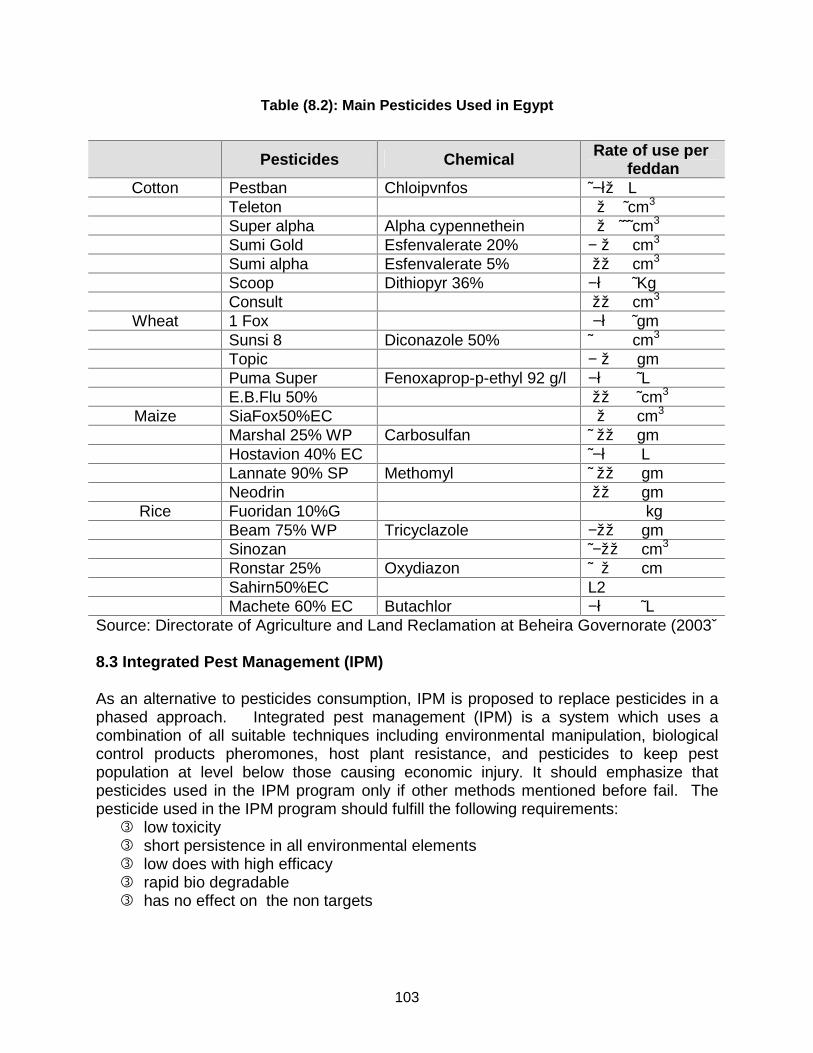
103
Table (8.2): Main Pesticides Used in Egypt
Pesticides Chemical Rate of use per feddan
Cotton Pestban Chloipvnfos −łž˜ L Teleton � � ž ˜cm3 Super alpha Alpha cypennethein � � ž ˜̃ ˜cm3 Sumi Gold Esfenvalerate 20% −� ž cm3 Sumi alpha Esfenvalerate 5% � žž cm3 Scoop Dithiopyr 36% −ł� ˜Kg Consult � žž cm3
Wheat 1 Fox � −ł� ˜gm Sunsi 8 Diconazole 50% � �˜ cm3 Topic −� ž gm Puma Super Fenoxaprop-p-ethyl 92 g/l −ł� � ˜L E.B.Flu 50% � žž ˜cm3
Maize SiaFox50%EC � � ž cm3 Marshal 25% WP Carbosulfan � žž˜ gm Hostavion 40% EC −ł� �˜ L Lannate 90% SP Methomyl � žž˜ gm Neodrin � žž gm
Rice Fuoridan 10%G � kg Beam 75% WP Tricyclazole −žž gm Sinozan −žž˜ cm3 Ronstar 25% Oxydiazon � � ž˜ cm� Sahirn50%EC L2 Machete 60% EC Butachlor −ł� ˜L
Source: Directorate of Agriculture and Land Reclamation at Beheira Governorate (2003ˇ 8.3 Integrated Pest Management (IPM) As an alternative to pesticides consumption, IPM is proposed to replace pesticides in a phased approach. Integrated pest management (IPM) is a system which uses a combination of all suitable techniques including environmental manipulation, biological control products pheromones, host plant resistance, and pesticides to keep pest population at level below those causing economic injury. It should emphasize that pesticides used in the IPM program only if other methods mentioned before fail. The pesticide used in the IPM program should fulfill the following requirements:
��low toxicity ��short persistence in all environmental elements ��low does with high efficacy ��rapid bio degradable ��has no effect on the non targets
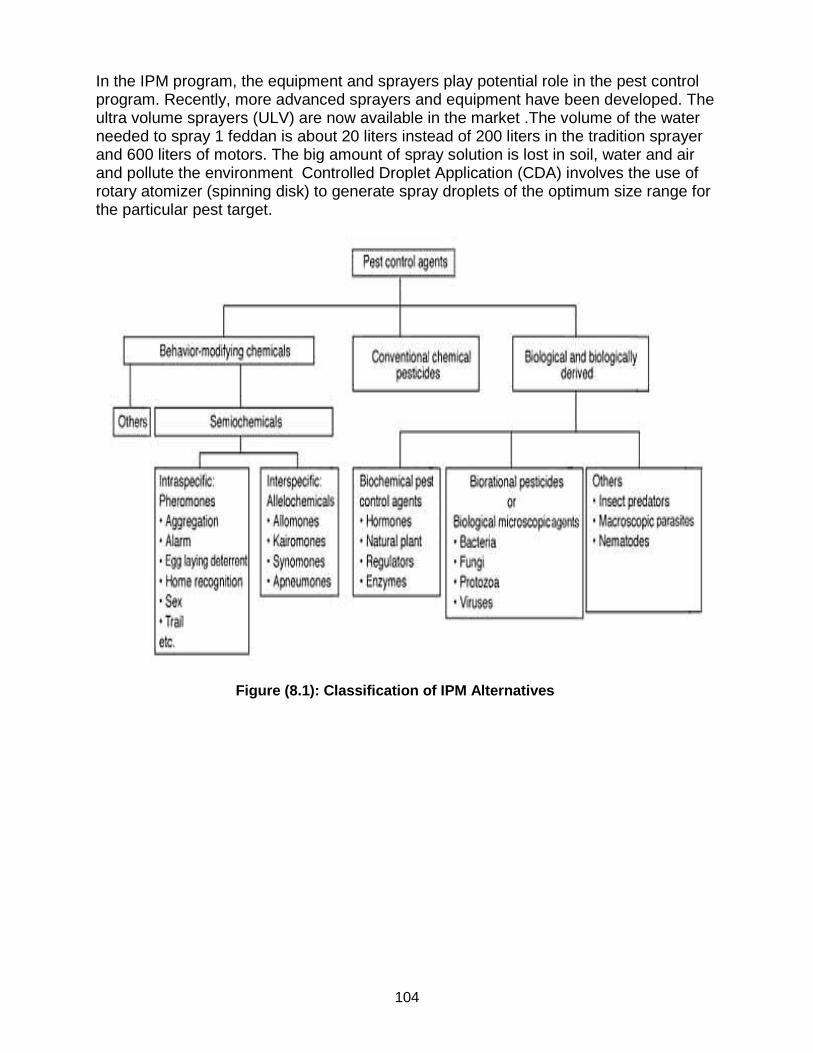
104
In the IPM program, the equipment and sprayers play potential role in the pest control program. Recently, more advanced sprayers and equipment have been developed. The ultra volume sprayers (ULV) are now available in the market .The volume of the water needed to spray 1 feddan is about 20 liters instead of 200 liters in the tradition sprayer and 600 liters of motors. The big amount of spray solution is lost in soil, water and air and pollute the environment Controlled Droplet Application (CDA) involves the use of rotary atomizer (spinning disk) to generate spray droplets of the optimum size range for the particular pest target.
Figure (8.1): Classification of IPM Alternatives

105
ANNEX (1): Scope of Work for the EIA and EMP of Egypt FIMP
Given the past and ongoing studies prepared for Egypt IIIMP in general and for its W-10 pilot area in particular (which are highly relevant for FIMP), a detailed EA/EMP (hence a detailed TOR for the EA/EMP) will not be needed. For purposes of OP/BP 4.01 on “Environmental Assessment”, the FIMP has been classified as Category B, given that no significant, irreversible or long-term adverse environmental impacts are anticipated and that any identified adverse impacts can be effectively addressed through appropriate preventive actions or mitigation measures. These and other environmental issues will be thoroughly examined by a fast-tracked environmental impact assessment (EIA) and will be addressed in the environmental management plan (EMP), both to be conducted by SWERI, and will both build on existing work from IIIMP. The EIA will primarily focus on:
a) Priority 1: The baseline water-quality-parameter concentrations that may increase due to the project. This would focus on the key diffuse pollutants (resulting from agricultural pesticides and fertilizers) in the following: (A) the soil, (B) the ambient canal and drain water, and (C) the sludge accumulating at the bottom of the canals/drains (to give a sense of the quality of the substrate). In addition to providing these baseline concentrations and comparing them with the permissible standards, the study should also attempt to make indicative estimates of the likely increase (if any) in these concentrations, after implementing the project.
b) Priority 2: The likely positive impacts on water and soil quality (being one of several intermediary outcomes expected from the project).
The EMP will:
c) Address the environmental impacts identified by the EIA through a combination of preventive and mitigation measures, including environmental monitoring/benchmarking and institutional capacity building.
d) Spell out the needed EMB budget (operating costs, goods/equipments, and consultancies).
e) Spell out the EMP “responsibilities matrix”. SWERI will house the “Environmental Management Unit” entrusted with EMP monitoring/benchmarking, inter-agency coordination, and technical advice. Whereas, the day-to-day management of the EMP prevention and mitigation activities will be a shared responsibility between EALIP/MALR, SWERI, and MWRI, each per its mandate, as spelled out in the EMP responsibilities matrix.
Both the EIA and EMP will attempt to follow the MENA guidelines for preparing a good-practice EA/EMP for irrigation and drainage projects.
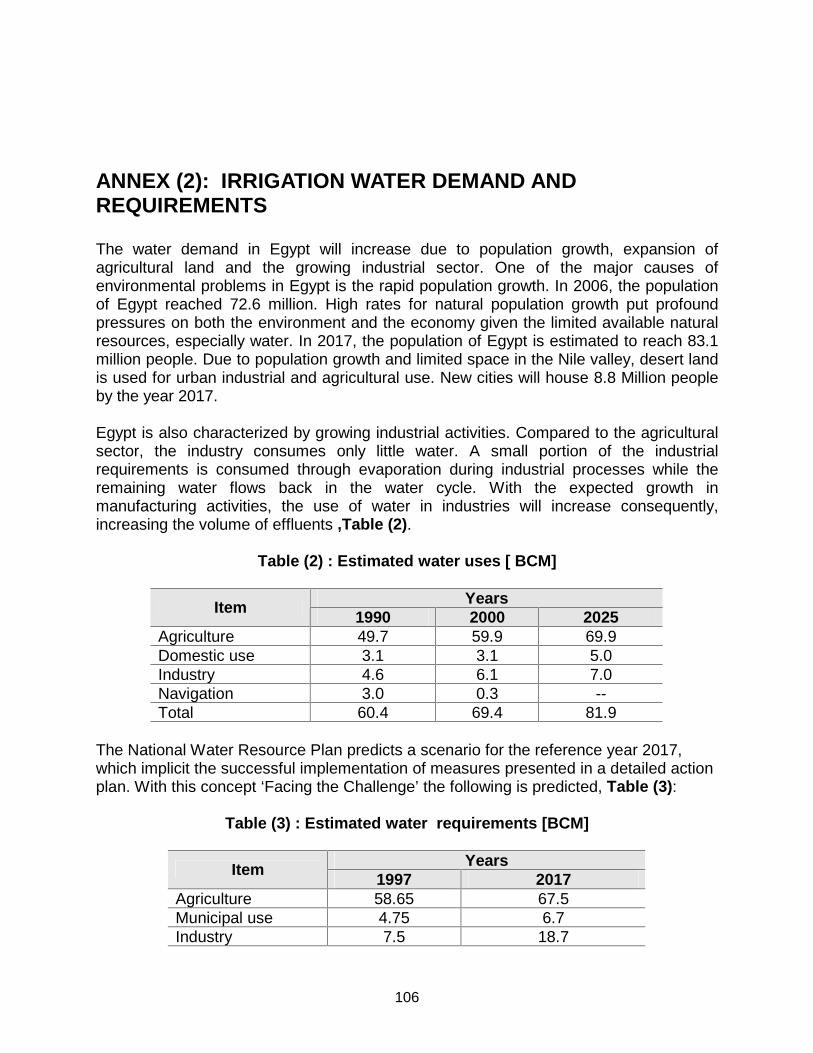
106
ANNEX (2): IRRIGATION WATER DEMAND AND REQUIREMENTS The water demand in Egypt will increase due to population growth, expansion of agricultural land and the growing industrial sector. One of the major causes of environmental problems in Egypt is the rapid population growth. In 2006, the population of Egypt reached 72.6 million. High rates for natural population growth put profound pressures on both the environment and the economy given the limited available natural resources, especially water. In 2017, the population of Egypt is estimated to reach 83.1 million people. Due to population growth and limited space in the Nile valley, desert land is used for urban industrial and agricultural use. New cities will house 8.8 Million people by the year 2017. Egypt is also characterized by growing industrial activities. Compared to the agricultural sector, the industry consumes only little water. A small portion of the industrial requirements is consumed through evaporation during industrial processes while the remaining water flows back in the water cycle. With the expected growth in manufacturing activities, the use of water in industries will increase consequently, increasing the volume of effluents ,Table (2) .
Table (2) : Estimated water uses [ BCM]
Years Item 1990 2000 2025
Agriculture 49.7 59.9 69.9 Domestic use 3.1 3.1 5.0 Industry 4.6 6.1 7.0 Navigation 3.0 0.3 -- Total 60.4 69.4 81.9
The National Water Resource Plan predicts a scenario for the reference year 2017, which implicit the successful implementation of measures presented in a detailed action plan. With this concept ‘Facing the Challenge’ the following is predicted, Table (3) :
Table (3) : Estimated water requirements [BCM]
Years Item 1997 2017
Agriculture 58.65 67.5 Municipal use 4.75 6.7 Industry 7.5 18.7
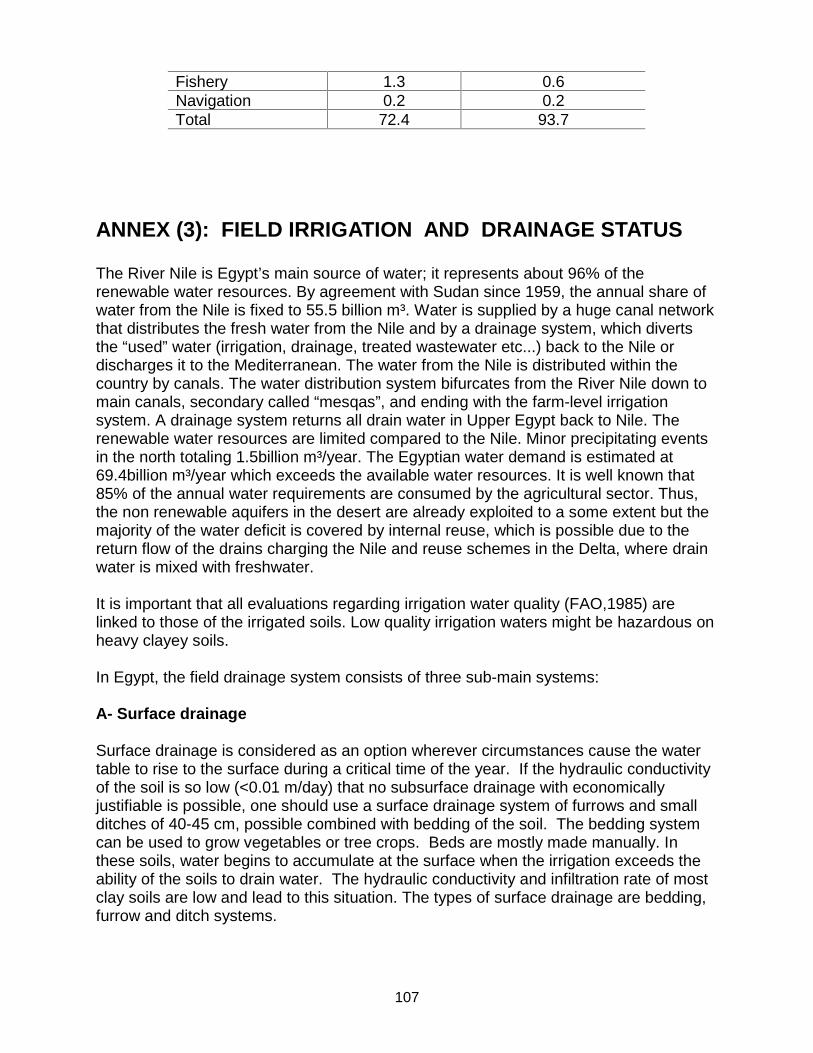
107
Fishery 1.3 0.6 Navigation 0.2 0.2
Total 72.4 93.7
ANNEX (3): FIELD IRRIGATION AND DRAINAGE STATUS The River Nile is Egypt’s main source of water; it represents about 96% of the renewable water resources. By agreement with Sudan since 1959, the annual share of water from the Nile is fixed to 55.5 billion m³. Water is supplied by a huge canal network that distributes the fresh water from the Nile and by a drainage system, which diverts the “used” water (irrigation, drainage, treated wastewater etc...) back to the Nile or discharges it to the Mediterranean. The water from the Nile is distributed within the country by canals. The water distribution system bifurcates from the River Nile down to main canals, secondary called “mesqas”, and ending with the farm-level irrigation system. A drainage system returns all drain water in Upper Egypt back to Nile. The renewable water resources are limited compared to the Nile. Minor precipitating events in the north totaling 1.5billion m³/year. The Egyptian water demand is estimated at 69.4billion m³/year which exceeds the available water resources. It is well known that 85% of the annual water requirements are consumed by the agricultural sector. Thus, the non renewable aquifers in the desert are already exploited to a some extent but the majority of the water deficit is covered by internal reuse, which is possible due to the return flow of the drains charging the Nile and reuse schemes in the Delta, where drain water is mixed with freshwater. It is important that all evaluations regarding irrigation water quality (FAO,1985) are linked to those of the irrigated soils. Low quality irrigation waters might be hazardous on heavy clayey soils. In Egypt, the field drainage system consists of three sub-main systems: A- Surface drainage Surface drainage is considered as an option wherever circumstances cause the water table to rise to the surface during a critical time of the year. If the hydraulic conductivity of the soil is so low (<0.01 m/day) that no subsurface drainage with economically justifiable is possible, one should use a surface drainage system of furrows and small ditches of 40-45 cm, possible combined with bedding of the soil. The bedding system can be used to grow vegetables or tree crops. Beds are mostly made manually. In these soils, water begins to accumulate at the surface when the irrigation exceeds the ability of the soils to drain water. The hydraulic conductivity and infiltration rate of most clay soils are low and lead to this situation. The types of surface drainage are bedding, furrow and ditch systems.

108
B- Subsurface drainage Subsurface drainage is usually based upon system of buried perforated pipes that control the ground water level. Buried pipes have the advantage of not hindering mechanized farming. Further they require less maintenance than open ditches and do not lead to loss of land. When the hydraulic conductivity is more than 0.1 m/day, the soils are highly responsive to conventional pipe drainage. The major problem of pipe drainage of heavy clay soils with hydraulic conductivity less than 0.1 m/day is that, to be effective, the spacing usually needs to be narrow, which may be uneconomic. In practice, the spacing varies between 10 and 20m in heavy clay soils of medium hydraulic conductivity (>0.1 m/day). If the soil layer has high hydraulic conductivity at depth (>2m) and the top layer is of very law hydraulic conductivity, the drainage problem could be solved by vertical drainage. C- Mole drainage Mole drain is the construction of an underground channel without digging a trench and without using tubes. Mole drainage is unlined circular soil channels, which function like pipe drains. It is used mainly in soils with dense, impervious, fine textured subsoil in undulating areas. The problem is not the control of a ground water table (which may be very deep), but the removal of excess water from the field surface or from the top soil. Therefore, mole drain can be considered as an intermediate system between surface and subsurface drainage. Mole system combined with open field drains can be highly recommended as an auxiliary drainage treatment in low level clay salty soils with a saline water table to raise soil productivity.