contentsazgard9.com/pdfs/anl ar 2013.pdf · 2014-03-06 · askari bank limited barclays bank...
TRANSCRIPT

Vision and Mission 04
05
06
08
15
16
20
22
24
25
26
27
28
29
86
88
90
91
92
93
154
159
89
Contents
The Origins and Inception
Company Information
Directors’ Report to the Shareholders
Financial highlights
Notice of annual General Meeting
18Statement of Compliance with Code of Corporate Governance
Auditors’ report to the members
Financial Statements
Consolidated Financial Statements
Review report to the members on statement of compliance with
best practices of Code of Corporate Governance
Balance Sheet
Profit and Loss Account
Statement of Other Comprehensive Income
Cash Flow Statement
Statement of Changes in Equity
Notes to the Financial Statements
Auditors’ report to the members
Consolidated Balance Sheet
Consolidated Profit and Loss Account
Consolidated Statement of Other Comprehensive Income
Consolidated Cash Flow Statement
Consolidated Statement of Changes in Equity
Notes to the Consolidated Financial Statements
Pattern of shareholding
Form of Proxy


Vision
To become a majorregional global
Fashion ApparelCompany
Mission
To retain a leadershipposition as the largest
value added denimproducts Company in
Pakistan

Azgard 9 in the ancient legend “Azgard” was one of nine worlds in NorseMythology; it was protected by “Heimdall” the son of nine different
mothers each attributing him with a particular skill and power and thus hewould protect Azgard from the powers that be.
The significance of nine for our company is not just based on thismythology but also connected with the auspicious nature of this numberthroughout many different elements in and out of the world today that
affect humans and their behaviours. The number nine is considered to bean auspicious and important number in Indian, Chinese, Japanese and
Greek cultures for various different reasons.
In Chinese culture the number nine represents ‘Change’ and‘Transformation’, as is the case with Azgard Nine which is changing and
transforming itself into an entity with new goals, aspirations and targets.Nine in much of ancient Greek mythology also has represented gestation
and fulfilment of creation as it does for us at Azgard Nine the ‘Fulfilment ofcreation’ for us being the forming of this global entity by nine members
on the ninth day of February sowing the seeds for an auspicious andrewarding future.
The Origins and Inception
BOARD OF DIRECTORS
COMPANY SECRETARY
CHIEF FINANCIAL OFFICER
AUDIT COMMITTEE
Mr. Aehsun M.H. Shaikh
Mr. Muhammad Ijaz Haider
Mr. Zahid Rafiq, FCA
Mr. Nasir Ali Khan BhattiChairman
Mr. Aehsun M.H. Shaikh
Mr. Naseer Miyan
Chairman
Mr. Ahmed H. ShaikhChief Executive
Mr. Nasir Ali Khan Bhatti
Mr. Usman Rasheed
Mr. Naseer Miyan
Mr. Yasir Habib Hashmi
Mr. Munir Alam
Company Information
HR & REMUNERATION COMMITTEE
BANKERS
Mr. Nasir Ali Khan BhattiChairman
Mr. Ahmed H. Shaikh
Mr. Aehsun M.H. Shaikh
JS Bank Limited
MCB Bank Limited
Citibank N.A
Faysal Bank Limited
Habib Bank Limited
HSBC Bank Middle East Limited
United Bank Limited
Standard Chartered Bank (Pakistan) Limited
NIB Bank Limited
National Bank of Pakistan
Allied Bank Limited
KASB Bank Limited
Silk Bank Limited
Summit Bank Limited
Al Baraka Bank Pakistan Limited

REGISTERED OFFICE
PROJECT LOCATIONS
Ismail Aiwan-e-ScienceOff Shahrah-e-Roomi Lahore, 54600.Ph: +92(0)42 111-786-645Fax: +92(0)42 35761791
2.5 KM off Manga, Raiwind Road,District Kasur.Ph: +92(0)42 5384081Fax: +92(0)42 5384093
Alipur Road, Muzaffaragarh.Ph: +92(0)661 422503, 422651Fax: +92(0)661 422652
20 KM off Ferozepur Road,6 KM Badian Road on Ruhi Nala,Der Khurd, Lahore.Ph: +92(0)42 38460333, 38488862
Unit I
Unit II
Unit III
Bankers (Cont’d)
Askari Bank Limited
Barclays Bank Limited
Bank Al Habib Limited
Bank Al Falah Limited
Bank Islamic Pakistan
Habib Metropolitan Bank
Bank of Khyber
Hameed Majeed Associates (Private) Limited.H.M. House, 7-Bank Square, Lahore.Ph: +92(0)42 37235081-82Fax: +92(0)42 37358817
Hamid Law Associates
KPMG Taseer Hadi & Co.Chartered Accountants
SHARES REGISTRAR
LEGAL ADVISORS
AUDITORS
WEB PRESENCE
www.azgard9.com

Directors' Report to the Shareholders
Azgard Nine Limited08
The Directors of Azgard Nine Limited ("the Company") along with the managementteam hereby present the Company's Annual Report accompanied by the Audited
Financial Statements for the year ended 30 June 2013.
Financial statements have been endorsed by the Chief Executive Officer and the ChiefFinancial Officer in accordance with the Code of Corporate Governance, having been
recommended for approval by the Audit Committee of the Board and approved by theBoard of Directors for presentation.
The main business of your Company is the production and marketing of Denim focused Textile and Apparel products,ranging from raw cotton to retail ready goods. During the year under review, Azgard Nine Limited maintained its positionas one of the largest denim products Company by sales in Pakistan.
During the year, the Company divested the majority of its shareholding in M/s Agritech Limited ("AGL"). AGL was asubsidiary of the Company till 31 October 2012. Therefore, the results of AGL till 31 October 2012 have been consolidatedin the profit and loss account of the Company.
Principal Activities
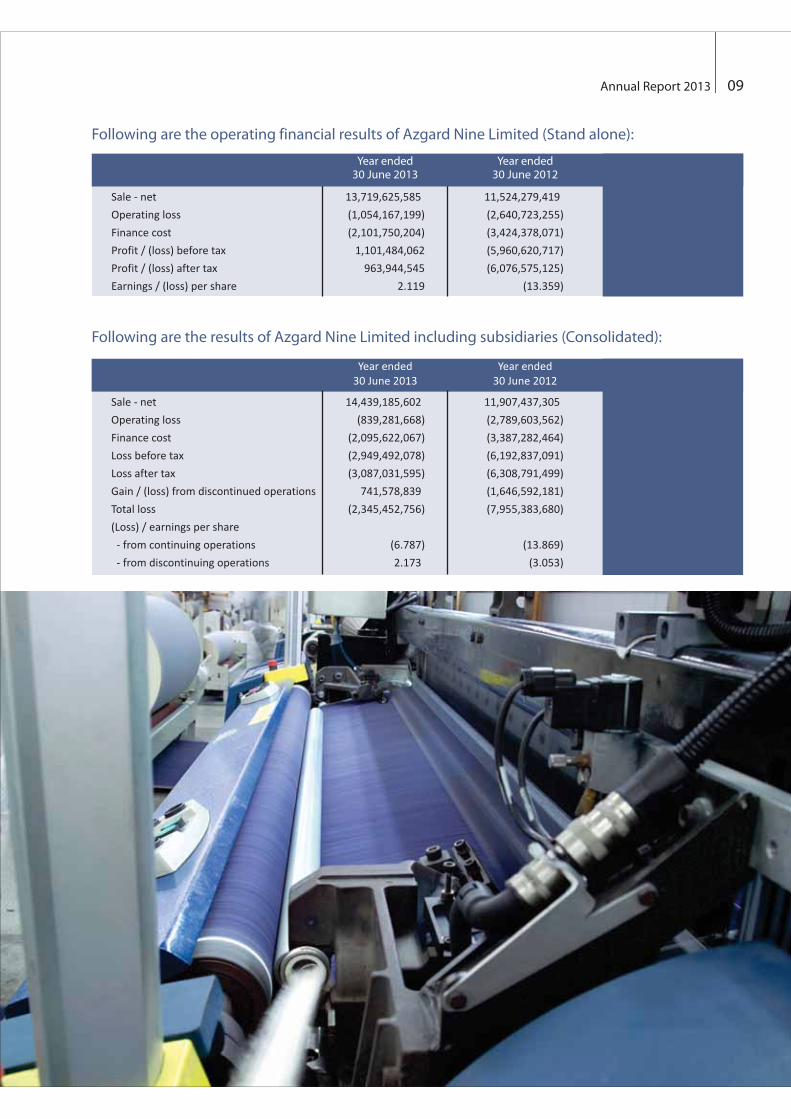
Following are the operating financial results of Azgard Nine Limited (Stand alone):
Following are the results of Azgard Nine Limited including subsidiaries (Consolidated):
Year ended
30 June 2012
Sale - net
Operating loss
Finance cost
Loss before tax
Loss after tax
Gain / (loss) from discontinued operations
Total loss
(Loss) / earnings per share
- from continuing operations
- from discontinuing operations
11,907,437,305
(2,789,603,562)
(3,387,282,464)
(6,192,837,091)
(6,308,791,499)
(1,646,592,181)
(7,955,383,680)
(13.869)
(3.053)
Year ended30 June 2012
Sale - net
Operating loss
Finance cost
Profit / (loss) before tax
Profit / (loss) after tax
Earnings / (loss) per share
11,524,279,419
(2,640,723,255)
(3,424,378,071)
(5,960,620,717)
(6,076,575,125)
(13.359)
Year ended30 June 2013
13,719,625,585
(1,054,167,199)
(2,101,750,204)
1,101,484,062
963,944,545
2.119
Year ended
30 June 2013
14,439,185,602
(839,281,668)
(2,095,622,067)
(2,949,492,078)
(3,087,031,595)
741,578,839
(2,345,452,756)
(6.787)
2.173
Annual Report 2013 09

Azgard Nine Limited10
Review of Textiles and Apparel Businessduring the year
During the year, the Company continued to be in the gripof challenges at home as well as abroad. The highestpower outages to date were coupled with ongoingfinancial impediments.This prevented the Company fromachieving optimum utilization of production capacity.
The Company was supposed to receive Rs. 926.82 millionfor working capital purposes as part of the agreementthrough which the holding in AGL was disposed off.However, Rs. 700.00 million from the above mentionedamount did not materialize in spite of the Companyfulfilling its entire obligations as per the agreement. Thelack of these funds prevented the Company fromachieving optimum capacities as these funds were to beused for working capital purposes. This was all due to onebank not acting in accordance with the agreement.
Additionally, it took longer to reach a final agreementregarding restructuring of the financial debts of theCompany. Therefore, the Company had to continue tooperate at sub-optimum capacities and continue topurchase raw materials with delays and at high rates.
The Company had to operate in these conditions in anincreasingly competitive global textile market at a timewhen local cost of operations also increased due to utilitycosts and inflationary pressures. The year in review alsowitnessed the highest ever outages regarding availabilityof power and gas. This also had a negative effect on theoperations of the Company. The Company is working on asubstantial cost cutting program in an order to improveits performance and meet the challenges of the globalmarket place.
At the same time the Company is also focusing on astrategy to consolidate its customer base, rationalize
production volumes and increase pricing in order toimprove its margins and efficiencies.
During the year, the Company settled its lender liabilitiesand sale related expenses by Rs. 10,043 million throughsale of its subsidiary AGL.
This had the following impacts on the Company:
1. Settlement of liabilities of the Company by Rs. 9,742million. After settlement of these liabilities, theremaining debt levels are now at a sustainable level,provided the Company can run at optimum capacitiesand procure raw materials in a timely and costeffectively manner.
2. Decrease in financial cost by approximate 60% perannum by Rs. 1.5 billion.
It was planned that 100% of the Company's shareholdingin AGL would be divested. Against this the Companywould receive Rs. 926.82 million for working capital inorder to increase operating capacity to the sustainablelevels. However, during the year the Company receivedonly Rs. 226.82 million as 20 million shares out of totalnumber of shares to be sold were not de -pledged/released by Dubai Islamic Bank Pakistan Limited(DIBPL). Your Company has filed a civil suit against DIBPLfor not releasing these 20 million shares.
Considering the financial position of the Company andthe "stuck up" Rs. 700 million which was supposed to bereceived from the sale of these remaining 20 millionshares in AGL, the management has initiated 2ndrestructuring process. For this restructuring the Companywould sell certain assets (because of non availability ofworking capital). Proceeds from divestment of remainingshareholding of AGL and sale of these assets would beutilized for settlement of loans of the Company.Negotiations for finalization of this restructuring are inprocess with lenders.
Restructuring of Debts

Azgard Nine Limited12
�
�
�
�
�
�
�
�
�
�
�
�
�
�
Proper books of accounts of the Company have beenmaintained;
Appropriate accounting policies have beenconsistently applied in the preparation of financialstatements and accounting estimates are based onreasonable and prudent judgment;
International Financial Reporting Standards, asapplicable in Pakistan, have been followed in thepreparation of financial statements and anydeparture therefrom has been adequately disclosedand explained.
The system of internal control is sound in design andhas been effectively implemented and monitored.
The Board is satisfied that the Company is performingwell as going concern under the Code of CorporateGovernance.
There has been no material departure from the bestpractices of corporate governance as detailed in thelisting regulations of the stock exchanges.
Key operating and financial data for the last six years isannexed.
There are no statutory payments on account of taxes,duties, levies, and charges which are outstanding ason 30 June 2013 except for those disclosed in thefinancial statements.
The value of provident fund investment as at 30 June2013 was Rs. 22.02 million.
No material changes and commitments affecting thefinancial position of the Company have occurredbetween the end of the financial year to which thisbalance sheet relates and the date of the Director'sReport.
There is a material uncertainty about Company'sability to continue as a going concern; however thesefinancial statements have been prepared on goingconcern assumption for reasons more fully disclosedin the financial statements.
The detail of trading in shares of the Company if anycarried out by the Directors, CEO, CFO and CompanySecretary and their spouses and minor children isprovided in pattern of shareholding annexed with thisreport.
Company has arranged in-house training program forits Directors.
The statement of compliance with the best practicesof code of corporate governance is provided in thisannual report.
Subsequent to the 2nd restructuring and other proposedmeasures mentioned above, the management of theCompany envisages that sufficient financial resources willbe available for the continuing operations of theCompany.
The Company's Management in order to offset themassive effect of increased power cost has worked hardon development of higher margin product mix, inaccordance with customer demands in order to increasethe contribution margins.
The Management is conscious of the issues that areaffecting profitability and is committed to turn aroundthe affairs of the Company through 2nd restructuring, thedevelopment of an improved product mix and costcutting.
Your Company is a responsible corporate citizen and fullyrecognizes its responsibility towards community,employees and environment.
During the period of 4 months ended 31 October 2012,the business of AGL continued to be effected by the gasload shedding , as a result of which AGL reported loss forthe four months period ended 31 October 2012 whichhave been consolidated.
The earnings per share for the Company for the yearended 30 June 2013 was Rs 2.119 per share.
Due to circumstances discussed above, the Board ofDirectors does not recommend dividend for the yearended 30 June 2013.
As required by the Code of Corporate Governance, thedirectors are pleased to report that:
The financial statements prepared by themanagement of the Company present its state ofaffairs fairly, the result of its operations, cash flows andchanges in equity;
Future Outlook -Textile Business
Corporate Social Responsibility
Review of Fertilizer Business during theholding period of 4 months ended 31October 2012
Earnings per share
Dividends
Corporate governance & financial reportingframework
�

Board of Directors
The Board of directors of the Company is predominantlyindependent which ensures transparency and goodcorporate governance The Board comprises oneindependent director two non executive directorsincluding the Chairman and four executive directors(including the Chief Executive Officer). The Non executivedirectors bring to the Company their vast experience ofbusiness, government and law, contributing valuableinput and ensuring the Company's operations at a highstandard of the principles of legal and corporatecompliance.
During the period under review, four meetings of theBoard of Directors held and the attendance by eachdirector is as follows:
Annual Report 2013 13
2 0 Resigned
-
-
-
-
-
-
Resigned
Resigned
2 0
4 4
4 4
3 3
1 0
4 4
4 3
Mr. Khalid A. H. Al-Sagar
Mr. Ahmed H. Shaikh
Mr. Aehsun M. H. Shaikh
Mr. Irfan Nazir Ahmad
Mr. Aamer Ghias
Mr. Usman Rasheed
Mr. Naseer Miyan
Mr. Humayun N. Shaikh(Alternate Director forMr. Khalid A.H Al-Sagar)
Eligibility Attendance RemarksName of Directors
3 3
2 2
1 1
Appointedin place ofMr. AamerGhias
Appointedin place ofMr. KhalidA.H. Al-Sagar
Appointedin place ofMr. IrfanNazirAhmad
Mr. Nasir Ali Khan Bhatti
Mr. Imran Maqbool
Mr. Imtiaz Ali Bhatti
2 0 Resigned
2 0 -
-
-
Mr. Khalid A. H. Al-Sagar
4 4Mr. Aehsun M. H. Shaikh
4 3Mr. Naseer Miyan
Mr. Humayun N. Shaikh(Alternate Director forMr. Khalid A.H Al-Sagar)
Eligibility Attendance RemarksName of Directors
2 2 Appointedin place ofMr. KhalidA.H. Al-Sagar
Mr. Nasir Ali Khan Bhatti
AUDIT COMMITTEE MEETING
Resigned
1
1
0
Mr. Ahmed H. Shaikh
Mr. Aehsun M. H. Shaikh
Mr. Irfan Nazir Ahmad
1 Appointed in placeof Irfan Nazir Ahmad
Mr. Nasir Ali Khan Bhatti
Attendance RemarksName of Directors
HR & REMUNERATION COMMITTEE MEETING
Leaves of absence were granted to Directorswho could not attend the respectivemeetings.
Auditors' observations
Consolidated financial statements
Consolidated financial statements of the Companytogether with its subsidiary companies Montebello S.R.Land AGL are also included. AGL has been consolidated tillholding period that ended 31 October 2012.
The auditors qualified their opinion in both standaloneand consolidated report due to the fact that the Companycould not make timely repayments of principal andinterest / mark-up related to long term loans and certainfinancial and other covenants imposed by lenders couldnot be complied with. In this scenario, InternationalAccounting Standard 1 - Presentation of FinancialStatements requires that if an entity breaches a provisionof long term loan, that liability becomes payable ondemand and it should be classified as current. However, inour financial statements the long term debts continues tobe classified as long term as per respective repaymentschedule of loans.
In this regard, the lenders have continued to show theirconfidence in our diversified business and experiencedmanagement to gradually improve the financialperformance and did not call the loans. Auditorsobservation in their standalone and consolidated auditreport regarding Company's ability to continue as goingconcern due to liquidity issue, the Company asmentioned above is in process of second restructuringwith completion of which portion of loans would besettled and remaining loans would get regularized.
The auditors have qualified their report on consolidatedfinancial statements due to the fact that results of AGL forfour months period have been consolidated on pro-rated

based on six months reviewed financial information ofAGL. A change in results of AGL will alter non-controllinginterest, the gain on disposal of AGL, and cash flowstatement, however, such change will not have an impacton the loss for the year attributable to ordinary equityholders of the Holding Company.
Messers KPMG Taseer Hadi & Co, Chartered Accountants,member firm of KPMG International, a reputableChartered Accountants firm completed its tenure ofappointment with the Company and being eligible hasoffered its services for another term.
The Board of Directors constituted a fully functional AuditCommittee comprising three members of whom two areNon Executive Directors and one Independent Director.The terms of reference of the committee, inter alia, consistof ensuring transparent internal audits, accounting andcontrol systems, reporting structure auditors as well asdetermining appropriate measures to safeguard theCompany's assets.
The Board set up an efficient and energetic internalcontrol system with operational, financial andcompliance controls to carry on the businesses of theCompany. Internal audit findings are reviewed by theAudit Committee, and where necessary, action is taken onthe basis of recommendations contained in the internalaudit reports.
Appointment of Auditors
Audit committee
Internal audit function
Shareholding pattern
Web presence
Acknowledgment
The shareholding pattern as at 30 June 2013 including theinformation under the Code of Corporate Governance forordinary shares is annexed.
Annual and periodic financial statements of the Companyare also available on the Azgard Nine websitewww.azgard9.com for information of the shareholdersand others.
The Board takes this opportunity to thank the Company'svalued customers and the financial institutions for theircorporation and support. The Board greatly appreciateshard work and dedication of all the employees of theCompany.
Azgard Nine Limited14
30 September 2013
On behalf of the Board of Directors
Chief Executive Officer
Annual Report 2013 15
Notice of Annual General Meeting
30 September 2013Lahore
By Order of the Board
(Muhammad Ijaz Haider)Company Secretary
Notice is hereby given that the 20 Annual GeneralMeeting of AZGARD NINE LIMITED (the "Company") willbe held on Thursday, October 31, 2013 at 11.00 A.M at theRegistered Office of the Company Ismail Aiwan-i-Science,Off Shahrah-i-Roomi, Lahore to transact the followingbusiness:
1. To confirm the minutes of the last Annual GeneralMeeting held on August 25, 2012;
2. To receive, consider and adopt the financialstatements for the year ended June 30, 2013 togetherwith Directors' and Auditors' Reports thereon;
3. To consider re-appointment of M/s KPMGTaseer Hadi& Co., Chartered Accountants as external auditors forthe financial year ending June 30, 2014 and to fix theirremuneration, as per the recommendation of theBoard;
4. To discuss any other business that may be broughtforward with the permission of the chair.
th
NOTES:
1. The share transfer books of the Company will remain closedfrom October 24, 2013 to October 31, 2013. (both daysinclusive).
2. The Preference Shareholders are not entitled to attend themeeting.
3. A member entitled to attend and vote at the meeting mayappoint another member as his/her proxy to attend andvote on his/her place. Proxies, complete in every respect, inorder to be effective, must be received at the RegisteredOffice of the Company not less than forty eight (48) hours
before the time of the meeting.
4. Members who have not yet submitted photocopy ofcomputerized national Identity Card (CNIC) to theCompany are requested to send the same at the earliest.
5. CDC Account Holders will further have to follow the undermentioned guidelines as laid down by the Securities andExchange Commission of Pakistan.
A. FOR ATTENDINGTHE MEETING:
I. In case of individuals, the account holders and/or sub-account holder and their registration details are uploadedas per the CDC Regulations, shall authenticate his/heridentity by showing his original CNIC or Passport at thetime of attending the Meeting.
ii. In case of corporate entity, the Board of Directors'resolution / power of attorney with specimen signature ofthe nominee shall be produced (unless it has beenprovided earlier) at the time of the Meeting.
B. FOR APPOINTING PROXIES:
i. In case of individuals, the account holders and/or sub-account holder and their registration details are uploadedas per the CDC Regulations, shall submit the proxy form asper the above requirements.
ii. The proxy form shall be witnessed by two persons whosenames, addresses and CNIC numbers shall be mentionedon the form.
iii. Attested copies of CNIC or the passport of the beneficialowner and the proxy shall be furnished with the proxyform.
iv. In case of corporate entity, the Board of Directors'resolution/power of attorney with specimen signatureshall be submitted (unless it has been provided earlier)along with proxy form to the Company.
Share holders are requested to notify any change in theiraddresses immediately to Company's Shares Registrar M/sHameed Majeed Associates (Pvt.) Ltd. H. M. House, 7 BankSquare, Lahore.

Financial HighlightsSix years at a glance
Azgard Nine Limited16
Azgard Nine Limited
Year ended 31 December
*(excluding current portion of long term debt)
Operating performance (Rs. 000)
Sales-net
Export Sales-Gross
Local Sales-Gorss
Gross profit/
Operating (loss)/profit
Profit/(loss) before tax
Loss after tax
(loss)
Total Equity
Surplus on revaluation of property,
plant and equipment
Long term debt
Property, plant and equipment
Financial position (Rs. 000)
Operating (loss)/profit to sales (%)
Earning/ per share (Rs.)(Loss)
Profitability analysis
Eighteenmonths endedJune 30 2011
17,602,765
14,469,060
2,859,903
112,273
(530,541)
(4,528,951)
(4,702,240)
10,269,064
3,724,870
8,468,567
13,843,422
1.48
38:62
(3.01)
(10.403)
Year ended30 June 2012
Year ended30 June 2013
2009
11,737,857
10,017,267
1,725,461
3,191,493
2,616,317
178,723
60,531
14,500,553
3,969,152
7,080,736
14,069,896
0.82
33:67
22.29
0.003
10,125,083
219,356
8,189,851
8,687,157
2008
10,113,499
8,222,024
1,966,476
3,453,276
3,622,166
999,503
897,284
1.25
45:55
35.82
2.120
9,720,054
239,073
8,460,143
7,811,638
6,628,342
5,430,603
1,262,415
2,007,353
1,572,168
1,151,460
1,079,453
2007
1.79
47:53
23.72
3.260
Current ratio
Debt to equity ratio
Financial analysis
11,524,279
9,823,943
1,771,498
(1,118,047)
(2,536,243)
(5,960,621)
(6,076,575)
4,471,164
3,596,276
11,512,029
13,399,121
1.27
59:41
(22.91)
(13.359)
13,719,626
11,715,767
2,038,185
461,580
(1,054,167)
1,101,484
963,945
1,262,286
3,470,587
7,830,878
12,953,017
0.67
62:38
(7.68)
2.119

Current ratio*
Debt to equity ratio
Financial analysis
0.98
68:32
1.19
55:45
0.98
63:37
0.74
64:36 53:47
1.16 0.60
65:35
- - - -
Operating (loss) / profit to sales (%)
(Loss) / earnings per share - continuing operations
Earnings / (loss) per share - discontinued operations
Profitability analysis
30.47
3.385
30.32
4.4603.351
23.74(5.81)
(6.787)
2.173
(23.43)
(13.869)
(3.053)
4.85
(9.441)
Operating performance (Rs. 000)
Sales - net
Export sales - gross
Local sales - gorss
Gross (loss) / profit
Operating (loss) / profit
Loss before tax
Loss after tax
Gain / (loss) from discontinued operations
Total (loss) / profit
Consolidated
Year ended 31 December
8,238,448
11,724,806
6,822,906
6,013,480
1,629,430
1,397,393
1,397,393
19,737,424
2008
12,308,605
5,432,454
7,492,457
4,574,384
3,732,582
1,916,324
1,453,488
1,453,488
2007
26,276,262
11,751,841
14,680,850
8,293,405
6,238,196
1,363,061
1,537,929
1,537,929
2009
Year ended
30 June 2012
10,237,604
1,771,498
(1,042,450)
(2,805,555)
(6,192,837)
(6,308,791)
(1,646,592)
(7,955,384)
- - - -
11,907,43714,439,186
12,439,502
2,038,185
744,517
(839,282)
(2,949,492)
(3,087,032)
741,579
(2,345,453)
Year ended
30 June 2013months ended
30 June 2011
Eighteen
29,048,102
13,296,159
15,889,321
3,686,308
1,410,076
(5,447,817)
(4,264,773)
(4,264,773)
Total equity
Surplus on revaluation of property,
plant and equipment
Long term debt
Property, plant and equipment
Financial position (Rs. 000)
9,759,139
219,356
21,040,014
25,631,529
9,329,302
239,073
14,393,720
20,483,035
11,842,203
3,969,152
20,127,565
37,077,131
(248,312)(942,614)
3,470,587
7,830,878
12,973,011
6,746,439
11,512,029
13,416,312
7,243,546
7,003,958
26,561,610
50,168,926
*(excluding current portion of long term debt)
Annual Report 2013 17

Statement of ComplianceWith best practices of the Code of Corporate Governance
Category
Independent Director Nasir Ali Khan Bhatti
Executive Directors Ahmed H. Shaikh, Usman Rasheed,Imtiaz Ali Bhatti and Imran Maqbool
Non-executive Directors Aehsun M.H. Shaikh and Naseer Miyan
Names
Azgard Nine Limited18
This statement is being presented to comply with theCode of Corporate Governance contained in RegulationNo. 35 of listing regulations of Karachi Stock ExchangeLimited for the purpose of establishing a framework ofgood governance, whereby a listed Company is managedin compliance with the best practices of corporategovernance.
The Company has applied the principles contained in theCCG in the following manner:
1. The Company encourages representation ofindependent non-executive directors and directorsrepresenting minority interests on its board ofdirectors. At present the board includes:
The independent directors meets the criteria ofindependence under clause i (b) of the CCG.
Election of Directors due on 25 August 2012 could notbe held due to a stay order of the Honorable CivilCourt of Lahore ("Court"). The said election will beheld after the Court order is vacated.
2. The directors have confirmed that none of them isserving as a director in more than seven listedcompanies, including this Company.
3. All the resident directors of the Company areregistered as taxpayers and non of them hasdefaulted in payment of any loan to a bankingCompany, a DFI or a NBFI.
4. During the year following Directors had resigned:
i. Mr. Aamer Ghias resigned on October 10, 2012.
ii. Mr. Khalid A.H. Al-Sagar resigned on February 28,2013.
iii. Mr. Irfan Nazir Ahmed resigned on April 29, 2013.
and the following Directors had filled the casual vacancy.
i. Mr. Imtiaz Ali Bhatti appointed on October 10,2012.
ii. Mr. Nasir Ali Khan Bhatti appointed on February28, 2013.
iii. Mr. Imran Maqbool appointed on April 29, 2013.
5. The Company has prepared a "Code of Conduct" andhas ensured that appropriate steps have been takento disseminate it throughout the Company alongwith its supporting policies and procedures.
6. The board has developed a vision/mission statement,overall corporate strategy and significant policies ofthe Company. A complete record of particulars ofsignificant policies along with the dates on whichthey were approved or amended has beenmaintained.
7. All the powers of the board have been duly exercisedand decisions on material transactions, includingappointment and determination of remunerationand terms and conditions of employment of the CEO,other executive and non-executive directors, havebeen taken by the board.
8. The meetings of the board were presided over by theChairman and, in his absence, by a director elected bythe board for this purpose and the board met at leastonce in every quarter. Written notices of the boardmeetings, along with agenda and working papers,were circulated at least seven days before themeetings. The minutes of the meetings wereappropriately recorded and circulated.

Annual Report 2013 19
9. In accordance with the criteria specified in clause (xi)of CCG, Chief Executive Officer is exempted from therequirement of Directors' training program, but noneof the other Directors got certification under anyDirectors' training program during the year.
10. The Board has approved remuneration and terms andconditions of employment of CFO, CompanySecretary and Head of Internal Audit.
11. The directors' report for this year has been preparedin compliance with the requirements of the CCG andfully describes the salient matters required to bedisclosed.
12. The financial statements of the Company were dulyendorsed by CEO and CFO before approval of theboard.
13. The directors, CEO and executives do not hold anyinterest in the shares of the Company other than thatdisclosed in the pattern of shareholding.
14. The Company has complied with all the corporateand financial reporting requirements of the CCG.
15. The board has formed an Audit Committee. Itcomprises three members, of whom two are non-executive directors and the chairman of thecommittee is an independent director.
16. The meetings of the audit committee were held atleast once every quarter prior to approval of interimand final results of the Company and as required bythe CCG. The terms of reference of the committeehave been formed and advised to the committee forcompliance.
17. The board has formed an HR and RemunerationCommittee. It comprises three members, of whomone is non-executive director and the chairman of thecommittee is an independent director.
18. The board has set up an effective internal auditfunction. The staff is considered to be suitablyqualified and experienced for the purpose and isconversant with the policies and procedures of theCompany.
19. The statutory auditors of the Company haveconfirmed that they have been given a satisfactoryrating under the quality control review program ofthe ICAP, that they or any of the partners of the firm,their spouses and minor children do not hold sharesof the Company and that the firm and all its partnersare in compliance with International Federation ofAccountants (IFAC) guidelines on code of ethics asadopted by the ICAP.
20. The statutory auditors or the persons associated withthem have not been appointed to provide otherservices except in accordance with the listingregulations and the auditors have confirmed thatthey have observed IFAC guidelines in this regard.
21. The 'closed period', prior to the announcement ofinterim/final results, and business decisions, whichmay materially affect the market price of Company'ssecurities, was determined and intimated todirectors, employees and stock exchange(s).
22. Material/price sensitive information has beendisseminated among all market participants at oncethrough stock exchange(s).
23. We confirm that all other material principlesenshrined in the CCG have been complied with.
30 September 2013 Chief Executive Officer
On behalf of the Board of Directors
KKPP GGKPMG Taseer Hadi & Co.
Chartered Accountants
53 L Gulberg III
Lahore Paksitan
Telephone
Fax
Internet
+ 92 (42) 3585 0471-76
+ 92 (42) 3585 0477
www.kpmg.com.pk
KPMG Taseer Hadi & Co., a Partnership firm registered in Pakistanand a member firm of the KPMG network of independent memberfirms affiliated with KPMG International Cooperative("KPMG International"), a Swiss entity.
Lahore
Date: 30 September 2013
KPMG Taseer Hadi & Co.
Chartered Accountants
(Kamran Iqbal Yousafi)
Review Report to the Members on Statement of ComplianceWith Best Practices of Code of Corporate Governance
We have reviewed the Statement of Compliance with the best practices contained in the Code of Corporate Governanceprepared by the Board of Directors of Azgard Nine Limited ("the Company") to comply with the Listing Regulation No. 35of the Karachi Stock Exchange where the Company is listed.
The responsibility for compliance with the Code of Corporate Governance is that of the Board of Directors of theCompany. Our responsibility is to review, to the extent where such compliance can be objectively verified, whether theStatement of Compliance reflects the status of the Company's compliance with the provisions of the Code of CorporateGovernance and report if it does not. A review is limited primarily to inquiries of the Company personnel and review ofvarious documents prepared by the Company to comply with the Code.
As part of our audit of financial statements we are required to obtain an understanding of the accounting and internalcontrol systems sufficient to plan the audit and develop an effective audit approach. We are not required to considerwhether the Board's statement on internal control covers all risks and controls, or to form an opinion on the effectivenessof such internal controls, the Company's corporate governance procedures and risks.
Further, Listing Regulations notified by The Karachi Stock Exchange (Guarantee) Limited requires the Company to placebefore the board of directors for their consideration and approval related party transactions distinguishing betweentransactions carried out on terms equivalent to those that prevail in arm's length transactions and transactions which arenot executed at arm's length price recording proper justification for using such alternate pricing mechanism. Further, allsuch transactions are also required to be separately placed before the audit committee. We are only required and haveensured compliance of requirement to the extent of approval of related party transactions by the board of directors andplacement of such transactions before the audit committee. We have not carried out any procedures to determinewhether the related party transactions were undertaken at arm's length price or not.
Based on our review, nothing has come to our attention which causes us to believe that the Statement of Compliancedoes not appropriately reflect the Company's compliance, in all material respects, with the best practices contained in theCode of Corporate Governance.
We draw attention to point 1 and 9 of the Statement of Compliance relating to election of Directors and Director's trainingprogram respectively.We have not qualified our conclusion in respect of these matters.
Azgard Nine Limited20

Financial Statements

KKPP GGKPMG Taseer Hadi & Co.
Chartered Accountants
53 L Gulberg III
Lahore Paksitan
Telephone
Fax
Internet
+ 92 (42) 3585 0471-76
+ 92 (42) 3585 0477
www.kpmg.com.pk
KPMG Taseer Hadi & Co., a Partnership firm registered in Pakistanand a member firm of the KPMG network of independent memberfirms affiliated with KPMG International Cooperative("KPMG International"), a Swiss entity.
Auditors’ Report to the Members
We have audited the annexed balance sheet of ("the Company") as at 30 June 2013 and the relatedprofit and loss account, statement of comprehensive income, cash flow statement and statement of changes in equitytogether with the notes forming part thereof, for the year then ended and we state that we have obtained all theinformation and explanations which, to the best of our knowledge and belief, were necessary for the purposes of ouraudit.
It is the responsibility of the Company's management to establish and maintain a system of internal control, and prepareand present the above said statements in conformity with the approved accounting standards and the requirements ofthe Companies Ordinance, 1984. Our responsibility is to express an opinion on these statements based on our audit.
We conduct our audit in accordance with the auditing standards as applicable in Pakistan. These standards require thatwe plan and perform the audit to obtain reasonable assurance about whether the above said statements are free of anymaterial misstatement. An audit includes examining on a test basis, evidence supporting the amounts and disclosures inthe above said statements. An audit also includes assessing the accounting policies and significant estimates made bymanagement, as well as, evaluating the overall presentation of the above said statements. We believe that our auditprovides a reasonable basis for our qualified opinion and, after due verification, we report that:
Azgard Nine Limited
a) as stated in note 2.3 and 42.2.2 to the financial statements, the Company could not make timely repayments ofprincipal and interest / mark-up related to long term debts and as at reporting date certain financial and othercovenants imposed by the lenders could not be complied with. International Accounting Standard on Presentationof financial statements (IAS-1) requires that if an entity breaches a provision of a long-term loan arrangement on orbefore the end of the reporting period with the effect that the liability becomes payable on demand, it should classifythe liability as current. In these financial statements the long term debts have been classified as long term accordingto the individual loan repayment schedules. Had these liabilities been classified as per IAS-1, current liabilities of theCompany would have increased by Rs. 7,146.25 million as at the reporting date;
b) in our opinion, proper books of accounts have been kept by the Company as required by the Companies Ordinance,1984;
c) in our opinion:
i) the balance sheet and profit and loss account together with the notes thereon have been drawn up inconformity with the Companies Ordinance, 1984, and are in agreement with the books of accounts and arefurther in accordance with accounting policies consistently applied;
ii) the expenditure incurred during the year was for the purpose of the Company's business; and
iii) the business conducted, investments made and the expenditure incurred during the year were in accordancewith the objects of the Company;
Azgard Nine Limited22

KKPP GGKPMG Taseer Hadi & Co.
Lahore
Date: 30 September 2013
KPMG Taseer Hadi & Co.
Chartered Accountants
(Kamran Iqbal Yousafi)
d) in our opinion and to the best of our information and according to the explanations given to us, except for the effectson the financial statements of the matter referred in paragraph (a) above, the balance sheet, profit and loss account,statement of comprehensive income, cash flow statement and statement of changes in equity together with thenotes forming part thereof conform with approved accounting standards as applicable in Pakistan, and, give theinformation required by the Companies Ordinance, 1984, in the manner so required and respectively give a true andfair view of the state of the Company's affairs as at 30 June 2013 and of the profit, its comprehensive loss, its cash flowsand changes in equity for the year then ended; and
e) in our opinion no Zakat was deductible at source under the Zakat and Ushr Ordinance, 1980 (XVIII of 1980).
We draw attention to the matter that the Company has reported negative cash flows of Rs. 1,100.78 million from itsoperations during the year ended 30 June 2013 and, as of that date, its current liabilities exceeded its current assets by Rs.3,762.64 million, including Rs. 1,945.36 million relating to overdue principal and interest / mark-up thereon, and itsaccumulated loss stood at Rs. 6,704.09 million. The difference between current liabilities and current assets would be Rs.10,908.89 million, had the Company classified its long term debts as current for reasons more fully explained in the note2.3 to the financial statements. These conditions indicate the existence of a material uncertainty that may cast significantdoubt about the Company's ability to continue as a going concern. These financial statements have however beenprepared on a going concern basis for the reasons more fully explained in note 2.2 to the financial statements. Ouropinion is not qualified in respect of this matter.
Annual Report 2013 23

Balance Sheetas at 30 June 2013
EQUITY AND LIABILITIES
Share capital and reserves
Authorized share capital
Issued, subscribed and paid-up capital
Reserves
Accumulated loss
Surplus on revaluation of fixed assets
Non-current liabilities
Redeemable capital - secured
Long term finances - secured
Liabilities against assets subject to finance lease - secured
Current liabilities
Current portion of non-current liabilities
Short term borrowings
Trade and other payables
Due to Agritech Limited - unsecured, considered good
Interest / mark-up accrued on borrowings
Dividend payable
Current taxation
Contingencies and commitments
ASSETS
Non-current assets
Property, plant and equipment
Intangible assets
Long term investments
Long term deposits - unsecured, considered good
Current assets
Stores, spares and loose tools
Stock in trade
Trade receivables
Advances, deposits, prepayments and other receivables
Due from Agritech Limited - unsecured, considered good
Short term investments
Current taxation
Cash and bank balances
The annexed notes 1 to 51 form an integral part of these financial statemements.
2013 2012
Note Rupees Rupees
5 15,000,000,000
5 4,548,718,700
6 3,417,653,853
(6,704,086,654)
1,262,285,899
7 3,470,587,281
8 4,563,334,050
9 1,646,718,198
10 -
6,210,052,248
11 832,991,069
12 4,819,186,842
13 2,526,245,640
14 -
15 1,501,702,254
16 13,415,572
28 39,252,658
9,732,794,035
17
20,675,719,463
18 12,953,017,078
19 1,302,407
20 1,726,766,466
21 24,477,987
14,705,563,938
22 130,970,353
23 2,211,143,101
24 2,149,837,255
25 629,344,302
26 16,600,910
27 700,000,000
28 -
29 132,259,604
5,970,155,525
20,675,719,463
DirectorChief ExecutiveLahore
15,000,000,000
4,548,718,700
7,716,165,332
(7,793,719,801)
4,471,164,231
3,596,275,883
2,729,435,196
-
24,020,739
2,753,455,935
8,105,591,253
8,156,743,175
4,049,064,395
286,395,126
1,425,935,847
32,729,078
-
22,056,458,874
32,877,354,923
13,395,217,269
3,907,224
1,765,517,738
30,030,493
15,194,672,724
173,319,525
3,027,802,430
2,384,301,663
831,308,310
-
10,969,811,440
6,417,088
289,721,743
17,682,682,199
32,877,354,923
Azgard Nine Limited24
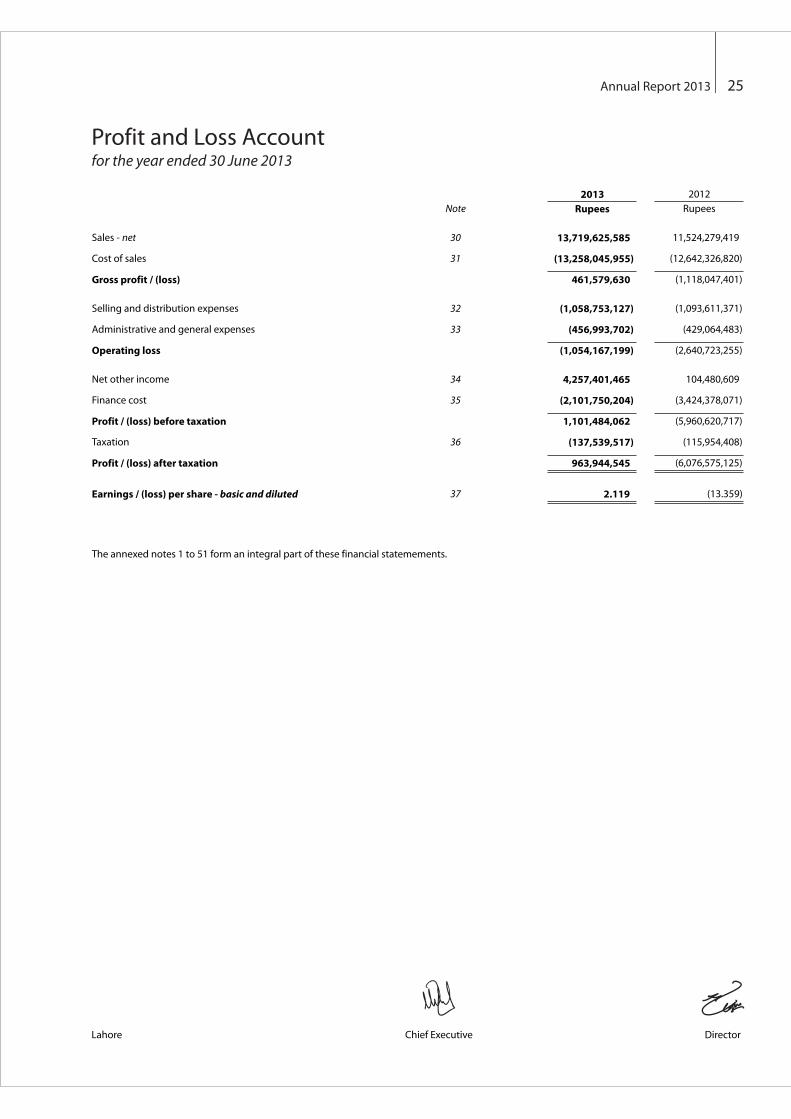
Profit and Loss Accountfor the year ended 30 June 2013
DirectorChief ExecutiveLahore
Sales - net
Cost of sales
Gross profit / (loss)
Selling and distribution expenses
Administrative and general expenses
Operating loss
Net other income
Finance cost
Profit / (loss) before taxation
Taxation
Profit / (loss) after taxation
Earnings / (loss) per share - basic and diluted
The annexed notes 1 to 51 form an integral part of these financial statemements.
Note
30
31
32
33
34
35
36
37
2013 2012
Rupees Rupees
13,719,625,585 11,524,279,419
(13,258,045,955) (12,642,326,820)
461,579,630 (1,118,047,401)
(1,058,753,127) (1,093,611,371)
(456,993,702) (429,064,483)
(1,054,167,199) (2,640,723,255)
4,257,401,465 104,480,609
(2,101,750,204) (3,424,378,071)
1,101,484,062 (5,960,620,717)
(137,539,517) (115,954,408)
963,944,545 (6,076,575,125)
2.119 (13.359)
Annual Report 2013 25

Statement of Comprehensive Incomefor the year ended 30 June 2013
DirectorChief ExecutiveLahore
Profit / (loss) after taxation
Note
Other comprehensive (loss) / income:
Items that are or may be subsequently reclassified to profit or loss
Changes in fair value of cash flow hedges
Changes in fair value of available for sale financial assets
Fair value gain realized on sale of available for sale
financial asset reclassified to profit or loss 34
Total comprehensive loss for the year
The annexed notes 1 to 51 form an integral part of these financial statemements.
2013 2012
Rupees Rupees
963,944,545 (6,076,575,125)
- (48,894,931)
16,390 198,976,215
(4,298,527,869) -
(4,298,511,479) 150,081,284
(3,334,566,934) (5,926,493,841)
Azgard Nine Limited26

Cash Flow Statementfor the year ended 30 June 2013
DirectorChief ExecutiveLahore
Cash flow from operating activities
Cash generated from operations
Interest / mark-up paid
Taxes paid
Long term deposits
Net cash (used in) / generated from operating activities
Cash flow from investing activities
Capital expenditure
Proceeds from disposal of property, plant and equipment
Proceeds from sale of investment in Agritech Limited - net
Net cash generated from / (used in) investing activities
Cash flow from financing activities
Loan (repaid) / obtained from Agritech Limited
Redemption of term finance certificates
Repayment of long term finances
Repayment of liabilities against assets subject to finance lease
Net (decrease) / increase in short term borrowings
Net cash (used in) / generated from financing activities
Net increase in cash and cash equivalents
Cash and cash equivalents at beginning of the year
Cash and cash equivalents at end of the year
The annexed notes 1 to 51 form an integral part of these financial statemements.
2013 2012
Note Rupees Rupees
39 135,274,297 388,960,848
(1,143,001,527) (242,360,070)
(91,869,771) (45,862,281)
(1,183,955) (10,413,900)
(1,100,780,956) 90,324,597
(75,789,159) (114,514,264)
3,110,329 16,350,533
3,491,590,474 -
3,418,911,644 (98,163,731)
(269,622,566) 8,437,008
(199,997) -
(990,663,587) -
(2,673,704) (7,097,857)
(456,552,369) 285,497,951
(1,719,712,223) 286,837,102
598,418,465 278,997,968
(1,542,328,017) (1,821,325,985)
40 (943,909,552) (1,542,328,017)
Annual Report 2013 27

Sta
tem
en
t o
f C
ha
ng
es
in E
qu
ity
for
the
yea
r en
ded
30
Ju
ne
20
13
Dir
ect
or
Ch
ief
Exe
cuti
veL
ah
ore
Th
e a
nn
exe
d n
ote
s 1
to
51
fo
rm a
n in
teg
ral p
art
of
the
se f
ina
nci
al s
tate
me
me
nts
.
As
at
01
Ju
ly 2
01
1
Tota
l co
mp
reh
en
siv
e in
com
e f
or
the
ye
ar
Loss
fo
r th
e y
ea
r e
nd
ed
30
Ju
ne
20
12
Oth
er
com
pre
he
nsi
ve
(lo
ss)
/ in
com
e f
or
the
ye
ar
en
de
d 3
0 J
un
e 2
01
2
Tota
l co
mp
reh
en
siv
e (
loss
) /
inco
me
fo
r th
e y
ea
r
Tra
nsf
er
of
incr
em
en
tal d
ep
reci
ati
on
fro
m s
urp
lus
on
re
va
lua
tio
n o
f fi
xed
ass
ets
As
at
30
Ju
ne
20
12
As
at
01
Ju
ly 2
01
2
Tota
l co
mp
reh
en
siv
e in
com
e f
or
the
ye
ar
Pro
fit
for
the
ye
ar
en
de
d 3
0 J
un
e 2
01
3
Oth
er
com
pre
he
nsi
ve
loss
fo
r th
e y
ea
r e
nd
ed
30
Ju
ne
20
13
Tota
l co
mp
reh
en
siv
e lo
ss f
or
the
ye
ar
Tra
nsf
er
of
incr
em
en
tal d
ep
reci
ati
on
fro
m s
urp
lus
on
re
va
lua
tio
n o
f fi
xed
ass
ets
As
at
30
Ju
ne
20
13
Ca
pit
al
rese
rve
s
10
,26
9,0
64
,14
5
(6,0
76
,57
5,1
25
)
15
0,0
81
,28
4
(5,9
26
,49
3,8
41
)
12
8,5
93
,92
7
4,4
71
,16
4,2
31
4,4
71
,16
4,2
31
96
3,9
44
,54
5
(4,2
98
,51
1,4
79
)
(3,3
34
,56
6,9
34
)
12
5,6
88
,60
2
1,2
62
,28
5,8
99
Tota
l e
qu
ity
Ru
pe
es
5,7
20
,34
5,4
45
(6,0
76
,57
5,1
25
)
15
0,0
81
,28
4
(5,9
26
,49
3,8
41
)
12
8,5
93
,92
7
(77
,55
4,4
69
)
(77
,55
4,4
69
)
96
3,9
44
,54
5
(4,2
98
,51
1,4
79
)
(3,3
34
,56
6,9
34
)
12
5,6
88
,60
2
(3,2
86
,43
2,8
01
)
Tota
l re
serv
es
Ru
pe
es
Acc
um
ula
ted
lo
ss
(1,8
45
,73
8,6
03
)
(6,0
76
,57
5,1
25
)
-
(6,0
76
,57
5,1
25
)
12
8,5
93
,92
7
(7,7
93
,71
9,8
01
)
(7,7
93
,71
9,8
01
)
96
3,9
44
,54
5
-
96
3,9
44
,54
5
12
5,6
88
,60
2
(6,7
04
,08
6,6
54
)
Re
ve
nu
e r
ese
rve
s
Ru
pe
es
Av
ail
ab
le f
or
sale
fin
an
cia
l a
sse
ts
4,3
92
,53
9,5
21
-
19
8,9
76
,21
5
19
8,9
76
,21
5
-
4,5
91
,51
5,7
36
4,5
91
,51
5,7
36
-
(4,2
98
,51
1,4
79
)
(4,2
98
,51
1,4
79
)
-
29
3,0
04
,25
7
Ru
pe
es
Pre
fere
nce
sh
are
red
em
pti
on
rese
rve
66
1,2
50
,83
0
- - - -
66
1,2
50
,83
0
66
1,2
50
,83
0
- - - -
66
1,2
50
,83
0
Ru
pe
es
Re
serv
e
on
me
rge
r
10
5,1
52
,00
5
- - - -
10
5,1
52
,00
5
10
5,1
52
,00
5
- - - -
10
5,1
52
,00
5
Ru
pe
es
Ca
sh f
low
he
dg
es
48
,89
4,9
31
-
(48
,89
4,9
31
)
(48
,89
4,9
31
)
- - - - - - - -
Ru
pe
es
Sh
are
pre
miu
m
2,3
58
,24
6,7
61
- - - -
2,3
58
,24
6,7
61
2,3
58
,24
6,7
61
- - - -
2,3
58
,24
6,7
61
Ru
pe
es
4,5
48
,71
8,7
00
- - - -
4,5
48
,71
8,7
00
4,5
48
,71
8,7
00
- - - -
4,5
48
,71
8,7
00
Issu
ed
, su
bsc
rib
ed
an
dp
aid
-up
cap
ita
l
Ru
pe
es
Azgard Nine Limited28

Notes to the Financial Statementsfor the year ended 30 June 2013
1 Reporting entity
2 Basis of preparation
2.1 Statement of compliance
2.2 Going concern assumption
2.3 Financial liabilities
The Company could not make timely repayments of principal and interest / mark-up related to long term debts as referred to in note
42.2.2. Further, as at the reporting date, the Company could not comply with certain financial and other covenants imposed by the
lenders. As per the agreed terms of long term debts the lenders have unconditional right to call the loans if timely repayments are not
made or covenants are not complied with. International Accounting Standard on Presentation of financial statements (IAS - 1) requires
that if an entity breaches a provision of a long-term loan arrangement on or before the end of the reporting period with the effect that
the liability becomes payable on demand, it should classify the liability as current.
However, the long term debts in the amount of Rs. 7,146.255 million as detailed below have been classified as long term as per the
repayment schedules in the financial statements as the management considers that event of default has not been declared by the
lenders and also because of the fact that during the year the Company has commenced discussions with its lenders for reprofiling of
its long term debts:
Azgard Nine Limited ("the Company") was incorporated in Pakistan as a Public Limited Company and is listed on Karachi Stock
Exchange (Guarantee) Limited. The Company is a composite spinning, weaving, dyeing and stitching unit engaged in the
manufacturing of yarn, denim and denim products. The registered office of the Company is situated at Ismail Aiwan-e-Science, off
Shahrah-e-Roomi, Lahore. The Company has three production units with Unit I located at 2.5 km off Manga, Raiwind Road, District
Kasur, Unit II at Alipur Road, Muzaffargarh and Unit III at 20 km off Ferozpur Road, 6 km Badian Road on Ruhi Nala, Der Khurd, Lahore.
As a part of the second restructuring, the management of the Company intends to sell certain low performing assets, debt
restructuring and divestment of its remaining shareholding of Rs. 700.000 million in AGL to achieve better liquidity. With these
proposed measures, the management of the Company envisages that sufficient financial resources will be available for continuing
operations of the Company. With repayment of long term debt there will be a positive impact on reduction of finance costs and with
more effective management of resources and raw material procurement, the Company is expected to operate profitably, subject to
impact, if any, of uncontrollable external circumstances including power crises and global market conditions.
The Company in line with the worldwide and nationwide recessionary trends and other economic conditions is facing liquidity crisis.
During the year, the Company has divested majority of its shareholdings in Agritech Limited (''AGL'') and as a result of the said
divestment, the Company has settled its long term loans, certain interest / mark-up, redeemable capital, short term borrowings, bills
payable,other charges and short term loan from AGL amounting to Rs. 10,042.991 million. However, the Company could only manage
to make available Rs. 226.819 million to meet its working capital requirements from the divestment of AGL as opposed to the
Rs. 926.819 million surplus anticipated by the Company as explained in note 27.1. Further, because of constraints in the availability
of funds, installed operational capacities could not be achieved due to unavailability of sufficient working capital. Had the Company
been able to make timely purchases of raw materials the cost of sales would have been lower.
These financial statements have been prepared in accordance with approved accounting standards as applicable in Pakistan and the
requirements of Companies Ordinance, 1984. Approved accounting standards comprise of such International Financial Reporting
Standards ("IFRSs") issued by the International Accounting Standards Board as notified under the provisions of the Companies
Ordinance, 1984, provisions of and directives issued under the Companies Ordinance, 1984. In case requirements differ, the provisions
of or directives under the Companies Ordinance, 1984 shall prevail.
Due to the above mentioned reasons, the Company has reported negative cash flows of Rs. 1,100.781 million from its operations
during the year ended 30 June 2013 and, as of that date, its current liabilities exceeded its current assets by Rs. 3,762.639 million,
including Rs. 1,945.364 million relating to overdue principal and interest / mark-up thereon, and its accumulated loss stood at Rs. 6,704.087
million. These conditions cast a significant doubt about the Company's ability to continue as a going concern. These financial
statements have however, been prepared on a going concern basis. The assumption that the Company would continue as a going
concern is based on the measures as explained in the succeeding paragraph and expectation of future profitability and positive cash
flows from operating activities.
Annual Report 2013 29

Notes to the Financial Statementsfor the year ended 30 June 2013
Redeemable capital
Term Finance Certificates - II
Term Finance Certificates - IV
Term Finance Certificates - V
Privately Placed Term Finance Certificates - VI
Privately Placed Term Finance Certificates
Privately Placed Term Finance Certificates
Long term finances
Deutsche Investitions - Und MBH (Germany)
Saudi Pak Industrial and Agricultural Company Limited
HSBC Bank (Middle East) Limited
Citi Bank N.A (Pakistan)
2.4 Basis of measurement
2.5 Judgments, estimates and assumptions
2.5.1 Depreciation method, rates and useful lives of property, plant and equipment
2.5.2 Recoverable amount of assets / cash generating units and impairment
2.5.3 Fair values based on inputs from other than active market
The management of the Company reviews carrying amounts of its assets and cash generating units for possible impairment and makes
formal estimates of recoverable amount if there is any such indication.
Fair values of financial instruments, which are based on inputs from other than active market are determined using valuation
techniques which incorporate all factors that market participants would consider in setting a price and use inputs that reasonably
represent market expectations and measures of the risk-return factors inherent in the financial instrument.
The management of the Company reassesses useful lives, depreciation method and rates for each item of property, plant and
equipment annually by considering expected pattern of economic benefits that the Company expects to derive from that item and
the maximum period up to which such benefits are expected to be available. The rates of depreciation are specified in note 18.1.
These financial statements have been prepared under the historical cost convention except for certain financial instruments at fair
value, certain financial instruments at amortized cost and certain items of property, plant and equipment at revalued amounts. In
these financial statements, except for the amounts reflected in the cash flow statement, all transactions have been accounted for on
accrual basis.
The preparation of financial statements requires management to make judgments, estimates and assumptions that affect the
application of accounting policies and the reported amounts of assets, liabilities, income and expenses. The estimates and associated
assumptions and judgments are based on historical experience and various other factors that are believed to be reasonable under the
circumstances, the result of which forms the basis of making judgments about carrying values of assets and liabilities that are not
readily apparent from other sources. Actual results may differ from these estimates. Estimates and underlying assumptions are
reviewed on an ongoing basis. Revisions to accounting estimates are recognized in the period in which the estimate is revised and in
any future periods affected. Judgments made by management in the application of approved accounting standards that have
significant effect on the financial statements and estimates with a risk of material adjustment in subsequent years are as follows:
Principal net ofcurrent maturity
Rupees
613,440,233
1,021,683,477
402,008,983
2,896,803,000
326,456,184
217,200,000
5,477,591,877
907,054,268
41,040,190
209,782,786
510,785,519
1,668,662,763
7,146,254,640
Azgard Nine Limited30

Notes to the Financial Statementsfor the year ended 30 June 2013
2.5.4 Taxation
2.5.5 Provisions
2.5.6 Revaluation of property, plant and equipment
2.6 Functional currency
3 Significant accounting polices
3.1 Property, plant and equipment
These financial statements have been prepared in Pak Rupees which is the Company's functional currency.
The Company recognizes depreciation in profit or loss by applying reducing balance method over the useful life of each item of
property, plant and equipment using rates specified in note 18.1 to the financial statements. Depreciation on additions to property,
plant and equipment is charged from the month in which the item becomes available for use. Depreciation is discontinued from the
month in which it is disposed or classified as held for disposal.
Items of property, plant and equipment are measured at cost less accumulated depreciation and accumulated impairment losses with
the exception of freehold land, which is measured at revalued amount less accumulated impairment losses, plant and machinery and
building which are measured at revalued amount less accumulated depreciation and accumulated impairment losses and capital work
in progress, which is stated at cost less accumulated impairment losses. Cost comprises purchase price, including import duties and
non-refundable purchase taxes, after deducting trade discounts and rebates, and includes other costs directly attributable to the
acquisition or construction, erection and installation.
The frequency of revaluations depends upon the changes in fair values of the items of property, plant and equipment being revalued.
When the fair value of a revalued asset differs materially from its carrying amount, a further revaluation is required. Such frequent
revaluations are unnecessary for items of property, plant and equipment with only insignificant changes in fair value. Instead, it may be
necessary to revalue the item only every three or five years.
An item of property, plant and equipment is de-recognized when permanently retired from use. Any gain or loss on disposal of
property, plant and equipment is recognized in profit or loss.
The Company takes into account the current income tax law and decisions taken by appellate authorities while estimating its tax
liabilities.
Provisions are based on best estimate of the expenditure required to settle the present obligation at the reporting date, that is, the
amount that the Company would rationally pay to settle the obligation at the reporting date or to transfer it to a third party.
Revaluation of property, plant and equipment is carried out by independent professional valuers. Revalued amounts of non-
depreciable items are determined by reference to local market values and that of depreciable items are determined by reference to
present depreciated replacement values.
The accounting policies set out below have been applied consistently to all periods presented in these financial statements.
Major renewals and improvements to an item of property, plant and equipment are recognized in the carrying amount of the item if it
is probable that the embodied future economic benefits will flow to the Company and the cost of renewal or improvement can be
measured reliably. The cost of the day-to-day servicing of property, plant and equipment are recognized in profit or loss as incurred.
Annual Report 2013 31

Notes to the Financial Statementsfor the year ended 30 June 2013
3.2 Surplus / deficit arising on revaluation of property, plant and equipment
3.3 Intangible assets
3.4 Software
3.5 Research and development expenditure
3.6 Stores, spares and loose tools
3.7 Stock in trade
Raw materials Average cost
Work in process Average manufacturing cost
These are valued at lower of cost and net realizable value, with the exception of stock of waste which is valued at net realizable value.
Cost is determined using the following basis:
These are stated at lower of cost and net realizable value. Cost is determined using the weighted average method.
All intangible assets are amortized over the period, not exceeding five years, over which the Company expects to obtain economic
benefits, on a straight line basis. All intangible assets are tested for impairment at each reporting date. The particular measurement
methods adopted are disclosed in the individual policy statements associated with each intangible asset.
Further the surplus on revaluation of property, plant and equipment shall be utilized in accordance with the provisions of section 235
of the Companies Ordinance, 1984.
Development activities involve a plan or design for the production of new or substantially improved products and processes.
Development expenditure is capitalized and recognized as an intangible asset only if development costs can be measured reliably, the
product or process is technically and commercially feasible, future economic benefits are probable, and the Company intends to and
has the sufficient technical, financial and other resources to complete development and to use or sell the asset or its output for which a
market exists. The expenditure capitalized includes the cost of materials, direct labour and overhead costs that are directly attributable
to preparation of the asset for its intended use. All other development expenditure is recognized in profit or loss as and when incurred.
The intangible asset so recognized is initially measured at cost. Subsequent to initial recognition, it is measured at cost less
accumulated amortization and accumulated impairment losses, if any. Expenditure previously recognized in profit or loss is not
capitalized as part of the cost of intangible asset.
Surplus arising on revaluation of items of property, plant and equipment is carried on balance sheet after reversing deficit relating to
the same item previously recognized in profit or loss, if any. Deficit arising on revaluation is recognized in profit or loss after reversing
the surplus relating to the same item previously carried on balance sheet, if any. An amount equal to incremental depreciation, being
the difference between the depreciation based on revalued amounts and that based on the original cost, net of deferred tax, if any, is
transferred from surplus on revaluation of property, plant and equipment to accumulated profit or loss every year.
An intangible asset is measured initially at cost. The cost of the intangible asset acquired comprises its purchase price, including non-
refundable purchase taxes, after deducting trade discounts and rebates, and includes other costs directly attributable to the
acquisition. Costs incurred after the asset is in the condition necessary for it to operate in the manner intended by the management are
recognized in profit or loss. Subsequent to initial recognition, intangible assets are measured at cost less accumulated amortization and
accumulated impairment losses, if any.
The cost of acquisition, development and installation of identifiable software products having finite useful lives of more than one year
is recognized as an intangible asset at cost. Subsequent to initial recognition, it is measured at cost less accumulated amortization and
accumulated impairment losses, if any.
Research activities are activities undertaken with the prospect of gaining new scientific or technical knowledge and understanding.
Expenditure on research activities is recognized in profit or loss as and when incurred.
Azgard Nine Limited32

A financial instrument is recognized when the Company becomes a party to the contractual provisions of the instrument. The Company
classifies its financial instruments into following classes depending on the purpose for which the financial assets and liabilities are
acquired or incurred. The Company determines the classification of its financial assets and liabilities at initial recognition.
Notes to the Financial Statementsfor the year ended 30 June 2013
Finished goods Average manufacturing cost
Stock in transit Invoice price plus related expense incurred up to the reporting date
3.8 Employee benefits
Short-term employee benefits
Post-employment benefits
3.9 Investments
3.9.1 Investment in subsidiary
3.9.2 Investments in debt securities
3.9.3 Financial instruments
Investments in equity securities of subsidiaries are classified as 'available for sale financial assets'. On initial recognition these are
measured at cost, being their fair value on date of acquisition, less attributable transaction costs. Subsequent to initial recognition,
investments in equity securities of subsidiaries are measured at fair value. Investments in other equity securities, where prices are
available from active market, are measured at fair value subsequent to initial recognition, however in absence of active market, these
are measured at cost less accumulated impairment losses. Changes in fair value are recognized in other comprehensive income until
the investment is derecognized or impaired. Gains and losses on de-recognition and impairment losses are recognized in profit or loss.
Investments in debt securities, which the Company does not intend, or is not able, to hold to maturity, including those previously
classified as 'held-to-maturity investments' are classified as 'available for sale financial assets'. On initial recognition / reclassification,
these are measured at cost, being their fair value on the date of acquisition / reclassification, less attributable transaction costs incurred
on acquisition. Subsequent to initial recognition, securities for which prices are available from active market are measured at fair value.
Changes in fair value are recognized in other comprehensive income until the investment is derecognized or impaired. Gains and
losses on de-recognition and impairment losses are recognized in profit or loss. Securities with no active market are carried at cost
subsequent to initial recognition.
The Company classifies its investments into following classes depending on the purpose for which the investments are made.
Investments are either classified as investment in subsidiary, investment in debt security or financial instruments as follows:
Investments in debt securities, which the Company has the positive intention and ability to hold to maturity, are classified as 'held-to-
maturity investments'. On initial recognition, these are measured at cost, being their fair value on the date of acquisition, less
attributable transaction costs. Subsequent to initial recognition, these are measured at amortized cost, with any difference between
cost and value at maturity recognized in the profit or loss over the period of the investment on an effective interest basis.
Net realizable value signifies the estimated selling price in the ordinary course of business less estimated costs of completion and
estimated costs necessary to make the sale.
Average
appropriate manufacturing overheads.
manufacturing cost in relation to work in process and finished goods consists of direct material, labour and a proportion of
The Company operates an approved defined contributory provident fund for its employees. Equal contributions are made by the
Company and employees at 8.5% of basic salary.
The Company recognizes the undiscounted amount of short term employee benefits to be paid in exchange for services rendered by
employees as a liability after deducting amount already paid and as an expense in profit or loss unless it is included in the cost of
inventories or property, plant and equipment as permitted or required by the approved accounting standards. If the amount paid
exceeds the undiscounted amount of benefits, the excess is recognized as an asset to the extent that the prepayment would lead to a
reduction in future payments or cash refund.
Annual Report 2013 33

Notes to the Financial Statementsfor the year ended 30 June 2013
3.9.3(a) Financial assets at fair value through profit or loss
3.9.3(b) Held-to-maturity investments
3.9.3(c) Loans and receivables
3.9.3(d) Available for sale financial assets
3.9.3(e) Financial liabilities at amortized cost
3.9.3(f) Derivative financial instruments
Financial assets at fair value through profit or loss are financial assets that are either designated as such on initial recognition or are
classified as held for trading. Financial assets are designated as financial assets at fair value through profit or loss if the Company
manages such assets and evaluates their performance based on their fair value in accordance with the Company’s risk management
and investment strategy. Financial assets are classified as held for trading when these are acquired principally for the purpose of selling
and repurchasing in the near term, or when these are part of a portfolio of identified financial instruments that are managed together
and for which there is a recent actual pattern of profit taking, or where these are derivatives, excluding derivatives that are financial
guarantee contracts or that are designated and effective hedging instruments. Financial assets in this category are presented as current
assets. The Company does not have any financial assets classified as financial asset at fair value through profit or loss as at the balance
sheet date.
Non-derivative financial assets with fixed or determinable payments and fixed maturity that the Company has the positive intention
and ability to hold to maturity are classified as held-to-maturity investments unless these are designated on initial recognition as
financial assets at fair value through profit or loss or available for sale financial assets or these meet the definition of loans and
receivables. Where, as a result of change in intention or ability to hold financial assets initially classified as held-to-maturity investments
to maturity or where due to sales or reclassification of a significant amount of held-to-maturity investments, classification as held-to-
maturity investments is no longer appropriate, these are reclassified as available for sale financial assets. Financial assets in this
category are presented as non-current assets except for maturities within twelve months from the reporting date where these are
presented as current assets. The Company does not have any investment classified as held-to-maturity investment as at the reporting
date.
Non-derivative financial liabilities that are not financial liabilities at fair value through profit or loss are classified as financial liabilities at
amortized cost. Financial liabilities in this category are presented as current liabilities except for maturities greater than twelve months
from the reporting date where these are presented as non-current liabilities. The particular measurement methods adopted are
disclosed in the individual policy statements associated with each instrument.
Non-derivative financial assets with fixed or determinable payments that are not quoted in an active market are classified as loans and
receivables. Assets in this category are presented as current assets except for maturities greater than twelve months from the reporting
date, where these are presented as non-current assets. The particular measurement methods adopted are disclosed in the individual
policy statements associated with each instrument.
Available for sale financial assets are non-derivative financial assets that are designated as such on initial recognition or are not
classified as loans and receivables, held-to-maturity investments or financial assets at fair value through profit or loss. Assets in this
category are presented as non-current assets unless the management intends to dispose off the asset within twelve months from the
reporting date. The particular measurement methods adopted are disclosed in the individual policy statements associated with each
instrument.
Derivatives are classified as financial assets and liabilities at fair value through profit or loss unless the derivative is a designated and
effective hedging instrument or a financial guarantee contract. Derivatives are initially recognized at cost, being fair value on the date
the contract is entered into by the Company. Subsequent to initial recognition these are measured at fair value. Gains and losses arising
from changes in fair value of derivatives classified as financial assets and liabilities at fair value through profit or loss are recognized in
profit or loss. Where derivatives are designated hedging instruments the method of recognizing gains and losses arising from changes
in fair value depends on the nature of item being hedged. The Company designates derivatives as either a fair value hedge or a cash
flow hedge.
Azgard Nine Limited34

Notes to the Financial Statementsfor the year ended 30 June 2013
Fair value hedges
Cash flow hedges
3.9.4 De-recognition
3.9.5 Off-setting
3.9.6 Regular way purchases and sales of financial assets
3.10 Ordinary share capital
3.11 Preference share capital
3.12 Redeemable capital
3.13 Loans and borrowings
Redeemable capital, including embedded equity component existing due to conversion options, if any, is recognized as 'loans and
borrowings', in accordance with the interpretation of the provisions of the Companies Ordinance, 1984, including those pertaining to
implied classification of redeemable capital.
Loans and borrowings are classified as 'financial liabilities at amortized cost'. On initial recognition, these are measured at cost, being
fair value at the date the liability is incurred, less attributable transaction costs. Subsequent to initial recognition, these are measured at
amortized cost with any difference between cost and value at maturity recognized in the profit or loss over the period of the
borrowings on an effective interest basis.
Preference share capital is recognized as equity in accordance with the interpretation of the provisions of the Companies Ordinance,
1984, including those pertaining to implied classification of preference shares.
Ordinary share capital is recognized as equity. Transaction costs directly attributable to the issue of ordinary shares and share options
are recognized as deduction from equity.
Regular way purchases and sales of financial assets are recognized on trade dates.
of fair of firm fair ofThese are hedges the value recognized assets or liabilities or a commitment. Changes in the value derivatives that
are designated and qualify as fair value hedges are recognized in profit or loss, together with changes in fair value of hedged asset or
liability that are attributable to the hedged risk.
These are hedges of a particular risk associated with the fair value of recognized asset or liability or a highly probable forecast
transaction. Changes in the fair value of derivatives that are designated and qualify as cash flow hedges are recognized in equity to the
extent hedge is effective. The gain or loss relating to the ineffective portion is recognized in profit or loss.
Financial assets are de-recognized if the Company's contractual rights to the cash flows from the financial assets expire or if the
Company transfers the financial asset to another party without retaining control or substantially all risks and rewards of the asset.
Financial liabilities are de-recognized if the Company's obligations specified in the contract expire or are discharged or cancelled. Any
gain or loss on de-recognition of financial assets and financial liabilities is recognized in profit or loss.
A financial asset and a financial liability is offset and the net amount reported in the balance sheet if the Company has legally
enforceable right to set-off the recognized amounts and intends either to settle on a net basis or to realize the asset and settle the
liability simultaneously.
Annual Report 2013 35

Notes to the Financial Statementsfor the year ended 30 June 2013
3.14 Finance leases
3.15 Operating leases
3.16 Trade and other payables
3.16.1 Financial liabilities
3.16.2 Non-financial liabilities
3.17 Provisions and contingencies
3.18 Trade and other receivables
3.18.1 Financial assets
3.18.2 Non-financial assets
3.19 Revenue
These are classified as 'loans and receivables'. On initial recognition, these are measured at cost, being their fair value at the date of
transaction, less attributable transaction costs. Subsequent to initial recognition, these are measured at amortized cost using the
effective interest method, with interest recognized in profit or loss.
These, on initial recognition and subsequently, are measured at cost.
Provisions are recognized when the Company has a legal and constructive obligation as a result of past events and it is probable that
outflow of resources embodying economic benefits will be required to settle the obligation and a reliable estimate can be made of the
amount of obligation. Provision is recognized at an amount that is the best estimate of the expenditure required to settle the present
obligation at the reporting date. Where outflow of resources embodying economic benefits is not probable, or where a reliable
estimate of the amount of obligation cannot be made, a contingent liability is disclosed, unless the possibility of outflow is remote.
These are classified as 'financial liabilities at amortized cost'. On initial recognition, these are measured at cost, being their fair value at
the date the liability is incurred, less attributable transaction costs. Subsequent to initial recognition, these are measured at amortized
cost using the effective interest method, with interest recognized in profit or loss.
Leases that do not transfer substantially all risks and rewards of ownership are classified as operating leases. Payments made under
operating leases are recognized in profit or loss on a straight line basis over the lease term.
Revenue is measured at the fair value of the consideration received or receivable, net of returns allowances, trade discounts and
rebates, and represents amounts received or receivable for goods and services provided and other income earned in the normal
course of business. Revenue is recognized when it is probable that the economic benefits associated with the transaction will flow to
the Company, and the amount of revenue and the associated costs incurred or to be incurred can be measured reliably.
These, on initial recognition and subsequently, are measured at cost.
Leases in terms of which the Company assumes substantially all risks and rewards of ownership are classified as finance leases. Assets subject
to finance lease are classified as 'property, plant and equipment'. On initial recognition, these are measured at cost, being an amount equal to
the lower of its fair value and the present value of minimum lease payments. Subsequent to initial recognition, these are measured at cost
less accumulated depreciation and accumulated impairment losses. Depreciation, subsequent expenditure, de-recognition, and gains and
losses on de-recognition are accounted for in accordance with the respective policies for property, plant and equipment. Liabilities against
assets subject to finance lease and deposits against finance lease are classified as 'financial liabilities at amortized cost' and 'loans and
receivables' respectively, however, since they fall outside the scope of measurement requirements of IAS 39 'Financial Instruments -
Recognition and Measurement', these are measured in accordance with the requirements of IAS 17 'Leases'. On initial recognition, these are
measured at cost, being their fair value at the date of commencement of lease, less attributable transaction costs. Subsequent to initial
recognition, minimum lease payments made under finance leases are apportioned between the finance charge and the reduction of
outstanding liability.The finance charge is allocated to each period during the lease term so as to produce a constant periodic rate of interest
on the remaining balance of the liability. Deposits against finance leases, subsequent to initial recognition are carried at cost.
Azgard Nine Limited36

Notes to the Financial Statementsfor the year ended 30 June 2013
3.20 Borrowing costs
3.21 Government grants
3.22 Income tax
Deferred taxation
3.23 Earnings per share (EPS)
Basic EPS is calculated by dividing the profit or loss attributable to ordinary shareholders of the Company by the weighted average
number of ordinary shares outstanding during the year.
Diluted EPS is calculated by adjusting basic EPS by the weighted average number of ordinary shares that would be issued on
conversion of all dilutive potential ordinary shares into ordinary shares and post-tax effect of changes in profit or loss attributable to
ordinary shareholders of the Company that would result from conversion of all dilutive potential ordinary shares into ordinary shares.
Government grants are recognized initially as deferred income when there is reasonable assurance that they will be received and that
the Company will comply with the conditions associated with the grant. Subsequent to initial recognition grants related to assets are
recognized in profit or loss on a systematic basis over the useful life of the assets whereas grants relating to income are recognized in
profit or loss in the same period in which related expenses are recognized. Grants that compensate the Company for expenses or losses
already incurred are recognized in profit or loss in the period in which these become receivable.
Interest income is recognized as and when accrued on effective interest method.
Dividend income is recognized when the Company's right to receive payment is established.
Income tax expense comprises current tax and deferred tax. Income tax expense is recognized in profit or loss except to the extent that
it relates to items recognized directly in other comprehensive income, in which case it is recognized in other comprehensive income.
Revenue from different sources is recognized as follows:
Deferred tax is accounted for using the balance sheet approach providing for temporary differences between the carrying amounts of
assets and liabilities for financial reporting purposes and the amounts used for tax purposes. In this regard, the effects on deferred
taxation of the portion of income that is subject to final tax regime is also considered in accordance with the treatment prescribed by
the Institute of Chartered Accountants of Pakistan. Deferred tax is measured at rates that are expected to be applied to the temporary
differences when they reverse, based on laws that have been enacted or substantively enacted by the reporting date. A deferred tax
liability is recognized for all taxable temporary differences. A deferred tax asset is recognized for deductible temporary differences to
the extent that future taxable profits will be available against which temporary differences can be utilized. Deferred tax assets are
reviewed at each reporting date and are reduced to the extent that it is no longer probable that the related tax benefit will be realized.
Current tax is the amount of tax payable on taxable income for the year, using tax rates enacted or substantively enacted by the
reporting date, and any adjustment to the tax payable in respect of previous years. Provision for current tax is based on current rates of
taxation in Pakistan after taking into account tax credits, rebates and exemptions available, if any. The amount of unpaid income tax in
respect of the current or prior periods is recognized as a liability. Any excess paid over what is due in respect of the current or prior
periods is recognized as an asset.
Borrowing costs directly attributable to the acquisition, construction or production of qualifying assets, which are assets that
necessarily take a substantial period of time to get ready for their intended use or sale, are added to the cost of those assets, until such
time as the assets are substantially ready for their intended use or sale. Investment income earned on the temporary investment of
specific borrowings pending their expenditure on qualifying asset is deducted from the borrowing costs eligible for capitalization. All
other borrowing costs are recognized in profit or loss as incurred.
Revenue from sale of goods is recognized when risks and rewards incidental to the ownership of goods are transferred to the buyer.
Annual Report 2013 37

Notes to the Financial Statementsfor the year ended 30 June 2013
3.24 Cash and cash equivalents
3.25 Foreign currency transactions and balances
3.26 Impairment
3.26.1 Financial assets
3.26.2 Non-financial assets
3.27 Dividend to ordinary shareholders
An impairment loss in respect of a financial asset measured at amortized cost is calculated as the difference between its carrying
amount, and the present value of the estimated future cash flows discounted at the original effective interest rate. Impairment loss in
respect of a financial asset measured at fair value is determined by reference to that fair value. All impairment losses are recognized in
profit or loss. An impairment loss is reversed if the reversal can be related objectively to an event occurring after the impairment loss
was recognized. An impairment loss is reversed only to the extent that the financial asset’s carrying amount after the reversal does not
exceed the carrying amount that would have been determined, net of amortization, if no impairment loss had been recognized.
The carrying amount of the Company’s non-financial assets, other than inventories and deferred tax assets are reviewed at each
reporting date to determine whether there is any indication of impairment. If any such indication exists, then the asset’s recoverable
amount is estimated. The recoverable amount of an asset or cash generating unit is the greater of its value in use and its fair value less
cost to sell. In assessing value in use, the estimated future cash flows are discounted to their present values using a pre-tax discount
rate that reflects current market assessments of the time value of money and the risks specific to the asset or cash generating unit.
Dividend to ordinary shareholders is recognized as a deduction from accumulated profit in statement of changes in equity and as a
liability, to the extent it is unclaimed, in the Company’s financial statements in the year in which the dividends are approved by the
Company’s shareholders.
Cash and cash equivalents comprise running finances, cash balances and call deposits with maturities of three months or less from the
acquisition date that are subject to an insignificant risk of changes in their fair value, and are used by the Company in the management
of its short-term commitments.
An impairment loss is recognized if the carrying amount of the assets or its cash generating unit exceeds its estimated recoverable
amount. Impairment losses are recognized in profit or loss. Impairment losses recognized in respect of cash generating units are
allocated to reduce the carrying amounts of the assets in a unit on a pro rata basis. Impairment losses recognized in prior periods are
assessed at each reporting date for any indications that the loss has decreased or no longer exists. An impairment loss is reversed if
there has been a change in the estimates used to determine the recoverable amount. An impairment loss is reversed only to that
extent that the asset’s carrying amount after the reversal does not exceed the carrying amount that would have been determined, net
of depreciation and amortization, if no impairment loss had been recognized.
A financial asset is assessed at each reporting date to determine whether there is any objective evidence that it is impaired.
Individually significant financial assets are tested for impairment on an individual basis. The remaining financial assets are assessed
collectively in groups that share similar credit risk characteristics. A financial asset is considered to be impaired if objective evidence
indicates that one or more events have had a negative effect on the estimated future cash flows of the asset.
Transactions in foreign currencies are translated to the respective functional currencies of the Company at exchange rates at the dates
of the transactions. Monetary assets and liabilities denominated in foreign currencies at the reporting date are retranslated to the
functional currency at the exchange rate at that date. The foreign currency gain or loss on monetary items is the difference between
amortized cost in the functional currency at the beginning of the year, adjusted for effective interest and payments during the year,
and the amortized cost in foreign currency translated at the exchange rate at the end of the year.
Foreign currency differences arising on retranslation are generally recognized in profit or loss.
Non-monetary assets and liabilities that are measured at fair value in a foreign currency are retranslated to the functional currency at
the exchange rate at the date that the fair value was determined. Non-monetary items that are measured based on historical cost in a
foreign currency are translated using the exchange rate at the date of the transaction.
Azgard Nine Limited38

Notes to the Financial Statementsfor the year ended 30 June 2013
3.28 Dividend distribution to preference shareholders
4 New and revised approved accounting standards, interpretations and amendments thereto
Annual Improvements 2009–2011 (effective for annual periods beginning on or after 1 January 2013). The new cycle of improvements
contains amendments to the following four standards, with consequential amendments to other standards and interpretations:
- IAS 27 Separate Financial Statements (2011) - (effective for annual periods beginning on or after 1 January 2013). IAS 27 (2011)
supersedes IAS 27 (2008). Three new standards IFRS 10 - Consolidated Financial Statements, IFRS 11- Joint Arrangements and IFRS 12-
Disclosure of Interest in Other Entities dealing with IAS 27 would be applicable effective 1 January 2013. IAS 27 (2011) carries forward
the existing accounting and disclosure requirements for separate financial statements, with some minor clarifications. The
amendments have no impact on financial statements of the Company.
- Offsetting Financial Assets and Financial Liabilities (Amendments to IFRS 7) – (effective for annual periods beginning on or after 1
January 2013). The amendments to IFRS 7 contain new disclosure requirements for financial assets and liabilities that are offset in the
statement of financial position or subject to master netting agreement or similar arrangement.
- IAS 19 Employee Benefits (amended 2011) - (effective for annual periods beginning on or after 1 January 2013). The amended IAS 19
includes the amendments that require actuarial gains and losses to be recognized immediately in other comprehensive income; this
change will remove the corridor method and eliminate the ability for entities to recognize all changes in the defined benefit
obligation and in plan assets in profit or loss, which currently is allowed under IAS 19; and that the expected return on plan assets
recognized in profit or loss is calculated based on the rate used to discount the defined benefit obligation.
The following standards, amendments and interpretations of approved accounting standards will be effective for accounting periods
beginning on or after 01 July 2013:
Dividend distribution to the preference shareholders is recognized as a deduction from accumulated profit in statement of changes in
equity and as a liability, to the extent it is unpaid, in the Company’s financial statements at the end of each year from the issue of
preference shares.
Had there been no change in the aforementioned, there would not have been any bifurcation of items appearing in the 'other comprehensive
income'.
- Offsetting Financial Assets and Financial Liabilities (Amendments to IAS 32) – (effective for annual periods beginning on or after 1
January 2014). The amendments address inconsistencies in current practice when applying the offsetting criteria in IAS 32 Financial
Instruments: Presentation. The amendments clarify the meaning of ‘currently has a legally enforceable right of set-off’; and that some
gross settlement systems may be considered equivalent to net settlement.
- IAS 28 Investments in Associates and Joint Ventures (2011) - (effective for annual periods beginning on or after 1 January 2013). IAS 28
(2011) supersedes IAS 28 (2008). IAS 28 (2011) makes the amendments to apply IFRS 5 to an investment, or a portion of an investment,
in an associate or a joint venture that meets the criteria to be classified as held for sale; and on cessation of significant influence or
joint control, even if an investment in an associate becomes an investment in a joint venture. The amendments have no impact on
financial statements of the Company.
The primary change resulting from this amendment is that the Company has grouped items presented in 'other comprehensive income' on
the basis of whether they are potentially reclassifiable to profit or loss subsequently (reclassification adjustment).
New standards, amendments to approved accounting standards and interpretations that are not yet effective
New standards, amendments to approved accounting standards and interpretations which became effective during the year ended
30 June 2013
There were certain new standards and amendments to the approved accounting standards which became effective during the year but are
considered not to be relevant or have any significant effect on the Company's operations and are, therefore, not disclosed in these financial
statements except for the amendment to IAS 1 'Presentation of financial statements' regarding 'other comprehensive income'.
Annual Report 2013 39

Notes to the Financial Statementsfor the year ended 30 June 2013
-
- Amendment to IAS 36 “Impairment of Assets” Recoverable Amount Disclosures for Non-Financial Assets (effective for annual periods
beginning on or after 1 January 2014). These narrow-scope amendments to IAS 36 Impairment of Assets address the disclosure of
information about the recoverable amount of impaired assets if that amount is based on fair value less costs of disposal.
- IAS 34 Interim Financial Reporting is amended to align the disclosure requirements for segment assets and segment liabilities in
interim financial reports with those in IFRS 8 Operating Segments. IAS 34 now requires the disclosure of a measure of total assets and
liabilities for a particular reportable segment. In addition, such disclosure is only required when the amount is regularly provided to
the chief operating decision maker and there has been a material change from the amount disclosed in the last annual financial
statements for that reportable segment.
- IFRIC 20 - Stripping cost in the production phase of a surface mining (effective for annual periods beginning on or after 1 January
2013). The interpretation requires production stripping cost in a surface mine to be capitalized if certain criteria are met. The
amendments have no impact on financial statements of the Company.
- IFRIC 21- Levies ‘an Interpretation on the accounting for levies imposed by governments’ (effective for annual periods beginning on or
after 1 January 2014). IFRIC 21 is an interpretation of IAS 37 Provisions, Contingent Liabilities and Contingent Assets. IAS 37 sets out
criteria for the recognition of a liability, one of which is the requirement for the entity to have a present obligation as a result of a past
event (known as an obligating event). The Interpretation clarifies that the obligating event that gives rise to a liability to pay a levy is
the activity described in the relevant legislation that triggers the payment of the levy.
- IAS 39 Financial Instruments: Recognition and Measurement - Novation of Derivatives and Continuation of Hedge Accounting
(Amendments to IAS 39) (effective for annual periods beginning on or after 1 January 2014). The narrow-scope amendments will allow
hedge accounting to continue in a situation where a derivative, which has been designated as a hedging instrument, is novated to
effect clearing with a central counterparty as a result of laws or regulation, if specific conditions are met (in this context, a novation
indicates that parties to a contract agree to replace their original counterparty with a new one).
- IAS 32 Financial Instruments: Presentation - is amended to clarify that IAS 12 Income Taxes applies to the accounting for income taxes
relating to distributions to holders of an equity instrument and transaction costs of an equity transaction. The amendment removes a
perceived inconsistency between IAS 32 and IAS 12.
IAS 1 Presentation of Financial Statements is amended to clarify that only one comparative period – which is the preceding period – is
required for a complete set of financial statements. If an entity presents additional comparative information, then that additional
information need not be in the form of a complete set of financial statements. However, such information should be accompanied by
related notes and should be in accordance with IFRS. Furthermore, it clarifies that the ‘third statement of financial position’, when
required, is only required if the effect of restatement is material to statement of financial position.
- IAS 16 Property, Plant and Equipment is amended to clarify the accounting of spare parts, stand-by equipment and servicing
equipment. The definition of ‘property, plant and equipment’ in IAS 16 is now considered in determining whether these items should
be accounted for under that standard. If these items do not meet the definition, then they are accounted for using IAS 2 Inventories.
2013 2012
Rupees Rupees
5 Share capital
Authorized share capital
Ordinary shares of Rs. 10 each
900,000,000 (2012: 900,000,000) voting shares 9,000,000,000 9,000,000,000
300,000,000 (2012: 300,000,000) non-voting shares 3,000,000,000 3,000,000,000
12,000,000,000 12,000,000,000
Preference shares of Rs. 10 each
300,000,000 (2012: 300,000,000) non-voting shares 3,000,000,000 3,000,000,000
15,000,000,000 15,000,000,000
Azgard Nine Limited40

Notes to the Financial Statementsfor the year ended 30 June 2013
Issued, subscribed and paid-up capital
Voting ordinary shares of Rs. 10 each
323,712,733 (2012: 323,712,733) shares fully paid in cash 3,237,127,330 3,237,127,330
62,548,641 (2012: 62,548,641) shares issued as
fully paid bonus shares 625,486,410 625,486,410
12,276,073 (2012: 12,276,073) shares issued as
consideration for machinery 122,760,730 122,760,730
50,811,992 (2012: 50,811,992) shares issued as
consideration on merger 508,119,920 508,119,920
4,493,494,390 4,493,494,390
Non-voting ordinary shares of Rs. 10 each
4,753,719 (2012: 4,753,719) shares fully paid in cash 47,537,190 47,537,190
768,712 (2012: 768,712) shares issued as fully
paid bonus shares 7,687,120 7,687,120
55,224,310 55,224,310
4,548,718,700 4,548,718,700
6 Reserves
Share premium 6.1 2,358,246,761 2,358,246,761
Merger reserve 6.2 105,152,005 105,152,005
Redemption of preference shares 6.3 661,250,830 661,250,830
Available for sale financial assets 6.4 293,004,257 4,591,515,736
3,417,653,853 7,716,165,332
6.1 Share premium
6.2 Reserve on merger
6.3 Preference shares redemption reserve
6.4 Available for sale financial assets
This represents excess of consideration received on issue of ordinary shares over face value of ordinary shares issued.
This represents reserve arising on merger of Nafees Cotton Mills Limited into Legler Nafees Denim Mills (presently Azgard Nine
Limited) on 19 December 2002.
This reserve has been created for redemption of preference shares issued by the Company as required to be created and maintained
under the terms of issue and section 85 of the Companies Ordinance, 1984.
This represents surplus on revaluation of investments classified as available for sale financial assets.
As at 30 June 2013, Jahangir Siddiqui & Co. Limited, an associated undertaking, holds 112,157,863 (2012: 112,157,863) ordinary shares of the
Company.
2013 2012
Rupees Rupees
2013 2012
Note Rupees Rupees
Annual Report 2013 41

Notes to the Financial Statementsfor the year ended 30 June 2013
2013 2012
Note Rupees Rupees
7 Surplus on revaluation of fixed assets
As at beginning of the year 3,596,275,883 3,724,869,810
Incremental depreciation transferred to accumulated loss (125,688,602) (128,593,927)
As at end of the year 3,470,587,281 3,596,275,883
8 Redeemable capital - secured
Term Finance Certificates - II 8.1 651,066,836 1,498,649,061
Term Finance Certificates - IV 8.2 1,083,768,528 2,498,000,000
Term Finance Certificates - V 8.3 527,682,637 823,620,000
Privately Placed Term Finance Certificates - VI 8.4 3,218,670,000 3,218,670,000
Privately Placed Term Finance Certificates 8.5 326,456,184 -
Privately Placed Term Finance Certificates 8.6 217,200,000 -
6,024,844,185 8,038,939,061
Accumulated deferred notional income 8.7 (856,485,545) (1,124,890,714)
Transaction cost 8.8 (57,772,282) (74,354,806)
5,110,586,358 6,839,693,541
Less: Amount shown as current liability
Amount payable within next twelve months (547,252,308) (2,559,131,063)
Amount due after 30 June 2013 8.9 - (1,551,127,282)
(547,252,308) (4,110,258,345)
4,563,334,050 2,729,435,196
Principal redemption
Return on TFCs
Six months KIBOR plus 1.00% per annum in 2010 - 2011
Six months KIBOR plus 1.25% per annum in 2012 - 2015
Six months KIBOR plus 1.75% per annum in 2016 onwards
Trustee
The principal redemption of TFC - II is structured to be in ten un-equal installments. During the year, first installement amounting to
Rs. 847.582 million was settled by the Company, also refer to note 27.2. Remaining nine installments are to be paid semi-annually
starting from 20 September 2013 and ending on 20 September 2017.
The issue carries return as per the following applicable mark-up rates, payable semi-annually;
8.1 These Term Finance Certificates - II ("TFC - II") have been issued by way of private placements and public subscription and are listed
on Karachi Stock Exchange (Guarantee) Limited. The total issue comprises of 428,734 certificates of Rs. 5,000 each. The terms and
conditions of the issue as per Amendment No. 1 to Master Restructuring and Intercreditor Agreement ("MRA-1") dated 11 April 2012
are as follows:
In order to protect the interests of TFC holders, Faysal Bank Limited has been appointed as trustee under a trust deed with power to
enforce the Company's obligations in case of default and to distribute the proceeds of any such enforcement, in accordance with the
terms of the trust deed and Master Restructuring and Intercreditor Agreement ("MRA").
Azgard Nine Limited42

Notes to the Financial Statementsfor the year ended 30 June 2013
Security
Principal redemption
Return on TFCs
Six months KIBOR plus 1.00% per annum in 2010 - 2011
Six months KIBOR plus 1.25% per annum in 2012 - 2015
Six months KIBOR plus 1.75% per annum in 2016 onwards
Trustee
Security
Principal redemption
Return on TFCs
Twelve months KIBOR plus 1.00% per annum from 18 May 2010 till 18 May 2011
Three months KIBOR plus 1.00% per annum from 18 May 2011 till 18 November 2011
Three months KIBOR plus 1.25% per annum from 18 November 2011 onwards
At the reporting date interest / mark-up amounting to Rs. 258.577 million was overdue. Refer to note 42.2.2 for details.
The principal redemption of TFC - IV is structured to be in ten un-equal installments. During the year, first installment amounting to
Rs. 1,414.231 million was settled by the Company, also refer to note 27.2. Remaining nine installments are to be paid semi-annually
starting from 04 December 2013 and ending on 04 December 2017.
The issue carries return as per the following applicable mark-up rates, payable semi-annually;
For detail of securities refer to note 8.10.
The issue carries return as per the following applicable mark-up rates, payable quarterly;
8.3 These Term Finance Certificates - V ("TFC - V") represent restructuring of various short term facilities amounting to Rs. 825.000 million.
The total issue comprised of 165,000 TFCs having face value of Rs. 5,000 each. The terms and conditions of the issue as per MRA-1
dated 11 April 2012 are as follows:
The principal redemption of TFC - V is structured to be in nine un-equal installments. During the year, first installement amounting to
Rs. 295.937 million was settled by the Company, also refer to note 27.2. Remaining eight installments are to be paid quarterly starting
from 18 February 2014 and ending on 18 November 2015.
In order to protect the interests of TFC holders, Pak Brunei Investment Company remains trustee of the issue, with power to enforce
the Company's obligations, in case of default and to distribute the proceeds of any such enforcement, in accordance with the terms
of the trust deed and MRA.
For detail of securities refer to note 8.10.
At the reporting date interest / mark-up amounting to Rs. 139.614 million was overdue. Refer to note 42.2.2 for details.
8.2 These Term Finance Certificates - IV ("TFC - IV") have been issued by way of private placements. The total issue comprises of 500,000
certificates of Rs. 5,000 each. The terms and conditions of the issue as per MRA-1 dated 11 April 2012 are as follows:
Annual Report 2013 43

Notes to the Financial Statementsfor the year ended 30 June 2013
Trustee
Security
Principal redemption
Call option
Return on PPTFCs
Trustee
Security
Principal redemption
8.5 These represent restructuring of outstanding principal amounting to Rs. 256.020 million and outstanding mark-up along with
preference dividend amounting to Rs. 70.436 million related to preference shares into fresh issue of Privately Placed Term Finance
Certificates ("PPTFCs") by way of Settlement Agreement ("the Agreement") between the Company and JS Global Capital Limited
dated 22 October 2012 effective from 19 October 2012. The total issue comprised of 12 PPTFCs having face value of Rs. 27.205
million each. The terms and conditions of the issue are as follows:
- Ranking mortgage charge over the mortgaged properties in the amount of up to Rs. 4,666.667 million
The Company shall be allowed to call the PPTFC's in full or in part. Call option will be exercisable at any time after the expiry of one
year from the issue date and upon giving to the TFC holders not less than thirty days notice in writing, to redeem on the following
redemption date.
At the reporting date interest / mark-up amounting to Rs. 91.921 million was overdue. Refer to note 42.2.2 for details.
In order to protect the interests of TFC holders, Faysal Bank Limited has been appointed as trustee under a trust deed, with power to
enforce the Company's obligations, in case of default and to distribute the proceeds of any such enforcement, in accordance with
the terms of the trust deed and MRA.
The issue is secured by:
The issue carries nil return (also refer to note 8.7).
In order to protect the interests of TFC holders, Faysal Bank Limited has been appointed as trustee under a trust deed, with power to
enforce the Company's obligations, in case of default and to distribute the proceeds of any such enforcement, in accordance with
the terms of the trust deed and MRA.
For detail of securities refer to note 8.10.
8.4 This represent restructuring of outstanding mark-up amounting to Rs. 3,218.670 million related to long term debts and short term
borrowings till 31 March 2012. The total issue comprises of 643,734 TFCs having face value of Rs. 5,000 each. The terms and
conditions of the issue are as follows:
The principal redemption of TFCs is structured to be in seven unequal semi annual installments starting from 31 March 2014 and
ending on 31 March 2017.
- Ranking hypothecation charge in favor of the Trustee over the hypothecated assets in the amount of up to Rs. 4,666.667
million; and
The principal redemption of PPTFCs is structured to be in twelve equal installments amounting to Rs. 27.205 million each.
Installments are to be paid semi-annually starting from 19 April 2015 and ending on 19 October 2020.
Azgard Nine Limited44

Notes to the Financial Statementsfor the year ended 30 June 2013
Return on PPTFCs
The issue carries a fixed mark-up rate at 11% per annum.
Trustee
Security
Principal redemption
Return on PPTFCs
Trustee
Security
In order to protect the interests of PPTFC holders, JS Bank Limited has been appointed as Trustee under a Trust Deed for the issue of
PPTFCs entered on 23 October 2012, with power to enforce the Company's obligations, in case of default and to distribute the
proceeds of any such enforcement, in accordance with the terms of the Trust Deed.
The issue is secured by personal Guarantee of Sponsor Director.
8.6 These represent restructuring of outstanding principal amounting to Rs. 170.132 million and outstanding mark-up along with
preference dividend amounting to Rs. 47.068 million related to preference shares into fresh issue of Privately Placed Term Finance
Certificates ("PPTFCs") by way of Settlement Agreement ("the Agreement") between the Company and Lenders dated 22 October
2012 effective from 19 October 2012. The total issue comprised of 21,720 PPTFCs having face value of Rs. 10,000 each. The terms and
conditions of the issue are as follows:
The principal redemption of PPTFCs is structured to be in twelve equal installments amounting to Rs. 18.100 million each.
Installments are to be paid semi-annually starting from 19 April 2015 and ending on 19 October 2020.
The issue is secured by personal Guarantee of Sponsor Director.
The issue carries a fixed mark-up rate at 11% per annum.
In order to protect the interests of PPTFC holders, JS Bank Limited has been appointed as Trustee under a Trust Deed for the issue of
PPTFCs entered on 23 October 2012, with power to enforce the Company's obligations, in case of default and to distribute the
proceeds of any such enforcement, in accordance with the terms of the Trust Deed.
8.7 This represents the difference between amortized cost and face value of zero-coupon Privately Placed Term Finance Certificates - VI,
with five year maturity (refer to note 8.4). Amortized cost has been determined using effective interest rate of 13.23% per annum
being the weighted average rate of return on redeemable capital. Movement is as follows:
Deferred notional income
As at beginning of the year 1,124,890,714 -
Occurred during the year - 1,189,908,326
Amortized during the year 35 (268,405,169) (65,017,612)
As at end of the year 856,485,545 1,124,890,714
2013 2012
Note Rupees Rupees
Annual Report 2013 45

8.8 Transaction costs
As at beginning of the year 74,354,806 86,964,537
Amortized during the year 35 (16,582,524) (12,609,731)
As at end of the year 57,772,282 74,354,806
8.10 Common security
-
2013 2012
Note Rupees Rupees
9 Long term finances - secured
United Bank Limited 9.1 - 75,000,000
National Bank of Pakistan 9.2 - 1,000,000,000
Deutsche Investitions - Und MBH (Germany) 9.3 907,054,269 1,422,000,000
Saudi Pak Industrial and Agricultural
Company Limited 9.4 43,251,155 100,000,000
HSBC Bank (Middle East) Limited 9.5 255,602,579 272,113,408
Citi Bank N.A (Pakistan) 9.6 567,539,466 567,539,466
1,773,447,469 3,436,652,874
Transaction costs 9.7 (21,944,566) (28,254,867)
1,751,502,903 3,408,398,007
Less: Amount shown as current liability
Amount payable within next twelve months (104,784,705) (1,936,345,512)
Amount due after 30 June 2013 9.8 - (1,472,052,495)
(104,784,705) (3,408,398,007)
1,646,718,198 -
9.1
9.2
8.9 The Company during the year, as well as in previous year could not make certain interest / mark-up payments on due dates and
further remained non-compliant with certain financial and other covenants imposed by the lenders as a result of which the entire
redeemable capital was classified as current in the year ended 30 June 2012. However, as at the reporting date, the Company has
classified redeemable capital in accordance with the repayment schedule for reasons fully explained in note 2.3.
Personal Guarantee of Sponsor Director.
At the reporting date interest / mark-up amounting to Rs. 5.683 million was overdue. Refer to note 42.2.2 for details.
The finance has been settled during the year by the Company. Also refer to note 27.2.
At the reporting date interest / mark-up amounting to Rs. 77.940 million was overdue. Refer to note 42.2.2 for details.
The finance has been settled during the year by the Company. Also refer to note 27.2.
- First charge in favor of National Bank of Pakistan, as Security trustee for the benefit of the Financers, on all present and
future assets and properties of the Company.
2013 2012
Note Rupees Rupees
Notes to the Financial Statementsfor the year ended 30 June 2013
Redeemable capital, long term finances except for TFC - VI and PPTFCs and short term borrowings have been secured by way of
common security which is as follows:
Azgard Nine Limited46

Notes to the Financial Statementsfor the year ended 30 June 2013
Six months EURIBOR plus 3.25% per annum till date of sale of AGL
Three months EURIBOR plus 0.75% per annum from date of sale of AGL to 14 July 2015
Three months EURIBOR plus 1.00% per annum from 15 July 2015 onwards
As per rescheduling agreement the finance carries mark-up as per the following applicable mark-up rates, payable quarterly:
Six months KIBOR plus 1.25% per annum in 2013 onwards
As per rescheduling agreement the finance carries mark-up as per the following applicable mark-up rates, payable semi-annually:
In addition to the above, additional interest of 2% per annum will be levied if principal and mark-up are not paid on due dates.
9.3 This represents Euros 15 million obtained from Deutsche Investitions - Und MBH (Germany) (''DEG'') to finance the setup of new textile
and apparel project. In context of the overall debt restructuring of the Company, the finance was rescheduled in the previous year by
way of MRA-1 dated 11 April 2012. As per the rescheduling terms, the loan is payable in twenty-one un-equal installments. During the
year, first installment amounting to Rs. 641.221 million was settled by the Company. Also refer to note 27.2. Remaining twenty
installments are to be paid quarterly starting from 15 July 2015. For detail of securities refer to note 8.10.
As per rescheduling agreement, the finance carries mark-up as per the following applicable mark-up rates, payable quarterly:
9.4 The finance has been obtained from Saudi Pak Industrial and Agricultural Company Limited for long term working capital
requirements. As per MRA - 1 dated 11 April 2012, loan is payable in eighteen un-equal installments. During the year, first installment
amounting to Rs. 56.749 million was settled by the Company. Also refer to note 27.2. Remaining seventeen installments are to be
paid quarterly starting from 13 November 2013 and ending on 13 November 2017. For detail of securities refer to note 8.10.
Six months KIBOR plus 1.00% per annum in 2010 - 2012
Six months KIBOR plus 1.00% per annum in 2010 - 2012
Six months KIBOR plus 1.25% per annum in 2013 onwards
Six months KIBOR plus 1.00% per annum in 2010 - 2011
At the reporting date interest / mark-up amounting to Rs. 10.361 million was overdue. Refer to note 42.2.2 for details.
9.5 The finance has been obtained from HSBC Bank Middle East Limited for long term working capital requirements. As per MRA-1 dated
11 April 2012, the loan is payable in nine un-equal installments. During the year, first installment amounting to Rs. 7.511 million was
settled by the Company. Also refer to note 27.2. Remaining eight installments are to be paid semi-annually starting from 01 May 2013
and ending on 01 November 2016. For detail of securities refer to note 8.10.
Six months KIBOR plus 1.25% per annum in 2012 - 2015
Six months KIBOR plus 1.75% per annum in 2016 onwards
As per rescheduling agreement the finance carries mark-up as per the following applicable mark-up rates, payable semi-annually:
At the reporting date principal amounting to Rs. 6.000 million and interest / mark-up amounting to Rs. 34.758 million was overdue.
Refer to note 42.2.2 for details.
At the reporting date interest / mark-up amounting to Rs. 72.823 million was overdue. Refer to note 42.2.2 for details.
In addition to the above, additional interest of 5.00% per annum will be levied if mark-up is not paid on due dates.
At the reporting date interest amounting to Rs. 15.963 million was overdue. Refer to note 42.2.2 for details.
9.6 As part of the overall debt restructuring, the finance was converted from various short term borrowings. As per MRA-1 dated 11 April
2012, the loan is payable in six un-equal installments. Installment are to be paid semi-annually starting from 01 May 2014 and ending
on 01 November 2016. For detail of securities refer to note 8.10.
Annual Report 2013 47

Notes to the Financial Statementsfor the year ended 30 June 2013
2013 2012
Note Rupees Rupees
9.7 Transaction costs
As at beginning of the year 28,254,867 43,430,609
Amortized during the year 35 (6,310,301) (15,175,742)
As at end of the year 21,944,566 28,254,867
10 Liabilities against assets subject to finance lease -secured
2013 2012
Note Rupees Rupees
Present value of minimum lease payments 10.1 & 10.2 32,586,801 36,436,705
Current maturity presented under current liabilities 11 (32,586,801) (12,415,966)
- 24,020,739
2013 2012
Note Rupees Rupees
Not later than one year 40,918,058 17,050,310
Later than one year but not later than five years - 27,769,672
Total future minimum lease payments 40,918,058 44,819,982
Finance charge allocated to future periods (8,331,257) (8,383,277)
Present value of future minimum lease payments 32,586,801 36,436,705
Not later than one year 11 (32,586,801) (12,415,966)
Later than one year but not later than five years - 24,020,739
9.8 The Company during the year, as well as in previous year could not make certain principal and interest / mark-up payments on due
dates and further remained non-compliant with certain financial and other covenants imposed by the lenders as a result of which the
entire long term finance was classified as current liability in the year ended 30 June 2012. However, as at the reporting date, the
Company has classified long term loans in accordance with the repayment schedule for reasons fully explained in note 2.3.
The amounts of future payments for the lease and the period in which the lease payments will become due are as follows:
10.1 These represent plant and machinery, and vehicles acquired under finance lease arrangements and are secured by specific charge on
leased assets, joint ownership of leased assets with the lender and lien over documents of title. Rentals are payable monthly /
quarterly. The leases are priced at rates ranging from three months to twelve months KIBOR plus 2.00% to 4.00% (2012: three months
to twelve months KIBOR plus 2.00% to 4.00%) per annum. Under the terms of agreement, taxes, repairs, replacements and insurance
costs in respect of assets subject to finance lease are borne by the Company. The Company also has the option to acquire these assets
at the end of the respective lease terms and intends to exercise the option. The Company during the current year remained unable to
make repayments in respect of lease liabilities as a result of which the Lessor has demanded immediate repayment of outstanding
lease installments and return of the leased assets. Consequently, all liability in respect of lease has been classified as current liability.
10.2 The amount of future payments under the lease arrangements and the period in which these payments will become due are as
follows:
Azgard Nine Limited48

Notes to the Financial Statementsfor the year ended 30 June 2013
11 Current portion of non-current liabilities
Preference shares of Rs. 10 each (2012: Rs. 10 each) 11.1 148,367,255 574,518,935
Redeemable capital 8 547,252,308 4,110,258,345
Long term finances 9 104,784,705 3,408,398,007
Liabilities against assets subject to finance lease 10.2 32,586,801 12,415,966
832,991,069 8,105,591,253
-
12 Short term borrowings
Secured
2013 2012
Note Rupees Rupees
2013 2012
Note Rupees Rupees
Running finance 12.1 1,076,169,156 1,832,049,760
Term loan 12.1 3,550,598,236 5,006,610,401
Morabaha / LPO 12.1 192,419,450 198,626,000
Bridge finance 12.2 - 1,119,457,014
4,819,186,842 8,156,743,175
The Company during the year, has settled its liability towards preference shares through conversion into a fresh issue of PPTFCs
amounting to Rs. 426.152 million. Refer to note 8.5 and note 8.6.
At the reporting date, entire outstanding amount of preference shares was overdue. Refer to note 42.2.2 for details.
These represent short term finances utilized under interest / mark-up arrangements from banking companies and financial institutions.
12.1 These facilities have been obtained from various banking companies and financial institutions for working capital requirements and
are secured by Common Security (refer to note 8.10), lien over documents of title of imported goods, lien over firm export orders,
trust receipts, demand promissory notes, counter guarantees, pledge of stocks, ranking charge amounting to Rs. 750 million on
current and future assets of the Company.
Mark-up on these finances is payable quarterly / semi-annually. Local currency finances carry mark-up at rates ranging from one to
twelve months KIBOR plus 1% per annum (2012: one to six months KIBOR plus 1% per annum). Foreign currency finances carry mark
up at rates ranging from LIBOR / EURIBOR of matching tenor plus 2% to 6.5% per annum (2012: LIBOR of matching tenor plus 2% to
6.5% per annum). Mark-up on pre / post shipment finances refinanced by the State Bank of Pakistan is payable at SBP refinance rate
of 8.20% to 10.00% per annum plus banks' spread of 1% per annum (2012: 10% per annum plus banks' spread of 1% per annum).
11.1 Preference shares were issued by the Company during year ended 30 September 2004 and are non-voting, non-participatory, partly
convertible and cumulative.
These were redeemable, subject to provisions of section 85 of Companies Ordinance, 1984 as follows:
- First redemption: 50% of the issued amount at the end of fifth year from date of issue, i.e. 24 September 2009.
The Company intends to settle its remaining liability towards preference shares through conversion into a fresh issue of Financial
Instruments, the terms of which are being negotiated with the majority of the investors and the process is expected to materialize in
due course.
Second redemption: 50% of the issued amount at the end of sixth year from date of issue, i.e. 24 September 2010.
Annual Report 2013 49

Notes to the Financial Statementsfor the year ended 30 June 2013
13 Trade and other payables
14 Due to Agritech Limited - unsecured, considered good
15 Interest / mark-up accrued on borrowings
13.3 Interest on outstanding liability towards Provident Fund Trust is charged at 16.10% (2012: 16.10%) per annum.
12.3 The aggregate available short term funded facilities amounts to Rs. 7,149 million (2012: Rs. 10,308 million) out of which Rs. 2,338
million (2012: Rs. 1,474 million) remained unavailed as at the reporting date. Limits available for opening of letters of credit amounts
to Rs. 521 million (2012: Rs. 2,107 million) of which the limits remaining unutilized as at the reporting date amounts to Rs. 128
million (2012: Rs. 144 million).
13.2 At the reporting date bills amounting to Rs. 274.462 million and interest / mark-up amounting to Rs. 41.309 million were overdue.
Refer to note 42.2.2 for details.
At the reporting date interest / mark-up amounting to Rs. 68.753 million was overdue. Refer to note 42.2.2 for details.
Morabaha / LPO carry mark-up at rates ranging from six to twelve months KIBOR plus 1% to 3% per annum (2012: six to twelve
months KIBOR plus 1% to 3% per annum). Letters of credit / guarantee carry commission at rates ranging from 0.10% to 0.15% per
quarter (2012: 0.1% to 0.15% per quarter). Certain finances also carry a penalty interest / mark-up.
This represented short term loan obtained from AGL, which was settled during the year. Also refer to note 27.2.
During the year, an amount of Rs. 748.351 million and Rs. 1,153.117 million in respect of running finance and term loan respectively
was settled by the Company. Also refer to note 27.2.
12.2 The finance has been settled during the year by the Company. Also refer to note 27.2.
13.1 During the year, an amount of Rs. 1,560.869 million was settled by the Company in respect of bills payable. Also refer to note 27.2.
2013 2012
Note Rupees Rupees
2013 2012
Rupees Rupees
Redeemable capital 587,769,949 388,702,771
Long term finances 243,861,238 304,019,043
Short term borrowings 670,071,067 664,634,827
Payable to a related party - 68,579,206
1,501,702,254 1,425,935,847
Trade creditors 1,615,111,688 1,499,989,313
Bills payable 13.1 & 13.2 385,516,037 1,755,448,679
Accrued liabilities 303,875,359 519,327,523
Advances from customers 64,724,636 102,516,590
Payable to Provident Fund Trust 13.3
13.4
83,897,625 96,248,979
Workers' Profit Participation Fund 55,243,056 47,015,366
Tax deducted at source 10,492,869 10,941,701
Derivative financial liability - 7,424,080
Other payables 7,384,370 10,152,164
2,526,245,640 4,049,064,395
At the reporting date interest / mark-up amounting to Rs. 93.158 million was overdue in respect of running finance. Further,
principal amounting to Rs. 232.602 million and interest / mark-up amounting to Rs. 311.618 million was overdue in respect of term
loan. Refer to note 42.2.2 for details.
13.4 Interest on outstanding liability towards Workers’ Profit Participation Fund is charged at 17.50% (2012:17.50%)
Azgard Nine Limited50

Notes to the Financial Statementsfor the year ended 30 June 2013
16 Dividend payable
Unclaimed dividend on ordinary shares 4,002,037 4,002,037
Dividend payable on preference shares 16.1 9,413,535 28,727,041
13,415,572 32,729,078
17 Contingencies and commitments
17.1 Contingencies
17.1.5
17.1.6
2013
2013
2012
2012
Note
Note
Rupees
Rupees
Rupees
Rupees
17.2 Commitments
17.2.1 Commitments under irrevocable letters of credit for:
- purchase of stores, spare and loose tools - 30,507,298
- purchase of machinery - 14,639,280
- purchase of raw material 43,889,430 76,726,497
43,889,430 121,873,075
17.2.2 Commitments for capital expenditure 705,600 3,236,108
18 Property, plant and equipment
Operating fixed assets 18.1 12,952,810,186 13,387,681,719
Capital work in progress 18.2 206,892 7,535,550
12,953,017,078 13,395,217,269
Contingencies related to tax matters are referred to note 36 to the financial statements.
17.1.1 Several ex-employees of AGL have filed a petition against the Company demanding terminal benefits including those under the
golden hand shake scheme. The claim, valued at Rs. 8.0 million, is pending before the Honorable Lahore High Court and the
Company expects a favorable outcome.
17.1.3 Counter guarantees given by the Company to its bankers as at the reporting date amount to Rs. 167.605 million (2012: Rs. 169.73
million).
17.1.4 No redemption of preference shares has been made up to the reporting date in respect of second and final redemption, whereas,
only partial redemption has been carried out in respect of first redemption. During the year the Company has partially converted
preference shares and preference dividend payable into PPTFCs, as referred to in note 8.5 and 8.6.
16.1 Preference dividend was due for payment on 21 November 2010, however no payments have been made up to the reporting date.
During the year the Company has partially adjusted the preference dividend against the new issue of PPTFCs. The management
intends to settle this amount along with the settlement of outstanding overdue preference shares.
17.1.2 The Company has issued indemnity bonds amounting to Rs. 212.437 million (2012: Rs. 641 million) in favour of Collector of Customs
and Sales Tax department in lieu of levies under various statutory notifications and these are likely to be released after the
fulfillment of the terms of related notifications.
Foreign bills discounted as at reporting date aggregated to Rs. 1,937.219 million (2012: 1,999.142 million).
Annual Report 2013 51

No
tes
to t
he
Fin
an
cia
l Sta
tem
en
tsfo
r th
e ye
ar
end
ed 3
0 J
un
e 2
01
3
18
.1O
pe
rati
ng
fix
ed
ass
ets
Pa
rtic
ula
rs
As
at
01
Ju
ly 2
01
2A
dd
itio
ns
Tra
nsf
ers
Dis
po
sals
As
at
30
Ju
ne
20
13
Ow
ne
d a
ss
ets
Fre
eh
old
lan
d
- co
st5
58
,01
0,0
25
--
-5
58
,01
0,0
25
- re
va
lua
tio
n7
19
,72
4,9
75
--
-7
19
,72
4,9
75
1,2
77
,73
5,0
00
--
-1
,27
7,7
35
,00
0
Bu
ildin
gs
on
fre
eh
old
lan
d
- co
st2
,68
0,2
59
,98
37
,65
5,1
66
--
2,6
87
,91
5,1
49
2.5
- re
va
lua
tio
n7
03
,53
9,2
95
--
-7
03
,53
9,2
95
2.5
3,3
83
,79
9,2
78
7,6
55
,16
6-
-3
,39
1,4
54
,44
4
Pla
nt
an
d m
ach
ine
ry
- co
st9
,61
1,2
60
,72
75
1,8
44
,03
92
,57
8,5
00
-9
,66
5,6
83
,26
62
- 5
- re
va
lua
tio
n3
,73
3,3
96
,59
8-
--
3,7
33
,39
6,5
98
2 -
5
13
,34
4,6
57
,32
55
1,8
44
,03
92
,57
8,5
00
-1
3,3
99
,07
9,8
64
Furn
itu
re, f
ixtu
res
an
d o
ffic
e
eq
uip
me
nt
19
7,0
56
,78
51
,97
1,9
55
-(1
03
,00
0)
19
8,9
25
,74
01
0
Ve
hic
les
79
,82
6,9
74
1,1
25
,80
09
,31
4,2
77
(7,9
12
,02
5)
82
,35
5,0
26
20
Too
ls a
nd
eq
uip
me
nt
39
0,9
38
,70
11
2,4
71
,59
3-
-4
03
,41
0,2
94
10
Ele
ctri
cal i
nst
all
ati
on
s1
72
,36
5,3
83
8,0
49
,26
5-
-1
80
,41
4,6
48
10
18
,84
6,3
79
,44
68
3,1
17
,81
81
1,8
92
,77
7(8
,01
5,0
25
)1
8,9
33
,37
5,0
16
As
se
ts s
ub
jec
t to
fin
an
ce
le
as
e
Pla
nt
an
d m
ach
ine
r y2
18
,02
3,4
44
-(2
,57
8,5
00
)-
21
5,4
44
,94
42
- 5
Ve
hic
les
10
,81
3,1
67
-(9
,31
4,2
77
)(8
16
,20
0)
68
2,6
90
20
22
8,8
36
,61
1-
(11
,89
2,7
77
)(8
16
,20
0)
21
6,1
27
,63
4
19
,07
5,2
16
,05
78
3,1
17
,81
8-
(8,8
31
,22
5)
19
,14
9,5
02
,65
030
Ju
ne
20
13
Co
st /
re
va
lue
d a
mo
un
tD
ep
reci
ati
on
Ra
te
%
55
8,0
10
,02
5
71
9,7
24
,97
5
1,2
77
,73
5,0
00
2,1
10
,87
6,1
09
52
9,1
17
,79
2
2,6
39
,99
3,9
01
6,2
37
,07
1,6
77
2,2
21
,74
4,5
16
8,4
58
,81
6,1
93
92
,23
5,9
82
21
,52
1,4
37
25
0,0
11
,77
9
91
,77
4,7
04
12
,83
2,0
88
,99
6
12
0,5
02
,51
3
21
8,6
77
12
0,7
21
,19
0
12
,95
2,8
10
,18
6
Ru
pe
es
Ne
t b
oo
k v
alu
e
as
at
30
Ju
ne
20
13
As
at
30
Ju
ne
20
13 - - -
57
7,0
39
,04
0
17
4,4
21
,50
3
75
1,4
60
,54
3
3,4
28
,61
1,5
89
1,5
11
,65
2,0
82
4,9
40
,26
3,6
71
10
6,6
89
,75
8
60
,83
3,5
89
15
3,3
98
,51
5
88
,63
9,9
44
6,1
01
,28
6,0
20
94
,94
2,4
31
46
4,0
13
95
,40
6,4
44
6,1
96
,69
2,4
64
Ru
pe
es
Ad
just
me
nts
/
(dis
po
sals
) /
tra
nsf
ers
- - - - - -
65
4,5
44
-
65
4,5
44
(36
,67
1)
26
5,4
20
- -
88
3,2
93
(65
4,5
44
)
(5,0
71
,94
2)
(5,7
26
,48
6)
(4,8
43
,19
3)
Ru
pe
es
Fo
r th
e y
ea
r - - -
53
,61
5,6
49
13
,95
5,4
74
67
,57
1,1
23
27
6,6
00
,94
9
11
1,7
33
,12
5
38
8,3
34
,07
4
10
,15
2,8
87
4,9
26
,86
1
26
,89
1,7
47
9,8
67
,43
1
50
7,7
44
,12
3
5,7
16
,43
9
54
0,7
57
6,2
57
,19
6
51
4,0
01
,31
9
Ru
pe
es
As
at
01
Ju
ly 2
01
2 - - -
52
3,4
23
,39
1
16
0,4
66
,02
9
68
3,8
89
,42
0
3,1
51
,35
6,0
96
1,3
99
,91
8,9
57
4,5
51
,27
5,0
53
96
,57
3,5
42
55
,64
1,3
08
12
6,5
06
,76
8
78
,77
2,5
13
5,5
92
,65
8,6
04
89
,88
0,5
36
4,9
95
,19
8
94
,87
5,7
34
5,6
87
,53
4,3
38
Ru
pe
es
Ru
pe
es
Ru
pe
es
Ru
pe
es
Ru
pe
es
Ru
pe
es
Azgard Nine Limited52

No
tes
to t
he
Fin
an
cia
l Sta
tem
en
tsfo
r th
e ye
ar
end
ed 3
0 J
un
e 2
01
3
18
.1.1
Op
era
tin
g f
ixe
d a
sse
ts
Pa
rtic
ula
rs
Ow
ned
ass
ets
Fre
eh
old
lan
d
- co
st
- re
va
lua
tio
n
Bu
ildin
gs
on
fre
eh
old
lan
d
- co
st
- re
va
lua
tio
n
Pla
nt
an
d m
ach
ine
ry
- co
st
- re
va
lua
tio
n
Furn
itu
re, f
ixtu
res
an
d o
ffic
e
eq
uip
me
nt
Ve
hic
les
Too
ls a
nd
eq
uip
me
nt
Ele
ctri
cal i
nst
all
ati
on
s
Ass
ets
sub
ject
to
fin
an
ce le
ase
Pla
nt
an
d m
ach
ine
ry
Ve
hic
les
As
at
01
Ju
ly 2
01
1A
dd
itio
ns
Tra
nsf
ers
Dis
po
sals
As
at
30
Ju
ne
20
12
55
8,0
10
,02
5-
--
55
8,0
10
,02
5
71
9,7
24
,97
5-
--
71
9,7
24
,97
5
1,2
77
,73
5,0
00
--
-1
,27
7,7
35
,00
0
2,6
56
,34
8,6
96
23
,91
1,2
87
--
2,6
80
,25
9,9
83
2.5
70
3,5
39
,29
5-
--
70
3,5
39
,29
52
.5
3,3
59
,88
7,9
91
23
,91
1,2
87
--
3,3
83
,79
9,2
78
9,5
90
,05
8,3
42
36
,84
3,4
58
-(1
5,6
41
,07
3)
9,6
11
,26
0,7
27
2 -
5
3,7
43
,28
6,9
55
--
(9,8
90
,35
7)
3,7
33
,39
6,5
98
2 -
5
13
,33
3,3
45
,29
73
6,8
43
,45
8-
(25
,53
1,4
30
)1
3,3
44
,65
7,3
25
19
2,4
99
,78
74
,61
6,9
98
-(6
0,0
00
)1
97
,05
6,7
85
10
58
,07
8,7
29
1,6
83
,45
54
1,2
49
,73
1(2
1,1
84
,94
1)
79
,82
6,9
74
20
37
7,1
32
,49
21
3,8
06
,20
9-
-3
90
,93
8,7
01
10
14
6,2
48
,07
62
6,1
17
,30
7-
-1
72
,36
5,3
83
10
18
,74
4,9
27
,37
21
06
,97
8,7
14
41
,24
9,7
31
(46
,77
6,3
71
)1
8,8
46
,37
9,4
46
21
8,0
23
,44
4-
--
21
8,0
23
,44
42
- 5
52
,06
2,8
98
-(4
1,2
49
,73
1)
-1
0,8
13
,16
72
0
27
0,0
86
,34
2-
(41
,24
9,7
31
)-
22
8,8
36
,61
1
19
,01
5,0
13
,71
41
06
,97
8,7
14
-(4
6,7
76
,37
1)
19
,07
5,2
16
,05
7
30
Ju
ne
20
12
De
pre
cia
tio
nC
ost
/ r
ev
alu
ed
am
ou
nt
Ra
te
%
55
8,0
10
,02
5
71
9,7
24
,97
5
1,2
77
,73
5,0
00
2,1
56
,83
6,5
92
54
3,0
73
,26
6
2,6
99
,90
9,8
58
6,4
59
,90
4,6
31
2,3
33
,47
7,6
41
8,7
93
,38
2,2
72
10
0,4
83
,24
3
24
,18
5,6
66
26
4,4
31
,93
3
93
,59
2,8
70
13
,25
3,7
20
,84
2
12
8,1
42
,90
8
5,8
17
,96
9
13
3,9
60
,87
7
13
,38
7,6
81
,71
9
Ru
pe
es
Ne
t b
oo
k v
alu
e
as
at
30
Ju
ne
20
12
As
at
30
Ju
ne
20
12 - - -
52
3,4
23
,39
1
16
0,4
66
,02
9
68
3,8
89
,42
0
3,1
51
,35
6,0
96
1,3
99
,91
8,9
57
4,5
51
,27
5,0
53
96
,57
3,5
42
55
,64
1,3
08
12
6,5
06
,76
8
78
,77
2,5
13
5,5
92
,65
8,6
04
89
,88
0,5
36
4,9
95
,19
8
94
,87
5,7
34
5,6
87
,53
4,3
38
Ru
pe
es
Ad
just
me
nts
/
(dis
po
sals
) /
tra
nsf
ers - - - - - -
(11
,04
6,4
52
)
(6,9
85
,02
9)
(18
,03
1,4
81
)
(17
,24
8)
14
,02
6,0
36
- -
(4,0
22
,69
3)
-
(25
,69
3,9
19
)
(25
,69
3,9
19
)
(29
,71
6,6
12
)
Ru
pe
es
For
the
ye
ar - - -
54
,82
8,0
42
13
,95
5,4
75
68
,78
3,5
17
29
3,1
84
,84
8
11
1,7
33
,12
5
40
4,9
17
,97
3
10
,90
9,3
76
4,3
48
,19
9
28
,92
2,0
35
9,2
77
,65
2
52
7,1
58
,75
2
6,0
08
,75
9
4,2
03
,13
8
10
,21
1,8
97
53
7,3
70
,64
9
Ru
pe
es
As
at
01
Ju
ly 2
01
1 - - -
46
8,5
95
,34
9
14
6,5
10
,55
4
61
5,1
05
,90
3
2,8
69
,21
7,7
00
1,2
95
,17
0,8
61
4,1
64
,38
8,5
61
85
,68
1,4
14
37
,26
7,0
73
97
,58
4,7
33
69
,49
4,8
61
5,0
69
,52
2,5
45
83
,87
1,7
77
26
,48
5,9
79
11
0,3
57
,75
6
5,1
79
,88
0,3
01
Ru
pe
es
Ru
pe
es
Ru
pe
es
Ru
pe
es
Ru
pe
es
Ru
pe
es
Annual Report 2013 53

Notes to the Financial Statementsfor the year ended 30 June 2013
18.1.2 Disposal of property, plant and equipment
Vehicles - owned
Suzuki Mehran (LEC-09-6098)
Suzuki Mehran (LEC-09-6449)
Honda City (LEB-09-6904)
Suzuki Mehran (LEC-09-6103)
Honda City (LEA-10-1394)
Suzuki Mehran (LEA-08-9392)
Suzuki Cultus (LED-08-7720)
Suzuki Cultus (LEE-08-8430)
Suzuki Mehran (LEC-09-6096)
Suzuki Mehran (LEC-09-6097)
Suzuki Cultus (LEE-08-1207)
Vehicles - leased
Suzuki Cultus (LEC-09-4567)
Office equipment
Lenovo laptop
Lenovo laptop
2013
2012
Company policy
Company policy
Company policy
Company policy
Company policy
Company policy
Company policy
Company policy
Company policy
Company policy
Company policy
Company policy
Company policy
Company policy
Mode ofdisposal
Employee
Employee
Employee
Employee
Employee
Employee
Employee
Employee
Employee
Employee
Employee
Employee
Employee
Employee
Particulars of buyer
2013
(65,460)
(41,637)
(34,839)
(49,599)
(165,952)
(34,541)
(77,592)
(94,751)
(37,741)
(95,650)
(76,834)
(774,596)
(57,577)
(23,640)
(21,889)
(45,529)
(877,702)
(709,228)
Loss ondisposal
Rupees
222,900
227,471
592,400
222,250
513,507
106,000
170,105
178,922
222,250
139,156
164,168
2,759,129
330,400
11,000
9,800
20,800
3,110,329
16,350,533
Saleproceeds
Rupees
288,360
269,108
627,239
271,849
679,459
140,541
247,697
273,673
259,991
234,806
241,002
3,533,725
387,977
34,640
31,689
66,329
3,988,031
17,059,761
Net bookvalue
Rupees
(267,890)
(289,570)
(804,761)
(280,151)
(603,309)
(274,242)
(404,303)
(408,327)
(297,259)
(319,819)
(428,669)
(4,378,300)
(428,223)
(19,360)
(17,311)
(36,671)
(4,843,194)
(29,716,610)
Accumulated
depreciation
Rupees
556,250
558,678
1,432,000
552,000
1,282,768
414,783
652,000
682,000
557,250
554,625
669,671
7,912,025
816,200
54,000
49,000
103,000
8,831,225
46,776,371
Cost
Rupees
2013 2012
Note Rupees Rupees
18.1.3 The depreciation charge for the year has been
allocated as follows:
Cost of sales 31 498,380,814 517,909,936
Administrative and general expenses 33 15,620,505 19,460,713
514,001,319 537,370,649
18.1.4 Revaluation of fixed assets
18.2 Capital work in progress
Land, building, and plant & machinery of the Company was revalued as at 28 December 2009 by a firm of independent valuers,
Consultancy Support & Services (Private) Limited.
Building
Plant and machinery
2013
As at
30 June 2013
69,228
137,664
206,892
Rupees
Transfers
(2,786,005)
(15,787,906)
(18,573,911)
Rupees
Additions
2,593,061
8,652,192
11,245,253
RupeesRupees
As at
01 July 2012
262,172
7,273,378
7,535,550
Building
Plant and machinery
2012
As at
30 June 2012
262,172
7,273,378
7,535,550
Rupees
Transfers
(15,383,639)
-
(15,383,639)
Rupees
Additions
15,645,811
7,273,378
22,919,189
RupeesRupees
As at
01 July 2011
-
-
-
Azgard Nine Limited54

Notes to the Financial Statementsfor the year ended 30 June 2013
2013 2012
Note Rupees Rupees
19 Intangible assets
Development costs 19.1 - -
Software 19.2 1,302,407 3,907,224
1,302,407 3,907,224
19.1 This represents expenditure on development of new products and processes to gain competitive advantage in the national and
international market.
2013 2012
Note Rupees Rupees
Cost
As at beginning of the year 87,853,404 87,853,404
Accumulated amortization
As at beginning of the year (87,853,404) (86,075,956)
Amortization for the year 31 - (1,777,448)
As at end of the year (87,853,404) (87,853,404)
- -
Rate of amortization 20% 20%
19.2
2013 2012
Note Rupees Rupees
Cost 13,024,081 13,024,081
Accumulated amortization
As at beginning of the year (9,116,857) (6,512,040)
Amortization for the year 33 (2,604,817) (2,604,817)
As at end of the year (11,721,674) (9,116,857)
1,302,407 3,907,224
Rate of amortization 20% 20%
This represents expenditure incurred on implementation of Oracle Financials Suite.
20 Long term investments
These represent investments in equity and debt securities. These have been classified as available for sale financial assets. Particulars of
investments are as follows:
Annual Report 2013 55

Notes to the Financial Statementsfor the year ended 30 June 2013
2013 2012
Note Rupees Rupees
Investments in related parties
Cost 2,891,100,557 2,891,100,557
Accumulated impairment
Opening balance (1,125,597,650) -
Charge during the year 34 (38,767,662) (1,125,597,650)
Accumulated impairment (1,164,365,312) (1,125,597,650)
20.1 1,726,735,245 1,765,502,907
Other investments
Cost 18,664 18,664
Fair value adjustment 12,557 (3,833)
20.2 31,221 14,831
1,726,766,466 1,765,517,738
20.1 Investments in related parties
Unquoted
20.1.1 Farital AB
14,700 ordinary shares with a capital
of Swedish Krona 260,150,100
Proportion of capital held: 100%
Activity: Textile and Apparel
Relationship: Parent - Subsidiary
Cost 2,625,026,049
Transferred 20.1.2 -
2,625,026,049
Accumulated impairment (1,125,597,650)
Transferred 20.1.2 -
(1,125,597,650)
20.1.4 1,499,428,399
20.1.2 Montebello s.r.l.
6,700,000 ordinary shares with a capital
of Euro 6,700,000
Proportion of capital held: 100%
Activity: Textile and Apparel
Relationship: Parent - Subsidiary
Cost 20.1.1 -
Accumulated impairment
Transferred 20.1.1 -
Charge during the year 34 -
Accumulated impairment -
20.1.4 -
2,625,026,049
(2,625,026,049)
-
(1,125,597,650)
1,125,597,650
-
-
2,625,026,049
(1,125,597,650)
(38,767,662)
(1,164,365,312)
1,460,660,737
Azgard Nine Limited56

Notes to the Financial Statementsfor the year ended 30 June 2013
20.1.3 Agritech Limited
53,259 Term Finance Certificates
of Rs. 5,000 each 20.1.5 266,074,508 266,074,508
(2012: 53,259 Term Finance Certificates of Rs. 5,000 each)
20.1.5 These represent Term Finance Certificates (”TFCs”) of Rs. 5,000 each issued by AGL and carry return at six months KIBOR
plus 1.75% and are redeemable in thirteen unequal semi-annual installments after a grace period of three years starting from 14
July 2013. Since 25,237 (2012: 25,237) number off TFCs out of total number of TFCs are pledged as security with providers of debt
finance, therefore these have been presented as long term investment.
20.1.4 During the year, 100% owned subsidiary of the Company, Farital AB has been dissolved. Farital AB was incorporated in order to
acquire 100% interest in Montebello s.r.l., owner of an Italian fabric and jeans brand. Consequent to dissolution of Farital AB, 100%
interest in Montebello s.r.l. has been transferred to the Company. The investment has been measured at fair value at Rs. 218.01
(2012: Rs. 223.80) per share. For basis of valuation, refer to note 42.4.1 to the financial statements.
2013 2012
Note Rupees Rupees
20.1.6
2013 2012
Note Rupees Rupees
20.2 Other investments
Quoted
Colony Mills Limited
4,332 (2012: 4,332) ordinary shares of Rs. 10 each
Market value Rs. 4.43 per share (2012: Rs. 1.72 per share)
Cost 8,664 8,664
Fair value adjustment 10,527 (1,213)
19,191 7,451
JS Value Fund Limited
1,000 (2012: 1,000) ordinary shares of Rs. 10 each
Market value Rs. 12.03 per share (2012: Rs. 7.38 per share)
Cost 10,000 10,000
Fair value adjustment 2,030 (2,620)
12,030 7,380
31,221 14,831
21 Long term deposits - unsecured, considered good
Utility companies and regulatory authorities 21.1 17,484,247 23,506,497
Financial institutions 21.2 6,993,740 6,523,996
24,477,987 30,030,493
21.1 These have been deposited with various utility companies and regulatory authorities. These are classified as 'loans and receivables'
under IAS 39 'Financial Instruments - Recognition and Measurement' which are required to be carried at amortized cost. However,
these, being held for an indefinite period with no fixed maturity date, are carried at cost as its amortized cost is impracticable to
determine.
Details of investments pledged as security are referred to in note 44 to the financial statements.
Annual Report 2013 57

Notes to the Financial Statementsfor the year ended 30 June 2013
21.2
22 Stores, spares and loose tools
Stores, spares and loose tools 130,970,353 335,048,870
Less: provision for slow moving and obsolete items 22.1 - (161,729,345)
130,970,353 173,319,525
22.1 Provision for slow moving and obsolete items
As at beginning of the year 161,729,345 -
Provision recognized during the year - 161,729,345
Less: provision written off (161,729,345) -
As at end of the year - 161,729,345
These have been deposited with various banking companies and financial institutions.
2013 2012
Note Rupees Rupees
22.2
2013 2012
Note Rupees Rupees
23 Stock in trade
Raw material 1,132,636,448 1,602,140,598
Work in process 706,429,440 1,126,493,487
Finished goods 401,964,652 376,974,302
Less: diminution in value of stock due to net realizable value 23.1 (29,887,439) (77,805,957)
2,211,143,101 3,027,802,430
23.1
23.2
2013 2012
Note Rupees Rupees
24 Trade receivables
Local
- secured 24.1 57,628,161 7,427,983
- unsecured, considered good 102,914,486 156,800,352
- unsecured, considered doubtful 24,597,754 12,240,583
185,140,401 176,468,918
Foreign
- secured 24.1 441,204,961 222,401,742
- unsecured, considered good 1,548,089,646 1,997,671,586
- unsecured, considered doubtful 429,659,084 140,646,800
2,418,953,691 2,360,720,128
2,604,094,092 2,537,189,046
Less: provision against trade receivables 24.2 (454,256,837) (152,887,383)
2,149,837,255 2,384,301,663
Stores, spares and loose tools include items which may result in fixed capital expenditure but are not distinguishable.
Diminution in the value of stock is related to work in process and finished goods.
Details of stock in trade pledged as security are referred to in note 44 to the financial statement.
Azgard Nine Limited58

Notes to the Financial Statementsfor the year ended 30 June 2013
24.1 These are secured against letters of credit.
24.2 Movement in provision of trade receivables
25 Advances, deposits, prepayments and other receivables
26 Due from Agritech Limited - unsecured, considered good
25.2 These represent deposits against letters of credit / guarantee and other working capital lines utilized.
It mainly represents mark-up related to investment in TFC's of AGL as referred to in note 20.1.
25.1 These represent advances to employees against future salaries and post employment benefits in accordance with the Company
policy and include advances to executives amounting Rs. 27.647 million (2012: Rs 25.400 million).
Advances to suppliers - unsecured, considered good 46,321,083 350,232,226
Advances to employees - unsecured, considered good
- against salaries 25.1 14,561,020 13,614,858
- against expenses 19,467,905 20,058,323
Security deposits 5,967,336 5,435,136
Margin deposits 25.2 34,238,755 34,238,755
Rebate receivable 153,249,493 187,929,559
Sales tax / FED recoverable 311,723,606 163,316,637
Letters of credit 25,964,274 48,712,485
Insurance claims 10,105,655 1,160,685
Other receivables - unsecured, considered good 7,745,175 6,609,646
629,344,302 831,308,310
Note
2013
Rupees
2012
Rupees
As at beginning of the year 152,887,383 166,389,403
Provision recognized during the year 309,816,228 174,666,838
Less: provision written off (8,446,774) (188,168,858)
As at end of the year 454,256,837 152,887,383
27 Short term investments
Quoted
Agritech Limited
20,000,000 (2012: 313,423,184) ordinary shares of Rs. 10 each
Value of investment Rs. 35 per share (2012: Rs. 35 per share)
Proportion of share capital held 5.10% (2012: 79.87%)
2013 2012
Note Rupees Rupees
Fair value adjustment
Opening 4,591,519,569 4,591,519,569
Realized during the year 34 (4,298,527,869) -
292,991,700 4,591,519,569
700,000,000 10,969,811,440
Cost
Cost 6,378,291,871 6,378,291,871
Disposal during the year (5,971,283,571) -
407,008,300 6,378,291,871
Annual Report 2013 59

Notes to the Financial Statementsfor the year ended 30 June 2013
27.1 In previous year, the Company entered into Share Transfer and Debt Swap Agreement and First Supplemental Agreement ("the
Agreement") to dispose off its entire shareholding in AGL. The Company during the year has divested major part of its shareholding
in AGL. As a result, out of 313,423,184 number of shares held by the Company at the start of the year, 293,423,184 number of shares
were sold on 31 October 2012 at Rs. 35.00 per share and remaining 20,000,000 number of shares are still under pledge whose
divestment would complete once these shares are released. The Company has filed a legal suit against Dubai Islamic Bank Limited
("DIB") for release of pledged shares.
28 Current taxation
29 Cash and bank balances
29.1 These carry return at 6.00% to 8.50% per annum (2012: 5.00% to 13.34% per annum).
29.2 These carry return at prevailing LIBOR per annum (2012: prevailing LIBOR per annum).
30 Sales - net
27.2 As a result of the divestment, the Company has adjusted to the extent of Rs. 6,778.221 million and paid Rs. 3,264.770 million to
settle its long term loans, certain mark-up, redeemable capital, short term borrowings, bills payable, other charges and short term
loan from AGL amounting to Rs. 10,042.991 million and injected the remaining amount of Rs. 226.82 million in its working capital.
27.3 The closing 20,000,000 number of shares continued to be valued at Rs. 35.00 per share as against the market value of Rs. 11.58
(2012: 12.54) per share on the basis of price agreed in the Agreement.
The remaining investment of 20,000,000 number of share in AGL has become an ordinary investment of the Company as against
the investment in subsidiary as at beginning of the year.
27.4 All shares held by the Company are pledged with DIB.
2013 2012
Rupees RupeesNote
As at beginning of the year 6,417,088 76,509,215
Paid / adjusted during the year 91,869,771 45,862,281
Provision for the year (137,539,517) (115,954,408)
As at end of the year (39,252,658) 6,417,088
2013 2012
Note Rupees Rupees
Local 2,038,185,223 1,771,497,625
Export 30.1 & 30.2 11,715,766,508 9,823,943,126
13,753,951,731 11,595,440,751
Rebate on exports 39,188,075 46,963,486
Sales tax (32,362,624) (7,162,598)
Discount (41,151,597) (110,962,220)
13,719,625,585 11,524,279,419
Cash in hand 2,081,561 1,296,860
Cash at banks
- current accounts in local currency 118,029,232 154,120,175
- deposit accounts in local currency 29.1 11,689,764 133,879,196
- deposit accounts in foreign currency 29.2 459,047 425,512
130,178,043 288,424,883
132,259,604 289,721,743
30.1 These include indirect exports, taxable under Section 154 (3b) of the Income Tax Ordinance, 2001, amounting to Rs. 537.911 million
(2012: Rs. 101.644 million).
30.2 These include sales to related parties amounting to Rs. 295.894 million (2012: Rs. 480.577 million).
Azgard Nine Limited60

Notes to the Financial Statementsfor the year ended 30 June 2013
2013 2012
Note Rupees Rupees
31 Cost of sales
Raw materials consumed 9,105,344,851 8,838,342,995
Salaries, wages and benefits 31.1 1,414,082,564 1,519,645,224
Fuel and power 1,235,045,634 897,713,749
Store, spares and loose tools consumed 221,043,133 494,836,797
Traveling, conveyance and entertainment 132,398,171 138,103,555
Rent, rates and taxes 16,016,051 13,387,780
Insurance 52,287,620 65,594,577
Repair and maintenance 43,375,915 38,497,321
Processing charges 71,254,467 90,808,768
Depreciation 18.1.3 498,380,814 517,909,936
R & D amortization 19.1 - 1,777,448
Printing and stationery 7,367,988 9,148,588
Communications 5,622,675 5,272,985
Others 60,752,375 59,504,308
12,862,972,258 12,690,544,031
Work in process
As at beginning of the year 1,126,493,487 678,642,704
As at end of the year (706,429,440) (1,126,493,487)
420,064,047 (447,850,783)
Cost of goods manufactured 13,283,036,305 12,242,693,248
Finished goods
As at beginning of the year 376,974,302 776,607,874
As at end of the year (401,964,652) (376,974,302)
(24,990,350) 399,633,572
13,258,045,955 12,642,326,820
31.1
2013 2012
Note Rupees Rupees
32 Selling and distribution expenses
Salaries and benefits 32.1 100,633,888 124,686,047
Traveling, conveyance and entertainment 43,508,319 38,457,947
Fuel and power 26,031 24,965
Repair and maintenance 873,601 981,578
Rent, rates and taxes 767,809 622,721
Insurance 11,195,921 4,464,768
Freight and other expenses 346,071,656 369,241,123
Provision against trade receivables 24.2 309,816,228 174,666,838
Printing and stationery 652,104 222,767
Communication 43,490,080 29,100,990
Advertisement and marketing 8,411,424 531,100
Legal and professional charges 30,000 75,000
Fee and subscription 475,659 435,588
Commission 191,636,670 348,397,024
Miscellaneous 1,163,737 1,702,915
1,058,753,127 1,093,611,371
These include charge in respect of employees retirement benefits amounting to Rs. 42.851 million (2012: Rs. 38.095 million).
Annual Report 2013 61

Notes to the Financial Statementsfor the year ended 30 June 2013
32.1
2013 2012
Note Rupees Rupees
33 Administrative and general expenses
Salaries and benefits 33.1 262,860,732 205,215,121
Traveling, conveyance and entertainment 33,452,147 58,018,212
Fuel and power 29,717,576 24,636,687
Repair and maintenance 17,239,885 22,944,178
Rent, rates and taxes 7,906,128 7,667,054
Insurance 1,137,367 2,531,231
Printing and stationery 5,616,363 6,381,630
Communication 18,260,909 24,179,405
Legal and professional charges 33.2 24,078,149 16,309,560
Depreciation 18.1.3 15,620,505 19,460,713
Amortization 19.2 2,604,817 2,604,817
Fee and subscription 32,505,025 32,898,641
Donations 33.3 1,115,258 1,401,810
Others 4,878,841 4,815,424
456,993,702 429,064,483
33.1
2013 2012
Rupees Rupees
33.2 These include following in respect of auditors' remuneration
Annual statutory audit 1,660,000 1,445,000
Report on consolidated financial statements 800,000 750,000
Half yearly review 575,000 500,000
Review report under Code of Corporate Governance 170,000 150,000
Certification and other services 100,000 360,000
Out of pocket expenses 200,000 150,000
3,505,000 3,355,000
33.3 This represents donation to different associations and trusts. None of the Directors have any interest in the donee.
These include charge in respect of employees retirement benefits amounting to Rs. 10.243 million (2012: Rs. 9.468 million).
These include charge in respect of employees retirement benefits amounting to Rs. 2.253 million (2012: Rs. 2.473 million).
Azgard Nine Limited62

Notes to the Financial Statementsfor the year ended 30 June 2013
34 Net other income
Net gain / (loss) on financial instruments
Accumulated deferred notional income 8.7 - 1,189,908,326
Return on investment in TFCs 34.1 33,373,470 39,192,996
Gain on sale of investment in AGL 4,298,527,869 -
Foreign exchange loss (49,741,822) (59,445,803)
Long term deposits written off (5,560,261) -
Advances written off (3,784,771) -
Impairment of long term investment 20.1 (38,767,662) (1,125,597,650)
Return on bank deposits 2,704,598 22,106,895
4,236,751,421 66,164,764
Other (expense) / income
Loss on disposal of property, plant and equipment 18.1.2 (877,702) (709,228)
Miscellaneous 21,527,746 39,025,073
20,650,044 38,315,845
4,257,401,465 104,480,609
34.1 This represents return on investment in TFCs of AGL.
35 Finance cost
Interest / mark-up on:
Redeemable capital 382,304,700 850,745,432
Long term finances 262,988,125 399,313,448
Liabilities against assets subject to finance lease 5,286,028 9,444,085
Short term borrowings 652,425,562 1,685,509,158
Borrowings from Agritech Limited 19,240,742 61,896,928
Interest on payable to Provident Fund Trust 18,689,139 20,193,978
Interest on Workers’ Profit Participation Fund 8,227,689 7,002,288
1,349,161,985 3,034,105,317
Amortization of transaction costs and deferred
notional income 8.7, 8.8 & 9.7 291,297,994 92,803,085
Foreign exchange loss / (gain) 156,581,182 (79,485,627)
Bank charges and commission 304,709,043 376,955,296
2,101,750,204 3,424,378,071
36 Taxation
Current taxation 36.1 137,539,517 115,954,408
Deferred taxation 36.8 - -
137,539,517 115,954,408
36.1 Provision for current tax has been made in accordance with section 154 of the Income Tax Ordinance, 2001 ("the Ordinance").
2013 2012
Note Rupees Rupees
2013 2012
Note Rupees Rupees
Annual Report 2013 63
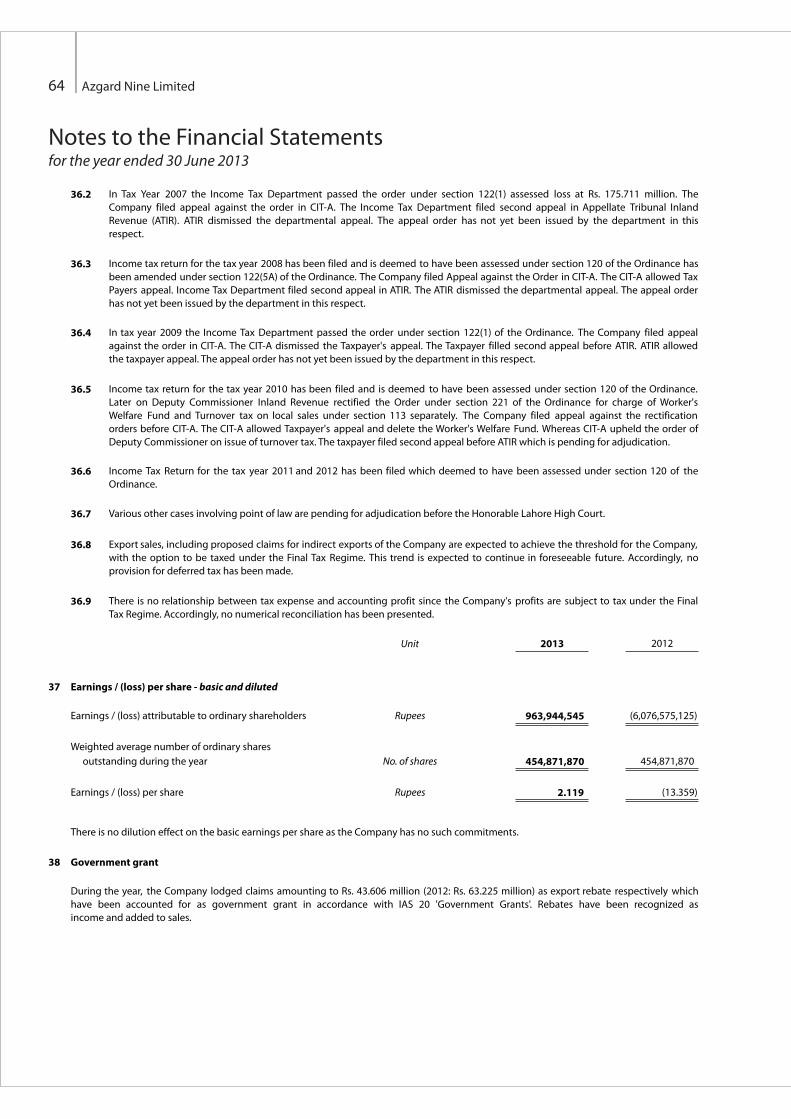
Notes to the Financial Statementsfor the year ended 30 June 2013
36.2
36.5
36.6
36.7
36.8
36.9
Unit 2013 2012
37 Earnings / (loss) per share - basic and diluted
Earnings / (loss) attributable to ordinary shareholders Rupees 963,944,545 (6,076,575,125)
Weighted average number of ordinary shares
outstanding during the year No. of shares 454,871,870 454,871,870
Earnings / (loss) per share Rupees 2.119 (13.359)
38 Government grant
Income Tax Return for the tax year 2011 and 2012 has been filed which deemed to have been assessed under section 120 of the
Ordinance.
In Tax Year 2007 the Income Tax Department passed the order under section 122(1) assessed loss at Rs. 175.711 million. The
Company filed appeal against the order in CIT-A. The Income Tax Department filed second appeal in Appellate Tribunal Inland
Revenue (ATIR). ATIR dismissed the departmental appeal. The appeal order has not yet been issued by the department in this
respect.
36.3 Income tax return for the tax year 2008 has been filed and is deemed to have been assessed under section 120 of the Ordinance has
been amended under section 122(5A) of the Ordinance. The Company filed Appeal against the Order in CIT-A. The CIT-A allowed Tax
Payers appeal. Income Tax Department filed second appeal in ATIR. The ATIR dismissed the departmental appeal. The appeal order
has not yet been issued by the department in this respect.
36.4 In tax year 2009 the Income Tax Department passed the order under section 122(1) of the Ordinance. The Company filed appeal
against the order in CIT-A. The CIT-A dismissed the Taxpayer's appeal. The Taxpayer filled second appeal before ATIR. ATIR allowed
the taxpayer appeal. The appeal order has not yet been issued by the department in this respect.
Income tax return for the tax year 2010 has been filed and is deemed to have been assessed under section 120 of the Ordinance.
Later on Deputy Commissioner Inland Revenue rectified the Order under section 221 of the Ordinance for charge of Worker's
Welfare Fund and Turnover tax on local sales under section 113 separately. The Company filed appeal against the rectification
orders before CIT-A. The CIT-A allowed Taxpayer's appeal and delete the Worker's Welfare Fund. Whereas CIT-A upheld the order of
Deputy Commissioner on issue of turnover tax. The taxpayer filed second appeal before ATIR which is pending for adjudication.
Various other cases involving point of law are pending for adjudication before the Honorable Lahore High Court.
Export sales, including proposed claims for indirect exports of the Company are expected to achieve the threshold for the Company,
with the option to be taxed under the Final Tax Regime. This trend is expected to continue in foreseeable future. Accordingly, no
provision for deferred tax has been made.
There is no relationship between tax expense and accounting profit since the Company's profits are subject to tax under the Final
Tax Regime. Accordingly, no numerical reconciliation has been presented.
During the year, the Company lodged claims amounting to Rs. 43.606 million (2012: Rs. 63.225 million) as export rebate respectively which
have been accounted for as government grant in accordance with IAS 20 'Government Grants'. Rebates have been recognized as
income and added to sales.
There is no dilution effect on the basic earnings per share as the Company has no such commitments.
Azgard Nine Limited64

Notes to the Financial Statementsfor the year ended 30 June 2013
2013 2012
Rupees Rupees
39 Cash generated from operations
Profit / (loss) after tax 963,944,545 (6,076,575,125)
Adjustments for non-cash and other items
Interest / mark-up expense 1,297,718,387 2,630,414,701
Borrowings from Agritech Limited 19,240,742 61,896,928
Loss on disposal of fixed assets 877,702 709,228
Gain on sale of investment (4,298,527,869) -
Foreign exchange loss / (gain) - net 206,323,004 (20,039,824)
Return on investment in term finance certificates (33,373,470) (39,192,996)
Long term deposits written off 5,560,261 -
Advances written off 3,784,771 -
Taxation 137,539,517 115,954,408
Depreciation 514,001,319 537,370,649
Amortization of transaction costs and deferred notional income 291,297,994 92,803,085
Amortization of intangible assets 2,604,817 4,382,265
Provision for impairment of receivables 309,816,228 174,666,838
Deferred notional income - (1,189,908,326)
Loss on cash flow hedge - 7,424,080
Provision for impairment of investment 38,767,662 1,125,597,650
(1,504,368,935) 3,502,078,686
Operating loss before changes in working capital (540,424,390) (2,574,496,439)
Changes in working capital
Decrease / (increase) in current assets:
Stores, spares and loose tools 42,349,172 299,709,439
Stock in trade 816,659,329 735,358,945
Trade receivables (115,619,646) 558,475,017
Advances, deposits, prepayments and other receivables 198,179,237 75,115,447
941,568,092 1,668,658,848
(Decrease) / increase in current liabilities:
Trade and other payables (265,869,405) 1,294,798,439
Cash generated from operations 135,274,297 388,960,848
40 Cash and cash equivalents
Short term borrowings - running finance - secured (1,076,169,156) (1,832,049,760)
Cash and bank balances 132,259,604 289,721,743
(943,909,552) (1,542,328,017)
41 Transactions and balances with related parties
Related parties from the Company's perspective comprise subsidiary, associated undertakings, key management personnel (including chief
executive and directors), post employment benefit plan and other related parties. The Company in the normal course of business carries
out transactions with various related parties and continues to have a policy whereby all such transactions are carried out on permissiblebasis.
Annual Report 2013 65

Notes to the Financial Statementsfor the year ended 30 June 2013
Details of transactions and balances with related parties is as follows:
41.1 Transactions with related parties
41.1.1 Subsidiary
Montebello s.r.l.
Sales 30 295,894,009
41.1.2 Other related parties
480,576,672
Agritech Limited
Temporary loan received - net 14 302,996,036
Mark-up income on redeemable capital 34 (33,373,470)
Mark-up expense on short term loan 35 19,240,742
30,763,444
(39,192,996)
61,896,928
JS Bank Limited
Redeemable capital repaid 8.2 84,848,231
Mark-up expense 35 35,417,034
Remuneration of Trustee 8.5 & 8.6 3,000,000
-
71,479,009
-
JS Value Fund Limited
Redeemable capital - TFC II repayment 8.1 (25,415,775)
Redeemable capital - TFC VI disbursement 8.4 -
Mark-up expense 35 3,366,593
-
12,900,000
6,371,916
Unit Trust of Pakistan
Redeemable capital - TFC V repayments 8.3 (18,019,234)
Redeemable capital - TFC VI disbursement 8.4 -
Mark-up expense 35 4,352,918
-
19,265,000
6,803,260
JS Large Cap Fund
Redeemable capital - PPTFC disbursement 8.6 83,160,000
Mark-up expense 35 8,122,353
-
5,828,806
JS Global Capital Limited
Redeemable capital - PPTFC disbursement 8.5 326,456,184
Mark-up expense 35 31,895,072
-
22,913,777
JS Principal Secure Fund
Redeemable capital - TFC VI disbursement 8.4 -
Redeemable capital - PPTFC disbursement 8.6 33,480,000
Mark-up expense 35 3,270,991
19,265,000
-
2,349,823
JS Pension Savings Fund
Redeemable capital - TFC V repayments 8.3 (5,405,770)
Redeemable capital - TFC VI disbursement 8.4 -
Mark-up expense 35 -
-
3,850,000
2,040,978
2013
Note Rupees
2012
Rupees
Azgard Nine Limited66

Notes to the Financial Statementsfor the year ended 30 June 2013
2013 2012
Note Rupees Rupees
JS Growth Fund
Redeemable capital - TFC II repayments 8.2 (21,179,813) -
Redeemable capital - TFC VI disbursement 8.4 - 10,750,000
Redeemable capital - PPTFC disbursement 8.6 64,200,000 -
Mark-up expense 35 9,076,595 9,811,780
41.1.3 Post employment benefit plans
Contribution to employees Provident Fund Trust 31, 32 & 33 110,692,736 100,072,478
Interest payable on employees Provident Fund Trust 35 18,689,139 20,193,978
41.1.4 Key management personnel
41.2 Balances with related parties
41.2.1 Subsidiary
Montebello s.r.l.
Trade receivables 768,584,853 943,574,911
41.2.2 Other related parties
Agritech Limited
Investment in ordinary shares 27 700,000,000 10,969,811,440
Redeemable capital 20.1 266,074,508 266,074,508
Mark-up receivable 26 16,600,910 (68,579,206)
Short term loan received 14 - (286,395,126)
JS Bank Limited
Redeemable capital - TFC IV 8.2 65,033,776 149,880,000
Short term borrowing 12 336,026,713 339,209,038
Mark-up payable 15 16,806,556 104,428,510
Cash and bank - current account 29 7,491,793 12,502
JS Value Fund Limited
Redeemable capital - TFC II 8.1 19,523,025 44,938,800
Redeemable capital - TFC VI 8.4 12,900,000 12,900,000
Mark-up payable 15 4,846,631 1,480,038
The remuneration paid to chief executive, directors, executive and key management personnel in terms of their employment is
disclosed in note 45 to the financial statements.
2013 2012
Note Rupees Rupees
JS Income Fund
Redeemable capital - TFC II repayments 8.2 (9,594,455)
Redeemable capital - TFC V repayments 8.3 (27,028,851)
Redeemable capital - TFC VI disbursement 8.4 -
Mark-up expense 35 7,800,266
-
-
24,135,000
12,610,289
Annual Report 2013 67

Notes to the Financial Statementsfor the year ended 30 June 2013
2013 2012
Note Rupees Rupees
Unit Trust of Pakistan
Redeemable capital - TFC V 8.3 31,980,766 75,000,000
Redeemable capital - TFC VI 8.4 19,265,000 19,265,000
Mark-up payable 15 5,993,891 1,640,973
JS Large Cap Fund
Redeemable capital - PPTFCs 8.6 83,160,000 -
Preference shares 11.1 - 65,126,320
Mark-up / preference dividend payable 1,829,520 16,277,054
JS Global Capital Limited
Redeemable capital - PPTFCs 8.5 326,456,184 -
Mark-up / preference dividend payable 7,182,036 63,530,802
Preference shares 11.1 - 256,019,860
Advisory fee payable 13 4,000,000 4,000,000
JS Principal Secure Fund
Redeemable capital - TFC VI 8.4 - 19,265,000
Redeemable capital - PPTFC 8.6 33,480,000 -
Preference shares 11.1 - 26,255,000
Mark-up / preference dividend payable 736,560 6,516,834
JS Pension Savings Fund
Redeemable capital - TFC V 8.3 - 15,000,000
Redeemable capital - TFC VI 8.4 3,850,000 3,850,000
Mark-up payable 15 - 492,292
JS Income Fund
Redeemable capital - TFC II 8.2 7,369,942 16,964,397
Redeemable capital - TFC V 8.3 47,971,149 75,000,000
Redeemable capital - TFC VI 8.4 24,135,000 24,135,000
Mark-up payable 15 10,820,439 3,020,173
JS Growth Fund
Redeemable capital - TFC II 8.2 16,269,187 37,449,000
Redeemable capital - TFC VI 8.4 10,750,000 10,750,000
Redeemable capital - PPTFC disbursement 8.6 64,200,000 -
Preference shares 11.1 - 50,300,000
Mark-up / preference dividend payable 5,451,260 13,776,643
41.2.3 Post employment benefit plans
Payable to employees Provident Fund Trust 13 83,897,625 96,248,979
41.2.4 Key management personnel
Short term employee benefits payable 22,868,033 20,093,705
Azgard Nine Limited68

Notes to the Financial Statementsfor the year ended 30 June 2013
42 Financial risk management
The Company has exposure to the following risks arising from financial instruments:
- credit risk
- liquidity risk
- market risk
42.1 Credit risk
42.1.1 Exposure to credit risk
2013 2012
Note Rupees Rupees
Available for sale financial assets
Long term investments 20 266,074,508 266,074,508
Loans and receivables
Long term deposit - utility companies and regulatory authorities 21 17,484,247 23,506,497
Long term deposit - financial institutions 21 6,993,740 6,523,996
Trade receivables 24 2,105,260,970 2,307,359,321
Advance to employees - against salaries 25 14,561,020 13,614,858
Security deposits 25 5,967,336 5,435,136
Margin deposits 25 34,238,755 34,238,755
Insurance claims 25 10,105,655 1,160,685
Cash at banks 29 130,178,043 288,424,883
2,324,789,766 2,680,264,131
2,590,864,274 2,946,338,639
42.1.2 Concentration of credit risk
The carrying amount of financial assets represents the maximum credit exposure. The maximum exposure to credit risk as at the
end of the reporting period was as follows:
This note presents information about the Company’s exposure to each of the above risks, the Company’s objectives, policies and
processes for measuring and managing risk, and the Company’s management of capital.
The Company's Board of Directors ("the Board") has overall responsibility for establishment and oversight of the Company's risk
management framework. The Board of Directors has developed a risk policy that sets out fundamentals of risk management framework.
The Company's risk management policies are established to identify and analyze the risks faced by the Company, to set appropriate risk
limits and controls and to monitor risks and adherence to limits. Risk management policies and systems are reviewed regularly to reflect
changes in market conditions and Company's activities.
Credit risk is the risk of financial loss to the Company if a customer or a counterparty to a financial instrument fails to meet its
contractual obligations, and arises principally from the Company's receivables from customers and investment in debt securities.
The Company identifies concentrations of credit risk by reference to type of counter party. Maximum exposure to credit risk by
type of counterparty is as follows:
Annual Report 2013 69

Notes to the Financial Statementsfor the year ended 30 June 2013
2013 2012
Rupees Rupees
Customers 2,105,260,970 2,307,359,321
Banking companies and financial institutions 177,377,874 334,622,770
Others 308,225,430 308,356,548
2,590,864,274 2,946,338,639
42.1.3 Credit quality and impairment
42.1.3(a) Counterparties with external credit ratings
These include banking companies and financial institutions, which are counterparties to cash deposits, security deposits, margin
deposits, insurance claims and cash flow hedges, and issuers of debt securities which are counterparties to investment in debt
securities and accrued return thereon. These counterparties have reasonably high credit ratings as determined by various credit
rating agencies. Due to long standing business relationships with these counterparties and considering their strong financial
standing, management does not expect non-performance by these counterparties on their obligations to the Company.
Following are the credit ratings of counterparties with external credit ratings:
Credit quality of financial assets is assessed by reference to external credit ratings, where available, or to historical information
about counterparty default rates. All counterparties, with the exception of customers, have external credit ratings determined by
various credit rating agencies. Credit quality of customers is assessed by reference to historical defaults rates and present ages.
Bank
Allied Bank Limited
Albaraka Bank (Pakistan) Limited
Askari Bank Limited
Barclays Bank Pakistan
Bank Al-Habib Limited
Bank Alfalah Limited
Bank Islami Pakistan Limited
Faysal Bank Limited
Habib Bank Limited
Habib Metropolitan Bank Limited
HSBC Bank Middle East Limited
JS Bank Limited
KASB Bank Limited
MCB Bank Limited
Meezan Bank Limited
National Bank of Pakistan
NIB Bank Limited
Silk Bank Limited
Soneri Bank Limited
Standard Chartered Bank (Pakistan)
Limited
Summit Bank Limited
The Bank of Punjab
United Bank Limited
Bank of Khyber
2012
25,288
11,801,400
133,619,886
1,435,825
57,442,072
43,613
478,772
36,375,070
249,516
3,251
855
12,502
1,188,958
34,227,800
13,042
2,583,827
557,347
1,252
14,825
3,019,632
3,539,224
426,260
1,364,666
-
288,424,883
Rupees
2013
25,288
1,093,207
40,478
-
88,637,193
519,002
478,771
17,885,645
416,303
2,243
22,343
7,491,793
595,206
731,491
5,568
18,829
1,064,159
1,019,524
14,825
18,492
1,158,441
424,097
731,514
7,783,631
130,178,043
Rupees
Ratingagency
PACRA
PACRA
PACRA
Moody's
PACRA
PACRA
PACRA
PACRA
JCR-VIS
PACRA
Fitch
PACRA
PACRA
PACRA
JCR-VIS
JCR-VIS
PACRA
JCR-VIS
PACRA
PACRA
JCR-VIS
PACRA
JCR-VIS
PACRA
Long term
AA+
A
AA
A2
AA+
AA
A
AA
AA+
AA+
AA-
A+
BBB
AA+
AA
AAA
AA-
A-
AA-
AAA
A-
AA-
AA+
A-
Rating
Short term
A1+
A1
A1+
P-1
A1+
A1+
A1
A1+
A-1+
A1+
F1+
A1
A3
A1+
A-1+
A-1+
A1+
A-2
A1+
A1+
A-2
A1+
A-1+
A2
Rating
Azgard Nine Limited70

Notes to the Financial Statementsfor the year ended 30 June 2013
42.1.3(b) Counterparties without external credit ratings
These include customers which are counter parties to trade receivables. The Company is exposed to credit risk in respect of
trade receivables. The analysis of ages of trade receivables of the Company as at the reporting date is as follows:
The analysis of trade receivables from Montebello s.r.l., subsidiary of the Company as at the reporting date is as follows:
2013 2012
Gross carrying
amount
Gross carryingamount
Rupees Rupees
Not yet due 181,680,481 214,906,590
Past due by 0 to 6 months 28,661,912 701,125
Past due by 6 to 12 months 182,750,979 727,967,196
Past due by more than one year 375,491,481 -
768,584,853 943,574,911
The Board has formulated a policy to create provision allowance for trade receivables on a time based criteria. Provision
allowance on closing trade receivable balances has adequately been created in accordance with the approved policy. Further,
based on historical default rates, the Company believes that no impairment allowance other than already provided is necessary
in respect of trade receivables not past due or those past due by less than one year, since these relate to customers who have
had good payment record with the Company.
The Company's five significant customers account for Rs. 976 million (2012: Rs. 1,343 million) of trade receivables as at the
reporting date, apart from which, exposure to any single customer does not exceed 2% (2012: 3%) of trade receivables as at the
reporting date. Further, trade receivables amounting to Rs. 499 million (2012: Rs. 230 million) secured through confirmed letters
of credit and thus do not carry any significant credit risk.
Not yet due
Past due by 0 to 6 months
Past due by 6 to 12 months
Past due by more than one year
Gross carryingamount
Accumulated
impairment
520,654,263 -
366,651,777 -
280,825,661 -
1,435,962,391 454,256,837
2,604,094,092 454,256,837
RupeesRupees
2013
Accumulated
impairment
400,069,403 -
467,036,689 -
1,293,128,743 -
376,954,211 152,887,383
2,537,189,046 152,887,383
RupeesRupees
2012
Gross carryingamount
42.1.4 Collateral held
42.1.5 Credit risk management
The Company does not hold any collateral to secure its financial assets with the exception of trade receivables, which are
partially secured through confirmed letters of credit and investment in debt securities which are secured by charge over
issuer's operating assets.
As mentioned in note 42.1.3(b) to the financial statements, the Company's financial assets do not carry significant credit risk,
with the exception of trade receivables, which are exposed to losses arising from any non-performance by counterparties. In
respect of trade receivables, the Company manages credit risk by limiting significant exposure to any single customer. Formal
policies and procedures of credit management and administration of receivables are established and executed. In monitoring
customer credit risk, the ageing profile of total receivables and individually significant balances, along with collection activities
are reviewed on a regular basis. High risk customers are identified and restrictions are placed on future trading, including
suspending future shipments and administering dispatches on a prepayment basis or confirmed letters of credit.
Annual Report 2013 71

Notes to the Financial Statementsfor the year ended 30 June 2013
42.2 Liquidity risk
42.2.1 Exposure to liquidity risk
42.2.1(a) Contractual maturities of financial liabilities, including estimated interest payments.
Liquidity risk is the risk that the Company will encounter difficulty in meeting the obligations associated with its financial
liabilities that are settled by delivering cash or another financial asset and the Company will not be able to meet its financial
obligations as they fall due.
The following are the remaining contractual maturities at the reporting date. The amounts are grossed and undiscounted, and
include estimated interest payments and exclude the impact of netting agreements.
Non-derivative financial liabilities
Redeemable capital
Long term finances
Liabilities against assets subject
to finance lease
Preference shares
Short term borrowings
Trade creditors
Accrued liabilities
Payable to Provident Fund Trust
Workers' Profit Participation Fund
Other payables
Bills payable
Mark-up accrued on borrowings
Dividend payable
Derivative financial liabilities
Cross currency swaps
Note
8
9
10
11
12
13
13
13
13
13
13
15
16
13
More thanthree years
768,102,083
752,379,912
-
-
-
-
-
-
-
-
-
-
-
1,520,481,995
-
1,520,481,995
Rupees
One tothree years
5,450,941,948
1,117,082,011
11,824,078
-
-
-
-
-
-
-
-
-
-
6,579,848,037
-
6,579,848,037
Rupees
One yearor less
853,664,443
207,207,807
27,223,579
148,367,255
5,083,898,848
1,615,111,688
303,875,359
83,897,625
55,243,056
7,384,370
385,516,037
1,501,702,254
13,415,572
10,286,507,893
-
10,286,507,893
Rupees
2013
Contractualcash flows
7,072,708,474
2,076,669,730
39,047,657
148,367,255
5,083,898,848
1,615,111,688
303,875,359
83,897,625
55,243,056
7,384,370
385,516,037
1,501,702,254
13,415,572
18,386,837,925
-
18,386,837,925
Rupees
Carryingamount
6,024,844,185
1,773,447,469
32,586,801
148,367,255
4,819,186,842
1,615,111,688
303,875,359
83,897,625
55,243,056
7,384,370
385,516,037
1,501,702,254
13,415,572
16,764,578,513
-
16,764,578,513
Rupees
Azgard Nine Limited72

Notes to the Financial Statementsfor the year ended 30 June 2013
Non-derivative financial liabilities
Redeemable capital
Long term finances
Liabilities against assets subject
to finance lease
Preference shares
Short term borrowings
Trade creditors
Accrued liabilities
Payable to Provident Fund Trust
Workers' Profit Participation Fund
Other payables
Bills payable
Due to Agritech Limited
Mark-up accrued on borrowings
Dividend payable
Derivative financial liabilities
Cross currency swaps
Carryingamount
Contractualcash flows
One yearor less
One tothree years
More thanthree years
8 8,038,939,061 9,228,296,765 2,844,243,569
9 3,436,652,874 3,921,163,422 2,058,623,610
10 36,436,705 44,819,982 17,050,310
11 574,518,935
12 8,156,743,175 8,515,251,826 8,515,251,826
13 1,499,989,313 1,499,989,313 1,499,989,313
13 519,327,523 519,327,523 519,327,523
13 96,248,979 96,248,979 96,248,979
13 47,015,366 47,015,366 47,015,366
13 10,152,164 10,152,164 10,152,164
13 1,755,448,679 1,755,448,679 1,755,448,679
14 286,395,126 286,395,126 286,395,126
15 1,425,935,847 1,425,935,847 1,425,935,847
16 32,729,078 32,729,078 32,729,078
25,916,532,825 27,957,293,005 19,682,930,325
13 7,424,080 7,623,558 7,623,558
25,923,956,905 27,964,916,563 19,690,553,883
2,136,201,971
528,022,039
27,769,672
-
-
-
-
-
-
-
-
-
-
-
2,691,993,682
-
2,691,993,682
4,247,851,225
1,334,517,773
-
-
-
-
-
-
-
-
-
-
-
-
5,582,368,998
-
5,582,368,998
2012
RupeesRupeesRupeesRupeesRupees
The gross cash flows disclosed in the above table represent the contractual undiscounted cash flows relating to derivative
financial liabilities held for risk management purposes and which are not usually closed out before contractual maturity. The
disclosure shows net cash flow amounts for derivatives that are net cash-settled and gross cash flow amounts for derivatives
that have simultaneous gross cash settlement.
42.2.2 Liquidity risk management
Nature of liability
Preference shares
Dividend on preference shares
Long term finances
Redeemable capital
Short term borrowings
Bills payables
The Company's approach to managing liquidity risk is to ensure, as far as possible, that it will always have sufficient liquidity to
meet its liabilities when due, under both normal and stressed conditions, without incurring unacceptable losses or risking
damage to the Company's reputation.
The Company is facing a temporary liquidity shortfall due to the facts disclosed in note 2.2 as a result of which it was unable to
meet its obligations in respect of various debt finances. The details are as follows:
Total
148,367,255
9,413,535
223,527,738
542,153,515
706,131,191
315,771,124
1,945,364,358
Rupees
Preference dividend /
interest / mark-up
-
9,413,535
217,527,738
542,153,515
473,529,475
41,309,367
1,283,933,630
Rupees
Principal
148,367,255
-
6,000,000
-
232,601,716
274,461,757
661,430,728
Rupees
574,518,935 574,518,935
Annual Report 2013 73

Notes to the Financial Statementsfor the year ended 30 June 2013
42.3 Market risk
42.3.1 Currency risk
The Company is exposed to currency risk to the extent that there is a mismatch between the currencies in which sales, purchases
and borrowings are denominated and the respective functional currency of the Company. The functional currency of the
Company is Pak Rupee. The currencies in which these transactions are primarily denominated are Emirate Dirham, Euro, US
dollars, Pound sterling, and Swiss franc.
Market risk is the risk that changes in market prices, such as foreign exchange rates, interest rates and equity prices will affect the
Company's income or the value of its holdings of financial instruments. The objective of market risk management is to manage
and control market risk exposures within acceptable parameters, while optimizing return.
As explained in note 2.2, the Company, is discussing with the providers of debt for a second round of restructuring and debt re-
profiling. For the said purpose, the management is considering to negotiate with the debt financiers for waiver of over due
interest / mark-up accured, and disposal of its low performing assets for settlement of overdue principal of its long term debts.
42.3.1(a) Exposure to currency risk
The summary quantitative data about the Company's exposure to currency risk as reported to the management of the
Company is as follows:
Assets
Investments
Trade receivables
Cash and bank balances
Liabilities
Long term finances
Short term borrowings
Mark-up accrued on borrowings
Trade creditors
Bills payable
Gross balance sheet exposure
Fair value of hedging instruments
Net balance sheet exposure
2013
CHF
-
-
-
-
-
-
-
-
-
-
-
Rupees
GBP
-
92,069,029
-
92,069,029
-
-
-
-
-
-
92,069,029
Rupees
USD
-
946,027,770
117,581
946,145,351
-
(466,448,835)
(3,549,761)
(33,894,448)
(124,275,580)
(628,168,624)
317,976,727
Rupees
EUR
1,460,660,737
1,380,856,891
341,466
2,841,859,094
(907,054,269)
-
(27,000,774)
(38,980,495)
(5,695,688)
(978,731,226)
1,863,127,868
Rupees
AED
-
-
-
-
-
-
-
-
-
-
-
Rupees
Total
1,460,660,737
2,418,953,690
459,047
3,880,073,474
(907,054,269)
(466,448,835)
(30,550,535)
(72,874,943)
(129,971,268)
(1,606,899,850)
2,273,173,624
-
2,273,173,624
Rupees
Azgard Nine Limited74

Notes to the Financial Statementsfor the year ended 30 June 2013
42.3.1(b) Exchange rates applied during the year
The following significant exchange rates have been applied during the year:
42.3.1(c) Sensitivity analysis
A reasonably possible strengthening / (weakening) of 10% in Pak Rupee against the following currencies would have affected
the measurement of financial instruments denominated in foreign currency and affected equity and profit or loss by the
amounts shown below. The analysis assumes that all other variables, in particular interest rates, remain constant and ignores any
impact of forecast sales and purchases.
Assets
Investments
Trade receivables
Cash and bank balances
Liabilities
Long term finances
Short term borrowings
Mark-up accrued on borrowings
Trade creditors
Bills payable
Gross balance sheet exposure
Fair value of hedging instruments
Net balance sheet exposure
AED EUR USD GBP CHF Total
- 1,499,428,399 - - - 1,499,428,399
- 1,304,739,358 880,533,636 175,447,134 - 2,360,720,128
- 313,405 112,107 - - 425,512
- 2,804,481,162 880,645,743 175,447,134 - 3,860,574,039
- (1,422,000,000) - - - (1,422,000,000)
- (38,621,304) (441,391,310) - - (480,012,614)
- (238,107,307) (9,758,124) - - (247,865,431)
- (39,293,136) (53,194,399) (58,728) - (92,546,263)
(32,786) (39,773,458) (203,843,804) - (722,367) (244,372,415)
(32,786) (1,777,795,205) (708,187,637) (58,728) (722,367) (2,486,796,723)
(32,786) 1,026,685,957 172,458,106 175,388,406 (722,367) 1,373,777,316
(7,424,080)
1,366,353,236
RupeesRupeesRupeesRupeesRupeesRupees
2012
EUR
USD
GBP
CHF
AED
Average rate
Buying Selling for the year
128.85
98.60
150.57
104.49
26.85
129.11
98.80
150.87
104.71
26.90
125.18
96.75
151.76
102.80
26.34
2013
Reporting date spot rate
RupeesRupees
2012
Reporting date spot rate Average rate
for the year
119.56
89.35
141.53
99.20
24.35
Rupees
Selling
118.50
94.20
147.07
98.62
25.65
Rupees
Buying
118.25
94.00
146.76
98.41
25.59
Rupees
AED
EUR
USD
GBP
CHF
2013 2012
Profit Profit
Rupees Rupees
- (3,279)
186,312,787 102,668,596
31,797,673 17,245,811
9,206,903 17,538,841
- (72,237)
227,317,363 137,377,732
Annual Report 2013 75

Notes to the Financial Statementsfor the year ended 30 June 2013
42.3.1(d) Currency risk management
42.3.2 Interest rate risk
42.3.2(a) Interest / mark-up bearing financial instruments
42.3.2(b) Fair value sensitivity analysis for fixed rate instruments and fair value hedges
42.3.2(c) Cash flow sensitivity analysis for variable rate instruments and cash flow hedges
Interest rate risk is the risk that fair values or future cash flows of a financial instrument will fluctuate because of changes in
interest rates.
The Company manages its exposure to currency risk through continuous monitoring of expected / forecast committed and non-
committed foreign currency payments and receipts. Reports on forecast foreign currency transactions, receipts and payments
are prepared on monthly bases, exposure to currency risk is measured and appropriate steps are taken to ensure that such
exposure is minimized while optimizing return. This includes matching of foreign currency liabilities / payments to assets /
receipts, using source inputs in foreign currency and arranging cross currency swaps to hedge non-functional currency debt. The
Company maintains foreign currency working capital lines in order to finance production of exportable goods. Proceeds from
exports are used to repay / settle / rollover the Company's obligations under these working capital lines which substantially
reduces exposure to currency risk in respect of such liabilities. Balances in foreign currency are also maintained in current and
saving / deposits accounts with banking companies. The Company also occasionally uses currency options to cover any
significant unfavorable rate scenarios.
The effective interest / mark-up rates for interest / mark-up bearing financial instruments are mentioned in relevant notes to the
financial statements. The Company's interest / mark-up bearing financial instruments as at the reporting date are as follows:
The Company does not account for fixed-rate financial assets or financial liabilities at fair value through profit or loss. Therefore a
change in interest rates at the reporting date would not effect profit or loss.
A reasonably possible change of 100 basis points in interest rates at the reporting date would have increased / (decreased)
equity and profit by amounts shown below. The analysis assumes that all other variables, in particular foreign exchange rates,
remain constant.
Non-derivative financial instruments
Fixed rate instruments
Variable rate instruments
Derivative financial instruments
Cash flow hedges
Financial asset Financial liability
12,148,811 139,140,681
266,074,508 9,273,255,150
- -
Rupees Rupees
2013
Financial asset Financial liability
134,304,708 717,783,280
266,074,508 18,205,550,494
- 7,424,080
RupeesRupees
2012
Increase of 100 basis points
Variable rate instruments
Cash flow hedges
Cash flow sensitivity - net
Equity Profit
- (179,394,760)
(74,241) -
(74,241) (179,394,760)
RupeesRupees
2012
Equity Profit
- (90,071,806)
- -
- (90,071,806)
RupeesRupees
2013
Azgard Nine Limited76

Notes to the Financial Statementsfor the year ended 30 June 2013
Decrease of 100 basis points
Variable rate instruments - 90,071,806
Cash flow hedges - -
Cash flow sensitivity - net - 90,071,806
- 179,394,760
74,241 -
74,241 179,394,760
Equity Profit
RupeesRupees
2012
Equity Profit
RupeesRupees
2013
42.3.2(d) Interest rate risk management
42.3.3 Price risk
42.4 Fair values
Fair value versus carrying amounts
The fair values of financial assets and liabilities, together with the carrying amounts shown in the balance sheet, are as follows:
Price risk represents the risk that the fair value or future cash flows of financial instrument will fluctuate because of changes in
market prices, other than those arising from interest rate risk or currency risk, whether those changes are caused by factors
specific to the individual financial instrument or its issuer, or factors affecting all similar financial instruments. The Company's
exposure to price risk is insignificant.
The Company manages interest rate risk by analyzing its interest rate exposure on a dynamic basis. Cash flow interest rate risk is
managed by simulating various scenarios taking into consideration refinancing, renewal of existing positions, alternative
financing and hedging. Based on these scenarios, the Company calculates impact on profit after taxation and equity of defined
interest rate shift, mostly 100 basis points. Cross currency swaps are also arranged to transfer exposure to more stable markets.
Fair value interest rate risk are managed by arranging fixed to variable rate swaps.
Note
Available for sale
Long term investments 20
Short term investments 27
Carrying values Fair values Carrying values Fair values
1,460,691,958 1,460,691,958 1,499,443,230 1,499,443,230
700,000,000 700,000,000 10,969,811,440 10,969,811,440
2,160,691,958 2,160,691,958 12,469,254,670 12,469,254,670
2013 2012
RupeesRupees RupeesRupees
Annual Report 2013 77

Notes to the Financial Statementsfor the year ended 30 June 2013
The basis for determining fair values is as follows:
Interest rates used for determining fair value
The interest rates used to discount estimated cash flows, when applicable, are based on the government yield curve at the
reporting date plus an adequate credit spread. For instruments carried at amortized cost, since the majority of the interest
bearing investments are variable rate based instruments, there is no difference in carrying amount and the fair value. Further, for
fixed rate instruments, since there is no significant difference in market rate and the rate of instrument and therefore most of the
fixed rate instruments are short term in nature, fair value significantly approximates to carrying value.
Financial liabilities at amortized cost
Redeemable capital
Long term finances
Liabilities against assets subject to finance lease
Preference shares
Short term borrowings
Trade creditors
Accrued liabilities
Bills payable
Payable to Provident Fund Trust
Workers' Profit Participation Fund
Other payables
Due to related party
Mark-up accrued on borrowings
Dividend payable
Derivatives
Cross currency swaps
8
9
10
11
12
13
13
13
13
13
13
14
15
16
13
Carrying values Fair values Carrying values Fair values
6,024,844,185
1,773,447,469
32,586,801
148,367,255
4,819,186,842
1,615,111,688
303,875,359
385,516,037
83,897,625
55,243,056
7,384,370
-
1,501,702,254
13,415,572
16,764,578,513
-
6,024,844,185
1,773,447,469
32,586,801
148,367,255
4,819,186,842
1,615,111,688
303,875,359
385,516,037
83,897,625
55,243,056
7,384,370
-
1,501,702,254
13,415,572
16,764,578,513
-
8,038,939,061
3,436,652,874
36,436,705
574,518,935
8,156,743,175
1,499,989,313
519,327,523
1,755,448,679
96,248,979
47,015,366
10,152,164
286,395,126
1,425,935,847
32,729,078
25,916,532,825
7,424,080
8,038,939,061
3,436,652,874
36,436,705
574,518,935
8,156,743,175
1,499,989,313
519,327,523
1,755,448,679
96,248,979
47,015,366
10,152,164
286,395,126
1,425,935,847
32,729,078
25,916,532,825
7,424,080
2013 2012
RupeesRupees RupeesRupees
Loans and receivables
Long term deposits
Trade receivables
Advances to employees
Security deposits
Margin deposits
Letters of credit
Insurance claims
Other receivables
Due from Agritech Limited
Cash and bank balances
Note
21
24
25
25
25
25
25
25
26
29
Carrying values Fair values Carrying values Fair values
24,477,987 24,477,987 30,030,493 30,030,493
2,149,837,255 2,149,837,255 2,384,301,663 2,384,301,663
34,028,925 34,028,925 33,673,181 33,673,181
5,967,336 5,967,336 5,435,136 5,435,136
34,238,755 34,238,755 34,238,755 34,238,755
25,964,274 25,964,274 48,712,485 48,712,485
10,105,655 10,105,655 1,160,685 1,160,685
7,745,175 7,745,175 6,609,646 6,609,646
16,600,910 16,600,910 - -
132,259,604 132,259,604 289,721,743 289,721,743
2,441,225,876 2,441,225,876 2,833,883,787 2,833,883,787
2013 2012
RupeesRupees RupeesRupees
Azgard Nine Limited78

Notes to the Financial Statementsfor the year ended 30 June 2013
Fair value hierarchy
Level 1
Level 2
Level 3
42.4.1 Determination of fair values
Long term investments - level 1
Long term investments - level 3 - Montebello s.r.l.
The table below analyses financial instruments carried at fair value, by valuation method. The different levels have been
defined as follows:
The fair value of available for sale investment is determined by reference to their quoted closing repurchase price at the
reporting date.
The Company involved an independent Chartered Accountancy firm to review the financial projections of its subsidiary
prepared by the management to determine the fair value of its investment in the subsidiary. In determining the fair values of
investments in subsidiary, discount factor adjusted for country and other risks of 11.89% (2012: 12.00%) per annum has been
used. If discount factor was 1% higher or lower, the carrying amount of investment would decrease or increase by Rs. 152.739
million or Rs. 189.702 million (2012: Rs. 125.76 million or Rs. 149.86 million) respectively. The management also makes various
other assumptions based on historical trends and future plans of the management. There are normal risks associated with
these assumptions and may include effects of regulatory and legislative changes, increased competition, technological
changes, pricing pressures, changes in labour and material costs and the prevalent general business and economic conditions.
However, there are no other sources of estimation uncertainty that may have a significant risk of causing any material
adjustment to the carrying amounts of investments.
A number of the Company’s accounting policies and disclosures require the determination of fair value, for both financial and
non–financial assets and liabilities. Fair values have been determined for measurement and / or disclosure purposes based on
the following methods.
: inputs other than quoted prices included within Level 1 that are observable for the asset or liability, either
directly (i.e., as prices) or indirectly (i.e., derived from prices)
: quoted prices (unadjusted) in active markets for identical assets or liabilities
: inputs for the asset or liability that are not based on observable market data (unobservable inputs).
The carrying value of financial assets and liabilities reflected in financial statements approximate their respective fair values.
30 June 2013
Available for sale investments
Long term investments
Short term investment - Agritech Limited
30 June 2012
Available for sale investments
Long term investments
Short term investment - Agritech Limited
Level 3
1,460,660,737
700,000,000
2,160,660,737
-
10,969,811,440
10,969,811,440
Rupees
Level 2
-
-
-
-
-
-
Rupees
Level 1
31,221
-
31,221
14,831
-
14,831
Rupees
Annual Report 2013 79
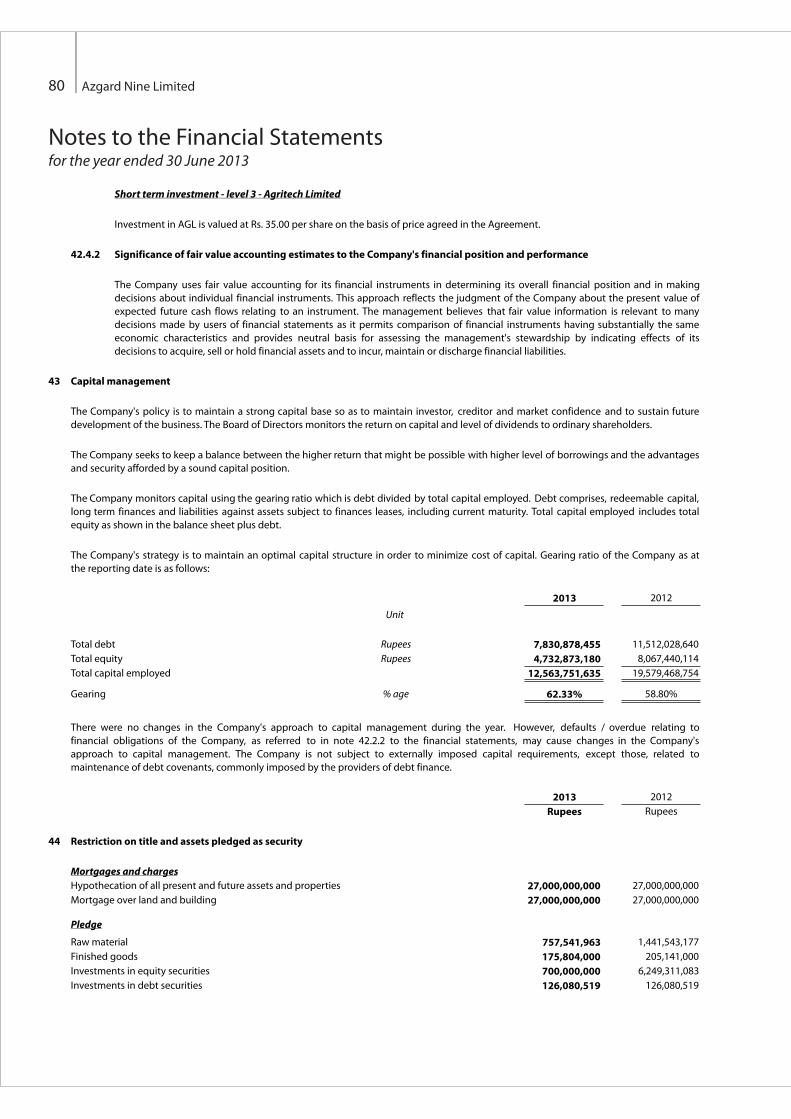
Notes to the Financial Statementsfor the year ended 30 June 2013
42.4.2 Significance of fair value accounting estimates to the Company's financial position and performance
43 Capital management
Investment in AGL is valued at Rs. 35.00 per share on the basis of price agreed in the Agreement.
The Company uses fair value accounting for its financial instruments in determining its overall financial position and in making
decisions about individual financial instruments. This approach reflects the judgment of the Company about the present value of
expected future cash flows relating to an instrument. The management believes that fair value information is relevant to many
decisions made by users of financial statements as it permits comparison of financial instruments having substantially the same
economic characteristics and provides neutral basis for assessing the management's stewardship by indicating effects of its
decisions to acquire, sell or hold financial assets and to incur, maintain or discharge financial liabilities.
The Company's policy is to maintain a strong capital base so as to maintain investor, creditor and market confidence and to sustain future
development of the business. The Board of Directors monitors the return on capital and level of dividends to ordinary shareholders.
The Company seeks to keep a balance between the higher return that might be possible with higher level of borrowings and the advantages
and security afforded by a sound capital position.
The Company monitors capital using the gearing ratio which is debt divided by total capital employed. Debt comprises, redeemable capital,
long term finances and liabilities against assets subject to finances leases, including current maturity. Total capital employed includes total
equity as shown in the balance sheet plus debt.
The Company's strategy is to maintain an optimal capital structure in order to minimize cost of capital. Gearing ratio of the Company as at
the reporting date is as follows:
There were no changes in the Company's approach to capital management during the year. However, defaults / overdue relating to
financial obligations of the Company, as referred to in note 42.2.2 to the financial statements, may cause changes in the Company's
approach to capital management. The Company is not subject to externally imposed capital requirements, except those, related to
maintenance of debt covenants, commonly imposed by the providers of debt finance.
Total debt Rupees 7,830,878,455 11,512,028,640
Total equity Rupees 4,732,873,180 8,067,440,114
Total capital employed 12,563,751,635 19,579,468,754
Gearing % age 62.33% 58.80%
Unit
2013 2012
44 Restriction on title and assets pledged as security
Mortgages and charges
Hypothecation of all present and future assets and properties 27,000,000,000 27,000,000,000
Mortgage over land and building 27,000,000,000 27,000,000,000
Pledge
Raw material 757,541,963 1,441,543,177
Finished goods 175,804,000 205,141,000
Investments in equity securities 700,000,000 6,249,311,083
Investments in debt securities 126,080,519 126,080,519
2012
Rupees
2013
Rupees
Short term investment - level 3 - Agritech Limited
Azgard Nine Limited80

Notes to the Financial Statementsfor the year ended 30 June 2013
45 Remuneration of chief executive, directors and executives
46 Plant capacity and actual production
Spinning
Number of rotors installed No. 2,416 2,416
Plant capacity on the basis of utilization
converted into 6.5s count Kgs 10,257,997 8,722,579
Actual production converted into 6.5s count Kgs 9,805,510 6,844,047
Number of spindles installed No. 54,888 54,408
Plant capacity on the basis of utilization
converted into 20s count Kgs 7,583,141 7,085,211
Actual production converted into 20s count Kgs 7,214,238 6,444,272
The aggregate amount charged in the financial statements for the year in respect of remuneration, including all benefits to the Chief
Executive, Directors and Executives of the Company is as follows:
Managerial remuneration
Medical
Utilities and house rent
Post employment benefits
Number of persons
Managerial remuneration
Medical
Utilities and house rent
Post employment benefits
Number of persons
45.1 The chief executive is provided with free use of Company maintained car.
2013
2012
Directors
Directors
133,763,462
13,139,967
66,702,102
10,767,689
224,373,220
118
118,836,832
11,883,701
52,515,932
9,403,689
192,640,154
102
Executives
Executives
Rupees
Rupees
Non-executive
-
-
-
-
-
3
Non-executive
-
-
-
-
-
2
Rupees
Rupees
Executive
14,347,273
1,434,723
7,681,662
1,219,518
24,683,176
3
Executive
14,458,860
1,445,880
5,990,564
1,229,004
23,124,308
4
Rupees
Rupees
Chief Executive
15,999,996
1,599,996
6,400,008
1,359,996
25,359,996
1
Chief Executive
15,999,996
1,599,996
6,400,008
1,359,996
25,359,996
1
Rupees
Rupees
Unit 2013 2012
Pledge of equity securities amounting to Rs. 700.000 million (2012: Rs. 1,322.777 million) relates to facilities availed by AGL.
Annual Report 2013 81
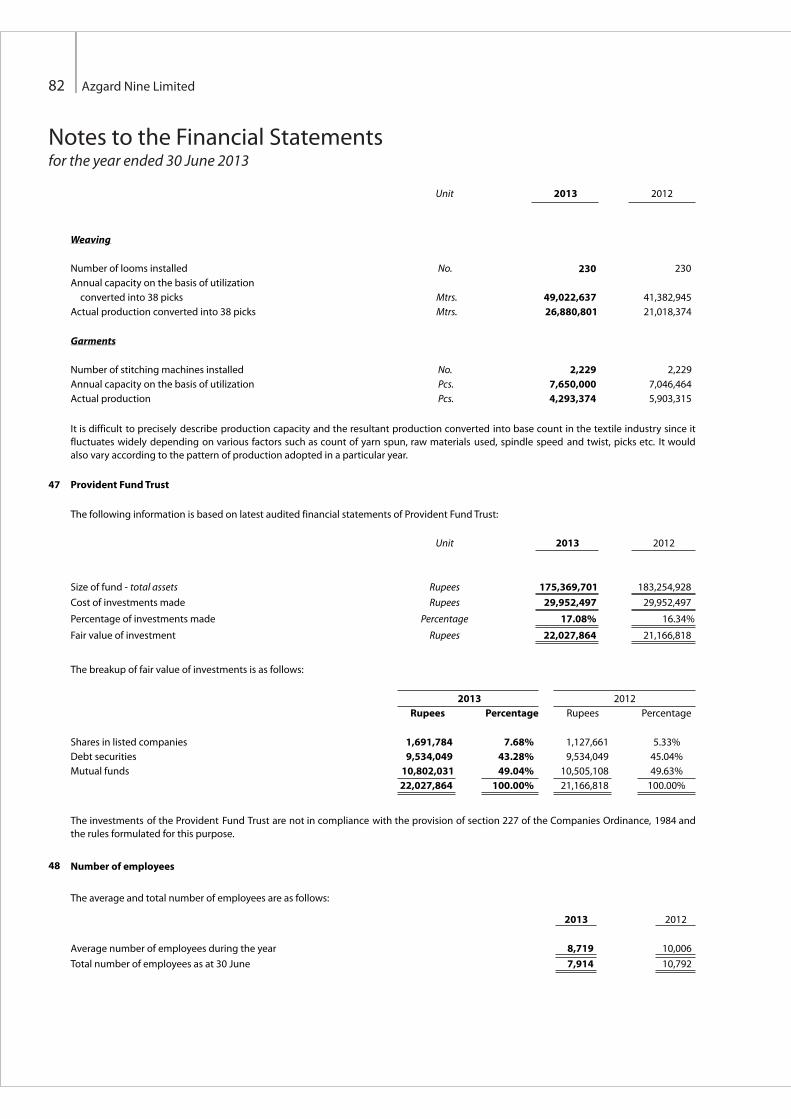
Notes to the Financial Statementsfor the year ended 30 June 2013
Weaving
Number of looms installed No. 230 230
Annual capacity on the basis of utilization
converted into 38 picks Mtrs. 49,022,637 41,382,945
Actual production converted into 38 picks Mtrs. 26,880,801 21,018,374
Garments
Number of stitching machines installed No. 2,229 2,229
Annual capacity on the basis of utilization Pcs. 7,650,000 7,046,464
Actual production Pcs. 4,293,374 5,903,315
47 Provident Fund Trust
The following information is based on latest audited financial statements of Provident Fund Trust:
Unit
Unit
2013
2013
2012
2012
Size of fund - total assets Rupees 175,369,701 183,254,928
Cost of investments made Rupees 29,952,497 29,952,497
Percentage of investments made Percentage 17.08% 16.34%
Fair value of investment Rupees 22,027,864 21,166,818
The breakup of fair value of investments is as follows:
Shares in listed companies
Debt securities
Mutual funds
48 Number of employees
2013 2012
Average number of employees during the year 8,719 10,006
Total number of employees as at 30 June 7,914 10,792
It is difficult to precisely describe production capacity and the resultant production converted into base count in the textile industry since it
fluctuates widely depending on various factors such as count of yarn spun, raw materials used, spindle speed and twist, picks etc. It would
also vary according to the pattern of production adopted in a particular year.
The investments of the Provident Fund Trust are not in compliance with the provision of section 227 of the Companies Ordinance, 1984 and
the rules formulated for this purpose.
The average and total number of employees are as follows:
Rupees Percentage
1,127,661 5.33%
9,534,049 45.04%
10,505,108 49.63%
21,166,818 100.00%
20122013
Percentage
7.68%
43.28%
49.04%
100.00%
Rupees
1,691,784
9,534,049
10,802,031
22,027,864
Azgard Nine Limited82

Notes to the Financial Statementsfor the year ended 30 June 2013
49 Corresponding figures
50 Date of authorization for issue
51 General
Figures have been rounded off to the nearest rupee.
These financial statements were authorized for issue on 30 September 2013 by the Board of Directors of the Company.
Corresponding figures have been re-arranged, where necessary, for the purpose of comparison. Significant reclassification for better
presentation includes provision against trade receivables amounting to Rs. 174.67 million previously included in net other income now
presented in selling and distribution expenses.
DirectorChief ExecutiveLahore
Annual Report 2013 83

This page has been left blank intentionally

Consolidated Financial Statements

KKPP GGKPMG Taseer Hadi & Co.
Chartered Accountants
53 L Gulberg III
Lahore Paksitan
Telephone
Fax
Internet
+ 92 (42) 3585 0471-76
+ 92 (42) 3585 0477
www.kpmg.com.pk
KPMG Taseer Hadi & Co., a Partnership firm registered in Pakistanand a member firm of the KPMG network of independent memberfirms affiliated with KPMG International Cooperative("KPMG International"), a Swiss entity.
Auditors’ Report to the Members
Azgard Nine Limited86
We have audited the annexed consolidated financial statements comprising consolidated Balance Sheet of("the Holding Company") and its foreign subsidiary company Montebello s.r.l. (here-in-after collectively referred
as "the Group") as at 30 June 2013 and the related consolidated Profit and Loss Account, consolidated Statement ofComprehensive Income, consolidated Cash Flow Statement and consolidated Statement of Changes in Equity togetherwith the notes forming part thereof, for the year then ended. We have also expressed separate opinion on the financialstatements of the Holding Company. The financial statements of the foreign subsidiary company, Montebello s.r.l., wereaudited by other firm of auditors whose report has been furnished to us and our opinion, in so far as it relates to theamounts included for such company, is based solely on report of such other auditor. These consolidated financialstatements are the responsibility of the Holding Company's management. Our responsibility is to express an opinion onthese consolidated financial statements based on our audit.
Our audit was conducted in accordance with the International Standards on Auditing and accordingly included suchtests of accounting records and such other auditing procedures as we considered necessary in the circumstances.
(a) As stated in note 2.3 and 43.2.2 to the consolidated financial statements, the Group could not make timelyrepayments of principal and interest / mark-up related to long term debts and as at reporting date certain financialand other covenants imposed by the lenders could not be complied with. International Accounting Standard onPresentation of financial statements (IAS-1) requires that if an entity breaches a provision of a long-term loanarrangement on or before the end of the reporting period with the effect that the liability becomes payable ondemand, it should classify the liability as current. In these consolidated financial statements the long term debtshave been classified as long term according to the individual loan repayment schedules. Had these liabilities beenclassified as per IAS-1, current liabilities of the Group would have increased by Rs. 7,146.25 million as at thereporting date;
Azgard NineLimited
(b) As stated in note 37.1 to the consolidated financial statements, the results for four months period of AgritechLimited ("AGL") till date of disposal are pro-rated results of six months reviewed financial information of AGL. Achange in the results of AGL, which is impracticable to identify, will alter non-controlling interest, the gain ondisposal of AGL and related cash flows. However, such change will not have an impact on the loss for the yearattributable to ordinary equity holders of the Holding Company.
In our opinion, except for the effects on the consolidated financial statements of the matters referred in paragraph(a) and (b) above, the consolidated financial statements present fairly the financial position of the HoldingCompany and its subsidiary company as at 30 June 2013 and the results of their operations for the year then ended.
We draw attention to the matter that the Group has reported negative cash flows of Rs. 930.01 million from its operationsduring the year ended 30 June 2013 and, as of that date, its current liabilities exceeded its current assets by Rs. 3,338.67million, including Rs. 1,945.36 million relating to overdue principal and mark-up thereon, and its accumulated loss stoodat Rs. 6,726.95 million.The difference between current liabilities and current assets would be Rs. 10,484.93 million, had the

KKPP GGKPMG Taseer Hadi & Co.
Lahore
Date : 30 September 2013
KPMG Taseer Hadi & Co.
Chartered Accountants
(Kamran Iqbal Yousafi)
Annual Report 2013 87
Group classified its long term debts as current for reasons more fully explained in the note 2.3 to the consolidatedfinancial statements. These conditions indicate the existence of a material uncertainty that may cast significant doubtabout the Group's ability to continue as a going concern. These consolidated financial statements have however beenprepared on a going concern basis for the reasons more fully explained in note 2.2 to the consolidated financialstatements. Our opinion is not qualified in respect of this matter.

Consolidated Balance Sheetas at 30 June 2013
DirectorChief ExecutiveLahore
EQUITY AND LIABILITIES
Share capital and reserves
Authorized share capital
Issued, subscribed and paid-up capital
Reserves
Accumulated loss
Non-controlling interest
Surplus on revaluation of fixed assets
Non-current liabilities
Redeemable capital - secured
Long term finances - secured
Liabilities against assets subject to finance lease - secured
Current liabilities
Current portion of non-current liabilities
Short term borrowings
Trade and other payables
Interest / mark-up accrued on borrowings
Dividend payable
Liabilities of subsidiary classified as held for sale
Contingencies and commitments
ASSETS
Non-current assets
Property, plant and equipment
Intangible assets
Long term investments
Long term deposits - unsecured, considered good
Current assets
Stores, spares and loose tools
Stock in trade
Trade receivables
Advances, deposits, prepayments and other receivables
Due from Agritech Limited - unsecured, considered good
Short term investments
Current taxation
Cash and bank balances
Assets of subsidiary classified as held for sale
The annexed notes 1 to 53 form an integral part of these consolidated financial statemements.
2013 2012
RupeesNote Rupees
5 15,000,000,000 15,000,000,000
5 4,548,718,700 4,548,718,700
6 3,120,841,351 3,107,198,909
(6,726,946,203) (7,904,229,485)
942,613,848 (248,311,876)
7 - 3,917,588,149
942,613,848 3,669,276,273
8 3,470,587,281 6,746,439,428
9 4,563,334,050 2,729,435,196
10 1,646,718,198 -
11 - 24,020,739
6,210,052,248 2,753,455,935
12 832,991,069 8,105,591,253
13 5,024,533,069 8,433,954,491
14 2,957,118,822 4,277,177,878
15 1,501,702,254 1,357,356,641
16 13,415,572 32,729,078
37 - 30,828,943,270
10,329,760,786 53,035,752,611
17
20,953,014,163 66,204,924,247
18 12,973,010,523 13,416,311,530
19 693,644,333 696,249,150
20 266,105,729 14,831
21 29,169,416 39,488,956
13,961,930,001 14,152,064,467
22 130,970,353 173,319,525
23 2,339,039,126 3,131,907,430
24 2,757,283,943 2,826,169,806
25 830,239,233 892,886,051
26 16,600,910 -
27 700,000,000 -
28 73,909,984 110,270,269
29 143,040,613 310,989,124
37 - 44,607,317,575
6,991,084,162 52,052,859,780
20,953,014,163 66,204,924,247
Azgard Nine Limited88

2013 2012
Note Rupees Rupees
Continuing operations
Sales - net 30 14,439,185,602 11,907,437,305
Cost of sales 31 (13,694,668,313) (12,949,887,639)
Gross profit / (loss) 744,517,289 (1,042,450,334)
Selling and distribution expenses 32 (986,163,524) (1,116,950,678)
Administrative and general expenses 33 (597,635,433) (630,202,550)
Operating loss (839,281,668) (2,789,603,562)
Net other expenses 34 (14,588,343) (15,951,065)
Finance cost 35 (2,095,622,067) (3,387,282,464)
Loss before taxation (2,949,492,078) (6,192,837,091)
Taxation 36 (137,539,517) (115,954,408)
Loss after taxation from continuing operations (3,087,031,595) (6,308,791,499)
Discontinued operations
Gain / (loss) after taxation from discontinued operations 37 741,578,839 (1,646,592,181)
Total loss for the year (2,345,452,756) (7,955,383,680)
Loss attributable to:
Ordinary equity holders of the Holding Company (2,098,568,865) (7,697,521,401)
Non-controlling interest - discontinued operations (246,883,891) (257,862,279)
(2,345,452,756) (7,955,383,680)
(Loss) / earning per share -basic and diluted
- continuing operations 38.1 (6.787) (13.869)
- discontinued operations 38.2 2.173 (3.053)
The annexed notes 1 to 53 form an integral part of these consolidated financial statemements.
Consolidated Profit and Loss Accountfor the year ended 30 June 2013
DirectorChief ExecutiveLahore
Annual Report 2013 89

Consolidated Statement of Comprehensive Incomefor the year ended 30 June 2013
DirectorChief ExecutiveLahore
2013 2012
Rupees Rupees
Loss after taxation (2,345,452,756)
Other comprehensive loss:
Items that are or may be subsequently reclassified to profit or loss:
Changes in fair value of cash flow hedges -
Changes in fair value of available for sale financial assets 16,390
Foreign exchange differences on translation of foreign subsidiary 13,626,052
13,642,442
Total comprehensive loss for the year (2,331,810,314)
Total comprehensive loss attributable to:
Ordinary equity holders of the Holding Company (2,084,926,423)
Non-controlling interest (246,883,891)
(2,331,810,314)
The annexed notes 1 to 53 form an integral part of these consolidated financial statemements.
(7,955,383,680)
(48,894,931)
1,967
(2,961,496)
(51,854,460)
(8,007,238,140)
(7,749,375,861)
(257,862,279)
(8,007,238,140)
Azgard Nine Limited90

Consolidated Cash Flow Statementfor the year ended 30 June 2013
DirectorChief ExecutiveLahore
2013 2012
Note Rupees Rupees
Cash flow from operating activities
Cash generated from operations 40
Interest / mark-up paid
Taxes paid
Long term deposits
Net cash (used in) / generated from operating activities
Net cash generated from / (used in) operating
activities of discontinued operations
Cash flow from investing activities
Capital expenditure
Proceeds from disposal of property, plant and equipment
Proceeds from disposal of Agritech Limited - net
Net cash generated from / (used in) investing activities
Net cash generated from / (used in) from investing
activities of discontinued operations
Cash flow from financing activities
Receivable from AGL
Redemption of redeemable capital
Repayment of long term finances
Repayment of liabilities against assets subject
to finance lease
Net increase in short term borrowings
Net cash (used in) / generated from financing activities
Net cash (used in) / generated from financing activities
of discontinued operations
Net increase / (decrease) in cash and cash equivalents
Cash and cash equivalents at beginning of the year
Unrealized exchange gain on cash and cash equivalents
Cash and cash equivalents at end of the year 41
The annexed notes 1 to 53 form an integral part of these consolidated financial statemements.
222,428,993 301,226,935
(1,064,842,220) (244,885,706)
(91,869,771) (40,285,387)
4,271,014 (5,108,883)
(930,011,984) 10,946,959
26,561,331 (860,194,286)
(903,450,653) (849,247,327)
(75,789,208) (114,908,812)
3,110,329 16,350,533
3,128,926,166 -
3,056,247,287 (98,558,279)
232,023,953 (1,104,107,044)
3,288,271,240 (1,202,665,323)
5,221,794 -
(199,997) -
(990,663,587) -
(2,673,704) (7,097,855)
(550,294,789) (556,317,088)
(1,538,610,283) (563,141,943)
(258,585,284) 1,737,607,035
587,625,020 (877,720,558)
(1,521,060,636) (643,584,064)
307,073 243,986
(933,128,543) (1,521,060,636)
Annual Report 2013 91

Co
nso
lida
ted
Sta
tem
en
t o
f C
ha
ng
es
in E
qu
ity
for
the
yea
r en
ded
30
Ju
ne
20
13
Dir
ect
or
Ch
ief
Exe
cuti
veL
ah
ore
Th
e a
nn
exe
d n
ote
s 1
to
53
fo
rm a
n in
teg
ral p
art
of
the
se c
on
solid
ate
d f
ina
nci
al s
tate
me
me
nts
.
No
te
As
at
01
Ju
ly 2
01
1
Tota
l co
mp
reh
en
siv
e in
com
e f
or
the
ye
ar
Loss
fo
r th
e y
ea
r e
nd
ed
30
Ju
ne
20
12
Oth
er
com
pre
he
nsi
ve
(lo
ss)
/ in
com
e f
or
yea
r e
nd
ed
30
Ju
ne
20
12
Tota
l co
mp
reh
en
siv
e (
loss
) /
inco
me
fo
r th
e y
ea
r
Pre
fere
nce
sh
are
s is
sue
d t
o n
on
-co
ntr
oll
ing
inte
rest
du
rin
g t
he
ye
ar
Tra
nsf
er
of
incr
em
en
tal d
ep
reci
ati
on
fro
m s
urp
lus
on
re
va
lua
tio
n
of
pro
pe
rty,
pla
nt
an
d e
qu
ipm
en
t
As
at
30
Ju
ne
20
12
As
at
01
Ju
ly 2
01
2
Tota
l co
mp
reh
en
siv
e in
com
e f
or
the
ye
ar
Loss
fo
r th
e y
ea
r e
nd
ed
30
Ju
ne
20
13
Oth
er
com
pre
he
nsi
ve
in
com
e f
or
the
ye
ar
en
de
d 3
0 J
un
e 2
01
3
Tota
l co
mp
reh
en
siv
e in
com
e /
(lo
ss)
for
the
ye
ar
Eff
ect
of
dis
po
sal o
f su
bsi
dia
ry
Su
rplu
s o
n r
ev
alu
ati
on
of
fixe
d a
sse
ts o
f su
bsi
dia
ry3
7.4
No
n-c
on
tro
llin
g in
tere
st3
7.2
Tra
nsf
er
of
incr
em
en
tal d
ep
reci
ati
on
fro
m s
urp
lus
on
re
va
lua
tio
n
of
pro
pe
rty,
pla
nt
an
d e
qu
ipm
en
t
As
at
30
Ju
ne
20
13
Ca
pit
al
rese
rve
9,8
25
,65
3,2
70
(7,9
55
,38
3,6
80
)
(51
,85
4,4
60
)
(8,0
07
,23
8,1
40
)
1,5
93
,34
2,6
90
25
7,5
18
,45
3
3,6
69
,27
6,2
73
3,6
69
,27
6,2
73
(2,3
45
,45
2,7
56
)
13
,64
2,4
42
(2,3
31
,81
0,3
14
)
3,1
50
,16
3,5
45
(3,6
70
,70
4,2
58
)
(52
0,5
40
,71
3)
12
5,6
88
,60
2
94
2,6
13
,84
8
Tota
l e
qu
ity
Ru
pe
es
2,5
82
,10
7,7
38
(25
7,8
62
,27
9)
-
(25
7,8
62
,27
9)
1,5
93
,34
2,6
90
-
3,9
17
,58
8,1
49
3,9
17
,58
8,1
49
(24
6,8
83
,89
1)
-
(24
6,8
83
,89
1)
-
(3,6
70
,70
4,2
58
)
(3,6
70
,70
4,2
58
)
- -
No
n-c
on
tro
llin
g
inte
rest
Ru
pe
es
2,6
94
,82
6,8
32
(7,6
97
,52
1,4
01
)
(51
,85
4,4
60
)
(7,7
49
,37
5,8
61
)
-
25
7,5
18
,45
3
(4,7
97
,03
0,5
76
)
(4,7
97
,03
0,5
76
)
(2,0
98
,56
8,8
65
)
13
,64
2,4
42
(2,0
84
,92
6,4
23
)
3,1
50
,16
3,5
45
-
3,1
50
,16
3,5
45
12
5,6
88
,60
2
(3,6
06
,10
4,8
52
)
Tota
l re
serv
es
Ru
pe
es
Re
ve
nu
e r
ese
rve
Acc
um
ula
ted
lo
ss
(46
4,2
26
,53
7)
(7,6
97
,52
1,4
01
)
-
(7,6
97
,52
1,4
01
)
-
25
7,5
18
,45
3
(7,9
04
,22
9,4
85
)
(7,9
04
,22
9,4
85
)
(2,0
98
,56
8,8
65
)
-
(2,0
98
,56
8,8
65
)
3,1
50
,16
3,5
45
-
3,1
50
,16
3,5
45
12
5,6
88
,60
2
(6,7
26
,94
6,2
03
)
Ru
pe
es
Av
ail
ab
le f
or
sale
fin
an
cia
l a
sse
ts
(5,8
00
)
-
1,9
67
1,9
67
- -
(3,8
33
)
(3,8
33
)
-
16
,39
0
16
,39
0
- - - -
12
,55
7
Ru
pe
es
Re
serv
e
on
me
rge
r
10
5,1
52
,00
5
- - - - -
10
5,1
52
,00
5
10
5,1
52
,00
5
- - - - - - -
10
5,1
52
,00
5
Ru
pe
es
Ca
sh f
low
he
dg
es
48
,89
4,9
31
-
(48
,89
4,9
31
)
(48
,89
4,9
31
)
- - - - - - - - - - - -
Ru
pe
es
Sh
are
pre
miu
m
2,3
58
,24
6,7
61
- - - - -
2,3
58
,24
6,7
61
2,3
58
,24
6,7
61
- - - - - - -
2,3
58
,24
6,7
61
Ru
pe
es
Ru
pe
es
Pre
fere
nce
sh
are
s
red
em
pti
on
re
serv
e
66
1,2
50
,83
0
- - - - -
66
1,2
50
,83
0
66
1,2
50
,83
0
- - - - - - -
66
1,2
50
,83
0
Tra
nsl
ati
on
re
serv
e
(14
,48
5,3
58
)
-
(2,9
61
,49
6)
(2,9
61
,49
6)
- -
(17
,44
6,8
54
)
(17
,44
6,8
54
)
-
13
,62
6,0
52
13
,62
6,0
52
- - - -
(3,8
20
,80
2)
Ru
pe
es
Issu
ed
, su
bsc
rib
ed
an
d p
aid
-up
ca
pit
al
4,5
48
,71
8,7
00
- - - - -
4,5
48
,71
8,7
00
4,5
48
,71
8,7
00
- - - - - - -
4,5
48
,71
8,7
00
Ru
pe
es
Azgard Nine Limited92

Notes to the Consolidated Financial Statementsfor the year ended 30 June 2013
2 Basis of preparation
2.2 Going concern assumption
The Group comprises of the following Companies:
These consolidated financial statements have been prepared in accordance with approved accounting standards as applicable in
Pakistan and the requirements of Companies Ordinance, 1984. Approved accounting standards comprise of such International
Financial Reporting Standards ("IFRSs") issued by the International Accounting Standards Board as notified under the provisions of
the Companies Ordinance, 1984, provisions of and directives issued under the Companies Ordinance, 1984. In case requirements
differ, the provisions of or directives under the Companies Ordinance, 1984 shall prevail.
AGL was the Subsidiary of ANL as at beginning of the year, however, during the year, ANL has divested major part of its
shareholding resulting in loss of control in AGL as referred in note 37. Accordingly, these financial statements include results of
AGL only upto 31 October 2012 being the date on which ANL's control ceases. Consequently, the remaining investment in AGL
became an ordinary investment of the Group as against the subsidiary as at beginning of the year.
As a part of the second restructuring, the management of the Group intends to sell certain low performing assets, debt restructuring and
divestment of its remaining shareholding of Rs. 700.000 million in AGL to achieve better liquidity. With these proposed measures,
management of the Group envisages that sufficient financial resources will be available for continuing operations of the Group. With
repayment of long term debt there will be a positive impact on reduction of finance costs and with more effective management of
resources and raw material procurement, the Group is expected to operate profitably, subject to impact, if any, of uncontrollable external
circumstances including power crises and global market conditions.
Due to the above mentioned reasons, the Group has reported negative cash flows of Rs. 930.012 million from its continuing operations
during the year ended 30 June 2013 and, as of that date, its current liabilities exceeded its current assets by Rs. 3,338.677 million, including
Rs. 1,945.364 million relating to overdue principal and interest / mark-up thereon, and its accumulated loss stood at Rs. 6,726.946 million.
These conditions cast a significant doubt about the Group's ability to continue as a going concern. These financial statements have
however, been prepared on a going concern basis. The assumption that the Group would continue as a going concern is based on the
measures as explained in the succeeding paragraph and expectation of future profitability and positive cash flows from operating
activities.
ANL was incorporated in Pakistan as a Public Limited Company and is listed on Karachi Stock Exchange (Guarantee) Limited. The
Company is a composite spinning, weaving, dyeing and stitching unit engaged in the manufacturing of yarn, denim and denim
products. The registered office of the Company is situated at Ismail Aiwan-e-Science, off Shahrah-e-Roomi, Lahore. The Company
has three production units with Unit I located at 2.5 km off Manga, Raiwind Road, District Kasur, Unit II at Alipur Road,
Muzaffargarh and Unit III at 20 km off Ferozpur Road, 6 km Badian Road on Ruhi Nala, Der Khurd, Lahore.
The Group in line with the worldwide and nationwide recessionary trends and other economic conditions is facing liquidity crisis.
During the year, the Group has divested majority of its shareholding in AGL and as a result of the said divestment, the Group has
10,042.991 million. However, the Group could only manage to make available Rs. 226.819 million to meets its
37. Further, because of constraints in the availability of funds, installed operational capacities could not be
the cost of sales would have been lower.
achieved due to unavailability of sufficient working capital. Had the Group been able to make timely purchases of raw materials
requirements from the divestment of AGL as opposed to the Rs. 926.819 million surplus anticipated by the Group as
in noteexplained
working capital
amounting to Rs.
settled its long term loans, certain interest / mark-up, redeemable capital, short term borrowings, bills payable and other charges
2.1 Statement of compliance
During the year, 100% owned subsidiary of ANL, Farital AB ("FAB") has been dissolved. FAB was incorporated in order to acquire
100% interest in MSRL, owner of an Italian fabric and jeans brand based in Italy. Consequent to dissolution of FAB, 100% interest
in MSRL has been transferred to ANL. MSRL is engaged in sale of denim and denim products.
Montebello s.r.l. ("MSRL") - Subsidiary Company1.2
Agritech Limited ("AGL")1.3
1.1 Azgard Nine Limited ("ANL") - Holding Company
1 Reporting entity
Annual Report 2013 93

Notes to the Consolidated Financial Statementsfor the year ended 30 June 2013
2.3 Financial liabilities
Principal net of
current maturity
Rupees
Redeemable capital
Term Finance Certificates - II 613,440,233
Term Finance Certificates - IV 1,021,683,477
Term Finance Certificates - V 402,008,983
Privately Placed Term Finance Certificates - VI 2,896,803,000
Privately Placed Term Finance Certificates 326,456,184
Privately Placed Term Finance Certificates 217,200,000
5,477,591,877
Long term finances
Deutsche Investitions - Und MBH (Germany) 907,054,268
Saudi Pak Industrial and Agricultural Company Limited 41,040,190
HSBC Bank (Middle East) Limited 209,782,786
Citi Bank N.A (Pakistan) 510,785,519
1,668,662,763
7,146,254,640
2.4 Basis of measurement
2.5 Judgments, estimates and assumptions
However, the long term debts in the amount of Rs. 7,146.255 million as detailed below have been classified as long term as per the
repayment schedules in the financial statements as the management considers that event of default has not been declared by the
lenders and also because of the fact that during the year the Group has commenced discussions with its lenders for reprofiling of its
long term debts:
These consolidated financial statements have been prepared under the historical cost convention except for certain financial
instruments at fair value, certain financial instruments at amortized cost and certain items of property, plant and equipment at revalued
amounts. In these consolidated financial statements, except for the amounts reflected in the cash flow statement, all transactions have
been accounted for on accrual basis.
The Group could not make timely repayments of principal and interest / mark-up related to long term debts as referred to in note
43.2.2. Further, as at the reporting date, the Group could not comply with certain financial and other covenants imposed by the lenders.
As per the agreed terms of long term debts the lenders have unconditional right to call the loans if timely repayments are not made or
covenants are not complied with. International Accounting Standard on Presentation of financial statements (IAS - 1) requires that if an
entity breaches a provision of a long-term loan arrangement on or before the end of the reporting period with the effect that the
liability becomes payable on demand, it should classify the liability as current.
The preparation of consolidated financial statements requires management to make judgments, estimates and assumptions that affect
the application of accounting policies and the reported amounts of assets, liabilities, income and expenses. The estimates and
associated assumptions and judgments are based on historical experience and various other factors that are believed to be reasonable
under the circumstances, the result of which forms the basis of making judgments about carrying values of assets and liabilities that are
not readily apparent from other sources. Actual results may differ from these estimates. Estimates and underlying assumptions are
reviewed on an ongoing basis. Revisions to accounting estimates are recognized in the period in which the estimate is revised and in
any future periods affected. Judgments made by management in the application of approved accounting standards that have
significant effect on the consolidated financial statements and estimates with a risk of material adjustment in subsequent years are as
follows:
Azgard Nine Limited94

2.5.1 Depreciation method, rates and useful lives of property, plant and equipment
The management of the Group reassesses useful lives, depreciation method and rates for each item of property, plant and equipment
annually by considering expected pattern of economic benefits that the Group expects to derive from that item and the maximum
period up to which such benefits are expected to be available.
2.5.2 Recoverable amount of assets / cash generating units and impairment
2.5.3 Fair values based on inputs from other than active market
2.5.4 Taxation
2.5.5 Provisions
2.5.6 Revaluation of property, plant and equipment
2.6 Functional currency
The management of the Group reviews carrying amounts of its assets and cash generating units for possible impairment and makes
formal estimates of recoverable amount if there is any such indication.
Fair values of financial instruments, which are based on inputs from other than active market are determined using valuation
techniques which incorporate all factors that market participants would consider in setting a price and use inputs that reasonably
represent market expectations and measures of the risk-return factors inherent in the financial instrument.
The Group takes into account the current income tax law and decisions taken by appellate authorities while estimating its tax liabilities.
Provisions are based on best estimate of the expenditure required to settle the present obligation at the reporting date, that is, the
amount that the Group would rationally pay to settle the obligation at the reporting date or to transfer it to a third party.
Revaluation of property, plant and equipment is carried out by independent professional valuers. Revalued amounts of non-
depreciable items are determined by reference to local market values and that of depreciable items are determined by reference to
present depreciated replacement values.
These consolidated financial statements have been prepared in Pak Rupees which is the Group's functional currency.
The frequency of revaluations depends upon the changes in fair values of the items of property, plant and equipment being revalued.
When the fair value of a revalued asset differs materially from its carrying amount, a further revaluation is required. Such frequent
revaluations are unnecessary for items of property, plant and equipment with only insignificant changes in fair value. Instead, it may be
necessary to revalue the item only every three or five years.
Notes to the Consolidated Financial Statementsfor the year ended 30 June 2013
3 Significant accounting polices
3.1 Basis of consolidation
a) Business combinations
The Group measures goodwill at the acquisition date as:
i) the fair value of the consideration transferred; plus
Business combinations are accounted for using the acquisition method as at the acquisition date – i.e. when control is transferred to
the Group. Control is the power to govern the financial and operating policies of an entity so as to obtain benefits from its activities. In
assessing control, the Group takes into consideration potential voting rights that are currently exercisable.
The accounting policies set out below have been applied consistently to all periods presented in these consolidated financial statements.
Annual Report 2013 95

Notes to the Consolidated Financial Statementsfor the year ended 30 June 2013
ii) the recognized amount of any non-controlling interests in the acquiree; plus
iii)
iv)
b) Non-controlling interest
i) at fair value; or
c) Subsidiaries
When the excess is negative, a bargain purchase gain is recognized immediately in profit or loss.
The consideration transferred does not include amounts related to the settlement of pre-existing relationships. Such amounts are
generally recognized in profit or loss.
Transactions costs, other than those associated with the issue of debt or equity securities, that the Group incurs in connection with a
business combination are expensed as incurred.
Any contingent consideration payable is measured at fair value at the acquisition date. If the contingent consideration is classified as
equity, then it is not remeasured and settlement is accounted for within equity. Otherwise, subsequent changes in the fair value of the
contingent consideration are recognized in profit or loss.
ii) at their proportionate share of the acquiree’s identifiable net assets, which are generally at fair value.
e) Transactions eliminated on consolidation
Intra-group balances and transactions, and any unrealised income and expenses arising from intra-group transactions, are eliminated
in preparing the consolidated financial statements. Unrealised gains arising from transactions with equity accounted investees are
eliminated against the investment to the extent of the Group’s interest in the investee. Unrealised losses are eliminated in the same
way as unrealised gains, but only to the extent that there is no evidence of impairment.
Changes in the Group’s interest in a subsidiary that do not result in a loss of control are accounted for as transactions with owners in
their capacity as owners. Adjustments to non-controlling interests are based on a proportionate amount of the net assets of the
subsidiary. No adjustments are made to goodwill and no gain or loss is recognized in profit or loss.
Subsidiaries are entities controlled by the Group. The financial statements of subsidiaries are included in the consolidated financial
statements from the date that control commences until the date that control ceases.
d) Loss of control
On the loss of control, the Group derecognizes the assets and liabilities of the subsidiary, any non-controlling interests and the other
components of equity related to the subsidiary. Any surplus or deficit arising on the loss of control is recognized in profit or loss. The
Group transfers the revaluation surplus directly to retained earnings when it loses control of the subsidiary. If the Group retains any
interest in the previous subsidiary, then such interest is measured at fair value at the date that control is lost. Subsequently that
retained interest is accounted for as an equity-accounted investee or as an available-for-sale financial asset depending on the level of
influence retained.
If share-based payment awards (replacement awards) are required to be exchanged for awards held by the acquiree’s employees
(acquiree’s awards) and relate to past services, then all or a portion of the amount of the acquirer’s replacement awards is included in
measuring the consideration transferred in the business combination. This determination is based on the market based value of the
replacement awards compared with the market-based value of the acquiree’s awards and the extent to which the replacement
awards relate to past and/or future service.
For each business combination, the Group elects to measure any non-controlling interests in the acquiree either:
if the business combination is achieved in stages, the fair value of the pre-existing equity interest in the acquiree; less
the net recognized amount (generally fair value) of the identifiable assets acquired and liabilities assumed.
Azgard Nine Limited96

Notes to the Consolidated Financial Statementsfor the year ended 30 June 2013
3.2 Property, plant and equipment
Buildings on freehold land 2.50%
Plant and machinery 2% - 15%
Furniture, fixtures and office equipment 10% - 20%
Vehicles 20%
Tools and other equipment 10%
Electrical and other installations 10% - 12.5%
3.3 Surplus / deficit arising on revaluation of property, plant and equipment
An item of property, plant and equipment is de-recognized when permanently retired from use. Any gain or loss on disposal of
property, plant and equipment is recognized in profit and loss.
Surplus arising on revaluation of items of property, plant and equipment is carried on balance sheet after reversing deficit relating to
the same item previously recognized in profit and loss, if any. Deficit arising on revaluation is recognized in profit and loss after
reversing the surplus relating to the same item previously carried on balance sheet, if any. An amount equal to incremental
depreciation, being the difference between the depreciation based on revalued amounts and that based on the original cost, net of
deferred tax, if any, is transferred from surplus on revaluation of property, plant and equipment to accumulated profit or loss everyyear.
3.4 Intangible assets
An intangible asset is measured initially at cost. The cost of the intangible asset acquired comprises its purchase price, including non-
refundable purchase taxes, after deducting trade discounts and rebates, and includes other costs directly attributable to the
acquisition. Costs incurred after the asset is in the condition necessary for it to operate in the manner intended by the management
are recognized in profit and loss. Subsequent to initial recognition, intangible assets are measured at cost less accumulated
amortization and accumulated impairment losses, if any.
All intangible assets are amortized over the period, not exceeding five years, over which the Group expects to obtain economic
benefits, on a straight line basis. All intangible assets are tested for impairment at each reporting date. The particular measurement
methods adopted are disclosed in the individual policy statements associated with each intangible asset.
3.5 Software
The cost of acquisition, development and installation of identifiable software products having finite useful lives of more than one year
is recognized as an intangible assets at cost, subsequent to initial recognition, it is measured at cost less accumulated amortization
and accumulated impairment losses, if any.
Further the surplus on revaluation of property, plant and equipment shall be utilized in accordance with the provisions of section 235
of the Companies Ordinance, 1984.
Items of property, plant and equipment are measured at cost less accumulated depreciation and accumulated impairment losses
with the exception of freehold land, which is measured at revalued amount, plant and machinery and building which are measured at
revalued amount less accumulated depreciation and capital work in progress, which is stated at cost less accumulated impairment
losses. Cost comprises purchase price, including import duties and non-refundable purchase taxes, after deducting trade discounts
and rebates, and includes other costs directly attributable to the acquisition or construction, erection and installation.
Major renewals and improvements to an item of property, plant and equipment are recognized in the carrying amount of the item if it
is probable that the embodied future economic benefits will flow to the Group and the cost of renewal or improvement can be
measured reliably. The cost of the day-to-day servicing of property, plant and equipment are recognized in profit and loss as incurred.
The Group recognizes depreciation in profit and loss on property, plant and equipment using depreciation methods and useful lives /
depreciation rates specified below. Depreciation on additions to property, plant and equipment is charged from the month in which
the item becomes available for use. Depreciation is discontinued from the month in which it is disposed or classified as held for
disposal. Depreciation is charged on reducing balance method at the following rates:
Textile and apparel segment Depreciation rates per year
Annual Report 2013 97

Notes to the Consolidated Financial Statementsfor the year ended 30 June 2013
3.6 Research and development expenditure
3.7 Goodwill acquired in business combination
3.8 Stores, spares and loose tools
3.9 Stock in trade
Raw materials Average cost
Work in process Average manufacturing cost
Finished goods Average manufacturing cost
Stock in transit Invoice price plus related expense incurred up to the reporting date
3.10 Employee benefits
Short-term employee benefits
The Group recognizes the undiscounted amount of short term employee benefits to be paid in exchange for services rendered by
employees as a liability after deducting amount already paid and as an expense in profit and loss unless it is included in the cost of
inventories or property, plant and equipment as permitted or required by the approved accounting standards. If the amount paid
exceeds the undiscounted amount of benefits, the excess is recognized as an asset to the extent that the prepayment would lead to a
reduction in future payments or cash refund.
Research activities are activities undertaken with the prospect of gaining new scientific or technical knowledge and understanding.
Expenditure on research activities is recognized in profit and loss as and when incurred.
Goodwill acquired in business combination represents future economic benefits arising from assets that are not capable of being
individually identified and separately recognized. Goodwill is initially recognized at cost which is determined as the excess of the cost
of business combination over the Group's interest in the net fair value of the identifiable assets, liabilities and contingent liabilities of
the subsidiary. Subsequent to initial recognition, goodwill is measured at cost less accumulated impairment losses, if any.
Development activities involve a plan or design for the production of new or substantially improved products and processes.
Development expenditure is capitalized and recognized as an intangible asset only if development costs can be measured reliably,
the product or process is technically and commercially feasible, future economic benefits are probable, and the Group intends to and
has the sufficient technical, financial and other resources to complete development and to use or sell the asset or its output for which
a market exists. The expenditure capitalized includes the cost of materials, direct labour and overhead costs that are directly
attributable to preparation of the asset for its intended use. All other development expenditure is recognized in profit and loss as and
when incurred. The intangible asset so recognized is initially measured at cost. Subsequent to initial recognition, it is measured at cost
less accumulated amortization and accumulated impairment losses, if any. Expenditure previously recognized in profit and loss is not
capitalized as part of the cost of intangible asset.
These are stated at lower of cost and net realizable value. Cost is determined using the weighted average method.
The goodwill is tested for impairment at each balance sheet date. The identified amount of impairment, if any, is allocated to goodwill
in accordance with the requirement of IFRS.
These are valued at lower of cost and net realizable value, with the exception of stock of waste which is valued at net realizable value.
Cost is determined using the following basis:
Net realizable value signifies the estimated selling price in the ordinary course of business less estimated costs of completion and
estimated costs necessary to make the sale.
Average manufacturing cost in relation to work in process and finished goods consists of direct material, labour and a proportion of
appropriate manufacturing overheads.
Azgard Nine Limited98
Notes to the Consolidated Financial Statementsfor the year ended 30 June 2013
Post-employment benefits
Defined contribution plan
3.11.3 Financial instruments
3.11.2 Investments in debt securities
Investments in debt securities, which the Group has the positive intention and ability to hold to maturity, are classified as 'held-to-
maturity investments'. On initial recognition, these are measured at cost, being their fair value on the date of acquisition, less
attributable transaction costs. Subsequent to initial recognition, these are measured at amortized cost, with any difference between
cost and value at maturity recognized in the profit or loss over the period of the investment on an effective interest basis.
3.11.3(a) Financial assets at fair value through profit or loss
Financial assets at fair value through profit or loss are financial assets that are either designated as such on initial recognition or are
classified as held for trading. Financial assets are designated as financial assets at fair value through profit or loss if the Group manages
such assets and evaluates their performance based on their fair value in accordance with the Group’s risk management and
investment strategy. Financial assets are classified as held for trading when these are acquired principally for the purpose of selling
and repurchasing in the near term, or when these are part of a portfolio of identified financial instruments that are managed together
and for which there is a recent actual pattern of profit taking, or where these are derivatives, excluding derivatives that are financial
guarantee contracts or that are designated and effective hedging instruments. Financial assets in this category are presented as
current assets. The Group does not have any financial assets classified as financial asset at fair value through profit or loss as at the
balance sheet date.
Investments in debt securities, which the Group does not intend, or is not able, to hold to maturity, including those previously
classified as 'held-to-maturity investments' are classified as 'available for sale financial assets'. On initial recognition / reclassification,
these are measured at cost, being their fair value on the date of acquisition / reclassification, less attributable transaction costs
incurred on acquisition. Subsequent to initial recognition, securities for which prices are available from active market are measured at
fair value. Changes in fair value are recognized in other comprehensive income until the investment is derecognized or impaired.
Gains and losses on de-recognition and impairment losses are recognized in profit or loss. Securities with no active market are carried
at cost subsequent to initial recognition.
A financial instrument is recognized when the Group becomes a party to the contractual provisions of the instrument. The Group
classifies its financial instruments into following classes depending on the purpose for which the financial assets and liabilities are
acquired or incurred. The Group determines the classification of its financial assets and liabilities at initial recognition.
ANL operates an approved defined contributory provident fund for its employees excluding expatriates. Equal contributions are
made by ANL and employees at 8.5% of basic salary.
3.11.1 Investment in equity securities
Investments in equity securities are classified as 'available for sale financial assets'. On initial recognition these are measured at cost,
being their fair value on date of acquisition, less attributable transaction costs. Subsequent to initial recognition, investments in
equity securities are measured at fair value. Investments in other equity securities, where prices are available from active market, are
measured at fair value subsequent to initial recognition, however in absence of active market, these are measured at cost less
accumulated impairment losses. Changes in fair value are recognized in other comprehensive income until the investment is
derecognized or impaired. Gains and losses on de-recognition and impairment losses are recognized in profit or loss.
3.11 Investments
The Group classifies its investments into following classes depending on the purpose for which the investments are made.
Investments are either classified as investment in equity securites, investment in debt security or financial instruments as follows:
Annual Report 2013 99

Notes to the Consolidated Financial Statementsfor the year ended 30 June 2013
3.11.3(b) Held-to-maturity investments
3.11.3(e) Financial liabilities at amortized cost
Non-derivative financial liabilities that are not financial liabilities at fair value through profit or loss are classified as financial liabilities
at amortized cost. Financial liabilities in this category are presented as current liabilities except for maturities greater than twelve
months from the reporting date where these are presented as non-current liabilities. The particular measurement methods adopted
are disclosed in the individual policy statements associated with each instrument.
3.11.3(f) Derivative financial instruments
Derivatives are classified as financial assets and liabilities at fair value through profit or loss unless the derivative is a designated and
effective hedging instrument or a financial guarantee contract. Derivatives are initially recognized at cost, being fair value on the date
the contract is entered into by the Group. Subsequent to initial recognition these are measured at fair value. Gains and losses arising
from changes in fair value of derivatives classified as financial assets and liabilities at fair value through profit or loss are recognized in
profit or loss. Where derivatives are designated hedging instruments the method of recognizing gains and losses arising from changes
in fair value depends on the nature of item being hedged. The Group designates derivatives as either a fair value hedge or a cash flow
hedge.
Fair value hedges
Cash flow hedges
These are hedges of a particular risk associated with the fair value of recognized asset or liability or a highly probable forecast
transaction. Changes in the fair value of derivatives that are designated and qualify as cash flow hedges are recognized in equity to
the extent hedge is effective. The gain or loss relating to the ineffective portion is recognized in profit or loss.
These are hedges of the fair value of recognized assets or liabilities or a firm commitment. Changes in the fair value of derivatives that
are designated and qualify as fair value hedges are recognized in profit or loss, together with changes in fair value of hedged asset or
liability that are attributable to the hedged risk.
Non-derivative financial assets with fixed or determinable payments and fixed maturity that the Group has the positive intention and
ability to hold to maturity are classified as held-to-maturity investments unless these are designated on initial recognition as financial
assets at fair value through profit or loss or available for sale financial assets or these meet the definition of loans and receivables.
Where, as a result of change in intention or ability to hold financial assets initially classified as held-to-maturity investments to
maturity or where due to sales or reclassification of a significant amount of held-to-maturity investments, classification as held-to-
maturity investments is no longer appropriate, these are reclassified as available for sale financial assets. Financial assets in this
category are presented as non-current assets except for maturities within twelve months from the reporting date where these are
presented as current assets. The Group does not have any investment classified as held-to-maturity investment as at the reporting
date.
3.11.3(c) Loans and receivables
Non-derivative financial assets with fixed or determinable payments that are not quoted in an active market are classified as loans
and receivables. Assets in this category are presented as current assets except for maturities greater than twelve months from the
reporting date, where these are presented as non-current assets. The particular measurement methods adopted are disclosed in the
individual policy statements associated with each instrument.
3.11.3(d) Available for sale financial assets
Available for sale financial assets are non-derivative financial assets that are designated as such on initial recognition or are not
classified as loans and receivables, held-to-maturity investments or financial assets at fair value through profit or loss. Assets in this
category are presented as non-current assets unless the management intends to dispose of the asset within twelve months from the
reporting date. The particular measurement methods adopted are disclosed in the individual policy statements associated with each
instrument.
Azgard Nine Limited100

Notes to the Consolidated Financial Statementsfor the year ended 30 June 2013
3.11.4 De-recognition
3.11.6 Regular way purchases and sales of financial assets
3.13 Ordinary share capital
3.14 Preference share capital
Preference share capital is recognized as equity in accordance with the interpretation of the provisions of the Companies Ordinance,
1984, including those pertaining to implied classification of preference shares.
3.15 Redeemable capital
Redeemable capital, including embedded equity component existing due to conversion options, if any, is recognized as 'loans and
borrowings', in accordance with the interpretation of the provisions of the Companies Ordinance, 1984, including those pertaining to
implied classification of redeemable capital.
Convertible preference shares are treated as equity until such time the conversion option is available. In case of lapse of conversion
option, they are treated as liability.
Financial assets are de-recognized if the Group's contractual rights to the cash flows from the financial assets expire or if the Group
transfers the financial asset to another party without retaining control or substantially all risks and rewards of the asset. Financial
liabilities are de-recognized if the Group's obligations specified in the contract expire or are discharged or cancelled. Any gain or loss
on de-recognition of financial assets and financial liabilities is recognized in profit or loss.
3.16 Loans and borrowings
Loans and borrowings are classified as 'financial liabilities at amortized cost'. On initial recognition, these are measured at cost, being
fair value at the date the liability is incurred, less attributable transaction costs. Subsequent to initial recognition, these are measured
at amortized cost with any difference between cost and value at maturity recognized in the profit and loss over the period of the
borrowings on an effective interest basis.
3.12 Discontinued operation
A discontinued operation is a component of the Group's business that represents a separate major line of business or geographical
area of operations that has been disposed off or is held for sale or a subsidiary acquired exclusively with a view to resell. Classification
as a discontinued operation occurs upon disposal or when the operations meet the criteria to be classified as held for sale, if earlier.
When an operation is classified as a discontinued operation, the comparative income statement is re-presented as if the operation has
been discontinued from the start of the comparative period.
3.11.5 Off-setting
A financial asset and a financial liability is offset and the net amount reported in the balance sheet if the Group has legally enforceable
right to set-off the recognized amounts and intends either to settle on a net basis or to realize the asset and settle the liability
simultaneously.
Regular way purchases and sales of financial assets are recognized on trade dates.
Ordinary share capital is recognized as equity. Transaction costs directly attributable to the issue of ordinary shares and share options
are recognized as deduction from equity.
Annual Report 2013 101

Notes to the Consolidated Financial Statementsfor the year ended 30 June 2013
3.17 Finance leases
3.19.2 Non-financial liabilities
3.20 Provisions and contingencies
3.21 Trade and other receivables
3.21.1 Financial assets
3.21.2 Non-financial assets
3.19 Trade and other payables
3.19.1 Financial liabilities
These are classified as 'financial liabilities at amortized cost'. On initial recognition, these are measured at cost, being their fair value at
the date the liability is incurred, less attributable transaction costs. Subsequent to initial recognition, these are measured at amortized
cost using the effective interest method, with interest recognized in profit and loss.
These, on initial recognition and subsequently, are measured at cost.
These, on initial recognition and subsequently, are measured at cost.
3.18 Operating leases
Leases that do not transfer substantially all risks and rewards of ownership are classified as operating leases. Payments made under
operating leases are recognized in profit and loss on a straight line basis over the lease term.
Provisions are recognized when the Group has a legal and constructive obligation as a result of past events and it is probable that
outflow of resources embodying economic benefits will be required to settle the obligation and a reliable estimate can be made of
the amount of obligation. Provision is recognized at an amount that is the best estimate of the expenditure required to settle the
present obligation at the reporting date. Where outflow of resources embodying economic benefits is not probable, or where a
reliable estimate of the amount of obligation cannot be made, a contingent liability is disclosed, unless the possibility of outflow is
remote.
These are classified as 'loans and receivables'. On initial recognition, these are measured at cost, being their fair value at the date of
transaction, less attributable transaction costs. Subsequent to initial recognition, these are measured at amortized cost using the
effective interest method, with interest recognized in profit and loss.
Leases in terms of which the Group assumes substantially all risks and rewards of ownership are classified as finance leases. Assets subject
to finance lease are classified as 'property, plant and equipment'. On initial recognition, these are measured at cost, being an amount equal
to the lower of its fair value and the present value of minimum lease payments. Subsequent to initial recognition, these are measured at
cost less accumulated depreciation and accumulated impairment losses. Depreciation, subsequent expenditure, de-recognition, and
gains and losses on de-recognition are accounted for in accordance with the respective policies for property, plant and equipment.
Liabilities against assets subject to finance lease and deposits against finance lease are classified as 'financial liabilities at amortized cost'
and 'loans and receivables' respectively, however, since they fall outside the scope of measurement requirements of IAS 39 'Financial
Instruments - Recognition and Measurement', these are measured in accordance with the requirements of IAS 17 'Leases'. On initial
recognition, these are measured at cost, being their fair value at the date of commencement of lease, less attributable transaction costs.
Subsequent to initial recognition, minimum lease payments made under finance leases are apportioned between the finance charge and
the reduction of outstanding liability. The finance charge is allocated to each period during the lease term so as to produce a constant
periodic rate of interest on the remaining balance of the liability. Deposits against finance leases, subsequent to initial recognition are
carried at cost.
Azgard Nine Limited102
Notes to the Consolidated Financial Statementsfor the year ended 30 June 2013
3.22 Revenue
3.23 Borrowing costs
3.24 Government grants
3.25 Income tax
Current taxation
Income tax expense comprises current tax and deferred tax. Income tax expense is recognized in profit and loss except to the extent
that it relates to items recognized directly in other comprehensive income, in which case it is recognized in other comprehensive
income.
Current tax is the amount of tax payable on taxable income for the year, using tax rates enacted or substantively enacted by the
reporting date, and any adjustment to the tax payable in respect of previous years. Provision for current tax is based on current rates
of taxation in Pakistan after taking into account tax credits, rebates and exemptions available, if any. The amount of unpaid income tax
in respect of the current or prior periods is recognized as a liability. Any excess paid over what is due in respect of the current or prior
periods is recognized as an asset.
Deferred tax is accounted for using the balance sheet approach providing for temporary differences between the carrying amounts of
assets and liabilities for financial reporting purposes and the amounts used for tax purposes. In this regard, the effects on deferred
taxation of the portion of income that is subject to final tax regime is also considered in accordance with the treatment prescribed by
the Institute of Chartered Accountants of Pakistan. Deferred tax is measured at rates that are expected to be applied to the temporary
differences when they reverse, based on laws that have been enacted or substantively enacted by the reporting date. A deferred tax
liability is recognized for all taxable temporary differences. A deferred tax asset is recognized for deductible temporary differences to
the extent that future taxable profits will be available against which temporary differences can be utilized. Deferred tax assets are
reviewed at each reporting date and are reduced to the extent that it is no longer probable that the related tax benefit will be
realized.
Deferred taxation
Government grants are recognized initially as deferred income when there is reasonable assurance that they will be received and that
the Group will comply with the conditions associated with the grant. Subsequent to initial recognition grants related to assets are
recognized in profit and loss on a systematic basis over the useful life of the assets whereas grants relating to income are recognized
in profit and loss in the same period in which related expenses are recognized. Grants that compensate the Group for expenses or
losses already incurred are recognized in profit and loss in the period in which these become receivable.
Interest income is recognized using effective interest method.
Borrowing costs directly attributable to the acquisition, construction or production of qualifying assets, which are assets that
necessarily take a substantial period of time to get ready for their intended use or sale, are added to the cost of those assets, until such
time as the assets are substantially ready for their intended use or sale. Investment income earned on the temporary investment of
specific borrowings pending their expenditure on qualifying asset is deducted from the borrowing costs eligible for capitalization. All
other borrowing costs are recognized in profit and loss as incurred.
Revenue is measured at the fair value of the consideration received or receivable, net of returns allowances, trade discounts and
rebates, and represents amounts received or receivable for goods and services provided and other income earned in the normal
course of business. Revenue is recognized when it is probable that the economic benefits associated with the transaction will flow to
the Group, and the amount of revenue and the associated costs incurred or to be incurred can be measured reliably.
Revenue from different sources is recognized as follows:
Revenue from sale of goods is recognized when risks and rewards incidental to the ownership of goods are transferred to the buyer.
Dividend income is recognized when the Group's right to receive payment is established.
Annual Report 2013 103

Notes to the Consolidated Financial Statementsfor the year ended 30 June 2013
3.26 Earnings per share (EPS)
3.27 Cash and cash equivalents
3.28 Foreign currency transactions and balances
3.29.2 Non-financial assets
The carrying amount of the Group’s non-financial assets, other than inventories and deferred tax assets are reviewed at each reporting
date to determine whether there is any indication of impairment. If any such indication exists, then the asset’s recoverable amount is
estimated. The recoverable amount of an asset or cash generating unit is the greater of its value in use and its fair value less cost to sell.
In assessing value in use, the estimated future cash flows are discounted to their present values using a pre-tax discount rate that
reflects current market assessments of the time value of money and the risks specific to the asset or cash generating unit.
3.29 Impairment
3.29.1 Financial assets
A financial asset is assessed at each reporting date to determine whether there is any objective evidence that it is impaired. Individually
significant financial assets are tested for impairment on an individual basis. The remaining financial assets are assessed collectively in
groups that share similar credit risk characteristics. A financial asset is considered to be impaired if objective evidence indicates that
one or more events have had a negative effect on the estimated future cash flows of the asset.
An impairment loss in respect of a financial asset measured at amortized cost is calculated as the difference between its carrying
amount, and the present value of the estimated future cash flows discounted at the original effective interest rate. Impairment loss in
respect of a financial asset measured at fair value is determined by reference to that fair value. All impairment losses are recognized in
profit and loss. An impairment loss is reversed if the reversal can be related objectively to an event occurring after the impairment loss
was recognized. An impairment loss is reversed only to the extent that the financial asset’s carrying amount after the reversal does not
exceed the carrying amount that would have been determined, net of amortization, if no impairment loss had been recognized.
The results and financial position of Group entities that have a functional currency different from the presentation currency are
translated into the presentation currency as follows:
Basic EPS is calculated by dividing the profit and loss attributable to ordinary shareholders of the Group by the weighted average
number of ordinary shares outstanding during the year.
Diluted EPS is calculated by adjusting basic EPS by the weighted average number of ordinary shares that would be issued on
conversion of all dilutive potential ordinary shares into ordinary shares and post-tax effect of changes in profit and loss attributable to
ordinary shareholders of the Group that would result from conversion of all dilutive potential ordinary shares into ordinary shares.
c) all resulting exchange differences are recognized as a separate component of equity.
When a foreign operation is sold, exchange differences that were recorded in equity are recognized in the income statement as part of
gain or loss on sale.
a) assets and liabilities for each balance sheet presented are translated at the closing rate at the date of balance sheet;
b) income and expenses for each income statement are translated at average exchange rates; and
Cash and cash equivalents comprise running finances, cash balances and call deposits with maturities of three months or less from the
acquisition date that are subject to an insignificant risk of changes in their fair value, and are used by the Group in the management of
its short-term commitments.
Transactions in foreign currency are translated to the functional currency of the Group using exchange rate prevailing at the date of
transaction. Monetary assets and liabilities denominated in foreign currency are translated to the functional currency at exchange rate
prevailing at the reporting date. Non-monetary assets and liabilities denominated in foreign currency that are measured at fair value
are translated to the functional currency at exchange rate prevailing at the date the fair value is determined. Non-monetary assets and
liabilities denominated in foreign currency that are measured at historical cost are translated to functional currency at exchange rate
prevailing at the date of initial recognition. Any gain or loss arising on translation of foreign currency transactions and balances is
recognized in profit and loss.
Azgard Nine Limited104

Notes to the Consolidated Financial Statementsfor the year ended 30 June 2013
4
An impairment loss is recognized if the carrying amount of the assets or its cash generating unit exceeds its estimated recoverable
amount. Impairment losses are recognized in profit and loss. Impairment losses recognized in respect of cash generating units are
allocated to reduce the carrying amounts of the assets in a unit on a pro rata basis. Impairment losses recognized in prior periods are
assessed at each reporting date for any indications that the loss has decreased or no longer exists. An impairment loss is reversed if
there has been a change in the estimates used to determine the recoverable amount. An impairment loss is reversed only to that
extent that the asset’s carrying amount after the reversal does not exceed the carrying amount that would have been determined,
net of depreciation and amortization, if no impairment loss had been recognized.
3.30 Dividend to ordinary shareholders
Dividend to ordinary shareholders is recognized as a deduction from accumulated profit in statement of changes in equity and as a
liability, to the extent it is unclaimed, in the Group’s consolidated financial statements in the year in which the dividends are
approved by the Group’s shareholders.
3.31 Dividend distribution to preference shareholders
Dividend distribution to the preference shareholders is recognized as a deduction from accumulated profit in consolidated
statement of changes in equity and as a liability, to the extent it is unpaid, in the Group’s consolidated financial statements at the end
of each year from the issue of preference shares. On lapse of conversion option of preference share, the related charge is treated as
finance cost.
New and revised approved accounting standards, interpretations and amendments thereto
New standards, amendments to approved accounting standards and interpretations which became effective during the year ended
30 June 2013
The primary change resulting from this amendment is that the Group has grouped items presented in 'other comprehensive income' on the
basis of whether they are potentially reclassifiable to profit or loss subsequently (reclassification adjustment).
- IAS 27 Separate Financial Statements (2011) - (effective for annual periods beginning on or after 1 January 2013). IAS 27 (2011)
supersedes IAS 27 (2008). Three new standards IFRS 10 - Consolidated Financial Statements, IFRS 11- Joint Arrangements and IFRS 12-
Disclosure of Interest in Other Entities dealing with IAS 27 would be applicable effective 1 January 2013. IAS 27 (2011) carries forward
the existing accounting and disclosure requirements for separate financial statements, with some minor clarifications. The
amendments have no impact on financial statements of the Group.
- IAS 28 Investments in Associates and Joint Ventures (2011) - (effective for annual periods beginning on or after 1 January 2013). IAS 28
(2011) supersedes IAS 28 (2008). IAS 28 (2011) makes the amendments to apply IFRS 5 to an investment, or a portion of an
investment, in an associate or a joint venture that meets the criteria to be classified as held for sale; and on cessation of significant
influence or joint control, even if an investment in an associate becomes an investment in a joint venture. The amendments have no
impact on financial statements of the Group.
- IAS 19 Employee Benefits (amended 2011) - (effective for annual periods beginning on or after 1 January 2013). The amended IAS 19
includes the amendments that require actuarial gains and losses to be recognized immediately in other comprehensive income; this
change will remove the corridor method and eliminate the ability for entities to recognize all changes in the defined benefit
obligation and in plan assets in profit or loss, which currently is allowed under IAS 19; and that the expected return on plan assets
recognized in profit or loss is calculated based on the rate used to discount the defined benefit obligation.
There were certain new standards and amendments to the approved accounting standards which became effective during the year but are
considered not to be relevant or have any significant effect on the Group's operations and are, therefore, not disclosed in these financial
statements except for the amendment to IAS 1 'Presentation of financial statements' regarding 'other comprehensive income'.
Had there been no change in the aforementioned, there would not have been any bifurcation of items appearing in the 'other
comprehensive income'.
New standards, amendments to approved accounting standards and interpretations that are not yet effective
The following standards, amendments and interpretations of approved accounting standards will be effective for accounting periods
beginning on or after 01 July 2013:
Annual Report 2013 105

Notes to the Consolidated Financial Statementsfor the year ended 30 June 2013
- IAS 34 Interim Financial Reporting is amended to align the disclosure requirements for segment assets and segment liabilities in
interim financial reports with those in IFRS 8 Operating Segments. IAS 34 now requires the disclosure of a measure of total assets and
liabilities for a particular reportable segment. In addition, such disclosure is only required when the amount is regularly provided to
the chief operating decision maker and there has been a material change from the amount disclosed in the last annual financial
statements for that reportable segment.
- Offsetting Financial Assets and Financial Liabilities (Amendments to IAS 32) – (effective for annual periods beginning on or after 1
January 2014). The amendments address inconsistencies in current practice when applying the offsetting criteria in IAS 32 Financial
Instruments: Presentation. The amendments clarify the meaning of ‘currently has a legally enforceable right of set-off’; and that some
gross settlement systems may be considered equivalent to net settlement.
- Offsetting Financial Assets and Financial Liabilities (Amendments to IFRS 7) – (effective for annual periods beginning on or after 1
January 2013). The amendments to IFRS 7 contain new disclosure requirements for financial assets and liabilities that are offset in the
statement of financial position or subject to master netting agreement or similar arrangement.
- IAS 39 Financial Instruments: Recognition and Measurement - Novation of Derivatives and Continuation of Hedge Accounting
(Amendments to IAS 39) (effective for annual periods beginning on or after 1 January 2014). The narrow-scope amendments will
allow hedge accounting to continue in a situation where a derivative, which has been designated as a hedging instrument, is novated
to effect clearing with a central counterparty as a result of laws or regulation, if specific conditions are met (in this context, a novation
indicates that parties to a contract agree to replace their original counterparty with a new one).
Annual Improvements 2009–2011 (effective for annual periods beginning on or after 1 January 2013). The new cycle of improvements
contains amendments to the following four standards, with consequential amendments to other standards and interpretations:
- IAS 1 Presentation of Financial Statements is amended to clarify that only one comparative period – which is the preceding period –
is required for a complete set of financial statements. If an entity presents additional comparative information, then that additional
information need not be in the form of a complete set of financial statements. However, such information should be accompanied by
related notes and should be in accordance with IFRS. Furthermore, it clarifies that the ‘third statement of financial position’, when
required, is only required if the effect of restatement is material to statement of financial position.
- IAS 16 Property, Plant and Equipment is amended to clarify the accounting of spare parts, stand-by equipment and servicing
equipment. The definition of ‘property, plant and equipment’ in IAS 16 is now considered in determining whether these items should
be accounted for under that standard. If these items do not meet the definition, then they are accounted for using IAS 2 Inventories.
- IFRIC 20 - Stripping cost in the production phase of a surface mining (effective for annual periods beginning on or after 1 January
2013). The interpretation requires production stripping cost in a surface mine to be capitalized if certain criteria are met. The
amendments have no impact on financial statements of the Group.
- IAS 32 Financial Instruments: Presentation - is amended to clarify that IAS 12 Income Taxes applies to the accounting for income taxes
relating to distributions to holders of an equity instrument and transaction costs of an equity transaction. The amendment removes a
perceived inconsistency between IAS 32 and IAS 12.
- IFRIC 21- Levies ‘an Interpretation on the accounting for levies imposed by governments’ (effective for annual periods beginning on
or after 1 January 2014). IFRIC 21 is an interpretation of IAS 37 Provisions, Contingent Liabilities and Contingent Assets. IAS 37 sets out
criteria for the recognition of a liability, one of which is the requirement for the entity to have a present obligation as a result of a past
event (known as an obligating event). The Interpretation clarifies that the obligating event that gives rise to a liability to pay a levy is
the activity described in the relevant legislation that triggers the payment of the levy.
- Amendment to IAS 36 “Impairment of Assets” Recoverable Amount Disclosures for Non-Financial Assets (effective for annual periods
beginning on or after 1 January 2014). These narrow-scope amendments to IAS 36 Impairment of Assets address the disclosure of
information about the recoverable amount of impaired assets if that amount is based on fair value less costs of disposal.
Azgard Nine Limited106
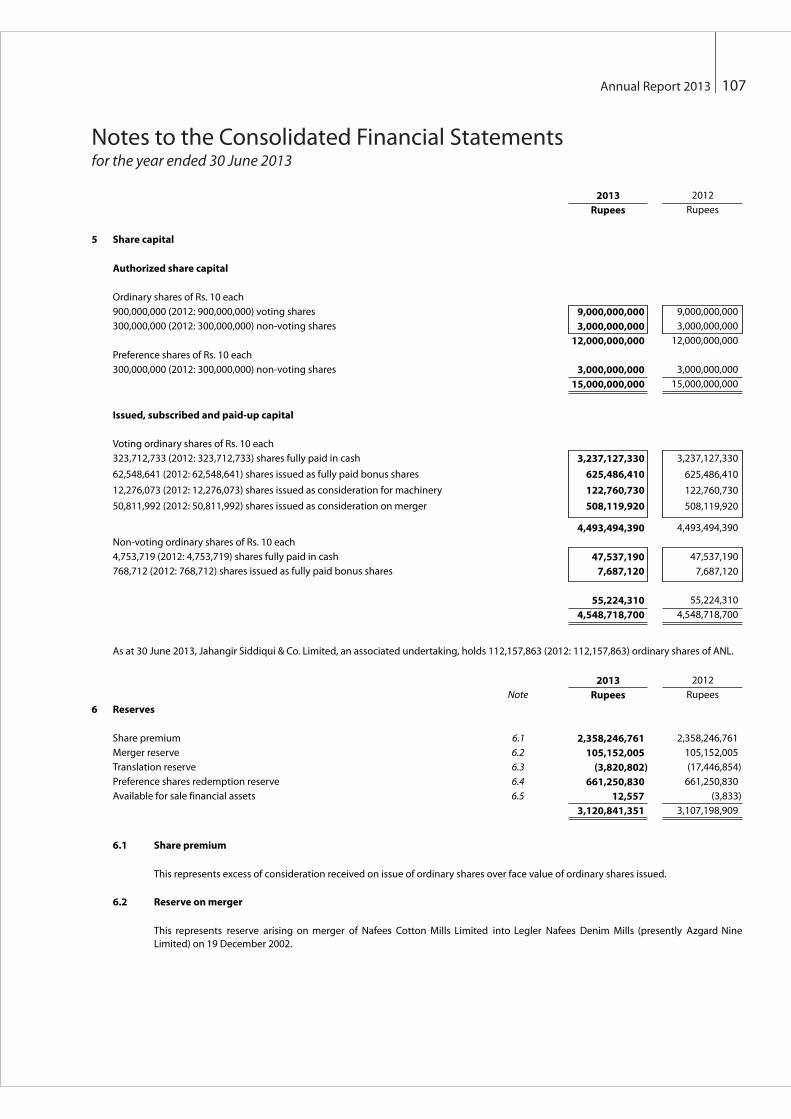
Notes to the Consolidated Financial Statementsfor the year ended 30 June 2013
2013 2012
Rupees Rupees
5 Share capital
Authorized share capital
Ordinary shares of Rs. 10 each
900,000,000 (2012: 900,000,000) voting shares 9,000,000,000 9,000,000,000
300,000,000 (2012: 300,000,000) non-voting shares 3,000,000,000 3,000,000,000
12,000,000,000 12,000,000,000
Preference shares of Rs. 10 each
300,000,000 (2012: 300,000,000) non-voting shares 3,000,000,000 3,000,000,000
15,000,000,000 15,000,000,000
Issued, subscribed and paid-up capital
Voting ordinary shares of Rs. 10 each
323,712,733 (2012: 323,712,733) shares fully paid in cash 3,237,127,330 3,237,127,330
62,548,641 (2012: 62,548,641) shares issued as fully paid bonus shares 625,486,410 625,486,410
12,276,073 (2012: 12,276,073) shares issued as consideration for machinery 122,760,730 122,760,730
50,811,992 (2012: 50,811,992) shares issued as consideration on merger 508,119,920 508,119,920
4,493,494,390 4,493,494,390
Non-voting ordinary shares of Rs. 10 each
4,753,719 (2012: 4,753,719) shares fully paid in cash 47,537,190 47,537,190
768,712 (2012: 768,712) shares issued as fully paid bonus shares 7,687,120 7,687,120
55,224,310 55,224,310
4,548,718,700 4,548,718,700
2013 2012
Note Rupees Rupees
6 Reserves
Share premium 6.1 2,358,246,761 2,358,246,761
Merger reserve 6.2 105,152,005 105,152,005
Translation reserve 6.3 (3,820,802) (17,446,854)
Preference shares redemption reserve 6.4 661,250,830 661,250,830
Available for sale financial assets 6.5 12,557 (3,833)
3,120,841,351 3,107,198,909
6.1 Share premium
6.2 Reserve on merger
This represents excess of consideration received on issue of ordinary shares over face value of ordinary shares issued.
This represents reserve arising on merger of Nafees Cotton Mills Limited into Legler Nafees Denim Mills (presently Azgard Nine
Limited) on 19 December 2002.
As at 30 June 2013, Jahangir Siddiqui & Co. Limited, an associated undertaking, holds 112,157,863 (2012: 112,157,863) ordinary shares of ANL.
Annual Report 2013 107

Notes to the Consolidated Financial Statementsfor the year ended 30 June 2013
6.3 Translation reserve
6.4 Preference shares redemption reserve
6.5 Available for sale financial assets
2013 2012
Note Rupees Rupees
7 Non-controlling interest
Ordinary shareholders 7.1 - 2,236,611,611
Preference shareholders 7.2 - 1,680,976,538
- 3,917,588,149
7.1 Ordinary shareholders
As at beginning of the year 2,236,611,611 2,582,107,738
Share of total comprehensive loss for
the period / year (253,588,120) (345,496,127)
Derecognized on disposal of AGL 37.2 (1,983,023,491)
As at end of the year - 2,236,611,611
7.2 Preference shareholders
As at beginning of the year 1,680,976,538 -
Preference shares issued during the year - 1,593,342,690
Share of total comprehensive income for
the period / year 6,704,229 87,633,848
Derecognized on disposal of AGL 37.2 (1,687,680,767)
As at end of the year - 1,680,976,538
8 Surplus on revaluation of fixed assets
As at beginning of the year 6,746,439,428 7,003,957,881
Transferred to accumulated loss on disposal of AGL (3,150,163,545) -
Incremental depreciation transferred to accumulated loss (125,688,602) (257,518,453)
As at end of the year 3,470,587,281 6,746,439,428
This reserve has been created for redemption of preference shares issued by ANL as required to be created and maintained under
the terms of issue and section 85 of the Companies Ordinance, 1984.
This represents surplus / (deficit) on revaluation of investments classified as available for sale financial assets.
This represents foreign exchange differences arising on translation of foreign subsidiary.
Azgard Nine Limited108

Notes to the Consolidated Financial Statementsfor the year ended 30 June 2013
2013 2012
Note Rupees Rupees
9 Redeemable capital - secured
Term Finance Certificates - II 9.1 651,066,836 1,498,649,061
Term Finance Certificates - IV 9.2 1,083,768,528 2,498,000,000
Term Finance Certificates - V 9.3 527,682,637 823,620,000
Privately Placed Term Finance Certificates - VI 9.4 3,218,670,000 3,218,670,000
Privately Placed Term Finance Certificates 9.5 326,456,184 -
Privately Placed Term Finance Certificates 9.6 217,200,000 -
6,024,844,185 8,038,939,061
Deferred notional income 9.7 (856,485,545) (1,124,890,714)
Transaction cost 9.8 (57,772,282) (74,354,806)
5,110,586,358 6,839,693,541
Less: Amount shown as current liability
Amount payable within next twelve months (547,252,308) (2,559,131,063)
Amount due after 30 June 2013 9.9 - (1,551,127,282)
(547,252,308) (4,110,258,345)
4,563,334,050 2,729,435,196
Return on TFCs
Six months KIBOR plus 1.00% per annum in 2010 - 2011
Six months KIBOR plus 1.25% per annum in 2012 - 2015
Six months KIBOR plus 1.75% per annum in 2016 onwards
Trustee
Security
9.1 These Term Finance Certificates - II ("TFC - II") have been issued by way of private placements and public subscription and are
listed on Karachi Stock Exchange (Guarantee) Limited. The total issue comprises of 428,734 certificates of Rs. 5,000 each. The terms
and conditions of the issue as per Amendment No. 1 to Master Restructuring and Intercreditor Agreement ("MRA-1") dated 11
April 2012 are as follows:
Principal redemption
The principal redemption of TFC - II is structured to be in ten un-equal installments. During the year, first installement amounting
to Rs. 847.582 million was settled by ANL, also refer to note 37.6. Remaining nine installments are to be paid semi-annually
starting from 20 September 2013 and ending on 20 September 2017.
At the reporting date interest / mark-up amounting to Rs. 139.614 million was overdue. Refer to note 43.2.2 for details.
In order to protect the interests of TFC holders, Faysal Bank Limited has been appointed as trustee under a trust deed with power
to enforce ANL's obligations in case of default and to distribute the proceeds of any such enforcement, in accordance with the
terms of the trust deed and Master Restructuring and Intercreditor Agreement ("MRA").
For detail of securities refer to note 9.10.
The issue carries return as per the following applicable mark-up rates, payable semi-annually;
Annual Report 2013 109

Notes to the Consolidated Financial Statementsfor the year ended 30 June 2013
Trustee
Security
Principal redemption
Return on TFCs
Twelve months KIBOR plus 1.00% per annum from 18 May 2010 till 18 May 2011
Three months KIBOR plus 1.00% per annum from 18 May 2011 till 18 November 2011
Three months KIBOR plus 1.25% per annum from 18 November 2011 onwards
Trustee
Security
At the reporting date interest / mark-up amounting to Rs. 91.921 million was overdue. Refer to note 43.2.2 for details.
At the reporting date interest / mark-up amounting to Rs. 258.577 million was overdue. Refer to note 43.2.2 for details.
Return on TFCs
Six months KIBOR plus 1.00% per annum in 2010 - 2011
Six months KIBOR plus 1.25% per annum in 2012 - 2015
Six months KIBOR plus 1.75% per annum in 2016 onwards
The issue carries return as per the following applicable mark-up rates, payable semi-annually;
9.2 These Term Finance Certificates - IV ("TFC - IV") have been issued by way of private placements. The total issue comprises of
500,000 certificates of Rs. 5,000 each. The terms and conditions of the issue as per MRA-1 dated 11 April 2012 are as follows:
Principal redemption
The principal redemption of TFC - IV is structured to be in ten un-equal installments. During the year, first installment amounting
to Rs. 1,414.231 million was settled by ANL, also refer to note 37.6. Remaining nine installments are to be paid semi-annually
starting from 04 December 2013 and ending on 04 December 2017.
9.3 These Term Finance Certificates - V ("TFC - V") represent restructuring of various short term facilities amounting to Rs. 825.000
million. The total issue comprised of 165,000 TFCs having face value of Rs. 5,000 each. The terms and conditions of the issue as per
MRA-1 dated 11 April 2012 are as follows:
In order to protect the interests of TFC holders, Pak Brunei Investment Company remains trustee of the issue, with power to
enforce ANL's obligations, in case of default and to distribute the proceeds of any such enforcement, in accordance with the terms
of the trust deed and MRA.
For detail of securities refer to note 9.10.
The issue carries return as per the following applicable mark-up rates, payable quarterly;
For detail of securities refer to note 9.10.
In order to protect the interests of TFC holders, Faysal Bank Limited has been appointed as trustee under a trust deed, with power
to enforce ANL's obligations, in case of default and to distribute the proceeds of any such enforcement, in accordance with the
terms of the trust deed and MRA.
The principal redemption of TFC - V is structured to be in nine un-equal installments. During the year, first installement amounting
to Rs. 295.937 million was settled by ANL, also refer to note 37.6. Remaining eight installments are to be paid quarterly starting
from 18 February 2014 and ending on 18 November 2015.
Azgard Nine Limited110

Notes to the Consolidated Financial Statementsfor the year ended 30 June 2013
Principal redemption
Call option
Return on PPTFCs
Trustee
Security
Principal redemption
Return on PPTFCs
Trustee
Security
The principal redemption of PPTFCs is structured to be in twelve equal installments amounting to Rs. 27.205 million each.
Installments are to be paid semi-annually starting from 19 April 2015 and ending on 19 October 2020.
The issue carries a fixed mark-up rate at 11% per annum.
- Ranking mortgage charge over the mortgaged properties of ANL in the amount of up to Rs. 4,666.667 million.
The issue carries nil return (also refer to note 9.7).
The principal redemption of TFCs is structured to be in seven unequal semi annual installments starting from 31 March 2014 and
ending on 31 March 2017.
- Ranking hypothecation charge in favor of the Trustee over the hypothecated assets of ANL in the amount of up to Rs.
4,666.667 million; and
9.5 These represent restructuring of outstanding principal amounting to Rs. 256.020 million and outstanding mark-up along with
preference dividend amounting to Rs. 70.436 million related to preference shares into fresh issue of Privately Placed Term Finance
Certificates ("PPTFCs") by way of Settlement Agreement ("the Agreement") between ANL and JS Global Capital Limited dated 22
October 2012 effective from 19 October 2012. The total issue comprised of 12 PPTFCs having face value of Rs. 27.205 million each.
The terms and conditions of the issue are as follows:
In order to protect the interests of PPTFC holders, JS Bank Limited has been appointed as Trustee under a Trust Deed for the issue
of PPTFCs entered on 23 October 2012, with power to enforce ANL's obligations, in case of default and to distribute the proceeds
of any such enforcement, in accordance with the terms of the Trust Deed.
The issue is secured by personal Guarantee of Sponsor Director.
The issue is secured by:
9.4 This represent restructuring of outstanding mark-up amounting to Rs. 3,218.670 million related to long term debts and short term
borrowings till 31 March 2012. The total issue comprises of 643,734 TFCs having face value of Rs. 5,000 each. The terms and
conditions of the issue are as follows:
ANL shall be allowed to call the PPTFC's in full or in part. Call option will be exercisable at any time after the expiry of one year
from the issue date and upon giving to the TFC holders not less than thirty days notice in writing, to redeem on the following
redemption date.
In order to protect the interests of TFC holders, Faysal Bank Limited has been appointed as trustee under a trust deed, with power
to enforce ANL's obligations, in case of default and to distribute the proceeds of any such enforcement, in accordance with the
terms of the trust deed and MRA.
Annual Report 2013 111

Notes to the Consolidated Financial Statementsfor the year ended 30 June 2013
Principal redemption
Return on PPTFCs
Trustee
Security
2013 2012
RupeesNote Rupees
As at beginning of the year 1,124,890,714 -
Occurred during the year - 1,189,908,326
Amortized during the year (268,405,169) (65,017,612)
As at end of the year 856,485,545 1,124,890,714
9.8 Transaction costs
As at beginning of the year 74,354,806 323,091,516
Classified as held for sale - (236,126,979)
Amortized during the year 35 (16,582,524) (12,609,731)
As at end of the year 57,772,282 74,354,806
9.10 Common security
The issue carries a fixed mark-up rate at 11% per annum.
In order to protect the interests of PPTFC holders, JS Bank Limited has been appointed as Trustee under a Trust Deed for the issue of
PPTFCs entered on 23 October 2012, with power to enforce ANL's obligations, in case of default and to distribute the proceeds of any
such enforcement, in accordance with the terms of the Trust Deed.
The issue is secured by personal Guarantee of Sponsor Director.
9.9 ANL during the year, as well as in previous year could not make certain interest / mark-up payments on due dates and further
remained non-compliant with certain financial and other covenants imposed by the lenders as a result of which the entire
redeemable capital was classified as current in the year ended 30 June 2012. However, as at the reporting date, ANL has classified
redeemable capital in accordance with the repayment schedule for reasons fully explained in note 2.3.
long term finances except for TFC - VI and PPTFCs and short term borrowings have been secured by way of
common security which is as follows:
Deferred notional income
The principal redemption of PPTFCs is structured to be in twelve equal installments amounting to Rs. 18.100 million each.
Installments are to be paid semi-annually starting from 19 April 2015 and ending on 19 October 2020.
9.6 These represent restructuring of outstanding principal amounting to Rs. 170.132 million and outstanding mark-up along with
preference dividend amounting to Rs. 47.068 million related to preference shares into fresh issue of Privately Placed Term Finance
Certificates ("PPTFCs") by way of Settlement Agreement ("the Agreement") between ANL and Lenders dated 22 October 2012
effective from 19 October 2012. The total issue comprised of 21,720 PPTFCs having face value of Rs. 10,000 each. The terms and
conditions of the issue are as follows:
9.7 This represents the difference between amortized cost and face value of zero-coupon Privately Placed Term Finance Certificates - VI,
with five year maturity (refer to note 9.4). Amortized cost has been determined using effective interest rate of 13.23% per annum
being the weighted average rate of return on redeemable capital. Movement is as follows:
Redeemable capital,
Azgard Nine Limited112

Notes to the Consolidated Financial Statementsfor the year ended 30 June 2013
Six months EURIBOR plus 3.25% per annum till date of sale of AGL
Three months EURIBOR plus 0.75% per annum from date of sale of AGL to 14 July 2015
Three months EURIBOR plus 1.00% per annum from 15 July 2015 onwards
At the reporting date interest / mark-up amounting to Rs. 5.683 million was overdue. Refer to note 43.2.2 for details.
10.4 The finance has been obtained from Saudi Pak Industrial and Agricultural Company Limited for long term working capital
requirements. As per MRA - 1 dated 11 April 2012, loan is payable in eighteen un-equal installments. During the year, first
installment amounting to Rs. 56.749 million was settled by ANL. Also refer to note 37.6. Remaining seventeen installments are to
be paid quarterly starting from 13 November 2013 and ending on 13 November 2017. For detail of securities refer to note 9.10.
As per rescheduling agreement, the finance carries mark-up as per the following applicable mark-up rates, payable quarterly:
10.3 This represents Euros 15 million obtained from Deutsche Investitions - Und MBH (Germany) (''DEG'') to finance the setup of new
textile and apparel project. In context of the overall debt restructuring of ANL, the finance was rescheduled in the previous year
by way of MRA-1 dated 11 April 2012. As per the rescheduling terms, the loan is payable in twenty-one un-equal installments.
During the year, first installment amounting to Rs. 641.221 million was settled by ANL. Also refer to note 37.6. Remaining twenty
installments are to be paid quarterly starting from 15 July 2015. For detail of securities refer to note 9.10.
10.2 The finance has been settled during the year by ANL. Also refer to note 37.6.
At the reporting date interest / mark-up amounting to Rs. 77.94 million was overdue. Refer to note 43.2.2 for details.
- First charge in favor of National Bank of Pakistan, as Security trustee for the benefit of the Financers, on all present and
future assets and properties of ANL.
In addition to the above, additional interest of 2% per annum will be levied if principal and mark-up are not paid on due dates.
At the reporting date interest amounting to Rs. 15.963 million was overdue. Refer to note 43.2.2 for details.
- Personal Guarantee of Sponsor Director.
10.1 The finance has been settled during the year by ANL. Also refer to note 37.6.
2013 2012
RupeesNote Rupees
10 Long term finances - secured
United Bank Limited 10.1 - 75,000,000
National Bank of Pakistan 10.2 - 1,000,000,000
Deutsche Investitions - Und MBH (Germany) 10.3 907,054,269 1,422,000,000
Saudi Pak Industrial and Agricultural
Company Limited 10.4 43,251,155 100,000,000
HSBC Bank (Middle East) Limited 10.5 255,602,579 272,113,408
Citi Bank N.A (Pakistan) 10.6 567,539,466 567,539,466
1,773,447,469 3,436,652,874
Transaction costs 10.7 (21,944,566) (28,254,867)
1,751,502,903 3,408,398,007
Less: Amount shown as current liability
Amount payable within next twelve months (104,784,705) (1,936,345,512)
Amount due after 30 June 2013 10.8 - (1,472,052,495)
(104,784,705) (3,408,398,007)
1,646,718,198 -
Annual Report 2013 113

Notes to the Consolidated Financial Statementsfor the year ended 30 June 2013
Six months KIBOR plus 1.00% per annum in 2010 - 2011
Six months KIBOR plus 1.25% per annum in 2012 - 2015
Six months KIBOR plus 1.75% per annum in 2016 onwards
Six months KIBOR plus 1.00% per annum in 2010 - 2012
Six months KIBOR plus 1.25% per annum in 2013 onwards
Six months KIBOR plus 1.00% per annum in 2010 - 2012
Six months KIBOR plus 1.25% per annum in 2013 onwards
2013 2012
Note Rupees Rupees
10.7 Transaction costs
As at beginning of the year 28,254,867 128,761,126
Classified as held for sale 37 - (85,330,517)
Amortized during the year 35 (6,310,301) (15,175,742)
As at end of the year 21,944,566 28,254,867
10.8
10.6 As part of the overall debt restructuring of ANL, the finance was converted from various short term borrowings. This issue has also
been rescheduled during the year by way of MRA-1 dated 11 April 2012. As per the rescheduling terms, the loan is payable in six un-
equal installments. Installment are to be paid semi-annually starting from 01 May 2014. For detail of securities refer to note 9.10.
In addition to the above, additional interest of 5.00% per annum will be levied if mark-up is not paid on due dates.
At the reporting date interest / mark-up amounting to Rs. 6.022 million was overdue. Refer to note 43.2.2 for details.
At the reporting date interest amounting to Rs. 10.361 million was overdue. Refer to note 43.2.2 for details.
10.5 The finance has been obtained from HSBC Bank Middle East Limited for long term working capital requirements. As per MRA-1 dated
11 April 2012, the loan is payable in nine un-equal installments. During the year, first installment amounting to Rs. 7.511 million was
settled by ANL. Also refer to note 37.6. Remaining eight installments are to be paid semi-annually starting from 01May 2013 and ending
on 01 November 2016. For detail of securities refer to note 9.10.
As per rescheduling agreement the finance carries mark-up as per the following applicable mark-up rates, payable quarterly:
As per rescheduling agreement the finance carries mark-up as per the following applicable mark-up rates, payable semi-annually:
ANL during the year, as well as in previous year could not make certain principal and interest / mark-up payments on due dates and
further remained non-compliant with certain financial and other covenants imposed by the lenders as a result of which the entire
long term finance was classified as current liability in the year ended 30 June 2012. However, as at the reporting date, ANL has
classified long term loans in accordance with the repayment schedule for reasons fully explained in note 2.3.
As per rescheduling agreement the finance carries mark-up as per the following applicable mark-up rates, payable semi-annually:
At the reporting date principal amounting to Rs. 6.000 million and interest / mark-up amounting to Rs. 34.758 million was overdue.
Refer to note 43.2.2 for details.
Azgard Nine Limited114

Notes to the Consolidated Financial Statementsfor the year ended 30 June 2013
11 Liabilities against assets subject to finance lease -secured
2013 2012
Note Rupees Rupees
12 Current portion of non-current liabilities
These were redeemable, subject to provisions of section 85 of the Companies Ordinance, 1984, as follows:
11.1 These represent plant and machinery, and vehicles acquired under finance lease arrangements and are secured by specific charge
on leased assets, joint ownership of leased assets with the lender and lien over documents of title. Rentals are payable monthly /
quarterly. The leases are priced at rates ranging from three months to twelve months KIBOR plus 2.00% to 4.00% (2012: three months
to twelve months KIBOR plus 2.00% to 4.00%) per annum. Under the terms of agreement, taxes, repairs, replacements and insurance
costs in respect of assets subject to finance lease are borne by ANL. ANL also has the option to acquire these
assets at the end of the respective lease terms and intends to exercise the option. ANL during the current year remained
unable to make repayments in respect of lease liabilities as a result of which the Lessor has demanded immediate repayment of
outstanding lease installments and return of the leased assets. Consequently, all liability in respect of lease has been classified as
current liability.
The amounts of future payments for the lease and the period in which the lease payments will become due are as follows:
11.2 The amount of future payments under the lease arrangements and the period in which these payments will become due are as
follows:
12.1 Preference shares were issued by ANL during year ended 30 September 2004 and are non-voting, non-participatory, partly
convertible and cumulative.
Present value of minimum lease payments 11.1 & 11.2 32,586,801 36,436,705
Current maturity presented under current liabilities 12 (32,586,801) (12,415,966)
- 24,020,739
Preference shares of Rs. 10 each (2012: Rs. 10 each) 12.1 148,367,255 574,518,935
Redeemable capital 9 547,252,308 4,110,258,345
Long term finances 10 104,784,705 3,408,398,007
Liabilities against assets subject to finance lease 11.2 32,586,801 12,415,966
832,991,069 8,105,591,253
2013 2012
Note Rupees Rupees
Not later than one year 40,918,058 17,050,310
Later than one year but not later than five years - 27,769,672
Total future minimum lease payments 40,918,058 44,819,982
Finance charge allocated to future periods (8,331,257) (8,383,277)
Present value of future minimum lease payments 32,586,801 36,436,705
Not later than one year 12 (32,586,801) (12,415,966)
Later than one year but not later than five years - 24,020,739
- First redemption: 50% of the issued amount at the end of fifth year from date of issue, i.e. 24 September 2009.
ANL during the year, has settled its liability towards preference shares through conversion into a fresh issue of PPTFCs amounting to
Rs. 426.152 million. Refer to note 9.5 and note 9.6.
- Second redemption: 50% of the issued amount at the end of sixth year from date of issue, i.e. 24 September 2010.
Annual Report 2013 115

Notes to the Consolidated Financial Statementsfor the year ended 30 June 2013
13 Short term borrowings
2013 2012
Note Rupees Rupees
Secured
Running finance 13.1 1,076,169,156 1,832,049,760
Term loan 13.1 3,550,598,236 5,006,610,401
Morabaha / LPO 13.1 192,419,450 198,626,000
Bridge finance 13.2 - 1,119,457,014
4,819,186,842 8,156,743,175
Secured
Finance against foreign bills 13.4 205,346,227 277,211,316
5,024,533,069 8,433,954,491
13.2
During the year, an amount of Rs. 748.351 million and Rs. 1,153.117 million in respect of running finance and term loan
respectively was settled by ANL. Also refer to note 37.6.
The finance has been settled during the year by ANL. Also refer to note 37.6.
At the reporting date interest / mark-up amounting to Rs. 68.753 million was overdue. Refer to note 43.2.2 for details.
ANL intends to settle its remaining liability towards preference shares through conversion into a fresh issue of Financial
Instruments, the terms of which are being negotiated with the majority of the investors and the process is expected to materialize
in due course.
At the reporting date, entire outstanding amount of preference shares was overdue. Refer to note 43.2.2 for details.
At the reporting date interest / mark-up amounting to Rs. 93.158 million was overdue in respect of running finance. Further,
principal amounting to Rs. 232.602 million and interest / mark-up amounting to Rs. 311.618 million was overdue in respect of
term loan. Refer to note 43.2.2 for details.
Mark-up on these finances is payable quarterly / semi-annually. Local currency finances carry mark-up at rates ranging from one
to twelve months KIBOR plus 1% per annum (2012: one to six months KIBOR plus 1% per annum). Foreign currency finances carry
mark up at rates ranging from LIBOR / EURIBOR of matching tenor plus 2% to 6.5% per annum (2012: LIBOR of matching tenor plus
2% to 6.5% per annum). Mark-up on pre / post shipment finances refinanced by the State Bank of Pakistan is payable at SBP
refinance rate of 8.20% to 10.00% per annum plus banks' spread of 1% per annum (2012: 10% per annum plus banks' spread of 1%
per annum). Morabaha / LPO carry mark-up at rates ranging from six to twelve months KIBOR plus 1% to 3% per annum (2012: six
to twelve months KIBOR plus 1% to 3% per annum). Letters of credit / guarantee carry commission at rates ranging from 0.10% to
0.15% per quarter (2012: 0.1% to 0.15% per quarter). Certain finances also carry a penalty interest / mark-up.
These represent short term finances utilized under interest / mark-up arrangements from banking companies and financial institutions.
13.1 These facilities have been obtained from various banking companies and financial institutions for working capital requirements
and are secured by Common Security (refer to note 9.10), lien over documents of title of imported goods, lien over firm export
orders, trust receipts, demand promissory notes, counter guarantees, pledge of stocks, ranking charge amounting to Rs. 750
million on current and future assets of ANL.
Azgard Nine Limited116

Notes to the Consolidated Financial Statementsfor the year ended 30 June 2013
2013 2012
Note Rupees Rupees
14 Trade and other payables
Trade creditors 1,865,832,652 1,590,268,928
Bills payable 14.1 & 14.2 385,516,037 1,755,448,679
Accrued liabilities 420,242,718 568,729,225
Advances from customers 64,724,636 102,516,590
Payable to Provident Fund Trust 14.3 83,897,625 96,248,979
Workers' Profit Participation Fund 14.4 55,243,056 47,015,366
Tax deducted at source 10,492,869 10,941,701
Derivative financial liability - 7,424,080
Other payables 71,169,229 98,584,330
2,957,118,822 4,277,177,878
14.1
14.2
14.3
14.4
During the year, an amount of to Rs. 1,560.869 million was settled by ANL in respect of bills payable. Also refer to note 37.6.
Interest on outstanding liability towards Provident Fund Trust is charged at 16.10% (2012: 16.10%) per annum.
Interest on outstanding liability towards Workers’ Profit Participation Fund is charged at 17.50% (2012: 17.50%) per annum.
At the reporting date bills amounting to Rs. 274.462 million and interest / mark-up amounting to Rs. 41.309 million were overdue.
Refer to note 43.2.2 for details.
13.4 These carry interest at rates ranging from 2.50% to 7.00% per annum (2012: 2.50% to 7.00% per annum). The aggregate available
facilities amount to Euros 2.500 million (2012: Euros 2.500 million) out of which Euros 0.900 million (2012: Euros 0.160 million)
remained unavailed as at reporting date.
13.3 The aggregate available short term funded facilities amounts to Rs. 7,149 million (2012: Rs. 10,308 million) out of which Rs. 2,338
million (2012: Rs. 1,474 million) remained unavailed as at the reporting date. Limits available for opening of letters of credit
amounts to Rs. 521 million (2012: Rs. 2,107 million) of which the limits remaining unutilized as at the reporting date amounts to
Rs. 128 million (2012: Rs. 144 million).
2013 2012
Note Rupees Rupees
15 Interest / mark-up accrued on borrowings
Redeemable capital 587,769,949 388,702,771
Long term finances 243,861,238 304,019,043
Short term borrowings 670,071,067 664,634,827
1,501,702,254 1,357,356,641
16 Dividend payable
Unclaimed dividend on ordinary shares 4,002,037 4,002,037
Dividend payable on preference shares 16.1 9,413,535 28,727,041
13,415,572 32,729,078
16.1 Preference dividend was due for payment on 21 November 2010, however no payments have been made up to the reporting
date. During the year ANL has partially adjusted the preference dividend against the new issue of PPTFCs. The management
intends to settle this amount along with the settlement of outstanding overdue preference shares.
Annual Report 2013 117

Notes to the Consolidated Financial Statementsfor the year ended 30 June 2013
17 Contingencies and commitments
17.1 Contingencies
17.1.1
17.1.2
17.1.3
17.1.4
17.1.5
17.1.6
2013 2012
Note Rupees Rupees
17.2 Commitments
17.2.1 Commitments under irrevocable letters of credit for:
- purchase of stores, spare and loose tools - 30,507,298
- purchase of machinery - 14,639,280
- purchase of raw material 43,889,430 76,726,497
43,889,430 121,873,075
17.2.2 Commitments for capital expenditure 705,600 3,236,108
18 Property, plant and equipment
Operating fixed assets 18.1 12,972,803,631 13,408,775,980
Capital work in progress 18.5 206,892 7,535,550
12,973,010,523 13,416,311,530
Counter guarantees given by ANL to its bankers as at the reporting date amount to Rs. 167.605 million (2012: Rs. 169.730 million).
No redemption of preference shares has been made up to the reporting date in respect of second and final redemption, whereas,
only partial redemption has been carried out in respect of first redemption. During the year ANL has partially converted
preference shares and preference dividend payable into PPTFCs, as referred to in note 9.5 and note 9.6.
Contingencies related to tax matters are referred to note 36 to the consolidated financial statements.
Several ex-employees of AGL have filed a petition against ANL demanding terminal benefits including those under the golden
hand shake scheme. The claim, valued at Rs. 8.0 million, is pending before the Honorable Lahore High Court and ANL expects a
favorable outcome.
Foreign bills discounted as at reporting date aggregated to Rs. 1,937.219 million (2012: 1,999.142 million).
ANL has issued indemnity bonds amounting to Rs. 212.437 million (2012: Rs. 641.000 million) in favour of Collector of Customs and
Sales Tax department in lieu of levies under various statutory notifications and these are likely to be released after the
fulfillment of the terms of related notifications.
Azgard Nine Limited118

No
tes
to t
he
Co
nso
lida
ted
Fin
an
cia
l Sta
tem
en
tsfo
r th
e ye
ar
end
ed 3
0 J
un
e 2
01
3
18
.1O
pe
rati
ng
fix
ed
ass
ets
As
se
ts o
wn
ed
by
th
e G
ro
up
Fre
eh
old
lan
d
- co
st
- re
va
lua
tio
n
Bu
ildin
gs
on
fre
eh
old
lan
d
- co
st
- re
va
lua
tio
n
Pla
nt
an
d m
ach
ine
ry
- co
st
- re
va
lua
tio
n
Furn
itu
re, f
ixtu
res
an
d o
ffic
e e
qu
ipm
en
t
Ve
hic
les
an
d r
ail
tra
nsp
ort
Too
ls a
nd
eq
uip
me
nt
Ele
ctri
cal a
nd
oth
er
inst
all
ati
on
s
As
se
ts s
ub
jec
t to
fin
an
ce
le
as
e
Pla
nt
an
d m
ach
ine
ry
Ve
hic
les
20
13
30
Ju
ne
20
13
CO
ST
/ R
EV
AL
UE
D A
MO
UN
TD
EP
RE
CIA
TIO
N
Ne
t b
oo
k v
alu
e
as
at
30
Ju
ne
20
13
55
8,0
10
,02
5
71
9,7
24
,97
5
1,2
77
,73
5,0
00
2,1
10
,87
6,1
09
52
9,1
17
,79
2
2,6
39
,99
3,9
01
6,2
39
,44
9,7
32
2,2
21
,74
4,5
16
8,4
61
,19
4,2
48
94
,83
2,1
81
23
,23
9,9
09
25
6,2
27
,88
9
98
,85
9,3
13
12
,85
2,0
82
,44
1
12
0,5
02
,51
3
21
8,6
77
12
0,7
21
,19
0
12
,97
2,8
03
,63
1
Ru
pe
es
As
at
30
Ju
ne
20
13 - - -
57
7,0
39
,04
0
17
4,4
21
,50
3
75
1,4
60
,54
3
3,4
31
,54
2,0
25
1,5
11
,65
2,0
82
4,9
43
,19
4,1
07
11
0,1
79
,78
9
62
,31
5,3
64
15
7,3
67
,35
3
94
,86
5,6
69
6,1
19
,38
2,8
25
94
,94
2,4
31
46
4,0
13
95
,40
6,4
44
6,2
14
,78
9,2
69
Ru
pe
es
Ad
just
me
nts
/
(dis
po
sals
) /
tra
nsf
ers
- - - - - -
65
4,5
44
65
4,5
44
-
(36
,67
1)
26
5,4
20
- -
88
3,2
93
(65
4,5
44
)
(5,0
71
,94
2)
(5,7
26
,48
6)
(4,8
43
,19
3)
Ru
pe
es
Ex
cha
ng
e
dif
fere
nce
- - - - - -
21
8,5
05
-
21
8,5
05
26
0,2
10
98
,79
5
28
9,3
56
46
0,9
86
1,3
27
,85
2
- - -
1,3
27
,85
2
Ru
pe
es
Fo
r th
e y
ea
r - - -
53
,61
5,6
49
13
,95
5,4
74
67
,57
1,1
23
27
7,0
08
,66
0
11
1,7
33
,12
5
38
8,7
41
,78
5
10
,63
8,8
35
5,3
44
,21
1
27
,56
2,7
12
10
,79
1,9
61
51
0,6
50
,62
7
5,7
16
,43
9
54
0,7
57
6,2
57
,19
6
51
6,9
07
,82
3
Ru
pe
es
As
at
01
Ju
ly 2
01
2 - - -
52
3,4
23
,39
1
16
0,4
66
,02
9
68
3,8
89
,42
0
3,1
53
,66
0,3
16
1,3
99
,91
8,9
57
4,5
53
,57
9,2
73
99
,31
7,4
15
56
,60
6,9
38
12
9,5
15
,28
5
83
,61
2,7
22
5,6
06
,52
1,0
53
89
,88
0,5
36
4,9
95
,19
8
94
,87
5,7
34
5,7
01
,39
6,7
87
Ru
pe
es
As
at
30
Ju
ne
20
13
55
8,0
10
,02
5
71
9,7
24
,97
5
1,2
77
,73
5,0
00
2,6
87
,91
5,1
49
70
3,5
39
,29
5
3,3
91
,45
4,4
44
9,6
70
,99
1,7
57
3,7
33
,39
6,5
98
13
,40
4,3
88
,35
5
20
5,0
11
,97
0
85
,55
5,2
73
41
3,5
95
,24
2
19
3,7
24
,98
2
18
,97
1,4
65
,26
6
21
5,4
44
,94
4
68
2,6
90
21
6,1
27
,63
4
19
,18
7,5
92
,90
0
Ru
pe
es
Tra
nsf
ers - - - - - -
2,5
78
,50
0
-
2,5
78
,50
0
-
9,3
14
,27
7
- -
11
,89
2,7
77
(2,5
78
,50
0)
(9,3
14
,27
7)
(11
,89
2,7
77
)
-
Ru
pe
es
Dis
po
sals - - - - - - - - -
(10
3,0
00
)
(7,9
12
,02
5)
- -
(8,0
15
,02
5)
-
(81
6,2
00
)
(81
6,2
00
)
(8,8
31
,22
5)
Ru
pe
es
Ex
cha
ng
e
dif
fere
nce - - - - - -
43
6,7
09
-
43
6,7
09
50
0,6
91
26
3,2
72
83
7,8
77
1,0
94
,99
1
3,1
33
,54
0
- - -
3,1
33
,54
0
Ru
pe
es
Ad
dit
ion
s - - -
7,6
55
,16
6
-
7,6
55
,16
6
51
,84
4,0
39
-
51
,84
4,0
39
1,9
71
,95
5
1,1
25
,80
0
12
,47
1,5
93
8,0
49
,26
5
83
,11
7,8
18
- - -
83
,11
7,8
18
Ru
pe
es
As
at
01
Ju
ly 2
01
2
55
8,0
10
,02
5
71
9,7
24
,97
5
1,2
77
,73
5,0
00
2,6
80
,25
9,9
83
70
3,5
39
,29
5
3,3
83
,79
9,2
78
9,6
16
,13
2,5
09
3,7
33
,39
6,5
98
13
,34
9,5
29
,10
7
20
2,6
42
,32
4
82
,76
3,9
49
40
0,2
85
,77
2
18
4,5
80
,72
6
18
,88
1,3
36
,15
6
21
8,0
23
,44
4
10
,81
3,1
67
22
8,8
36
,61
1
19
,11
0,1
72
,76
7
Ru
pe
es
Annual Report 2013 119

No
tes
to t
he
Co
nso
lida
ted
Fin
an
cia
l Sta
tem
en
tsfo
r th
e ye
ar
end
ed 3
0 J
un
e 2
01
3
18
.1.1
As
se
ts o
wn
ed
by
th
e G
ro
up
Fre
eh
old
lan
d
- co
st
- re
va
lua
tio
n
Bu
ildin
gs
on
fre
eh
old
lan
d
- co
st
- re
va
lua
tio
n
Pla
nt
an
d m
ach
ine
ry
- co
st
- re
va
lua
tio
n
Re
sid
en
tia
l co
lon
y a
sse
ts
- co
st
- re
va
lua
tio
n
Ro
ad
s, b
rid
ge
s a
nd
cu
lve
rts
Furn
itu
re, f
ixtu
res
an
d o
ffic
e e
qu
ipm
en
t
Ve
hic
les
an
d r
ail
tra
nsp
ort
Too
ls a
nd
eq
uip
me
nt
Ele
ctri
cal a
nd
oth
er
inst
all
ati
on
s
Pla
nta
tio
n
Bo
oks
an
d li
tera
ture
Ca
taly
sts
As
se
ts s
ub
jec
t to
fin
an
ce
le
as
e
Pla
nt
an
d m
ach
ine
ry
Ve
hic
les
20
12
30
Ju
ne
20
12
CO
ST
/ R
EV
ALU
ED
AM
OU
NT
DE
PR
EC
IAT
ION
55
8,0
10
,02
5
71
9,7
24
,97
5
1,2
77
,73
5,0
00
2,1
56
,83
6,5
92
54
3,0
73
,26
6
2,6
99
,90
9,8
58
6,4
62
,47
2,1
93
2,3
33
,47
7,6
41
8,7
95
,94
9,8
34
- - - -
10
3,3
24
,90
9
26
,15
7,0
11
27
0,7
70
,48
7
10
0,9
68
,00
4
- - -
13
,27
4,8
15
,10
3
12
8,1
42
,90
8
5,8
17
,96
9
13
3,9
60
,87
7
13
,40
8,7
75
,98
0
Ru
pe
es
Ne
t b
oo
k v
alu
e
as
at
30
Ju
ne
20
12
Re
cla
ssif
ied
to
ass
ets
he
ld f
or
sale
(no
te 3
7)
- - -
(44
0,7
02
,42
4)
(10
4,4
45
,01
6)
(54
5,1
47
,44
0)
(5,0
82
,46
6,3
34
)
(1,0
31
,40
1,4
64
)
(6,1
13
,86
7,7
98
)
(10
,54
4,9
57
)
(16
,24
2,1
09
)
(26
,78
7,0
66
)
(10
,97
0,3
09
)
(57
,95
0,1
34
)
(10
0,6
89
,27
8)
(18
4,7
75
,21
8)
(77
2,9
85
,01
0)
-
(69
2,8
24
)
(11
2,0
71
,74
8)
(7,9
25
,93
6,8
25
)
(27
,95
6,8
03
)
(42
,97
9,6
57
)
(70
,93
6,4
60
)
(7,9
96
,87
3,2
85
)
Ru
pe
es
Ad
just
me
nt - - - - - -
(11
,04
6,4
52
)
(6,9
85
,02
9)
(18
,03
1,4
81
)
- - - -
(17
,24
8)
14
,02
6,0
36
- - - - -
(4,0
22
,69
3)
(5,3
32
,69
8)
(33
,43
3,9
92
)
(38
,76
6,6
90
)
(42
,78
9,3
83
)
Ru
pe
es
Re
cla
ssif
ied
fro
m
ass
ets
he
ld f
or
dis
po
sal
(no
te 3
7)
- - - - - -
38
2,3
10
,84
9
22
5,7
97
,84
3
60
8,1
08
,69
2
- - - - - - - - - - -
60
8,1
08
,69
2
- - -
60
8,1
08
,69
2
Ru
pe
es
Exc
ha
ng
e
dif
fere
nce
- - - - - -
(10
4,4
22
)
-
(10
4,4
22
)
- - - -
(12
3,6
77
)
(31
,22
5)
(13
1,5
38
)
(21
5,0
12
)
- - -
(60
5,8
74
)
- - -
(60
5,8
74
)
Ru
pe
es
For
the
pe
rio
d - - -
79
,59
9,3
88
40
,26
3,6
20
11
9,8
63
,00
8
71
9,5
50
,38
4
37
8,7
72
,78
8
1,0
98
,32
3,1
72
53
4,8
82
4,5
20
,87
2
5,0
55
,75
4
1,7
52
,28
1
17
,22
9,3
57
5,1
89
,96
4
30
,95
3,4
32
37
,32
0,1
97
-
66
,80
1
92
7,4
80
1,3
16
,68
1,4
46
16
,06
8,1
81
19
,29
0,7
23
35
,35
8,9
04
1,3
52
,04
0,3
50
Ru
pe
es
As
at
01
Ju
ly 2
01
1 - - -
88
4,5
26
,42
7
22
4,6
47
,42
5
1,1
09
,17
3,8
52
7,1
45
,41
6,2
91
1,8
33
,73
4,8
19
8,9
79
,15
1,1
10
10
,01
0,0
75
11
,72
1,2
37
21
,73
1,3
12
9,2
18
,02
8
14
0,1
79
,11
7
13
8,1
11
,44
1
28
3,4
68
,60
9
81
9,4
92
,54
7
29
6,4
76
62
6,0
23
11
1,1
44
,26
8
11
,61
2,5
92
,78
3
10
7,1
01
,85
6
62
,11
8,1
24
16
9,2
19
,98
0
11
,78
1,8
12
,76
3
Ru
pe
es
As
at
30
Ju
ne
20
12
55
8,0
10
,02
5
71
9,7
24
,97
5
1,2
77
,73
5,0
00
2,6
80
,25
9,9
83
70
3,5
39
,29
5
3,3
83
,79
9,2
78
9,6
16
,13
2,5
09
3,7
33
,39
6,5
98
13
,34
9,5
29
,10
7
- - - -
20
2,6
42
,32
4
82
,76
3,9
49
40
0,2
85
,77
2
18
4,5
80
,72
6
29
6,4
76
- -
18
,88
1,6
32
,63
2
21
8,0
23
,44
4
10
,81
3,1
67
22
8,8
36
,61
1
19
,11
0,4
69
,24
3
Ru
pe
es
Re
cla
ssif
ied
to
ass
ets
he
ld f
or
sale
(no
te 3
7)
(82
,78
6,3
73
)
(2,3
22
,36
7,6
77
)
(2,4
05
,15
4,0
50
)
(1,3
51
,16
3,3
50
)
(1,2
17
,97
6,1
92
)
(2,5
69
,13
9,5
42
)
(25
,22
4,6
26
,36
7)
(12
,28
8,0
71
,35
7)
(37
,51
2,6
97
,72
4)
(14
,65
3,9
19
)
(22
6,0
43
,58
6)
(24
0,6
97
,50
5)
(88
,85
7,4
50
)
(85
,25
6,5
41
)
(10
7,8
50
,21
0)
(19
2,0
20
,24
3)
(1,3
41
,64
7,4
58
)
-
(92
6,4
79
)
(12
7,8
38
,89
2)
(44
,67
2,0
86
,09
4)
(41
2,5
85
,52
2)
(68
,47
0,9
54
)
(48
1,0
56
,47
6)
(45
,15
3,1
42
,57
0)
Ru
pe
es
Tra
nsf
ers
- - - - - - - - - - - - - -
41
,24
9,7
31
- - - - -
41
,24
9,7
31
-
(41
,24
9,7
31
)
(41
,24
9,7
31
)
-
Ru
pe
es
Re
cla
ssif
ied
fro
m
ass
ets
he
ld f
or
dis
po
sal
(no
te 3
7)
- - - - - -
67
4,4
73
,49
1
64
6,7
27
,75
9
1,3
21
,20
1,2
50
- - - - - - - - - - -
1,3
21
,20
1,2
50
- - -
1,3
21
,20
1,2
50
Ru
pe
es
Dis
po
sals
- - - - - -
(15
,64
1,0
73
)
(9,8
90
,35
7)
(25
,53
1,4
30
)
- - - -
(60
,00
0)
(21
,18
4,9
41
)
- - - - -
(46
,77
6,3
71
)
-
(11
,11
6,3
49
)
(11
,11
6,3
49
)
(57
,89
2,7
20
)
Ru
pe
es
Ad
just
me
nts - - - - - - - - - - - - - - - - - - - - -
(68
,69
2,1
48
)
-
(68
,69
2,1
48
)
(68
,69
2,1
48
)
Ru
pe
es
Exc
ha
ng
e
dif
fere
nce
- - - - - -
(26
1,6
13
)
-
(26
1,6
13
)
- - - -
(29
9,9
42
)
(14
1,0
83
)
(50
1,9
36
)
(65
5,9
62
)
- - -
(1,8
60
,53
6)
- - -
(1,8
60
,53
6)
Ru
pe
es
Ad
dit
ion
s
- - -
12
0,7
81
,09
9
-
12
0,7
81
,09
9
12
,60
7,4
73
,75
8
-
12
,60
7,4
73
,75
8
4,6
03
-
4,6
03
-
21
,25
2,1
40
4,9
95
,00
3
13
,98
9,0
99
26
,27
1,7
95
- -
16
,69
4,6
24
12
,81
1,4
62
,12
1
13
7,8
16
,93
0
70
,00
0
13
7,8
86
,93
0
12
,94
9,3
49
,05
1
Ru
pe
es
As
at
01
Ju
ly 2
01
1
64
0,7
96
,39
8
3,0
42
,09
2,6
52
3,6
82
,88
9,0
50
3,9
10
,64
2,2
34
1,9
21
,51
5,4
87
5,8
32
,15
7,7
21
21
,57
4,7
14
,31
3
15
,38
4,6
30
,55
3
36
,95
9,3
44
,86
6
14
,64
9,3
16
22
6,0
43
,58
6
24
0,6
92
,90
2
88
,85
7,4
50
26
7,0
06
,66
7
16
5,6
95
,44
9
57
8,8
18
,85
2
1,5
00
,61
2,3
51
29
6,4
76
92
6,4
79
11
1,1
44
,26
8
49
,42
8,4
42
,53
1
56
1,4
84
,18
4
13
1,5
80
,20
1
69
3,0
64
,38
5
50
,12
1,5
06
,91
6
Ru
pe
es
As
at
30
Ju
ne
20
12 - - -
52
3,4
23
,39
1
16
0,4
66
,02
9
68
3,8
89
,42
0
3,1
53
,66
0,3
16
1,3
99
,91
8,9
57
4,5
53
,57
9,2
73
- - - -
99
,31
7,4
15
56
,60
6,9
38
12
9,5
15
,28
5
83
,61
2,7
22
29
6,4
76
- -
5,6
06
,81
7,5
29
89
,88
0,5
36
4,9
95
,19
8
94
,87
5,7
34
5,7
01
,69
3,2
63
Ru
pe
es
Azgard Nine Limited120

Notes to the Consolidated Financial Statementsfor the year ended 30 June 2013
18.2 Disposal of property, plant and equipment
Vehicles - owned
Suzuki Mehran (LEC-09-6098)
Suzuki Mehran (LEC-09-6449)
Honda City (LEB-09-6904)
Suzuki Mehran (LEC-09-6103)
Honda City (LEA-10-1394)
Suzuki Mehran (LEA-08-9392)
Suzuki Cultus (LED-08-7720)
Suzuki Cultus (LEE-08-8430)
Suzuki Mehran (LEC-09-6096)
Suzuki Mehran (LEC-09-6097)
Suzuki Cultus (LEE-08-1207)
Vehicles - leased
Suzuki Cultus (LEC-09-4567)
Office equipment
Lenovo laptop
Lenovo laptop
Rupees
2012
2013
Mode of
disposal
Company policy
Company policy
Company policy
Company policy
Company policy
Company policy
Company policy
Company policy
Company policy
Company policy
Company policy
Company policy
Company policy
Company policy
Particulars of buyer
Employee
Employee
Employee
Employee
Employee
Employee
Employee
Employee
Employee
Employee
Employee
Employee
Employee
Employee
Gain / (loss)
on disposal
Rupees
(65,460)
(41,637)
(34,839)
(49,599)
(165,952)
(34,541)
(77,592)
(94,751)
(37,741)
(95,650)
(76,834)
(774,596)
(57,577)
(23,640)
(21,889)
(45,529)
(877,702)
(709,228)
Sale
proceeds
Rupees
222,900
227,471
592,400
222,250
513,507
106,000
170,105
178,922
222,250
139,156
164,168
2,759,129
330,400
11,000
9,800
20,800
3,110,329
16,350,533
Net
book value
Rupees
288,360
269,108
627,239
271,849
679,459
140,541
247,697
273,673
259,991
234,806
241,002
3,533,725
387,977
34,640
31,689
66,329
3,988,031
17,059,761
Accumulated
depreciation
Rupees
(267,890)
(289,570)
(804,761)
(280,151)
(603,309)
(274,242)
(404,303)
(408,327)
(297,259)
(319,819)
(428,669)
(4,378,300)
(428,223)
(19,360)
(17,311)
(36,671)
(4,843,194)
(29,716,611)
Cost
Rupees
556,250
558,678
1,432,000
552,000
1,282,768
414,783
652,000
682,000
557,250
554,625
669,671
7,912,025
816,200
54,000
49,000
103,000
8,831,225
46,776,372
2013 2012
Note Rupees Rupees
18.3 The depreciation charge for the year has been
allocated as follows:
Continued operations:
Cost of sales 31 498,380,814 521,196,274
Administrative and general expenses 33 18,527,058 19,460,720
Discontinued operations 37.1 - 811,383,356
516,907,872 1,352,040,350
18.4 Revaluation of fixed assets
Land, building, and plant & machinery of ANL was revalued as at 28 December 2009 by a firm of independent valuers, Consultancy
Support & Services (Private) Limited.
Annual Report 2013 121

Notes to the Consolidated Financial Statementsfor the year ended 30 June 2013
18.5 Capital work in progress
2013 2012
Note Rupees Rupees
19 Intangible assets
Goodwill acquired in business combination
Farital AB 19.1 - 692,341,926
Montebello s.r.l. &19.2 & 19.2.2 692,341,926 -
Development costs 19.3 - -
Software 19.4 1,302,407 3,907,224
693,644,333 696,249,150
19.1 Goodwill in Farital AB
Goodwill
Acquired in business combination 1,917,699,426 1,917,699,426
Transferred 19.2 (1,917,699,426) -
- 1,917,699,426
Accumulated impairment
As at beginning of the year (1,225,357,500) -
Transferred 19.2 & 19.2.2 1,225,357,500 (1,225,357,500)
- (1,225,357,500)
As at end of the year 19.2.1 - 692,341,926
Building
Plant and machinery
Building
Plant and machinery
2013
2012
As at
69,228
137,664
206,892
As at
30 June 2012
262,172
7,273,378
7,535,550
Rupees
Rupees
30 June 2013
Classified toassets held for
sale
(note 37)
-
-
-
Classified toassets held for
sale
(note 37)
(166,985)
(41,508,850)
(41,675,835)
Rupees
Rupees
Transfers
(2,786,005)
(15,787,906)
(18,573,911)
Transfers
(111,760,875)
(12,555,230,904)
(12,666,991,779)
Rupees
Rupees
Additions
2,593,061
8,652,192
11,245,253
Additions
15,645,811
896,457,303
912,103,114
RupeesRupees
RupeesRupees
As at
01 July 2012
262,172
7,273,378
7,535,550
As at
01 July 2011
96,544,221
11,707,555,829
11,804,100,050
Azgard Nine Limited122

Notes to the Consolidated Financial Statementsfor the year ended 30 June 2013
2013 2012
Note Rupees Rupees
19.2 Goodwill in Montebello s.r.l.
Goodwill
Transferred on liquidation of Farital AB 19.1 1,917,699,426 -
Accumulated impairment
Transferred on liquidation of Farital AB 19.1 & 19.2.2 (1,225,357,500) -
As at end of the year 19.2.1 692,341,926 -
19.2.1
19.2.2
19.3
Cost
As at beginning of the year
Accumulated amortization
As at beginning of the year
Amortization for the year
As at end of the year
19.4
This represents expenditure incurred on implementation of Oracle Financials Suite.
Cost
As at beginning of the year
Exchange difference
Accumulated amortization
As at beginning of the year
Amortization for the year
Exchange difference
As at end of the year
Rate of amortization
This represents expenditure on development of new products and processes to gain competitive advantage in the national and
international market.
This goodwill represents goodwill arising on acquisition of MSRL and represents the excess of cost of investment over its fair value.
The Group assessed the recoverable amount at 30 June 2013 for impairment test of goodwill. The recoverable amount was
determined using the discounted cash flow method by using a discount factor adjusted for country and other risks of 11.89% per
annum.
During the year, 100% owned subsidiary of ANL, FAB has been dissolved. FAB was incorporated in order to acquire 100% interest in
MSRL, owner of an Italian fabric and jeans brand. Consequent to dissolution of FAB, 100% interest in MSRL has been transferred to
the Group.
2013 2012
Rupees Rupees
87,853,404 87,853,404
(87,853,404) (86,075,956)
- (1,777,448)
(87,853,404) (87,853,404)
- -
20% 20%
15,097,477 15,208,817
185,860 (111,340)
15,283,337 15,097,477
(11,190,253) (8,615,911)
(2,604,817) (2,682,411)
(185,860) 108,069
(13,980,930) (11,190,253)
1,302,407 3,907,224
20% 20%
Annual Report 2013 123

Notes to the Consolidated Financial Statementsfor the year ended 30 June 2013
20 Long term investments
2013 2012
Note Rupees Rupees
Equity securities
Cost 20.1 18,664 18,664
Fair value adjustment 20.1 12,557 (3,833)
31,221 14,831
Debt securities
Cost 20.2 266,074,508 -
266,105,729 14,831
20.1 Particulars of investments in equity
securities are as follows:
Colony Mills Limited
4,332 (2012: 4,332) ordinary shares of Rs. 10 each
Market value Rs. 4.43 per share (2012: Rs. 1.72 per share)
Cost 8,664 8,664
Fair value adjustment 10,527 (1,213)
19,191 7,451
JS Value Fund Limited
1,000 (2012: 1,000) ordinary shares of Rs. 10 each
Market value Rs. 12.03 per share (2012: Rs. 7.38 per share)
Cost 10,000 10,000
Fair value adjustment 2,030 (2,620)
12,030 7,380
31,221 14,831
20.2 Particulars of investments in debt security are as follows:
Agritech Limited
53,259 Term Finance Certificates of Rs. 5,000 each 20.1.1 266,074,508 -
(2012: 53,259 Term Finance Certificates of Rs. 5,000 each)
20.1.1 These represent Term Finance Certificates (”TFCs”) of Rs. 5,000 each issued by AGL and carry return at six months
KIBOR plus 1.75% and are redeemable in thirteen unequal semi-annual installments after a grace period of three years
starting from 14 July 2013. Since 25,237 (2012: 25,237) number of TFCs out of total number of TFCs
providers of debt finance, therefore these have been presented as long term investment.
These represent investments in equity and debt securities. These have been classified as available for sale financial assets. Particulars of
investments are as follows:
are pledged as security with
Azgard Nine Limited124

Notes to the Consolidated Financial Statementsfor the year ended 30 June 2013
2013 2012
Note Rupees Rupees
21 Long term deposits - unsecured, considered good
Utility companies and regulatory authorities 21.1 22,175,676 36,442,356
Financial institutions 21.2 6,993,740 3,046,600
29,169,416 39,488,956
21.1
21.2
2013 2012
Rupees Rupees
22 Stores, spares and loose tools
Stores, spares and loose tools 130,970,353 335,048,870
Less: provision for slow moving and obsolete items - (161,729,345)
130,970,353 173,319,525
22.1 Provision for slow moving and obsolete items
As at beginning of the year 161,729,345 -
Provision recognized during the year - 161,729,345
Less: provision written off (161,729,345) -
As at end of the year - 161,729,345
22.1
2013 2012
Note Rupees Rupees
23 Stock in trade
Raw material 1,132,636,448 1,602,140,598
Work in process 706,429,440 1,126,493,487
Finished goods 529,860,677 481,079,302
Less: diminution in value of stock due to net realizable value 23.1 (29,887,439) (77,805,957)
2,339,039,126 3,131,907,430
23.1
23.2
These have been deposited with various utility companies and regulatory authorities. These are classified as 'loans and
receivables' under IAS 39 'Financial Instruments - Recognition and Measurement' which are required to be carried at amortized
cost. However, these, being held for an indefinite period with no fixed maturity date, are carried at cost as its amortized cost is
impracticable to determine.
These have been deposited with various banking companies and financial institutions against finance leases.
Diminution in the value of stock is related to raw material.
Stores, spares and loose tools include items which may result in fixed capital expenditure but are not distinguishable.
Details of stock in trade pledged as security are referred to in note 45 to the financial statement.
Annual Report 2013 125

Notes to the Consolidated Financial Statementsfor the year ended 30 June 2013
2013 2012
Note Rupees Rupees
24 Trade receivables
Local
- secured 24.1 57,628,161 7,427,983
- unsecured, considered good 169,936,071 156,800,352
- unsecured, considered doubtful 128,867,635 12,240,583
356,431,867 176,468,918
Foreign
- secured 24.1 441,204,961 222,401,742
- unsecured, considered good 2,088,514,749 2,439,539,729
- unsecured, considered doubtful 304,495,257 266,805,715
2,834,214,967 2,928,747,186
3,190,646,834 3,105,216,104
Less: provision against trade receivables 24.224.2
25.1
25.2
(433,362,891) (279,046,298)
2,757,283,943 2,826,169,806
24.1 These are secured against letters of credit.
24.2 Movement in provision of trade receivables
As at beginning of the year 279,046,298 360,360,084
Classified as held for sale - (47,325,078)
Provision recognized during the year 184,652,401 178,851,438
Less: provision written off (40,699,198) (205,510,797)
Exchange difference 10,363,390 (7,329,349)
As at end of the year 433,362,891 279,046,298
25 Advances, deposits, prepayments and
other receivables
Advances to suppliers - unsecured, considered good 241,451,652 406,305,075
Advances to employees - unsecured, considered good
- against salaries 14,561,020 13,614,858
- against expenses 19,467,905 20,058,323
Security deposits 5,967,336 5,435,136
Margin deposits 34,238,755 34,238,755
Prepayments 169,695 3,881,911
Rebate receivable 153,249,493 187,929,559
Sales tax / FED recoverable 317,318,273 161,260,746
Letters of credit 25,964,274 48,712,485
Insurance claims 10,105,655 1,160,685
Other receivables - unsecured, considered good 7,745,175 10,288,518
830,239,233 892,886,051
25.1 These represent advances to employees against future salaries and post employment benefits in accordance with ANL's
policy and include advances to executives amounting to Rs. 27.647 million (2012: Rs. 25.400 million).
Azgard Nine Limited126

Notes to the Consolidated Financial Statementsfor the year ended 30 June 2013
25.2
26 Due from Agritech Limited - unsecured, considered good
2013 2012
Note Rupees Rupees
27 Short term investment
Agritech Limited
20,000,000 ordinary shares of Rs. 10 each
Value of investment Rs. 35.00 per share
Proportion of share capital held 5.10% (2012: 79.87%)
Cost 27.1 700,000,000 -
27.1
28 Current taxation
As at beginning of the year 110,270,269 298,819,762
Paid during the year 91,869,771 45,862,281
Classified as held for sale 37 - (112,625,780)
Provision for the year (137,539,517) (115,954,408)
Exchange difference 9,309,461 (5,831,586)
As at end of the year 73,909,984 110,270,269
29 Cash and bank balances
Cash in hand 2,223,554 1,506,281
Cash at banks
- current accounts in local currency 118,029,232 154,120,175
- current accounts in foreign currency - 21,057,960
- deposit accounts in local currency 29.1 11,689,764 133,879,196
- deposit accounts in foreign currency 29.2 11,098,063 425,512
140,817,059 309,482,843
143,040,613 310,989,124
29.1
29.2
These represent deposits against letters of credit / guarantee and other working capital lines utilized.
All shares held by the Company are pledged with DIB. Also refer to note 37.
It mainly represents mark-up related to investment in TFC's of AGL as referred to in note 20.2.
These carry return at 6.00% to 8.50% per annum (2012: 5.00% to 13.34% per annum).
These carry return at prevailing LIBOR per annum (2012: prevailing LIBOR per annum).
Annual Report 2013 127

Notes to the Consolidated Financial Statementsfor the year ended 30 June 2013
2013 2012
Note Rupees Rupees
30 Sales - net
Local 2,038,185,223 1,771,497,625
Export 30.1 12,439,501,654 10,237,604,355
14,477,686,877 12,009,101,980
Rebate on exports 39,188,075 46,963,486
Sales tax (32,362,624) (7,162,598)
Discount (45,326,726) (141,465,563)
14,439,185,602 11,907,437,305
30.1
2013 2012
Note Rupees Rupees
31 Cost of sales
Raw materials consumed 9,105,344,851 8,950,265,870
Salaries, wages and benefits 31.1 1,414,082,564 1,519,645,224
Fuel and power 1,235,045,634 897,713,749
Store and spares consumed 222,806,919 494,836,797
Traveling, conveyance and entertainment 132,398,171 138,103,555
Rent, rates and taxes 16,016,051 13,387,780
Insurance 53,119,066 66,818,393
Repair and maintenance 43,375,915 38,497,321
Processing charges 71,254,467 91,079,093
Depreciation 18.3 498,380,814 521,196,274
Amortization 19.4 - 1,777,448
Printing & stationery 7,367,988 9,148,588
Communications 5,622,675 5,272,985
Others 60,752,375 59,504,308
12,865,567,490 12,807,247,385
Work in process
As at beginning of the year 1,126,493,487 678,642,704
As at end of the year (706,429,440) (1,126,493,487)
420,064,047 (447,850,783)
Cost of goods manufactured 13,285,631,537 12,359,396,602
Finished goods
As at beginning of the year 481,079,302 1,071,570,339
Purchased during the year 457,818,151 -
As at end of the year (529,860,677) (481,079,302)
409,036,776 590,491,037
13,694,668,313 12,949,887,639
31.1
These include indirect exports of ANL, taxable under Section 154 (3b) of the Income Tax Ordinance, 2001, amounting to Rs.
537.911 million (2012: Rs. 101.644 million).
These include charge in respect of ANL employees retirement benefits amounting to Rs. 42.851 million (2012: Rs. 38.095
million).
Azgard Nine Limited128

Notes to the Consolidated Financial Statementsfor the year ended 30 June 2013
2013 2012
Note Rupees Rupees
32 Selling and distribution expenses
Salaries and benefits 32.1 100,633,888 124,686,047
Traveling, conveyance and entertainment 43,508,319 38,457,947
Fuel and power 26,031 24,965
Repair and maintenance 873,601 981,578
Rent, rates and taxes 767,809 622,721
Insurance 11,195,921 4,464,768
Freight and other expenses 358,452,459 380,069,911
Provision against trade receivables 24.2 184,652,401 178,851,438
Printing and stationery 652,104 222,767
Communication 43,490,080 29,100,990
Advertisement and marketing 17,909,582 8,857,019
Legal and professional charges 30,000 75,000
Fee and subscription 475,659 435,588
Commission 222,331,933 348,397,024
Miscellaneous 1,163,737 1,702,915
986,163,524 1,116,950,678
32.1
2013 2012
Note Rupees Rupees
33 Administrative and general expenses
Salaries and benefits 33.1 345,242,942 319,762,209
Traveling, conveyance and entertainment 39,974,275 67,831,458
Fuel and power 29,717,576 24,636,687
Repair and maintenance 19,825,728 25,020,577
Rent, rates and taxes 16,967,157 20,469,658
Insurance 1,137,367 3,064,947
Printing and stationery 6,007,050 6,715,202
Communication 21,083,718 30,309,366
Legal and professional charges 33.3
33.2
35,449,500 29,141,218
Depreciation 18.3 18,527,058 19,460,720
Amortization 19.4 2,604,817 2,682,411
Fee and subscription 32,505,025 32,898,641
Donations 1,115,258 1,401,810
Others 27,477,962 46,807,646
597,635,433 630,202,550
33.1
33.2
These include charge in respect of ANL employees retirement benefits amounting to Rs. 2.253 million (2012: Rs. 2.473
million).
These
This represents donation to different associations and trusts. None of the Directors have any intrust in the donee.
include charge in respect of ANL employees retirement benefits amounting to Rs. 9.468 million (2012: Rs. 9.468
million).
Annual Report 2013 129
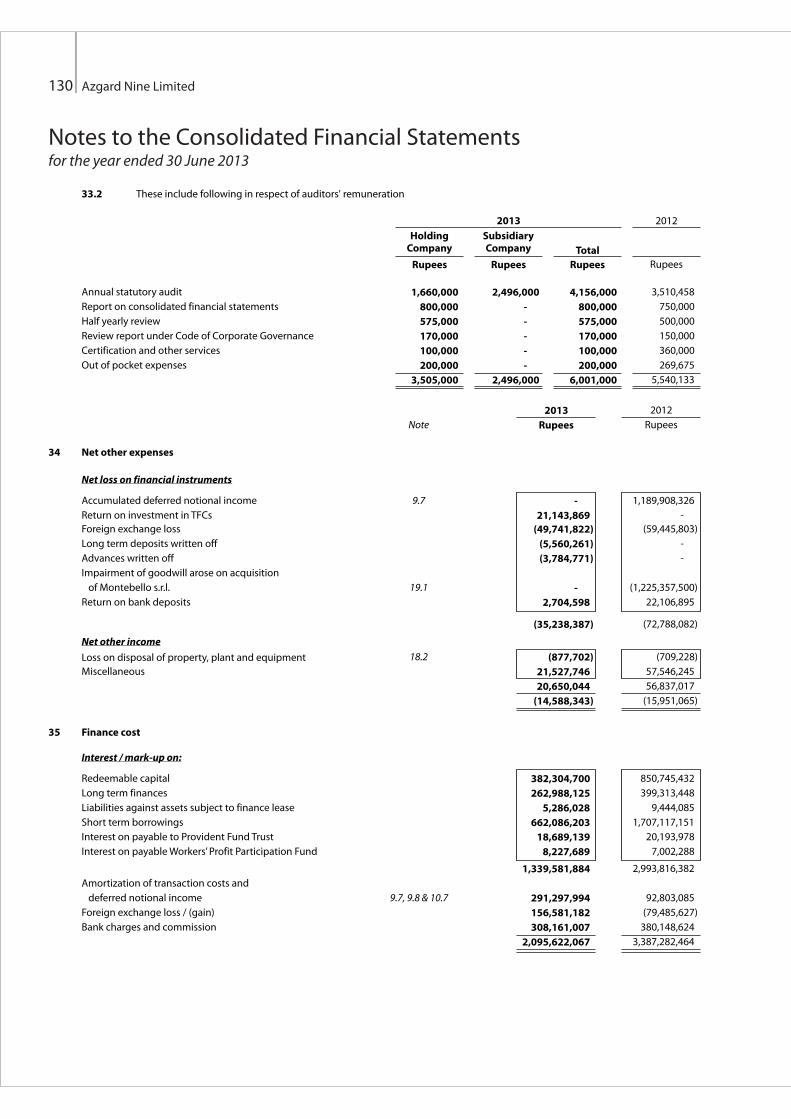
Notes to the Consolidated Financial Statementsfor the year ended 30 June 2013
33.2 These include following in respect of auditors' remuneration
34 Net other expenses
35 Finance cost
Annual statutory audit
Report on consolidated financial statements
Half yearly review
Review report under Code of Corporate Governance
Certification and other services
Out of pocket expenses
3,510,458
750,000
500,000
150,000
360,000
269,675
5,540,133
4,156,000
800,000
575,000
170,000
100,000
200,000
6,001,000
2,496,000
-
-
-
-
-
2,496,000
1,660,000
800,000
575,000
170,000
100,000
200,000
3,505,000
2013
Rupees
2012
Total
Rupees
SubsidiaryCompany
Rupees
HoldingCompany
Rupees
Interest / mark-up on:
Redeemable capital 382,304,700 850,745,432
Long term finances 262,988,125 399,313,448
Liabilities against assets subject to finance lease 5,286,028 9,444,085
Short term borrowings 662,086,203 1,707,117,151
Interest on payable to Provident Fund Trust 18,689,139 20,193,978
Interest on payable Workers’ Profit Participation Fund 8,227,689 7,002,288
1,339,581,884 2,993,816,382
Amortization of transaction costs and
deferred notional income 9.7, 9.8 & 10.7 291,297,994 92,803,085
Foreign exchange loss / (gain) 156,581,182 (79,485,627)
Bank charges and commission 308,161,007 380,148,624
2,095,622,067 3,387,282,464
2013 2012
Note Rupees Rupees
Net loss on financial instruments
Accumulated deferred notional income 9.7 - 1,189,908,326
Return on investment in TFCs 21,143,869 -
Foreign exchange loss (49,741,822) (59,445,803)
Long term deposits written off (5,560,261) -
Advances written off (3,784,771) -
Impairment of goodwill arose on acquisition
of Montebello s.r.l. 19.1 - (1,225,357,500)
Return on bank deposits 2,704,598 22,106,895
(35,238,387) (72,788,082)
Net other income
Loss on disposal of property, plant and equipment 18.2 (877,702) (709,228)
Miscellaneous 21,527,746 57,546,245
20,650,044 56,837,017
(14,588,343) (15,951,065)
Azgard Nine Limited130

Notes to the Consolidated Financial Statementsfor the year ended 30 June 2013
2013 2012
Note Rupees Rupees
36 Taxation
Current taxation 36.1.1 (137,539,517) (115,954,408)
Deferred taxation 36.1.8 - -
(137,539,517) (115,954,408)
36.1 Following are the matters related to ANL;
36.1.9 There is no relationship between tax expense and accounting profit since ANL's profits are subject to tax under the Final Tax
Regime. Accordingly, no numerical reconciliation has been presented.
36.1.6 Income Tax Return for the tax year 2011 has been filed which deemed to have been assessed under section 120 of the
Ordinance.
36.1.7 Various other cases involving point of law are pending for adjudication before the Honorable Lahore High Court.
36.1.3 Income tax return for the tax year 2008 has been filed and is deemed to have been assessed under section 120 of the
Ordinance has been amended under section 122(5A) of the Ordinance. ANL filed Appeal against the Order in CIT-A. The CIT-A
allowed Tax Payers appeal. Income Tax Department filed second appeal in ATIR. The ATIR dismissed the departmental appeal.
The appeal order has not yet been issued by the department in this respect.
36.1.1 Provision for current tax of ANL has been made in accordance with section 154 of the Income Tax Ordinance, 2001 ("the
Ordinance").
36.1.4 In tax year 2009 the Income Tax Department passed the order under section 122(1) of the Ordinance. ANL filed appeal against
the order in CIT-A. The CIT-A dismissed the Taxpayer's appeal. The Taxpayer filled second appeal before ATIR. ATIR allowed the
taxpayer appeal. The appeal order has not yet been issued by the department in this respect.
36.1.5 Income tax return for the tax year 2010 has been filed and is deemed to have been assessed under section 120 of the
Ordinance. Later on Deputy Commissioner Inland Revenue rectified the Order under section 221 of the Ordinance for charge
of Worker's Welfare Fund and Turnover tax on local sales under section 113 separately. ANL filed appeal against the
rectification orders before CIT-A. The CIT-A allowed Taxpayer's appeal and delete the Worker's Welfare Fund. Whereas CIT-A
upheld the order of Deputy Commissioner on issue of turnover tax. The taxpayer filed second appeal before ATIR which is
pending for adjudication.
36.1.8 Export sales, including proposed claims for indirect exports of ANL are expected to achieve the threshold for ANL, with the
option to be taxed under the Final Tax Regime. This trend is expected to continue in foreseeable future. Accordingly, no
provision for deferred tax has been made.
36.1.2 In Tax Year 2007 the Income Tax Department passed the order under section 122(1) assessed loss at Rs. 175.711 million. ANL
filed appeal against the order in CIT-A. The Income Tax Department filed second appeal in Appellate Tribunal Inland Revenue
(ATIR). ATIR dismissed the departmental appeal. The appeal order has not yet been issued by the department in this respect.
37 Discontinued operations
In previous year, AGL was classified as part of disposal group / subsidiary held for disposal on the basis that a Share Transfer and Debt Swap
Agreement and First Supplemental Agreement ("the Agreement") was signed between ANL and the purchasers to dispose off its entire
shareholding in AGL.
During the year, pursuant to the Agreement, ANL has divested major part of its shareholding in AGL. As a result, out of 313,423,184 number
of shares held by ANL at the start of the year, 293,423,184 number of shares were sold on 31 October 2012 at Rs. 35.00 per share and
remaining 20,000,000 number of shares are still under pledge whose divestment would complete once these shares are released. ANL has
filed a legal suit against Dubai Islamic Bank Limited ("DIB") for release of pledged shares.
36.2 Income tax provision in respect of Subsidiary Company has not been made on the basis that it had unused tax losses as at reporting
date.
Annual Report 2013 131

Notes to the Consolidated Financial Statementsfor the year ended 30 June 2013
2013 2012
Note Rupees Rupees
Results of discontinued operations - subsidiary 37.1 (1,260,288,978) (1,646,592,181)
Gain on sale of discontinued operations - subsidiary 37.2 2,001,867,817 -
741,578,839 (1,646,592,181)
01 July 2012
to
31 October 2012
01 July 2011
to
30 June 2012
Un-audited Audited
Rupees Rupees
Revenue 953,905,398 5,697,064,161
Expenses - net (2,297,534,541) (7,550,857,571)
Loss before tax (1,343,629,143) (1,853,793,410)
Taxation 83,340,165 207,201,229
Loss after tax (1,260,288,978) (1,646,592,181)
2013
Note Rupees
37.2 Gain on sale of discontinued operations - subsidiary
Consideration received / adjusted 10,269,811,440
Fair value of remaining investment 700,000,000
Non-controlling interest as at 31 October 2012 3,670,704,258
14,640,515,698
Net assets including goodwill of subsidiary as at 31 October 2012 (12,638,647,881)
37.3 2,001,867,817
37.3
37.4
37.5 Assets and liabilities of subsidiary classified as held for sale
Assets of subsidiary classified as held for sale
Non-current assets - 40,779,451,388
Current assets - 3,827,866,187
- 44,607,317,575
It includes an amount of Rs. 293.003 million related to remaining investment in the former subsidiary.
37.1 Results of discontinued operations
The results for four months period of AGL till date of disposal are pro-rated results of six months reviewed financial
information and hence the same figures were used in the gain on sale of discontinued operation working in note 37.2 and for
calculation of the share of non-controlling interest for the current year related to discontinued operations and related cash flows.
Revaluation surplus of subsidiary amounting to Rs. 3,150.164 million has directly been transferred to retained earnings.
The remaining investment of 20,000,000 number of shares in AGL has become an ordinary investment of ANL as against the investment in
subsidiary as at beginning of the year.
2013 2012
Rupees Rupees
Azgard Nine Limited132

Notes to the Consolidated Financial Statementsfor the year ended 30 June 2013
2013 2012
Rupees Rupees
Liabilities of subsidiary classified as held for sale
Non-current liabilities - 21,968,808,298
Current liabilities - 8,860,134,972
- 30,828,943,270
38 (Loss) / earning per share - basic and diluted
Unit 2013 2012
38.1 From continuing operations
Loss attributable to ordinary shareholders Rupees (3,087,031,595) (6,308,791,499)
Weighted average number of ordinary
shares outstanding during the year No. of shares 454,871,870 454,871,870
Loss per share Rupees (6.79) (13.87)
38.2 From discontinued operations
Earning / (loss) attributable to ordinary shareholders Rupees 988,462,730 (1,388,729,902)
Weighted average number of ordinary
shares outstanding during the year No. of shares 454,871,870 454,871,870
Earning / (loss) per share Rupees 2.17 (3.05)
There is no dilution effect on the basic loss per share as the Group has no such commitments.
39 Government grant
37.6 As a result of the divestment, ANL has adjusted to the extent of Rs. 6,778.221 million and paid Rs. 3,264.770 million to settle its
long term loans, certain interest / mark-up, redeemable capital, short term borrowings, bills payable and other charges
amounting to Rs. 10,042.991 million and injected the remaining amount of Rs. 226.82 million in its working capital.
During the year, ANL lodged claims amounting to Rs. 43.606 million (2012: Rs. 63.225 million) as export rebate / duty draw-back
respectively which have been accounted for as government grant in accordance with IAS 20 'Government Grants'. Rebates
have been recognized as income and added to sales.
Annual Report 2013 133

Notes to the Consolidated Financial Statementsfor the year ended 30 June 2013
41 Cash and cash equivalents
Short term borrowings - running finance - secured 13 (1,076,169,156) (1,832,049,760)
Cash and bank balances 29 143,040,613 310,989,124
(933,128,543) (1,521,060,636)
42 Transactions and balances with related parties
Related parties from the Group's perspective comprise, associated undertakings, key management personnel (including chief
executive and directors) and post employment benefit plan. The Group in the normal course of business carries out transactions with
various related parties and continues to have a policy whereby all such transactions are carried out on permissible basis.
2013 2012
Note Rupees Rupees
40
37.2
37.2
Cash generated from continuing operations
Loss after taxation from continuing operations
Gain on disposal of discontinued operations
Adjustments for non-cash and other items
Interest / mark-up expense
Loss on disposal of fixed assets
Foreign exchange loss / (gain)
Gain on disposal of discontinued operations
Return on investment in TFCs
Long term deposits written off
Advances written off
Taxation
Translation reserve
Depreciation
Amortization of transaction costs and deferred notional income
Operating loss before changes in working capital
Changes in working capital
Decrease in current assets:
Stores, spares and loose tools
Stock in trade
Trade receivables
Advances, deposits, prepayments and other receivables
(Decrease) / increase in current liabilities:
Trade and other payables
Cash generated from operations
(3,087,031,595)
2,001,867,817
(1,085,163,778)
1,307,379,028
877,702
206,323,004
(2,001,867,817)
(21,143,869)
5,560,261
3,784,771
137,539,517
-
516,907,872
291,297,994
633,915,681
(451,248,097)
42,349,172
804,039,018
68,316,039
68,192,826
982,897,055
(309,219,965)
222,428,993
(6,308,791,499)
-
(6,308,791,499)
2,751,779,755
709,228
(20,039,824)
-
-
-
-
115,954,408
(1,947,547)
540,656,994
92,803,085
Amortization of intangible assets
Provision for impairment of receivables
Changes in fair value of fair value hedges
Deferred notional income
Impairment of goodwill arose on acquisition of Farital AB
2,604,817
184,652,401
-
-
-
4,459,859
178,851,438
7,424,080
(1,189,908,326)
1,225,357,500
3,706,100,650
(2,602,690,849)
299,709,439
926,216,410
1,338,165,231
114,169,649
2,678,260,729
225,657,055
301,226,935
Azgard Nine Limited134

Notes to the Consolidated Financial Statementsfor the year ended 30 June 2013
Details of transactions and balances with related parties are as follows:
2013 2012
Rupees Rupees
42.1 Transactions with related parties
42.1.1 Other related parties
Agritech Limited
Mark-up income on redeemable capital and other charges 16,600,910 -
JS Bank Limited
Redeemable capital repaid 84,848,231 -
Mark-up expense 35,417,034 71,479,009
Remuneration of Trustee 3,000,000 -
JS Value Fund Limited
Redeemable capital - TFC II repayment (25,415,775) -
Redeemable capital - TFC VI disbursement - 12,900,000
Mark-up expense 3,366,593 6,371,916
Unit Trust of Pakistan
Redeemable capital - TFC V repayments (18,019,234) -
Redeemable capital - TFC VI disbursement - 19,265,000
Mark-up expense 4,352,918 6,803,260
JS Large Cap Fund
Redeemable capital - PPTFC disbursement 83,160,000 -
Mark-up expense 8,122,353 5,828,806
JS Global Capital Limited
Redeemable capital - PPTFC disbursement 326,456,184 -
Mark-up expense 31,895,072 22,913,777
JS Principal Secure Fund
Redeemable capital - TFC VI disbursement - 19,265,000
Redeemable capital - PPTFC disbursement 33,480,000 -
Mark-up expense 3,270,991 2,349,823
JS Pension Savings Fund
Redeemable capital - TFC V repayments (5,405,770) -
Redeemable capital - TFC VI disbursement - 3,850,000
Mark-up expense - 2,040,978
JS Income Fund
Redeemable capital - TFC II repayments (9,594,455) -
Redeemable capital - TFC V repayments (27,028,851) -
Redeemable capital - TFC VI disbursement - 24,135,000
Mark-up expense 7,800,266 12,610,289
JS Growth Fund
Redeemable capital - TFC II repayments (21,179,813) -
Redeemable capital - TFC VI disbursement - 10,750,000
Redeemable capital - PPTFC disbursement 64,200,000 -
Mark-up expense 9,076,595 9,811,780
Annual Report 2013 135

Notes to the Consolidated Financial Statementsfor the year ended 30 June 2013
42.1.2 Post employment benefit plans
Contribution to employees Provident Fund Trust 110,692,736 100,072,478
Interest payable on employees Provident Fund Trust 18,689,139 20,193,978
42.1.3 Key management personnel
42.2 Balances with related parties
42.2.1 Other related parties
Agritech Limited
Investment in ordinary shares 700,000,000 -
Redeemable capital 266,074,508 -
Mark-up receivable 16,600,910 -
JS Bank Limited
Redeemable capital - TFC IV 65,033,776 149,880,000
Short term borrowing 336,026,713 339,209,038
Mark-up payable 16,806,556 104,428,510
Cash and bank - current account 7,491,793 12,502
JS Value Fund Limited
Redeemable capital - TFC II 19,523,025 44,938,800
Redeemable capital - TFC VI 12,900,000 12,900,000
Mark-up payable 4,846,631 1,480,038
Unit Trust of Pakistan
Redeemable capital - TFC V 31,980,766 75,000,000
Redeemable capital - TFC VI 19,265,000 19,265,000
Mark-up payable 5,993,891 1,640,973
JS Large Cap Fund
Redeemable capital - PPTFCs 83,160,000 -
Preference shares - 65,126,320
Mark-up / preference dividend payable 1,829,520 16,277,054
JS Global Capital Limited
Redeemable capital - PPTFCs 326,456,184 -
Mark-up / preference dividend payable 7,182,036 63,530,802
Preference shares - 256,019,860
Advisory fee payable 4,000,000 4,000,000
JS Principal Secure Fund
Redeemable capital - TFC VI - 19,265,000
Redeemable capital - PPTFC 33,480,000 -
Preference shares - 26,255,000
Mark-up / preference dividend payable 736,560 6,516,834
The remuneration paid to chief executive, directors, executives and key management personnel in terms of their
employment is disclosed in note 47 to the financial statements.
2013 2012
Rupees Rupees
2013 2012
Rupees Rupees
Azgard Nine Limited136

Notes to the Consolidated Financial Statementsfor the year ended 30 June 2013
JS Pension Savings Fund
Redeemable capital - TFC V - 15,000,000
Redeemable capital - TFC VI 3,850,000 3,850,000
Mark-up payable - 492,292
JS Income Fund
Redeemable capital - TFC II 7,369,942 16,964,397
Redeemable capital - TFC V 47,971,149 75,000,000
Redeemable capital - TFC VI 24,135,000 24,135,000
Mark-up payable 10,820,439 3,020,173
JS Growth Fund
Redeemable capital - TFC II 16,269,187 37,449,000
Redeemable capital - TFC VI 10,750,000 10,750,000
Redeemable capital - PPTFC disbursement 64,200,000 -
Preference shares - 50,300,000
Mark-up / preference dividend payable 5,451,260 13,776,643
42.2.3 Post employment benefit plans
Payable to employees Provident Fund Trust 83,897,625 96,248,979
42.2.4 Key management personnel
Short term employee benefits payable 22,868,033 20,093,705
2013 2012
Rupees Rupees
43 Financial risk management
The Group has exposure to the following risks arising from financial instruments:
- credit risk
- liquidity risk
- market risk
43.1 Credit risk
43.1.1 Exposure to credit risk
The carrying amount of financial assets represents the maximum credit exposure. The maximum exposure to credit risk as at
the end of the reporting period was as follows:
This note presents information about the Group’s exposure to each of the above risks, the Group’s objectives, policies and processes for
measuring and managing risk, and the Group’s management of capital.
The Board of Directors ("the Board") has overall responsibility for establishment and oversight of the Group's risk management framework.
The Board of Directors has developed a risk policy that sets out fundamentals of risk management framework.
The Group's risk management policies are established to identify and analyze the risks faced by the Group, to set appropriate risk limits
and controls and to monitor risks and adherence to limits. Risk management policies and systems are reviewed regularly to reflect
changes in market conditions and Group's activities.
Credit risk is the risk of financial loss to the Group if a customer or a counterparty to a financial instrument fails to meet its
contractual obligations, and arises principally from the Group's receivables from customers and investment in debt securities.
Annual Report 2013 137

Notes to the Consolidated Financial Statementsfor the year ended 30 June 2013
2013 2012
Note Rupees Rupees
Available for sale financial assets
Long term investments 20 266,074,508 -
Loans and receivables
Long term deposit - utility companies and regulatory authorities 21 22,175,676 36,442,356
Long term deposit - financial institutions 21 6,993,740 3,046,600
Trade receivables 24 2,691,813,712 2,875,386,379
Advance to employees - against salaries 25 14,561,020 13,614,858
Security deposits 25 5,967,336 5,435,136
Margin deposits 25 34,238,755 34,238,755
Insurance claims 25 10,105,655 1,160,685
Cash at banks 29 140,817,059 309,482,843
1,617,662,997 3,278,807,612
1,883,737,505 3,278,807,612
43.1.2 Concentration of credit risk
2013 2012
Rupees Rupees
Customers 1,382,803,756 2,875,386,379
Banking companies and financial institutions 188,016,890 352,203,334
Others 312,916,859 51,217,899
1,883,737,505 3,278,807,612
43.1.3 Credit quality and impairment
43.1.3(a) Counterparties with external credit ratings
The Group identifies concentrations of credit risk by reference to type of counter party. Maximum exposure to credit risk by
type of counterparty is as follows:
Credit quality of financial assets is assessed by reference to external credit ratings, where available, or to historical
information about counterparty default rates. All counterparties, with the exception of customers, have external credit ratings
determined by various credit rating agencies. Credit quality of customers is assessed by reference to historical defaults rates
and present ages.
These include banking companies and financial institutions, which are counterparties to cash deposits, security deposits,
margin deposits, insurance claims and cash flow hedges, and issuers of debt securities which are counterparties to
investment in debt securities and accrued return thereon. These counterparties have reasonably high credit ratings as
determined by various credit rating agencies. Due to long standing business relationships with these counterparties and
considering their strong financial standing, management does not expect non-performance by these counterparties on their
obligations to the Group. Following are the credit ratings of counterparties of ANL with external credit ratings:
Azgard Nine Limited138

Notes to the Consolidated Financial Statementsfor the year ended 30 June 2013
43.1.3(b) Counterparties without external credit ratings
These include customers which are counter parties to trade receivables. The Group is exposed to credit risk in respect of trade
receivables. The analysis of ages of trade receivables of the Group as at the reporting date is as follows:
Bank
Allied Bank Limited
Albaraka Bank (Pakistan) Limited
Askari Bank Limited
Barclays Bank Pakistan
Bank Al-Habib Limited
Bank Alfalah Limited
Bank Islami Pakistan Limited
Faysal Bank Limited
Habib Bank Limited
Habib Metropolitan Bank Limited
HSBC Bank Middle East Limited
JS Bank Limited
KASB Bank Limited
MCB Bank Limited
Meezan Bank Limited
National Bank of Pakistan
NIB Bank Limited
Silk Bank Limited
Soneri Bank Limited
Standard Chartered Bank (Pakistan)
Limited
Summit Bank Limited
The Bank of Punjab
United Bank Limited
Bank of Khyber
2012
25,288
11,801,400
133,619,886
1,435,825
57,442,072
43,613
478,772
36,375,070
249,516
3,251
855
12,502
1,188,958
34,227,800
13,042
2,583,827
557,347
1,252
14,825
3,019,632
3,539,224
426,260
1,364,666
-
288,424,883
Rupees
2013
25,288
1,093,207
40,478
-
88,637,193
519,002
478,771
17,885,645
416,303
2,243
22,343
7,491,793
595,206
731,491
5,568
18,829
1,064,159
1,019,524
14,825
18,492
1,158,441
424,097
731,514
7,783,631
130,178,043
Rupees
Rating agency
PACRA
PACRA
PACRA
Moody's
PACRA
PACRA
PACRA
PACRA
JCR-VIS
PACRA
Fitch
PACRA
PACRA
PACRA
JCR-VIS
JCR-VIS
PACRA
JCR-VIS
PACRA
PACRA
JCR-VIS
PACRA
JCR-VIS
PACRA
Rating
Long term
AA+
A
AA
A2
AA+
AA
A
AA
AA+
AA+
AA-
A+
BBB
AA+
AA
AAA
AA-
A-
AA-
AAA
A-
AA-
AA+
A-
Rating
Short term
A1
A1
A1
P-1
A1
A1
A1
A1
A-1
A1
F1
A1
A3
A1
A-1
A-1
A1
A-2
A1
A1
A-2
A1
A-1
A2
Continuing operations
Not yet due
Past due by 0 to 6 months
Past due by 6 to 12 months
Past due by more than one year
Discontinued operations
Gross carrying
amount
Accumulated
impairment
Gross carrying
amount
Accumulated
impairment
647,197,809 - 1,217,711,630 -
616,498,291 - 467,036,689 -
386,718,511 - 870,360,808 -
1,540,232,223 433,362,891 550,106,977 279,046,298
3,190,646,834 433,362,891 3,105,216,104 279,046,298
- - 56,473,210 43,733,372
3,190,646,834 433,362,891 3,161,689,314 322,779,670
Rupees Rupees RupeesRupees
2013 2012
Annual Report 2013 139

Notes to the Consolidated Financial Statementsfor the year ended 30 June 2013
The Group's five significant customers account for Rs. 607 million (2012: Rs. 459 million) of trade receivables as at the
reporting date, apart from which, exposure to any single customer does not exceed 3% (2012: 3%) of trade receivables as at
the reporting date. Further, trade receivables amounting to Rs. 1,808 million (2012: Rs. 230 million) secured through
confirmed letters of credit and thus do not carry any significant credit risk.
The Board has formulated a policy to create provision allowance for trade receivables on a time based criteria. Provision
allowance on closing trade receivable balances has adequately been created in accordance with the approved policy.
Further, based on historical default rates, the Group believes that no impairment allowance other than already provided is
necessary in respect of trade receivables not past due or those past due by less than one year, since these relate to customers
who have had good payment record with the Group.
43.1.4 Collateral held
43.1.5 Credit risk management
43.2 Liquidity risk
43.2.1 Exposure to liquidity risk
43.2.1(a) Contractual maturities of financial liabilities, including estimated interest payments
The Group does not hold any collateral to secure its financial assets with the exception of trade receivables, which are
partially secured through confirmed letters of credit and investment in debt securities which are secured by charge over
issuer's operating assets.
As mentioned in note 43.1.3(b) to the financial statements, the Group's financial assets do not carry significant credit risk, with
the exception of trade receivables, which are exposed to losses arising from any non-performance by counterparties. In
respect of trade receivables, the Group manages credit risk by limiting significant exposure to any single customer. Formal
policies and procedures of credit management and administration of receivables are established and executed. In
monitoring customer credit risk, the ageing profile of total receivables and individually significant balances, along with
collection activities are reviewed on a regular basis. High risk customers are identified and restrictions are placed on future
trading, including suspending future shipments and administering dispatches on a prepayment basis or confirmed letters of
credit.
Liquidity risk is the risk that the Group will encounter difficulty in meeting the obligations associated with its financial
liabilities that are settled by delivering cash or another financial asset and the Group will not be able to meet its financial
obligations as they fall due.
The following are the remaining contractual maturities at the reporting date. The amounts are grossed and undiscounted,
and include estimated interest payments and exclude the impact of netting agreements.
Azgard Nine Limited140

Notes to the Consolidated Financial Statementsfor the year ended 30 June 2013
Note
Non-derivative financial liabilities
Redeemable capital 9
Long term finances 10
Liabilities against assets subject
to finance lease 11
Preference shares 12
Short term borrowings 13
Trade creditors 14
Bills payable 14
Accrued liabilities 14
Payable to Provident Fund Trust 14
Workers' Profit Participation Fund 14
Other payables 14
Mark-up accrued on borrowings 15
Dividend payable 16
Derivative financial liabilities
Cross currency swaps 13
Carryingamount
Contractualcash flows
One yearor less
One to threeyears
More thanthree years
8,038,939,061 9,228,296,765 2,844,243,569 2,136,201,971 4,247,851,225
3,436,652,874 3,921,163,422 2,058,623,610 528,022,039 1,334,517,773
36,436,705 44,819,982 17,050,310 27,769,672 -
574,518,935 574,518,935 574,518,935 - -
8,433,954,491 8,515,251,826 8,515,251,826 - -
1,590,268,928 1,499,989,313 1,499,989,313 - -
1,755,448,679 1,755,448,679 1,755,448,679 - -
568,729,225 519,327,523 519,327,523 - -
96,248,979 96,248,979 96,248,979 - -
47,015,366 47,015,366 47,015,366 - -
98,584,330 10,152,164 10,152,164 - -
1,357,356,641 1,425,935,847 1,425,935,847 - -
32,729,078 32,729,078 32,729,078 - -
26,066,883,292 27,670,897,879 19,396,535,199 2,691,993,682 5,582,368,998
7,424,080 7,623,558 7,623,558 - -
26,074,307,372 27,678,521,437 19,404,158,757 2,691,993,682
The gross cash flows disclosed in the above table represent the contractual undiscounted cash flows relating to derivative
financial liabilities held for risk management purposes and which are not usually closed out before contractual maturity. The
disclosure shows net cash flow amounts for derivatives that are net cash-settled and gross cash flow amounts for derivatives
that have simultaneous gross cash settlement.
5,582,368,998
2012
RupeesRupeesRupeesRupeesRupees
2013
More thanthree years
768,102,083
752,379,912
-
-
-
-
-
-
-
-
-
-
-
1,520,481,995
-
1,520,481,995
Rupees
One to threeyears
5,450,941,948
1,117,082,011
11,824,078
-
-
-
-
-
-
-
-
-
-
6,579,848,037
-
6,579,848,037
Rupees
One yearor less
853,664,443
207,207,807
27,223,579
148,367,255
5,494,591,302
1,865,832,652
385,516,037
420,242,718
83,897,625
55,243,056
71,169,229
1,501,702,254
13,415,572
11,128,073,529
-
11,128,073,529
Rupees
Contractualcash flows
7,072,708,474
2,076,669,730
39,047,657
148,367,255
5,494,591,302
1,865,832,652
385,516,037
420,242,718
83,897,625
55,243,056
71,169,229
1,501,702,254
13,415,572
19,228,403,561
-
19,228,403,561
Rupees
Carryingamount
6,024,844,185
1,773,447,469
32,586,801
148,367,255
5,024,533,069
1,865,832,652
385,516,037
420,242,718
83,897,625
55,243,056
71,169,229
1,501,702,254
13,415,572
17,400,797,922
-
17,400,797,922
Rupees
Annual Report 2013 141

Notes to the Consolidated Financial Statementsfor the year ended 30 June 2013
Nature of liability
Preference shares
Dividend on preference shares
Long term finances
Redeemable capital
Short term borrowings
Bills payables
43.3 Market risk
43.3.1 Currency risk
As explained in note 2.2, ANL is discussing with the providers of debt for a second round of restructuring and debt re-
profiling. For the said purpose, the management is considering to negotiate with the debt financiers for waiver of over due
interest / mark-up accured, and disposal of its low performing assets for settlement of overdue principal of its long term
debts.
Market risk is the risk that changes in market prices, such as foreign exchange rates, interest rates and equity prices will affect
the Group's income or the value of its holdings of financial instruments. The objective of market risk management is to
manage and control market risk exposures within acceptable parameters, while optimizing return.
The Group is exposed to currency risk to the extent that there is a mismatch between the currencies in which sales, purchases
and borrowings are denominated and the respective functional currency of the Group. The functional currency of the Group
is Pak Rupee. The currencies in which these transactions are primarily denominated are Emirate Dirham, Euros, US dollars,
Sterling and Swiss franc.
43.2.2 Liquidity risk management
The Group's approach to managing liquidity risk is to ensure, as far as possible, that it will always have sufficient liquidity to
meet its liabilities when due, under both normal and stressed conditions, without incurring unacceptable losses or risking
damage to the Group's reputation.
The Group is facing a temporary liquidity shortfall due to the facts disclosed in note 2.2 as a result of which it was unable to
meet its obligations in respect of various debt finances. The details are as follows:
Total
148,367,255
9,413,535
223,527,738
542,153,515
706,131,191
315,771,124
1,945,364,358
Rupees
Preference dividend /
interest / mark-up
-
9,413,535
217,527,738
542,153,515
473,529,475
41,309,367
1,283,933,630
Rupees
Principal
148,367,255
-
6,000,000
-
232,601,716
274,461,757
661,430,728
Rupees
Azgard Nine Limited142

Notes to the Consolidated Financial Statementsfor the year ended 30 June 2013
43.3.1(a) Exposure to currency risk
The summary quantitative data about the Group's exposure to currency risk as reported to the management of the Group is
as follows:
Assets
Trade receivables
Cash and bank balances
Liabilities
Long term finances
Short term borrowings
Mark-up accrued on borrowings
Trade creditors
Bills payable
Gross balance sheet exposure
Fair value of hedging instruments
Net balance sheet exposure
Assets
Trade receivables
Cash and bank balances
Liabilities
Long term finances
Short term borrowings
Mark-up accrued on borrowings
Trade creditors
Bills payable
Gross balance sheet exposure
Fair value of hedging instruments
Net balance sheet exposure
USD GBP
880,533,636 175,447,134
112,107 -
880,645,743 175,447,134
- -
(441,391,310) -
(9,758,124) -
(53,194,399) (58,728)
(203,843,804) -
(708,187,637) (58,728)
172,458,106 175,388,406
RupeesRupees
2012
2013
USD
946,027,770
117,581
946,145,351
-
(466,448,835)
(3,549,761)
(33,894,448)
(124,275,580)
(628,168,624)
317,976,727
Rupees
EUR
1,304,739,358
313,405
1,305,052,763
(1,422,000,000)
(38,621,304)
(238,107,307)
(39,293,136)
(39,773,458)
(1,777,795,205)
(472,742,442)
RupeesRupees
EUR
1,380,856,891
341,466
1,381,198,357
(907,054,269)
-
(27,000,774)
(38,980,495)
(5,695,688)
(978,731,226)
402,467,131
Rupees
CHF
-
-
-
-
-
-
-
-
-
-
Rupees
CHF
-
-
-
-
-
-
-
(722,367)
(722,367)
(722,367)
Rupees
AED
-
-
-
-
-
-
-
-
-
-
Rupees
AED
-
-
-
-
-
-
-
(32,786)
(32,786)
(32,786)
GBP
92,069,029
-
92,069,029
-
-
-
-
-
-
92,069,029
Rupees
Total
2,418,953,690
459,047
2,419,412,737
(907,054,269)
(466,448,835)
(30,550,535)
(72,874,943)
(129,971,268)
(1,606,899,850)
812,512,887
-
812,512,887
Rupees
Total
2,360,720,128
425,512
2,361,145,640
(1,422,000,000)
(480,012,614)
(247,865,431)
(92,546,263)
(244,372,415)
(2,486,796,723)
(125,651,083)
(7,424,080)
(133,075,163)
Rupees
Annual Report 2013 143

Notes to the Consolidated Financial Statementsfor the year ended 30 June 2013
43.3.1(b) Exchange rates applied during the year
The following significant exchange rates have been applied during the year:
43.3.1(d) Currency risk management
43.3.2 Interest rate risk
43.3.1(c) Sensitivity analysis
A reasonably possible strengthening / (weakening) of 10% in Pak Rupee against the following currencies would have affected
the measurement of financial instruments denominated in foreign currency and affected equity and profit or loss by the
amounts shown below. The analysis assumes that all other variables, in particular interest rates, remain constant and ignores
any impact of forecast sales and purchases.
The Group manages its exposure to currency risk through continuous monitoring of expected / forecast committed and non-
committed foreign currency payments and receipts. Reports on forecast foreign currency transactions, receipts and
payments are prepared on monthly bases, exposure to currency risk is measured and appropriate steps are taken to ensure
that such exposure is minimized while optimizing return. This includes matching of foreign currency liabilities / payments to
assets / receipts, using source inputs in foreign currency and arranging cross currency swaps to hedge non-functional
currency debt. The Group maintains foreign currency working capital lines in order to finance production of exportable
goods. Proceeds from exports are used to repay / settle / rollover the Group's obligations under these working capital lines
which substantially reduces exposure to currency risk in respect of such liabilities. Balances in foreign currency are also
maintained in current and saving / deposits accounts with banking companies. The Group also occasionally uses currency
options to cover any significant unfavorable rate scenarios.
Interest rate risk is the risk that fair values or future cash flows of a financial instrument will fluctuate because of changes in
interest rates.
43.3.2(a) Interest / mark-up bearing financial instruments
The effective interest / mark-up rates for interest / mark-up bearing financial instruments are mentioned in relevant notes to
the financial statements. The Group's interest / mark-up bearing financial instruments as at the reporting date are as follows:
EUR
USD
GBP
CHF
AED
128.85
98.60
150.57
104.49
26.85
129.11
98.80
150.87
104.71
26.90
125.18
96.75
151.76
102.80
26.34
118.25
94.00
146.76
98.41
25.59
118.50
94.20
147.07
98.62
25.65
119.56
89.35
141.53
99.20
24.35
Average rate Average rate
Buying Selling for the year Buying Selling for the year
2013 2012
Reporting date spot rate
RupeesRupeesRupees RupeesRupeesRupees
Reporting date spot rate
2013 2012
Profit Profit
Rupees Rupees
AED
EUR
USD
GBP
CHF
- (3,279)
40,246,713 (47,274,244)
31,797,673 17,245,811
9,206,903 17,538,841
- (72,237)
81,251,289 (12,565,108)
Azgard Nine Limited144

Notes to the Consolidated Financial Statementsfor the year ended 30 June 2013
43.3.2(b) Fair value sensitivity analysis for fixed rate instruments and fair value hedges
43.3.2(c) Cash flow sensitivity analysis for variable rate instruments and cash flow hedges
43.3.2(d) Interest rate risk management
43.3.3 Price risk
The Group does not account for fixed-rate financial assets or financial liabilities at fair value through profit or loss. Therefore a
change in interest rates at the reporting date would not effect profit or loss.
A reasonably possible change of 100 basis points in interest rates at the reporting date would have increased / (decreased)
equity and profit by amounts shown below. The analysis assumes that all other variables, in particular foreign exchange rates,
remain constant.
The Group manages interest rate risk by analyzing its interest rate exposure on a dynamic basis. Cash flow interest rate risk is
managed by simulating various scenarios taking into consideration refinancing, renewal of existing positions, alternative
financing and hedging. Based on these scenarios, the Group calculates impact on profit after taxation and equity of defined
interest rate shift, mostly 100 basis points. Cross currency swaps are also arranged to transfer exposure to more stable
markets. Fair value interest rate risk are managed by arranging fixed to variable rate swaps.
Price risk represents the risk that the fair value or future cash flows of financial instrument will fluctuate because of changes in
market prices, other than those arising from interest rate risk or currency risk, whether those changes are caused by factors
specific to the individual financial instrument or its issuer, or factors affecting all similar financial instruments. The Group's
exposure to price risk is insignificant.
Non-derivative financial instruments
Fixed rate instruments
Variable rate instruments
Derivative financial instruments
Cash flow hedges
Financial asset Financial liability Financial asset Financial liability
134,304,708 717,783,280
- 18,482,761,810
22,787,827
266,074,508
-
831,164,120
9,478,601,377
- - 7,424,080
2013 2012
RupeesRupees RupeesRupees
Increase of 100 basis points
Variable rate instruments
Cash flow hedges
Cash flow sensitivity - net
Decrease of 100 basis points
Variable rate instruments
Cash flow hedges
Cash flow sensitivity - net
Equity Profit
- (184,827,618)
(74,241) -
(74,241) (184,827,618)
- 184,827,618
74,241 -
74,241 184,827,618
2012
RupeesRupees
Equity Profit
- (92,125,269)
- -
- (92,125,269)
- 92,125,269
- -
- 92,125,269
2013
RupeesRupees
Annual Report 2013 145

Notes to the Consolidated Financial Statementsfor the year ended 30 June 2013
43.4 Fair values
Fair value versus carrying amounts
The fair values of financial assets and liabilities, together with the carrying amounts shown in the balance sheet, are as
follows:
Carrying values Fair values Carrying values
Note
Available for sale
Long term investments 20 266,105,729 266,105,729 -
Short term investments 27 700,000,000 700,000,000 -
966,105,729 966,105,729 -
Carrying values Fair values Carrying values
Note
Loans and receivables
Long term deposits 21 29,169,416 29,169,416 39,488,956
Trade receivables 24 2,757,283,943 2,757,283,943 2,826,169,806
Advances to employees 25 34,028,925 34,028,925 33,673,181
Security deposits 25 5,967,336 5,967,336 5,435,136
Margin deposits 25 34,238,755 34,238,755 34,238,755
Letters of credit 25 25,964,274 25,964,274 48,712,485
Insurance claims 25 10,105,655 10,105,655 1,160,685
Other receivables 25 7,745,175 7,745,175 10,288,518
Due from Agritech Limited 26 16,600,910 16,600,910 -
Cash and bank balances 29 143,040,613 143,040,613 310,989,124
3,064,145,002 3,064,145,002 3,310,156,646
Carrying values Fair values Carrying values
Financial liabilities at amortized cost
Redeemable capital 9 6,024,844,185 6,024,844,185 8,038,939,061
Long term finances 10 1,773,447,469 1,773,447,469 3,436,652,874
Liabilities against assets subject to finance lease 11 32,586,801 32,586,801 36,436,705
Preference shares 12 148,367,255 148,367,255 574,518,935
Short term borrowings 13 5,024,533,069 5,024,533,069 8,433,954,491
Trade creditors 14 1,865,832,652 1,865,832,652 1,590,268,928
Bills payable 14 385,516,037 385,516,037 1,755,448,679
Accrued liabilities 14 420,242,718 420,242,718 568,729,225
Payable to Provident Fund Trust 14 83,897,625 83,897,625 96,248,979
Workers' Profit Participation Fund 14 55,243,056 55,243,056 47,015,366
Other payables 14 71,169,229 71,169,229 98,584,330
Interest / mark-up accrued on borrowings 15 1,501,702,254 1,501,702,254 1,357,356,641
Dividend payable 16 13,415,572 13,415,572 32,729,078
17,400,797,922 17,400,797,922 26,066,883,292
Derivatives
Cross currency swaps 14 - - 7,424,080
RupeesRupees Rupees
Rupees
Rupees
2013 2012
2013 2012
RupeesRupees
2013 2012
RupeesRupees
Fair values
-
-
-
Fair values
39,488,956
2,826,169,806
33,673,181
5,435,136
34,238,755
48,712,485
1,160,685
10,288,518
-
310,989,124
3,310,156,646
Fair values
8,038,939,061
3,436,652,874
36,436,705
574,518,935
8,433,954,491
1,590,268,928
1,755,448,679
568,729,225
96,248,979
47,015,366
98,584,330
1,357,356,641
32,729,078
26,066,883,292
7,424,080
Rupees
Rupees
Rupees
Azgard Nine Limited146

Notes to the Consolidated Financial Statementsfor the year ended 30 June 2013
The basis for determining fair values is as follows:
Interest rates used for determining fair value
Fair value hierarchy
Level 1
Level 2
Level 3
43.4.1 Determination of fair values
Long term investments - level 1
Short term investment - level 3 - Agritech Limited
: inputs for the asset or liability that are not based on observable market data (unobservable inputs).
The interest rates used to discount estimated cash flows, when applicable, are based on the government yield curve at the
reporting date plus an adequate credit spread. For instruments carried at amortized cost, since the majority of the interest
bearing investments are variable rate based instruments, there is no difference in carrying amount and the fair value. Further,
for fixed rate instruments, since there is no significant difference in market rate and the rate of instrument and therefore
most of the fixed rate instruments are short term in nature, fair value significantly approximates to carrying value.
The table below analyses financial instruments carried at fair value, by valuation method. The different levels have been
defined as follows:
: quoted prices (unadjusted) in active markets for identical assets or liabilities
: inputs other than quoted prices included within Level 1 that are observable for the asset or liability, either
directly (i.e., as prices) or indirectly (i.e., derived from prices)
The carrying value of financial assets and liabilities reflected in financial statements approximate their respective fair values.
A number of the Group’s accounting policies and disclosures require the determination of fair value, for both financial and
non–financial assets and liabilities. Fair values have been determined for measurement and / or disclosure purposes based
on the following methods.
The fair value of available for sale investment is determined by reference to their quoted closing repurchase price at the
reporting date.
Investment in AGL is valued at Rs. 35.00 per share on the basis of price agreed in the Agreement.
30 June 2013
Available for sale investments
Long term investments
Short term investment - Agritech Limited
30 June 2012
Available for sale investments
Long term investments
Level 3
-
700,000,000
700,000,000
-
Rupees
Level 2
-
-
-
-
Rupees
Level 1
31,221
-
31,221
14,831
Rupees
Annual Report 2013 147

Notes to the Consolidated Financial Statementsfor the year ended 30 June 2013
45 Restriction on title and assets pledged as security
The Group monitors capital using the gearing ratio which is debt divided by total capital employed. Debt comprises, redeemable capital,
long term finances and liabilities against assets subject to finances leases, including current maturity. Total capital employed includes
total equity as shown in the balance sheet plus debt.
The Group's strategy is to maintain an optimal capital structure in order to minimize cost of capital. Gearing ratio of the Group as at the
reporting date is as follows:
There were no changes in the Group's approach to capital management during the year. However, defaults / overdue relating to financial
obligations of the Group, as referred to in note 43.2.2 to the financial statements, may cause changes in the Group's approach to capital
management. The Group is not subject to externally imposed capital requirements, except those, related to maintenance of debt
covenants, commonly imposed by the providers of debt finance.
Pledge of equity securities amounting to Rs. 700.000 million (2012: Rs. 1,322.777 million) relates to facilities availed by AGL.
44 Capital management
The Group's policy is to maintain a strong capital base so as to maintain investor, creditor and market confidence and to sustain future
development of the business. The Board of Directors monitors the return on capital and level of dividends to ordinary shareholders.
The Group seeks to keep a balance between the higher return that might be possible with higher level of borrowings and the advantages
and security afforded by a sound capital position.
43.4.2 Significance of fair value accounting estimates to the Group's financial position and performance
The Group uses fair value accounting for its financial instruments in determining its overall financial position and in making
decisions about individual financial instruments. This approach reflects the judgment of the Group about the present value of
expected future cash flows relating to an instrument. The management believes that fair value information is relevant to
many decisions made by users of financial statements as it permits comparison of financial instruments having substantially
the same economic characteristics and provides neutral basis for assessing the management's stewardship by indicating
effects of its decisions to acquire, sell or hold financial assets and to incur, maintain or discharge financial liabilities.
Mortgages and charges
Hypothecation of all present and future assets and properties
Mortgage over land and building
Pledge
Raw material
Finished goods
Investments in equity securities
Investments in debt securities
27,000,000,000 32,416,666,666
27,000,000,000 32,416,666,666
757,541,963 1,181,795,027
175,804,000 464,889,150
700,000,000 6,378,291,871
126,080,519 126,080,519
Total debt
Total equity
Total capital employed
Gearing
Unit 2013 2012
Rupees 7,830,878,455 11,512,028,640
Rupees 4,413,201,129 10,415,715,701
12,244,079,584 21,927,744,341
% age 63.96% 52.50%
2013 2012
Rupees Rupees
Azgard Nine Limited148

Notes to the Consolidated Financial Statementsfor the year ended 30 June 2013
46 Segment information
46.1
Segment Product
Textile and apparel Denim and other textile and products
Fertilizer Nitrogenous and phosphatic fertilizers
46.2 Information about reportable segments
The Group has two reportable segments, as described below, which are the Group’s strategic divisions. The strategic divisions offer
different products and services, and are managed separately because they require different technology and marketing strategies.
Information reported to the Group's chief operating decision maker for the purpose of resource allocation and assessment of segment
performance is focused on type of goods supplied. The Group's reportable segments are therefore as follows:
The inter-segment transactions related to other material items are insignificant.
The Group during the year disposed off its fertilizer segment which has been presented as discontuned operations.
46.2.1 Segment revenues and results
External revenues
Inter-segment revenues
Reportable segment revenue
Reportable segment loss before tax
46.2.2 Other segment information
Interest revenue
Interest expense
Depreciation
Amortization
14,439,185,602 11,907,437,305 953,905,398 5,697,064,161 15,393,091,000 17,604,501,466
- - - - - -
14,439,185,602 11,907,437,305 953,905,398 5,697,064,161 15,393,091,000 17,604,501,466
(2,949,492,078) (6,192,837,091) (1,343,629,143) (1,853,793,410) (4,293,121,221) (8,046,630,501)
23,848,467 22,106,895 22,953,184 66,573,370 46,801,651 88,680,265
(1,339,581,884) (2,993,816,382) (1,119,296,773) (3,501,085,623) (2,458,878,657) (6,494,902,005)
(516,907,872) (540,656,994) (296,262,445) (811,383,356) (813,170,317) (1,352,040,350)
(2,604,817) (2,682,411) (4,069,196) (1,345,341) (6,674,013) (4,027,752)
2013 2012
Un-audited Audited
TotalFertilizerTextile and apparel
2012 2013 2012
Rupees Rupees Rupees Rupees Rupees Rupees
2013
Annual Report 2013 149
46.2.3 Segment assets and liabilities
Reportable segment assets
Capital expenditure
Property, plant and equipment
Intangible assets
Reportable segment liabilities
20,953,014,163 21,597,606,672 - 44,607,317,575 20,953,014,163 66,204,924,247
83,117,818 107,373,262 - 12,841,975,789 83,117,818 12,949,349,051
- - - 32,288,176 - 32,288,176
83,117,818 107,373,262 - 12,874,263,965 83,117,818 12,981,637,227
16,539,813,034 24,960,265,276 - 30,828,943,270 16,539,813,034 55,789,208,546
2013 2012
Un-audited Audited
TotalFertilizerTextile and apparel
2012 2013 2012
Rupees Rupees Rupees Rupees Rupees Rupees
2013

Notes to the Consolidated Financial Statementsfor the year ended 30 June 2013
46.3
2013 2012
Rupees Rupees
15,393,091,000
-
(953,905,398)
14,439,185,602
(2,345,452,756)
-
(741,578,839)
(3,087,031,595)
20,953,014,163
-
-
20,953,014,163
46.3.1
46.3.2
46.3.3
46.3.4
16,539,813,034
-
-
un-audited / audited
un-audited / audited
un-audited / audited
un-audited / audited
Revenues
Total revenue for reportable segments
Elimination of inter-segment revenue
Elimination of discontinued operations -
Consolidated revenue
Profit or loss
Total loss for reportable segments
Elimination of inter-segment profits
Elimination of discontinued operations -
Consolidated loss
Assets
Total assets for reportable segments
Elimination of inter-segment assets
Elimination of discontinued operations -
Consolidated assets
Liabilities
Total liabilities for reportable segments
Elimination of inter-segment liabilities
Elimination of discontinued operations -
Consolidated liabilities 16,539,813,034
Reconciliations of reportable segment revenues, profit or loss, assets and liabilities, and other material items
17,604,501,466
-
(5,697,064,161)
11,907,437,305
(7,955,383,680)
-
1,646,592,181
(6,308,791,499)
66,204,924,247
-
(44,607,317,575)
21,597,606,672
55,789,208,546
-
(30,828,943,270)
24,960,265,276
Azgard Nine Limited150
46.3.5 Other material items
46.4 Geographical information
In presenting information on the basis of geography, segment revenue is based on the geographical location of customers
and segment assets are based on the geographical location of the assets.
The inter-segment transactions related to other material items are insignificant.
The textile and apparal segments are managed on a worldwide basis, but operate manufacturing facilities and sales offices
in Pakistan and Italy.

Notes to the Consolidated Financial Statementsfor the year ended 30 June 2013
2013 2012
Rupees Rupees
46.4.1 Revenue
Pakistan
Continuing operations 13,423,731,576 11,043,702,419
Discontinued operation - un-audited / audited 953,905,398 5,697,064,161
Europe
Italy - continuing operations 1,015,454,026 863,734,558
15,393,091,000 17,604,501,138
46.4.2 Non-current assets
Pakistan
Continuing operations 13,937,245,127 15,194,672,724
Discontinued operation - un-audited / audited - 40,779,451,388
Europe
Italy - continuing operations 24,684,874 722,894,650
13,961,930,001 56,697,018,762
47 Remuneration of Chief Executive, Directors and Executives
The aggregate amount charged to profit or loss in respect of chief executive, directors and executives on account of managerial
remuneration, allowances and perquisites, post employment benefits and the number of such directors and executives is as follows:
Annual Report 2013 151
Managerial remuneration
Medical
Utility and house rent
Post employment benefits
Number of persons
2013
Directors
178,249,855
27,968,765
89,769,121
10,767,689
306,755,430
138
Executives
Rupees
Non-executive
-
-
-
-
-
3
Rupees
Executive
14,347,273
1,434,723
7,681,662
1,219,518
24,683,176
3
Rupees
Chief Executive
15,999,996
1,599,996
6,400,008
1,359,996
25,359,996
1
Rupees

Notes to the Consolidated Financial Statementsfor the year ended 30 June 2013
47.1
Unit 2013 2012
48 Plant capacity and actual production
Spinning
Number of rotors installed No. 2,416 2,416
Plant capacity on the basis of utilization converted
into 6.5s count Kgs 10,257,997 8,722,579
Actual production converted into 6.5s count Kgs 9,805,510 6,844,047
Number of spindles installed No. 54,888 54,408
Plant capacity on the basis of utilization converted
into 20s count Kgs 7,583,141 7,085,211
Actual production converted into 20s count Kgs 7,214,238 6,444,272
Weaving
Number of looms installed No. 230 230
Annual capacity on the basis of utilization converted
into 38 picks Mtrs. 49,022,637 41,382,945
Actual production converted into 38 picks Mtrs. 26,880,801 21,018,374
Garments
Number of stitching machines installed No. 2,229 2,229
Annual capacity on the basis of utilization Pcs. 7,650,000 7,046,464
Actual production Pcs. 4,293,374 5,903,315
The chief executive is provided with free use of Company maintained car.
Chief Executive Executive Non-executive
Managerial remuneration 15,999,996 14,458,860 - 328,107,038
Medical 1,599,996 1,445,880 - 39,973,109
Utility and house rent 6,400,008 5,990,564 - 77,118,185
Post employment benefits 1,359,996 1,229,004 - 181,374,753
25,359,996 23,124,308 - 626,573,085
Number of persons 1 4 2 236
2012
Rupees RupeesRupeesRupees
Directors
Executives
Azgard Nine Limited152
49 Provident Fund Trust
Unit 2013 2012
Size of fund - total assets Rupees 175,369,701 183,254,928
Cost of investments made Rupees 29,952,497 29,952,497
Percentage of investments made Percentage 17.08% 16.34%
Fair value of investment Rupees 22,027,864 21,166,818
It is difficult to precisely describe production capacity and the resultant production converted into base count in the textile industry since
it fluctuates widely depending on various factors such as count of yarn spun, raw materials used, spindle speed and twist, picks etc. It
would also vary according to the pattern of production adopted in a particular year.
The following information related to ANL is based on latest audited financial statements of Provident Fund Trust.

Notes to the Consolidated Financial Statementsfor the year ended 30 June 2013
The breakup of fair value of investments is as follows:
Rupees Percentage Rupees Percentage
Shares in listed companies 1,691,784 7.68% 1,127,661 5.33%
Debt securities 9,534,049 43.28% 9,534,049 45.04%
Mutual funds 10,802,031 49.04% 10,505,108 49.63%
22,027,864 100.00% 21,166,818 100.00%
50 Number of employees
The average and total number of employees of the Group are as follows:
2013 2012
Average number of employees during the year 8,744 10,006
Total number of employees as at 30 June 7,934 10,792
51 Corresponding figures
52 Date of authorization for issue
53 General
Figures have been rounded off to the nearest rupee.
These consolidated financial statements were authorized for issue on 30 September 2013 by the Board of Directors of the Group.
The investments of the Provident Fund Trust are not in compliance with the provision of section 227 of the Companies Ordinance, 1984
and the rules formulated for this purpose.
Corresponding figures have been re-arranged, where necessary, for the purpose of comparison. Significant reclassification for better
presentation includes provision against trade receivables amounting to Rs. 178.851 million previously included in net other income now
presented in selling and distribution expenses.
2013 2012
DirectorChief ExecutiveLahore
Annual Report 2013 153

Azgard Nine Limited154
Pattern of ShareholdingOrdinary Shares as at June 30, 2013
Number ofShareholders
Shareholding
From To
Total SharesHeld
18,3081 -425 100
344,129101 -908 500
984,364501 -1095 1000
7,270,7821001 -2502 5000
7,447,2455001 -916 10000
4,605,06910001 -353 15000
4,350,50915001 -234 20000
3,862,90420001 -164 25000
3,110,00625001 -109 30000
2,375,41830001 -71 35000
2,696,46935001 -70 40000
1,310,32040001 -30 45000
3,496,97145001 -71 50000
1,225,37150001 -23 55000
1,930,53255001 -33 60000
939,86760001 -15 65000
1,306,64865001 -19 70000
1,325,99870001 -18 75000
859,11575001 -11 80000
670,50980001 -8 85000
1,156,55485001 -13 90000
653,77390001 -7 95000
4,288,50095001 -43 100000
1,025,149100001 -10 105000
976,600105001 -9 110000
564,852110001 -5 115000
837,000115001 -7 120000
499,000120001 -4 125000
777,151125001 -6 130000
1,065,939130001 -8 135000
693,000135001 -5 140000
290,000140001 -2 145000
1,196,708145001 -8 150000
460,000150001 -3 155000
320,000155001 -2 160000
327,000160001 -2 165000
520,500170001 -3 175000
179,500175001 -1 180000
554,102180001 -3 185000
1,600,000195001 -8 200000
430,000210001 -2 215000
216,459215001 -1 220000
230,000225001 -1 230000
235,506235001 -1 240000
1,000,000245001 -4 250000
506,000250001 -2 255000
275,000270001 -1 275000
561,767280001 -2 285000
265,000260001 -1 265000
1,072,300265001 -4 270000

Annual Report 2013 155
Pattern of ShareholdingOrdinary Shares as at June 30, 2013
15,009,50015005001 -1 15010000
Number ofShareholders
Shareholding
From To
Total SharesHeld
289,354285001 -1 290000
290,176290001 -1 295000
300,000295001 -1 300000
306,126305001 -1 310000
319,500315001 -1 320000
649,500320001 -2 325000
350,000345001 -1 350000
380,000375001 -1 380000
1,160,500385001 -3 390000
800,000395001 -2 400000
441,500440001 -1 445000
445,500445001 -1 450000
958,523475001 -2 480000
1,995,500495001 -4 500000
1,003,055500001 -2 505000
1,945,064645001 -3 650000
1,000,000995001 -1 1000000
1,000,7861000001 -1 1005000
1,010,0001005001 -1 1010000
1,024,5001020001 -1 1025000
1,075,9531075001 -1 1080000
1,115,0001110001 -1 1115000
1,200,0001195001 -1 1200000
1,208,3571205001 -1 1210000
1,252,5001250001 -1 1255000
4,500,0001495001 -3 1500000
1,954,2001950001 -1 1955000
2,160,0002155001 -1 2160000
2,222,2222220001 -1 2225000
2,380,2602380001 -1 2385000
3,268,9083265001 -1 3270000
3,350,0003345001 -1 3350000
3,900,0003895001 -1 3900000
4,152,9364150001 -1 4155000
4,586,8194585001 -1 4590000
4,650,0004645001 -1 4650000
4,798,6564795001 -1 4800000
5,000,0004995001 -1 5000000
5,031,8835030001 -1 5035000
5,200,0005195001 -1 5200000
5,280,0005275001 -1 5280000
5,365,1975365001 -1 5370000
5,452,4655450001 -1 5455000
5,600,0005595001 -1 5600000
6,201,6446200001 -1 6205000
8,153,8458150001 -1 8155000
8,850,0008845001 -1 8850000
9,500,0009495001 -1 9500000
10,519,60010515001 -1 10520000

Azgard Nine Limited156
Pattern of ShareholdingOrdinary Shares as at June 30, 2013
1
1
1
1
21,587,054
22,169,691
23,457,408
38,460,000
112,157,863
21585001 -
22165001 -
23455001 -
38455001 -
112155001 -1
21590000
22170000
23460000
38460000
112160000
Number of
Shareholders
Shareholding
From To
Total Shares
Held
7,311 449,349,439
Shareholder's Category Number ofShares
Directors, Chief Executive Officer, and their spouse and minor children 41,355,009 9.20
24.96
8.88
1.58
0.51
24.96
0.00
112,157,863
11,703
39,917,912
7,121,477
2,295,965
112,157,863
Associated Companies, undertakings and related parties
Percentage%
NIT and ICP
Banks Development Financial Institutions, Non Banking Financial Institutions
Insurance Companies
Modarabas nad Mutual Funds
Share holders holding 10%
General Public
Other
a. Localb. Foreign
137,233,41411,379,818
30.542.53
Investment CompaniesJoint Stock CompaniesProvident / Pension Funds and Misc
38,529,77027,317,24932,029,259
8.576.087.13

Annual Report 2013 157
Information as required underCode of Corporate Governance
Categories ofShareholders
Number ofShares
Associated Companies, undertakings and related parties;
Jahangir Siddiqui & Co. Limited.
Mutual Funds;
CDC - Trustee KASB Asset Allocation Fund
CDC - Trustee Alfalah GHP Value Fund
CDC - Trustee AKD Index Tracker Fund
National Bank of Pakistan - Trustee Department NI (U) T Fund
480,000
501,500
68,000
1,208,357
0.11
0.11
0.02
0.27
112,157,863
Percentage %
24.96
Directors, Chief Executive Officer and their spouse and minor children;
Executives; Nil
Mr. Ahmed H. Shaikh
Mr. Aehsun M. H. Shaikh
Mr. Nasir Ali Khan Bhatti
Mr. Usman Rasheed
Mr. Naseer Miyan
Mr. Imtiaz Ali Bhatti
Mr. Imran Maqbool
Mr. Ahmed H. Shaikh
SAJ Capital Management Ltd.
Jahangir Siddiqui & Co. Ltd.
30,622,000
38,460,000
112,157,863
6.81
8.56
24.96
Public Sector Companies and Corporation, Banks, DFIs, Insurance Companies,
Takaful, Modarabas & Pension Funds;
Detail of trading in shares by the Directors, CEO, CFO, Company Secretary their Spouses
and Minor Children.
Shareholders holding five percent or more voting rights in the listed Company
30,622,000
10,733,000
5
1
1
1
1
6.81
2.39
0.00
0.00
0.00
0.00
0.00
144,965,478
Nil
32.26
Individuals 148,613,232
449,349,439 100.00
33.07

This page has been left blank intentionally

Azgard Nine Limited
Form of Proxy
I/We
son/daughter of
a member of Azgard Nine Limited and holder of
per Registered Folio No.
son/daughter of
Mr. Ms.
son/daughter of
who is also member of the Company vide Registered Folio No.
ordinary shares as
do hereby appoint Mr./Ms.
or failing him/her
as my/our Proxy to attend, speak and vote for me/us and on my/our behalf at the Annual General Meeting of the Company
to be held on Thursday the 31 October 2013 at 11:00 a.m at the Registered Office of the Company Ismail Aiwan-i-Science,
Off Shahrah-i-Roomi, Lahore and at any adjournment thereof.
In witness whereof on this day of 2013.
WITNESSES:
Signature:
Name
Address
CNIC:
1.
Signature:
Name
Address
CNIC:
2.
Affix RevenueStamp
Member's Signature
NOTE:
1.
2.
The Form of Proxy should be deposited at the Registered Office of the Company not later than 48 hoursbefore the time for holding the meeting.
CDC Shareholders, entitled to attend and vote at this meeting, must bring with them their national IdentityCards/Passport in original to provide his/her identity, and in case of Proxy, must enclosed an attestedcopy of his/her CNIC or Passport. Representatives of corporate members should bring the usual documentsfor such purpose.

The Company Secretary
AZGARD NINE LIMITEDIsmail Aiwan-e-ScienceLahore - 54600
AFFIX
CORRECT
POSTAGE