aqueous surface chemistry of adsorption...
TRANSCRIPT

AQUEOUS SURFACE CHEMISTRY OF GOETHITE
‐ADSORPTION AND DESORPTION REACTIONS INVOLVING PHOSPHATE AND CARBOXYLIC
ACIDS
MALIN LINDEGREN DEPARTMENT OF CHEMISTRY
UMEÅ UNIVERSITY SWEDEN
2009

ii
iii
Abstract
Phosphorus is an essential element for all known forms of life. In the form of phosphate, this nutrient is retained in soils and sediments by sorption on mineral particles, clays and other soil constituents. In addition, phosphate precipitates with metal ions to form a range of phosphate containing minerals, and only a minor part of phosphate is found dissolved in soil solution. One way of releasing sorbed phosphate is through ligand exchange reactions with for example carboxylic acids. This thesis summarizes five papers and focuses on the interactions of phosphate and carboxylates at the water-goethite interface. Quantitative adsorption data and spectroscopic evaluations of the surface complexation were used collectively to gain a better understanding of these processes. In agreement with previous studies, it was found that the number of carboxylic groups is important to the competitive ability of the organic acids towards phosphate. However, it was also shown that the positions of the functional groups are highly relevant to this ability. Furthermore, partially protonated species were – because of hydrogen bond interactions - shown to be more competitive than fully deprotonated equivalents. Another central finding in this work is that competitive interactions do not necessarily involve ligand-exchange reactions between inner sphere surface complexes. To study the lability of the complexes, desorption experiments were performed. Among the benzenecarboxylates, the order of increased lability matched that of the decreased ability to compete with phosphate for surface sites on the goethite. Also shown in this thesis is the ability of goethite to increase the dissolution of fluorapatite mainly through the high affinity of phosphate ions for the goethite surface.

iv
IIIIIIIVV
Aqueous Surface Chemistry of Goethite Adsorption and Desorption Reactions Involving Phosphate
and Organic Acids
Malin Lindegren This thesis contains a summary and a discussion of the following papers, referred to in the text by their Roman numerals I-V.
Molecular Structures of Citrate and Tricarballylate Adsorbed on α-FeOOH Particles in Aqueous Suspensions Malin Lindegren, John S. Loring and Per Persson Langmuir, published online August 14, 2009
Reprinted with permission by ACS
Competitive Adsorption between Phosphate and Carboxylic Acids: Quantitative Effects and Molecular Mechanisms Malin Lindegren and Per Persson European Journal of Soil Science, in Press Reprinted with permission by Wiley-Blackwell Competitive Adsorption Involving Phosphate and Benzenecarboxylic Acids on Goethite – the Effect of Molecular Structures Malin Lindegren and Per Persson Submitted to Journal of Colloid and Interface Science Desorption of Benzenecarboxylates from the Water-Goethite Interface Malin Lindegren, John S. Loring and Per Persson Manuscript Dissolution, Adsorption and Phase Transformation in the Fluorapatite-Goethite System Åsa Bengtsson, Malin Lindegren, Staffan Sjöberg and Per Persson Applied Geochemistry, 2007, (22) 2016-2028 Reprinted with permission by Elsevier

v
Contents
1. Introduction 1 2. Aim 2 3. Experimental Procedures and Techniques 2 3.1 Minerals 2 3.1.1 Goethite 2 3.1.2 Fluorapatite (FAP) 3 3.2 Carboxylates 3
3.3 Experimental Procedures 4 3.3.1 Simultaneous Infrared and Potentiometric Titration (SIPT) 4 3.3.2 Batch Experiments in Ligand-Goethite Systems 5 3.3.3 Batch Experiments in the FAP-Goethite System 5 3.4 Quantitative Analysis 6 3.5 Infrared Spectroscopy 6
3.5.1 Attenuated Total Reflectance Fourier Transform Infrared Spectroscopy 7 3.5.2 Theoretical Frequency Calculations 9 3.5.3 Two-Dimensional (2D) Correlation Analysis 9
4. Adsorption Reactions in the Single Ligand Systems 11 4.1 Types of Surface Complexes 11
4.2 General Procedure for Characterisation of Complexes 12 4.3 Characterisation of Tricarballylate Surface Complexes 13 4.3.1 Aqueous Tricarballylate 13 4.3.2 Tricarballylate Surface Complexes 14 4.4 Characterisation of Citrate, BTCA, Hemimellitate, and Trimesoate Surface Complexes 17
4.4.1 Citrate 17 4.4.2 BTCA 18 4.4.3 Hemimellitate and Trimesoate 19
4.5 Summary of Carboxylate Surface Complexes 21 4.6 Phosphate Surface Complexes 22
5. Adsorption Reactions in the Competitive Systems 23 5.1 Quantitative Effects 23 5.1.1 The Effect of Number of Carboxylic Groups 23 5.1.2 The Effect of Carboxylate Group Positions 24 5.2 Molecular Mechanisms 26
6. Desorption Reactions Involving Carboxylic Acids 30 7. Adsorption Reactions Involving Phosphate from Fluorapatite 33 8. Conclusions 36 9. References 37


1
1. Introduction In 1669, an alchemist named Henning Brand tried to create the Philosopher’s Stone, a long sought after alchemical tool that was supposedly capable of turning metals into gold and even achieving immortality of the user. Brand heated the condensed remains of urine with sand in an oxygen free atmosphere, but instead of the infamous stone he found a white substance that glowed faintly in the dark. This substance was named Phosphorus, which roughly translates as light-bringer and was the Ancient Greek name for Venus, the Morning Star.
Phosphorus is an essential element for all known forms of life. It is part of vital biomolecules such as DNA, RNA, ATP, and phospholipids, which stores and communicates inherited biological information, transports energy, and builds up cellular membranes, respectively. It is also a central component of the apatite that is the main material of teeth, bones and shells 1.
Phosphorus is widely used commercially in detergents, pesticides, toothpaste, fireworks and explosives. One of the most widespread uses is in the production of fertilizers2. Due to its extensive reactivity, phosphorus, in the form of phosphate, is the least mobile of the major nutrients, and thereby often the key factor limiting plant growth. There are approximately 5.7 billions of hectares worldwide containing less than the needed available phosphorus for optimal plant growth3. Phosphate is retained in soils and sediments by sorption on mineral particles, clays and other soil constituents. In addition, phosphate precipitates with metal ions, forming a range of phosphate containing minerals. Phosphorus is also found in organic matter in various stages of decay, and a minor part is found dissolved in soil solution. The dissolved fraction is generally considered the most bioavailable4, whereas the other fractions need to be converted before assimilated.
In aquatic systems, primary production is usually phosphorus limited in fresh water and nitrogen limited in estuaries and coastal ecosystems5. As in soils, a large fraction (around 95%)6 of the phosphorus carried by rivers is associated with suspended solids and more than half of this fraction can be bound to iron hydroxides7. This bound phosphorus can be transformed into dissolved phosphate phases due to redox changes in anoxic layers of sediments6, 8.
An essential way of releasing retained phosphate from soil particles is by altering the pH. The pH regulates the speciation of molecules, ions, and surfaces, and thereby controls sorption/desorption processes and precipitation/dissolution reactions that determine the form in which phosphate is found. Another way of releasing sorbed phosphate is through ligand exchange reactions. Indeed, plant roots excrete low molecular weight (LMW) carboxylates – such as oxalate and citrate – as a response to phosphate depletion9-15. As the functional groups of organic anions (i.e., the carboxylate groups) give these substances similar sorption properties to that of inorganic anions16, these carboxylates are thought to compete with phosphate for the active sites on mineral particles. In addition, the release of these LMW carboxylates would most likely be accompanied by exudation of protons to compensate for the net flux of negatively charged ions3 and thereby decrease the pH and potentially release phosphate through increased dissolution of calcium phosphates such as apatites.

2
2. Aim The primary aim of this thesis is to further the knowledge of the competitive interactions between phosphate and carboxylates at the water/goethite interface. In order to account for the quantitative adsorption effects seen in both single ligand and competitive systems, particular attention has been paid to the molecular level surface speciation. The lability of the ligands has also been studied in desorption experiments and by changing the order of addition in some of the competitive systems. Moreover, the affinity of phosphate for the goethite surface has been investigated in a mixed mineral system.
3. Experimental Procedures and Techniques 3.1 Minerals 3.1.1 Goethite In this study, the mineral goethite has been used as the model compound on which the adsorption processes take place. Goethite (α-FeOOH) is an iron hydroxide commonly found in all types of soils throughout the world16. It is frequently formed during weathering of other iron-bearing minerals and is often the cause of the yellowish-brown colour of many soils17, 18.
Large surface area goethites were used in all experiments (Papers I-V), ranging between 82.2 and 104.9 m2/g. The needle shaped particles are dominated by the {110} plane which represents roughly 90% of the total surface area19 (Figure 3.1). This surface contains singly-, doubly-, and triply-coordinated oxygens of which the ≡FeOH0.5- and the ≡Fe3O0.5- are generally considered the most reactive. The remaining 10% of the particle surface – the terminations of the needles – have a larger density of these more reactive sites.
The point of zero charge of goethite is 9.4; below 9.4 the surface carries a net positive charge and most of the experiments in this work are carried out in this pH region.
Figure 3.1. A goethite particle with the active sites and crystal planes.

3
3.1.2 Fluorapatite (FAP) Of the phosphate minerals in soils, apatites (Ca5(PO4)3OH, F, Cl) are the primary natural source of phosphate20. The morphology of apatite crystals can have a great variety and the crystals range in size between submicron in biological systems to giant metamorphic crystals of many tons21. The synthetic fluorapatite (FAP) used in this work is described in detail in Paper V. The dissolution of FAP proceeds according to Equation 1 coupled with Equations 2-4 and is thus strongly pH dependent.
FPOCa 345 )( ⇋ −+− ++ FCaPO 234 53 (1)
+− + nHPO34 ⇋ −− )3(
4n
n POH (n=1, 2, 3) (2) +−+ ++ nHPOCa 3
42 ⇋ +− )1(
4n
n POCaH (n=1, 2) (3) +− + HF ⇋ HF (4)
3.2 Carboxylates
Benzoate Phthalate Mellitate
Hemimellitate Trimellitate Trimesoate Pyromellitate
Oxalate Citrate Tricarballylate BTCA
Benzoate Phthalate Mellitate
Hemimellitate Trimellitate Trimesoate Pyromellitate
Oxalate Citrate Tricarballylate BTCA
Figure 3.2. Schematic molecular structures of the carboxylates. Oxygen atoms are red, carbon atoms are grey and hydrogen atoms are white.
The carboxylic acids of relevance to the work summarized in this thesis
are pictured in Figure 3.2. Most of them are found naturally in various environments either as separate molecules or as part of larger soil constituents such as fulvic acids. Tricarballylate and 1,2,3,4-

4
butanetetracarboxylic acid (BTCA), however, are included in this work for comparative reasons. Tricarballylate was used to elucidate the importance of the hydroxyl group in citrate adsorption and BTCA served as an intermediate in a series of carboxylates with an increasing number of functional groups.
Citric acid is involved in almost all metabolic reactions as part of the citric acid cycle. It is found in many fruits and vegetables as a naturally occurring preservative and flavouring, and is used commercially in food and beverages. Citric acid is also used industrially in soaps and detergents, to dissolve rust from steel, in explosives and in the pharmaceutical industry22.
Oxalic acid is also abundant in many plants and is used commercially in the production of ink, bleachers and rust proofing treatments23.
The benzene carboxylic acids are found in soils and sediments as building blocks of fulvic acids24. The smaller aromatic carboxylates, benzoic acid and phthalic acid in particular are widely used industrially as intermediates in the production of inks, dyes, and plasticizers25. Benzoic acid is also found in many fruits, berries and vegetables where it serves as a preservative, and (like citrate) this ability is used commercially in food and beverages. 3.3 Experimental Procedures The experimental work in this study was performed either as a series of batches or in a simultaneous infrared and potentiometric titration (SIPT) set-up. 3.3.1 Simultaneous Infrared and Potentiometric Titration (SIPT) In the SIPT experiments (Figure 3.3), a goethite suspension was circulated in a closed loop over an ATR cell coated with a thin layer of the mineral. This set-up provides an excellent signal-to-noise ratio that facilitates investigations of spectral changes induced by variations in pH or surface coverage of the ligands. This method is used and described in more detail in Paper I and IV.

5
FTIR With Flow-Through ATR Cell
Dosimeter withpH Meter
Computer
Propeller Stirrer
Titration Vessel
Peristaltic Pump
Combination pH Electrode
Stir Plate
FTIR With Flow-Through ATR Cell
Dosimeter withpH Meter
Computer
Propeller Stirrer
Titration Vessel
Peristaltic Pump
Combination pH Electrode
Stir Plate
Figure 3.3. Apparatus for simultaneous infrared and potentiometric titration (SIPT) experiments.
3.3.2 Batch Experiments in Ligand-Goethite Systems In the batch experiments in Paper I-III (Figure 3.4A), the ligand or ligands were added to the goethite suspension simultaneously before the pH was adjusted to the desired value. In the vast majority of the experiments the subsequent reaction time was 24 hours. Next, the wet pastes and supernatants were separated by centrifugation and then analyzed. The amounts of adsorbed ligands were calculated as the difference between total ligand and ligand in solution. The latter was quantified using the methods specified in section 3.4. The ligand-surface interactions were extensively investigated with infrared spectroscopy. 3.3.3 Batch Experiments in the FAP-Goethite System
In Paper V, a closed dialysis tube with fluorapatite (FAP) was inserted in the goethite suspension (Figure 3.4B). Separate batches were equilibrated for 2 hours up to 129 days. The remaining FAP was removed and the samples were centrifuged and analyzed as described above.

6
Phosphate and/or Carboxylic Acid
IC UV-Vis AAS
IR
5000 rpm 20 min
24 h
A
Phosphate and/or Carboxylic Acid
IC UV-Vis AAS
IR
5000 rpm 20 min
24 h
Phosphate and/or Carboxylic Acid
IC UV-Vis AAS
IR
5000 rpm 20 min
24 h
A
IRIC AAS
5000 rpm 20 min
B
IRIC AAS
5000 rpm 20 min
IRIC AAS
5000 rpm 20 min
IRIC AAS
5000 rpm 20 min
5000 rpm 20 min
B Figure 3.4. Schematic presentation of the experimental procedures. A) The procedure used in single ligand and competitive ligand systems of Papers I-III, and B) the procedure used in the mixed mineral system of Paper V. 3.4 Quantitative Analysis Different techniques were used to measure the concentrations of ligands and metal ions in solution.
In Paper I, scintillation counting and ion chromatography (IC) were used to quantify citrate in solution. IC was also used for samples containing tricarballylate, oxalate, citrate and/or phosphate in Papers I and II, for samples containing phthalate, mellitic and/or phosphate in Paper III, for all nine benzenecarboxylates in Paper IV, and for fluoride and phosphate concentrations in Paper V. In Paper II, the samples containing mellitate, FA, and/or phosphate were analyzed with UV-Vis spectrometry. This technique was also used for the benzoate, trimesoate, hemimellitate, trimellitate, pyromellitate and/or phosphate containing samples in Paper III. Atomic absorption spectrometry (AAS) was used to acquire Fe concentrations in Paper I-V and Ca concentrations in Paper V. 3.5 Infrared Spectroscopy Infrared (IR) spectroscopy is used to study the vibrations of molecules. A sample is irradiated with light in the frequency range 400-7000 cm-1. When the incoming radiation matches the frequency of a molecular vibration that induces a change in the dipole moment of the molecule, energy is absorbed. As these frequencies are specific for every combination of atoms and force constants of the bonds, an IR active molecules produce absorption spectra characteristic for that particular molecule. Thus, the peaks found in infrared spectra can give information on inter- and intramolecular coordination. It has been found experimentally that the vibrations of some functional groups always fall in the same frequency region, regardless of the composition of the rest of the molecule. The peaks due to the stretch vibrations of the carboxylates are found between 1200 and 1800 cm-1 (Figure

7
3.5). Around 1400 cm-1 peaks due to the symmetrical stretch vibrations ( sCOν )
of the deprotonated carboxylate groups are found. The corresponding asymmetric vibrations ( as
COν ) give rise to peaks around 1550 cm-1. At both sides of the carboxylate originating peaks, peaks due to the protonated carboxylic group appear. Peaks derived from the carbonyl stretch vibrations are found between 1700 and 1750 cm-1, and the stretch and bend vibrations of the carboxylic –COH group produce peaks around 1200-1300 cm-1.
1800 1600 1400 1200
Wavenumber (cm-1)
1800 1600 1400 1200
Wavenumber (cm-1)
Figure 3.5. Presentation of the main frequency regions where different carboxylate/ carboxylic stretch vibrations produce peaks. 3.5.1 Attenuated Total Reflectance Fourier Transform Infrared Spectroscopy Attenuated total reflectance (ATR) spectroscopy is used for samples that are too thick or too absorbing for conventional transmittance measurements. This technique is also ideal for the type of surface investigations made in this work. The ATR cell consists of a crystal with high refractive index and the sample is placed in direct contact with this crystal (Figure 3.6). The infrared radiation is transmitted through the cell and at the interface between the crystal and the sample an evanescent wave is produced that penetrates about a micron into the sample. The penetration depth (dp) is wavelength dependent and given by Equation 5. The evanescent wave gives the short path length needed to gain information from a strongly absorbing sample. To increase the intensities of the peaks, ATR cells with up to 20 reflections are used.
2/12
1
22
1
))((sin2nn
d p
−Θ=
π
λ (5)
where λ1, is the wavelength and Θ is the angle of incidence of the infrared beam, n2 and n1 are the refractive indexes of the sample and the ATR crystal, respectively.

8
Sample
Detector
Crystal
Sample
Detector
Crystal
Figure 3.6. A schematic illustration showing the function of the ATR cell. In a Fourier transform infrared (FTIR) spectrometer a rapid scan speed is gained by using an interferometer (Figure 3.7). The collimated radiation from an IR source hits the beamsplitter at an angle of 45°. Half the radiation is transmitted through the beamsplitter to a moving mirror that is perpendicular to the beam. The other half of the radiation is reflected and strikes a fixed mirror perpendicular to this beam. Both beams are reflected back to the beamsplitter where they recombine and interfere constructively or destructively. As the velocity of the moving mirror is constant the recombined beam comprises a sinusoidal modulation in radiation intensity that travels to the detector via the sample. The signal from the detector is recorded to form an interferogram and the infrared spectrum as we recognise it is mathematically reconstructed via Fourier transformation. All details of the data collection of each study are found in Paper I-V.
InfraredSource
Beamsplitter
Movingmirror
Fixed mirror
Detector
Sample
Figure 3.7. Schematic presentation of an interferometer.

9
3.5.2 Theoretical Frequency Calculations Theoretical frequency calculations can be used as a tool to assign specific molecular vibrations to peaks seen in infrared spectra. The theoretical spectra in this work are calculated with an electronic structure method known as the density functional theory (DFT). DFT utilizes a set of approximations – called the basis set – to optimize the geometry of the molecule and calculate the vibrational frequencies. Visualisation software is used to identify the vibrational modes of the peaks in the theoretical spectrum. Figure 3.8 illustrates the theoretical tricarballylate spectrum with the corresponding vibrational modes. In this example, the stretch vibrations of the carboxylic groups are coupled with two different wagging modes of the –CH2-groups. Theory predicts three separate peaks for each of the symmetric and asymmetric stretch vibrations because the three individual carboxylic groups on tricarballylate do not have identical surroundings. In the experimental spectrum, however, these peaks are not clearly separated (Figure 4.2). Details on the computations are found in Paper I.
1600 1500 1400
++
1600 1500 1400
++
Figure 3.8. A depiction of part of the theoretical spectrum of tricarballylate with illustrations of the corresponding vibrational modes. 3.5.3 Two-Dimensional (2D) Correlation Analysis The correlations among peaks in a set of spectra from a system that is exposed to an external perturbation – pH in this work – can be identified by means of two-dimensional (2D) spectroscopy. In addition, by spreading highly overlapping IR peaks onto two dimensions, the resolution is greatly enhanced and the interpretation of the spectra facilitated26. These qualities have been used in this work to find the number of surface species of a ligand and the infrared peaks belonging to each species.
2D correlation spectroscopy is based on a quantitative comparison of the variations in spectral intensities that are caused by the external perturbation and observed in two spectral variables, ν1 and ν2. The 2D
10
correlation spectrum can be expressed as the following complex number function:
X(ν1, ν2) = Φ( ν1, ν2.) + iΨ (ν1, ν2) = ∫ ∗⋅−
max
min21
minmax
)(~)(~)(
1 pH
pH
dYYpHpH
ωωωπ
(6)
where the real component (Φ) comprises the synchronous 2D correlation intensities and the imaginary (Ψ) component holds the asynchronous 2D correlation intensities, which are explained further below. pHmax and pHmin defines the pH limits of the experiment and Ỹ and Ỹ* are the forward Fourier transform of the spectral intensity variations in ν1 and the conjugate of the Fourier transform of the spectral intensities in ν2, respectively. ω is the Fourier frequency and represents the individual frequency components of the spectral variation.
Before correlating a series of spectra in two dimensions, they are baseline corrected and normalised with respect to total peak area. This procedure retains only the features that are due to the changes in surface speciation caused by the external perturbation and not by other factors such as surface coverage.
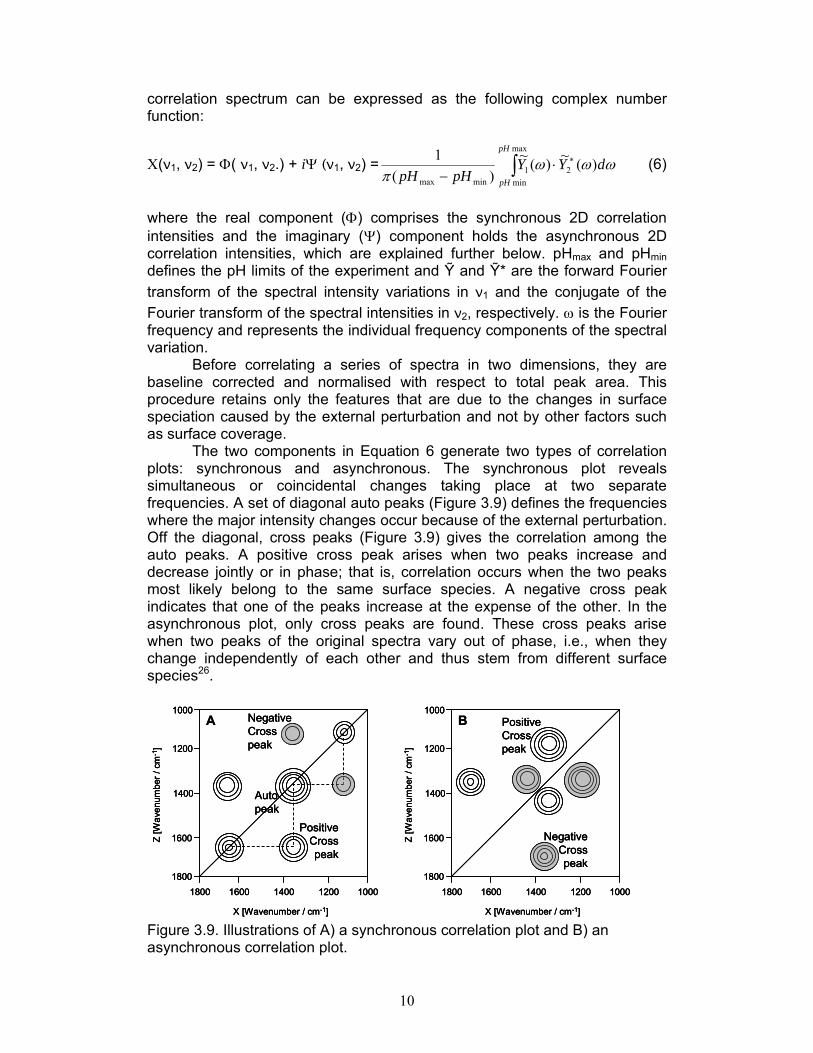
The two components in Equation 6 generate two types of correlation plots: synchronous and asynchronous. The synchronous plot reveals simultaneous or coincidental changes taking place at two separate frequencies. A set of diagonal auto peaks (Figure 3.9) defines the frequencies where the major intensity changes occur because of the external perturbation. Off the diagonal, cross peaks (Figure 3.9) gives the correlation among the auto peaks. A positive cross peak arises when two peaks increase and decrease jointly or in phase; that is, correlation occurs when the two peaks most likely belong to the same surface species. A negative cross peak indicates that one of the peaks increase at the expense of the other. In the asynchronous plot, only cross peaks are found. These cross peaks arise when two peaks of the original spectra vary out of phase, i.e., when they change independently of each other and thus stem from different surface species26.
Positive Cross peak
NegativeCross peak
1000140016001800 1200
1000
1400
1600
1800
1200
X [Wavenumber / cm-1]
Z [W
aven
umbe
r / c
m-1
]
Auto peak
Positive Cross peak
NegativeCross peak
1000140016001800 1200
1000
1400
1600
1800
1200
X [Wavenumber / cm-1]
Z [W
aven
umbe
r / c
m-1
]
A B Positive Cross peak
NegativeCross peak
1000140016001800 1200
1000
1400
1600
1800
1200
X [Wavenumber / cm-1]
Z [W
aven
umbe
r / c
m-1
]
Positive Cross peak
NegativeCross peak
1000140016001800 1200
1000
1400
1600
1800
1200
X [Wavenumber / cm-1]
Z [W
aven
umbe
r / c
m-1
]
Auto peak
Positive Cross peak
NegativeCross peak
1000140016001800 1200
1000
1400
1600
1800
1200
X [Wavenumber / cm-1]
Z [W
aven
umbe
r / c
m-1
]
Auto peak
Positive Cross peak
NegativeCross peak
1000140016001800 1200
1000
1400
1600
1800
1200
X [Wavenumber / cm-1]
Z [W
aven
umbe
r / c
m-1
]
A B
Figure 3.9. Illustrations of A) a synchronous correlation plot and B) an asynchronous correlation plot.

11
4. Adsorption Reactions in the Single Ligand Systems 4.1 Types of Surface Complexes There are two main types of carboxylate surface complexes: inner sphere and outer sphere. In inner sphere complexes there is at least one direct bond between the ligand and a metal ion of the surface, whereas in an outer sphere complex the ligand is held at the surface by electrostatic forces and separated from it by one or more water molecules. Both these types of surface species may or may not be stabilized by hydrogen bonds.
Monodentate inner sphere
Surface hydration-shared
ion pair
Bidentate mononuclear inner sphere
Bidentate binuclear inner sphere
Surface hydration-separated
ion pair
Monodentate inner sphere
Surface hydration-shared
ion pair
Bidentate mononuclear inner sphere
Bidentate binuclear inner sphere
Surface hydration-separated
ion pair
Figure 4.1. Schematic representations of examples of inner and outer sphere surface complexes. Examples of carboxylate inner sphere complexes are pictured in Figure 4.1. Figure 4.1 also illustrates two types of outer sphere complexes. In the surface hydration-shared ion pair the ligand binds to the water of the mineral surface with hydrogen bonding, in the hydration-separated ion pair at least one layer of water molecules separate the ligand from the surface. As the hydration sphere of a hydration-separated ion pair is more or less unaffected by sorption, the infrared spectrum of this complex will be very similar to that of the dissolved ligand. On the other hand, because the spectrum of a hydration- shared ion pair can be quite different from the aqueous spectra, it can be rather difficult to distinguish the spectrum of a hydration-shared ion pair from the spectrum of an inner sphere complex.

12
4.2 General Procedure for Characterization of Complexes In this work, a general procedure has been followed when assigning complexes to ligands (Figure 4.2). First, theoretical spectra of the deprotonated and protonated ligand in solution are calculated so the peaks are assigned with molecular vibrations according to the description in section 3.5.2. These assignments are then transferred to the corresponding experimental spectra. Once the peaks of the aqueous species are identified, comparisons are made with the spectra of the adsorbed ligand. If available, spectra of aqueous metal-ligand complexes are also used. The similarities and dissimilarities between the spectra of aqueous and adsorbed ligands are the basis for identifying the speciation at the mineral surface. At this point, a 2D correlations analysis may be used to find the number of complexes and to determine which peaks that belong to each species. Finally, the peaks of each complex are compared to those of the aqueous ligand and assigned with plausible complex coordinations.
1600 1500 1400
+
1: (1390, 1550)2: (1332, 1360, 1410, 1616)
1600 1500 1400
1600 1500 1400
+
1600 1500 1400
+
1: (1390, 1550)2: (1332, 1360, 1410, 1616)
1600 1500 1400
1600 1500 1400
+
1600 1500 14001600 1500 1400
++
1: (1390, 1550)2: (1332, 1360, 1410, 1616)
1600 1500 14001600 1500 14001600 1500 1400
1600 1500 14001600 1500 1400
++
Figure 4.2.Outline of the general procedure used in this work to identify surface complexes.

13
4.3 Characterisation of Tricarballylate Surface Complexes In the following section, the complexation of tricarballylate on the goethite surface will be discussed and serve as an example of the assignment procedure presented in the previous section. More detail on this system is found in Paper I. 4.3.1 Aqueous Tricarballylate Figure 4.3 shows a spectrum of completely deprotonated tricarballylate in aqueous solution with the corresponding 2nd derivative and theoretical spectrum. The 2nd derivative spectrum can be used to resolve overlapping peaks.
Compared to the theoretical spectrum, the two dominating peaks of the experimental spectrum - 1550 and 1390 cm-1 – originate mainly from asymmetric and symmetric stretch vibrations of the deprotonated carboxylate groups, respectively. In addition, a couple of peaks due to bending modes of the CH2-groups are found around 1300 cm-1. A summary of the assignments is found in Table 1.
1800 1700 1600 1500 1400 1300 1200
wavenumber/cm-1
a)
b)
1800 1700 1600 1500 1400 1300 1200
wavenumber/cm-1
a)
b)
Figure 4.3. a) The infrared spectrum of an aqueous solution of tricarballylate at pH 12.4 in black with the corresponding negative second derivative in grey and b) the DFT-calculated frequencies, intensities, and spectrum of the trianionic ligand.
14
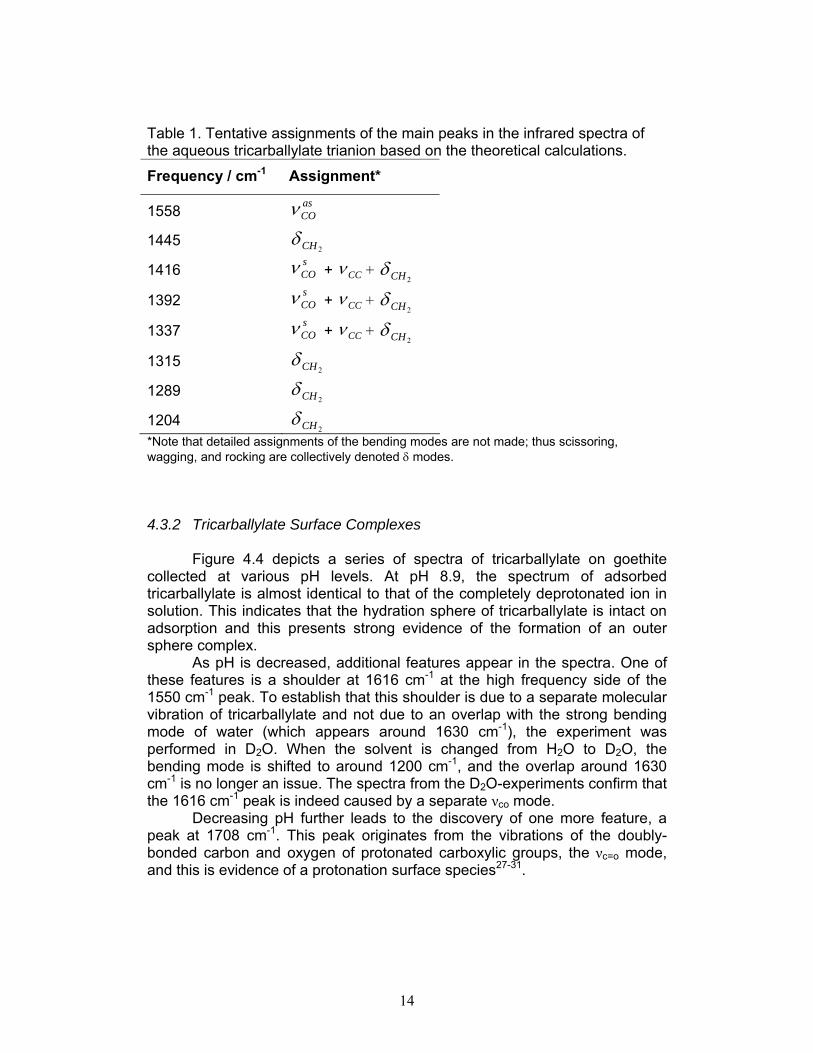
Table 1. Tentative assignments of the main peaks in the infrared spectra of the aqueous tricarballylate trianion based on the theoretical calculations.
Frequency / cm-1 Assignment*
1558 asCOν
1445 2CHδ
1416 sCOν + CCν +
2CHδ
1392 sCOν + CCν +
2CHδ
1337 sCOν + CCν +
2CHδ
1315 2CHδ
1289 2CHδ
1204 2CHδ
*Note that detailed assignments of the bending modes are not made; thus scissoring, wagging, and rocking are collectively denoted δ modes. 4.3.2 Tricarballylate Surface Complexes Figure 4.4 depicts a series of spectra of tricarballylate on goethite collected at various pH levels. At pH 8.9, the spectrum of adsorbed tricarballylate is almost identical to that of the completely deprotonated ion in solution. This indicates that the hydration sphere of tricarballylate is intact on adsorption and this presents strong evidence of the formation of an outer sphere complex. As pH is decreased, additional features appear in the spectra. One of these features is a shoulder at 1616 cm-1 at the high frequency side of the 1550 cm-1 peak. To establish that this shoulder is due to a separate molecular vibration of tricarballylate and not due to an overlap with the strong bending mode of water (which appears around 1630 cm-1), the experiment was performed in D2O. When the solvent is changed from H2O to D2O, the bending mode is shifted to around 1200 cm-1, and the overlap around 1630 cm-1 is no longer an issue. The spectra from the D2O-experiments confirm that the 1616 cm-1 peak is indeed caused by a separate νco mode. Decreasing pH further leads to the discovery of one more feature, a peak at 1708 cm-1. This peak originates from the vibrations of the doubly-bonded carbon and oxygen of protonated carboxylic groups, the νc=o mode, and this is evidence of a protonation surface species27-31.

15
1800 1600 1400 1200
Wavenumber / cm-1
pH 8.9
pH 8.6
pH 7.6
pH 6.2
pH 5.2
pH 3.9
pH 3.0
pD 4.9
1800 1600 1400 1200
Wavenumber / cm-1
pH 8.9
pH 8.6
pH 7.6
pH 6.2
pH 5.2
pH 3.9
pH 3.0
pH 8.9
pH 8.6
pH 7.6
pH 6.2
pH 5.2
pH 3.9
pH 3.0
pD 4.9
Figure 4.4. Infrared spectra of tricarballylate on goethite in black at the pH values indicated by the legend together with the corresponding negative second derivative spectra in grey. The bottom spectrum depicts tricarballylate adsorbed onto goethite in D2O at pD 4.9. The arrows indicates a peak associated with a protonated surface complex discussed in the text.

16
Figure 4.5. A) Synchronous contour plot obtained from the 2D correlation analysis of the tricarballylate-goethite spectra. B) The corresponding asynchronous contour plot. To assign complexes to the additional features appearing on lowering the pH, a 2D correlation analysis was performed on the adsorption spectra. Seven auto peaks were found in the synchronous plot at 1332, 1360, 1390, 1410, 1550, 1616, and 1708 cm-1 (Figure 4.5A). In the same plot, a strong positive cross peak at (1390, 1550) confirms that these two peaks belong to the same surface complex. Negative cross peaks at (1390, 1616), (1390, 1708), (1550, 1616), and (1550, 1708) show that the 1390 and 1550 cm-1 peaks are negatively correlated to the 1616 and 1708 cm-1 peaks; that is, they stem from different species. In addition, positive cross peaks at (1616, 1332), (1616, 1360), and (1616, 1410) relate the shoulder at 1616 cm-1 to the 1332, 1360, and 1410 cm-1 peaks and organize them in a group of peaks originating from the same surface complex.
Further information was gained from the asynchronous correlation plot (Figure 4.5B) where cross peaks at (1616, 1708), (1360, 1708), and (1410, 1708) show that the 1708 cm-1 peak is uncorrelated to the 1616 cm-1 group of peaks. In summary, by using the collective information from the synchronous and asynchronous plots, three groups of peaks were identified: (1390, 1550), (1332, 1360, 1410, 1616) and (1708). As already discussed, the (1390, 1550) most likely originate from a deprotonated outer sphere complex. The frequencies of the second group – 1332, 1360, 1410, and 1616 cm-1 – do not correspond to frequencies found in the solution spectra. This deviation of frequencies indicates significant molecular perturbation of the sorbed ion and from the way the peaks shift and from the experiment performed in D2O (see Paper I for details) we suggest the formation of an inner sphere complex. On account of the negative cross peaks found in the synchronous plot at (1390, 1708) and (1550, 1708) and of the absence of corresponding cross peaks in the asynchronous plot, the protonation is assigned to the outer sphere complex.
17
4.4 Characterisation of Citrate, BTCA, Hemimellitate, and Trimesoate Surface Complexes Similar evaluations as the one described in the previous section have been made for all carboxylic acids in this study. Benzoate, oxalate, phthalate, trimellitate, pyromellitate and mellitate have been investigated by previous authors27, 32-36. The assignments of citrate, BTCA, hemimellitate, and trimesoate are part of this work and will be described briefly in this section. A summary of all carboxylate complexes is found in Figure 4.10. 4.4.1 Citrate
1800 1600 1400 1200
Wavenumber / cm-1
pH 10.4
pH 9.4
pH 8.2
pH 6.6
pH 5.5
pH 4.1
pH 2.9
pD 7.4
pD 3.4
1800 1600 1400 1200
Wavenumber / cm-1
1800 1600 1400 12001800 1600 1400 1200
Wavenumber / cm-1
pH 10.4
pH 9.4
pH 8.2
pH 6.6
pH 5.5
pH 4.1
pH 2.9
pH 10.4
pH 9.4
pH 8.2
pH 6.6
pH 5.5
pH 4.1
pH 2.9
pD 7.4
pD 3.4
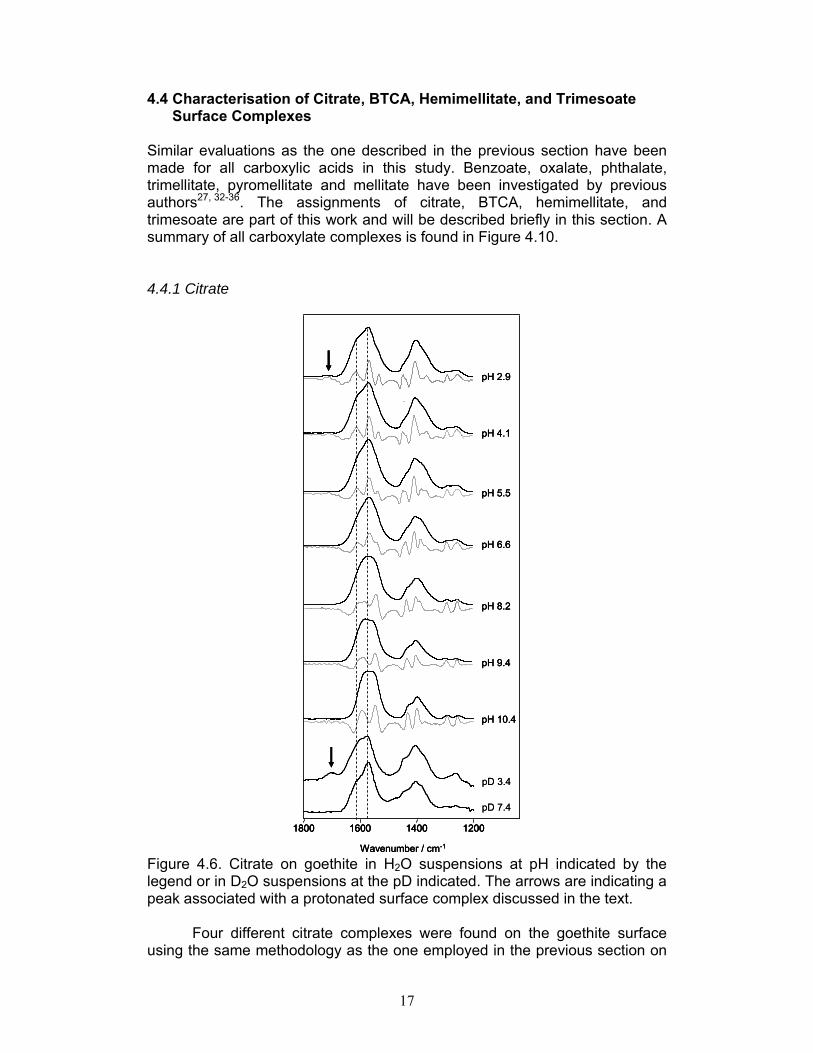
Figure 4.6. Citrate on goethite in H2O suspensions at pH indicated by the legend or in D2O suspensions at the pD indicated. The arrows are indicating a peak associated with a protonated surface complex discussed in the text.
Four different citrate complexes were found on the goethite surface using the same methodology as the one employed in the previous section on

18
tricarballylate. In the 2D analysis, however, the spectra of citrate had to be grouped by more narrow pH-intervals to find the subtle changes in the spectra caused by the complexation and not only the major changes due to the pH variation (Paper I).
One inner sphere complex was identified at low pH and another inner sphere complex involving the hydroxyl group at high pH. Around neutral pH an outer sphere species was found to co-exist with both these inner sphere complexes. In addition a protonated species was discovered in small amounts at low pH, signified by the peak at 1710 cm-1 that is marked with an arrow in Figure 4.6. 4.4.2 BTCA
pH 8.7
pH 5.2
pH 11.8 (aq)
pH 4.0
pH 4.0 (aq)
pH 3.0
pH 1.5 (aq)
18001800Wavenumber / cm-1
1600 1400 1200
1230
13951564
1710
pH 8.7
pH 5.2
pH 11.8 (aq)
pH 4.0
pH 4.0 (aq)
pH 3.0
pH 1.5 (aq)
18001800Wavenumber / cm-1
1600 1400 1200
1230
13951564
1710
Figure 4.7. ATR-FTIR spectra of BTCA on goethite and in aqueous solution at the pH indicated by the label. The assignment of BTCA complexes was mainly performed by comparing the spectra of BTCA on goethite to those of aqueous BTCA (Paper II). Briefly, the peaks caused by the sorbed and the dissolved species are essentially identical in shapes and positions; therefore, the surface speciation is concluded to be dominated by outer sphere complexes. The slight broadening of the peaks of the surface species is ascribed to inhomogeneous hydrogen bonding to different types of surface sites and solvation molecules. In addition, at pH 4 and below, a protonated complex is formed, identified by the peaks at 1710 cm-1 and 1230 cm-1.

19
4.4.3 Hemimellitate and Trimesoate
1800 14001600
pH 11.4 (aq)
pH 8.3
13721555
13941582
1200
Wavenumber / cm-1
pH 6.2
pH 4.9
pH 3.0
pH 1.4 (aq)
1800 14001600
pH 11.4 (aq)
pH 8.3
13721555
13941582
1200
Wavenumber / cm-1
pH 6.2
pH 4.9
pH 3.0
pH 1.4 (aq)
Figure 4.8. ATR-FTIR spectra of hemimellitate on goethite and in aqueous solution at the pH indicated by the label. In Paper III, the infrared spectra of hemimellitate and trimesoate are used to assign surface complexes to these carboxylates. As for BTCA, the interpretations are mainly based on comparisons with spectra of hemimellitate and trimesoate in aqueous solution. In the aqueous spectra of hemimellitate in Figure 4.8, three dominating peaks are seen. The ones around 1550 and 1370 cm-1 are ascribed mainly to asymmetric and symmetric stretch vibrations of the carboxylate groups respectively. Both these peaks split in two when hemimellitate is sorbed to the surface. This sign of significant perturbation indicates – like in the tricarballylate discussion – inner sphere coordination and is most pronounced at low pH in this system. At pH 8.3, the spectrum of the sorbed species is very similar to the spectrum of the fully deprotonated ligand in solution. This is why we assign the complexation at high pH to an outer sphere species. In the trimesoate system, all peaks in the spectra of the sorbed species can be found in the spectra of the unprotonated and the protonated ligand in solution (Figure 4.9). Therefore, trimesoate most likely forms only outer sphere complexes on goethite, unprotonated around pH 5 and above and

20
partially protonated at lower pH. The protonation is seen from the peaks at 1714 and 1279 cm-1 (Figure 4.9).
1700 1500Wavenumber / cm-1
pH 11.4 (aq)
pH 5.7
pH 4.1
pH 3.1
pH 3.9
pH 1.4 (aq)
12791714
13001700 1500Wavenumber / cm-1
pH 11.4 (aq)
pH 5.7
pH 4.1
pH 3.1
pH 3.9
pH 1.4 (aq)
12791714
1300
Figure 4.9. ATR-FTIR spectra of trimesoate on goethite and in aqueous solution at the pH indicated by the label.

21
4.5 Summary of Carboxylate Surface Complexes A summary of the carboxylate surface complexes used in this work is presented in Figure 4.10. The arrows indicate the pH direction in which a surface complex becomes more pronounced. The abbreviations used are explained in the caption.
I.S. 2H+ - O.S.
O.S.I.S. 1
O.S.I.S.Phthalate34Oxalate33
H+ - O.S. O.S.I.S.
Pyromellitate35
Tricarballylate
Trimellitate27Hemimellitate
Citrate
H+ - O.S. O.S.
TrimesoateBTCA Mellitate36
Benzoate32
O.S. 1 O.S. 2
pH
I.S. 2H+ - O.S.
O.S.I.S. 1 I.S. 2H+ - O.S.
O.S.I.S. 1
O.S.I.S. O.S.I.S.Phthalate34Oxalate33
H+ - O.S. O.S.I.S.
H+ - O.S. O.S.I.S.
Pyromellitate35
Tricarballylate
Trimellitate27Hemimellitate
Citrate
H+ - O.S. O.S.H+ - O.S. O.S.
TrimesoateBTCA Mellitate36
Benzoate32
O.S. 1 O.S. 2O.S. 1 O.S. 2
pH Figure 4.10. A summary of carboxylate surface complexes. The arrows symbolize an increased importance of the indicated complex in the pH direction noted. Outer sphere complexes are abbreviated O.S, inner sphere complexes I.S., and protonated outer sphere complexes are abbreviated H+-O.S. The numbers 1 and 2 are included to differentiate between structurally different complexes of the same type.

22
4.6 Phosphate Surface Complexes
Atkinson37 and Parfitt et al.38 concluded the formation of phosphate complexes to consist of bidentate, binuclear bridging complexes. Tejedor-Tejedor and Anderson39 arrived at the same conclusion, with the addition of a protonated complex. According to Nilsson et al. and Persson et al.40, 41, however, phosphate probably forms three different monodentate complexes of which one is doubly protonated, one is singly protonated and one is fully deprotonated. Ongoing work in our research group confirms these findings. This ongoing work shows that phosphate and arsenate form equivalent surface complexes on the goethite surface, and arsenate has been shown to form un-, singly-, and doubly-protonated monodentate inner sphere surface complexes. All three complexes proved to be significantly strengthened by hydrogen bonding to neighbouring surface sites42.
In the 1000-1200 cm-1 region in the IR spectra the various P-O(H) generated peaks give information on the surface speciation of phosphate (Figure 4.11). At low pH, dominating peaks are seen at 1010 and 1125 cm-1. As pH is increased, the 1010 cm-1 peak experiences an upward shift whereas the 1125 cm-1 peak shifts downwards in frequency, resulting in peak positions of 1050 and 1083 cm-1 in the spectrum of the mainly deprotonated phosphate complex at pH 9.
100011001200
pH 3.2
pH 8.8
pH 4.6
y
Wavenumber / cm-1
1050
1083
1125
1010
100011001200
pH 3.2
pH 8.8
pH 4.6
y
Wavenumber / cm-1
1050
1083
1125
1010
Figure 4.11. ATR-FTIR spectra of phosphate adsorbed on goethite at pH values indicated by the legend.

23
5. Adsorption Reactions in the Competitive Systems This section summarises the findings from Papers III-IV. 5.1 Quantitative Effects Adsorption data was collected for phosphate and the organic acids in single ligand systems and in competitive systems including phosphate and one of the organic acids. The aims were to determine the quantitative effects on both phosphate and carboxylate adsorption and to study the molecular mechanisms of these surface interactions. 5.1.1 The Effect of Number of Carboxylic Groups A first series of carboxylates was used to investigate the effect of an increasing number of carboxylic groups on phosphate adsorption. This series of acids include oxalate, citrate, BTCA and mellitate. Adsorption data from the single ligand and the competitive systems are presented in Figure 5.1 and Paper III.
0
1
2
2 4 6 8 10
0
1
2
2 4 6 8 10
0
1
2
2 4 6 8 10
µmol
ads
. / m
2go
ethi
te
µmol
ads
. / m
2go
ethi
te
µmol
ads
. / m
2go
ethi
te
µmol
ads
. / m
2go
ethi
te
pH
pHpH
d) Mellitate c) BTCA
b) Citratea) Oxalate
pH
0
1
2
2 4 6 8 10
0
1
2
2 4 6 8 10
0
1
2
2 4 6 8 10
0
1
2
2 4 6 8 10
µmol
ads
. / m
2go
ethi
te
µmol
ads
. / m
2go
ethi
te
µmol
ads
. / m
2go
ethi
te
µmol
ads
. / m
2go
ethi
te
pH
pHpH
d) Mellitate c) BTCA
b) Citratea) Oxalate
pH
0
1
2
2 4 6 8 10
Figure 5.1. Adsorption of organic acid and phosphate as a function of pH. ○ denotes adsorption of the organic ligand in the single ligand system and • in the competitive system. denotes adsorption of phosphate in the phosphate-goethite system and in the competitive system. In the single ligand system, oxalate adsorption decreases almost linearly with increasing pH. When phosphate is introduced in the system, oxalate adsorption is greatly reduced and only a small amount is found on the surface

24
in the competitive system. Phosphate adsorption, on the other hand, is unaffected by the presence of oxalate. A similar reduction in carboxylate adsorption is seen in the citrate containing systems. In contrast to the oxalate-phosphate system, the adsorption of citrate in the competitive system does induce a small reduction in phosphate adsorption, an observation that was also made by Geelhoed et al.43. BTCA adsorption is also affected by the presence of phosphate, but less so than oxalate and citrate. In addition, it is seen from the more pronounced dip in the adsorption curve of phosphate from the competitive system that BTCA is a stronger competitor towards phosphate than the two smaller ligands. Mellitate – with six carboxylic groups – is by far the most successful competitor of the investigated carboxylates. This is seen both in mellitate adsorption, which is only slightly reduced in the competitive system, and in the phosphate adsorption, which is suppressed by over 50% in a wide pH range in the presence of mellitate. As with previous studies44-46, the findings from this series of carboxylates imply that an increased number of carboxylic groups does indeed increase the competitive ability of the organic acid towards phosphate. 5.1.2 The Effect of Carboxylate Group Positions A second series of carboxylates was used to investigate the importance of the number and the positions of the functional groups. A series of benzenecarboxylates was chosen as they provide the ability to change both the number of carboxylic groups and positions of these without altering the backbone structure of the molecule.
From the data presented in Figure 5.2A-B, it is seen that the adsorption of both benzoate and phthalate are considerably reduced in the presence of phosphate, although the difference for benzoate is less pronounced due to low adsorption in the single ligand system as well. Conversely, and in accordance with the conclusions from the previous section, it is evident that none of these ligands have any significant effect on phosphate adsorption, which agrees with previous findings from a similar phosphate-phthalate system47.

25
0
1
2
2 4 6 8 10
0
1
2
2 4 6 8 100
1
2
2 4 6 8 100
1
2
2 4 6 8 10
0
1
2
2 4 6 8 100
1
2
2 4 6 8 10µmol
pht
hala
te a
ds./m
2go
ethi
te
µmol
ben
zoat
e ad
s./m
2go
ethi
te
pHpH
BA
µmol
trim
ellia
tate
ads
./m2
goet
hite
µmol
hem
imel
litat
e ad
s./m
2go
ethi
te
µmol
trim
esoa
te a
ds./m
2go
ethi
te
pH pHpH
D FE
µmol
pyr
omel
litat
e ad
s./m
2go
ethi
te
pH
C
0
1
2
2 4 6 8 10
0
1
2
2 4 6 8 100
1
2
2 4 6 8 100
1
2
2 4 6 8 10
0
1
2
2 4 6 8 100
1
2
2 4 6 8 10µmol
pht
hala
te a
ds./m
2go
ethi
te
µmol
ben
zoat
e ad
s./m
2go
ethi
te
pHpH
BA
µmol
trim
ellia
tate
ads
./m2
goet
hite
µmol
hem
imel
litat
e ad
s./m
2go
ethi
te
µmol
trim
esoa
te a
ds./m
2go
ethi
te
pH pHpH
D FE
µmol
pyr
omel
litat
e ad
s./m
2go
ethi
te
pH
C
Figure 5.2. Adsorption of benzenecarboxylates and phosphate as a function of time, A) benzoate, B) phthalate, C) pyromellitate, D) trimellitate, E) hemimellitate and F) trimesoate. ○ denotes adsorption of the organic ligand in the single ligand system and • in the competitive system. denotes adsorption of phosphate in the phosphate-goethite system and in the competitive system.
The very different curvatures of the adsorption graphs of the three tricarboxylates (Figure 5.2D-F) show that the positions of the carboxylic groups are in fact essential to the adsorption behaviour. Trimellitate adsorption decreases almost linearly with increasing pH, hemimellitate adsorption has the same general trend but a softer slope, and the adsorption curves of trimesoate appear as slender, inverted s-shapes. Interestingly, in the competitive systems the shapes of these curves are approximately mirrored by a corresponding decrease in phosphate adsorption. In addition, the overall adsorption patterns of trimellitate are actually more similar to those of pyromellitate than to the other tricarboxylates (Figure 5.2C-F). This indicates that – from a surface coordination point of view – trimellitate looks more like pyromellitate than trimesoate or hemimellitate.
At pH around 4.5 the competitive effectiveness of these tri- and tetracarboxylates is in this order:
hemimellitate > trimellitate ≳ pyromellitate > trimesoate
Trimellitate, pyromellitate and hemimellitate all form inner sphere complexes, probably by using two carboxylic groups in bidentate, mononuclear chelate structures. Moreover, they all have additional carboxylic groups that can

26
stabilise a sorbed species by hydrogen bonding to the surface. Therefore, we deduce that it is the close proximity of the three groups in hemimellitate that renders this complex the ability to increase phosphate desorption. We also believe that the over all similarities in adsorption behaviour in both single and competitive systems of trimellitate and pyromellitate, show that there is little or no distinction in terms of competitiveness between surface complexes having one or two groups in a position two phenylic carbons from the mentioned inner sphere complex. Having none, however, affects the competitive ability negatively as seen in the phthalate systems.
At pH 3, the order of competitive effectiveness of the tri- and tetra carboxylates is changed, and trimesoate is the most effective competitor towards phosphate followed by hemimellitate, trimellitate and pyromellitate. A possible explanation is found in the infrared spectra (Figure 5.3 and Paper III). The average number of protons per molecule can be estimated from the relative intensities of the –COH originating peak at 1240-1280 cm-1, depending on ligand, and the peak between 1330 and 1380 cm-1 of the unprotonated carboxylate groups. The estimation for these carboxylates shows that trimesoate has a markedly higher degree of protonation than hemimellitate, trimellitate and pyromellitate at pH 3. Thus, protonated carboxylic groups are advantageous for competitive effectiveness.
5.2 Molecular Mechanisms Representative infrared spectra from the single ligand and the competitive systems are presented in Figure 5.3. Spectra were chosen for each ligand at a pH where that particular ligand has some competitive ability or co-adsorbs with phosphate. Due to the very low adsorption of benzoate in the competitive system, the spectra are too noisy to gain any information. Therefore, they are not included in this figure. For the other carboxylates, some interesting effects are noted.
The features ascribed by Persson and Axe33 to one inner sphere and one outer sphere complex are all seen in the spectrum of oxalate from the single ligand system (Figure 5.3A). In the spectrum from the competitive system however, only the inner sphere originating peaks are clearly discernible. As oxalate is not able to lower phosphate adsorption, this implies that it is the inner sphere complex that co-adsorbs with phosphate on the goethite surface and a plausible explanation is that these inner sphere complexes do not adsorb onto the same surface sites as the phosphate complexes do. One possibility is that phosphate adsorbs to the main {110} surface of goethite and oxalate adsorbs to the {021} plains of the edges of the crystals.
As for benzoate and oxalate, small amounts of phthalate adsorb in the competitive system, leading to poor signal-to-noise levels in the upper spectrum in Figure 5.3B. Compared to the lower spectrum in that figure (from the single ligand system) no apparent changes in speciation can be detected.
Citrate is the smallest of the investigated carboxylates that shows any competitive ability towards phosphate. A comparison of the spectra from single ligand and competitive systems for this acid reveals a change in

27
coordination. In the single ligand system, an inner sphere complex is found to coexist with an outer sphere complex at low pH (Paper I). In the competitive system, only the peaks due to the outer sphere complex are found (Figure 5.3C). Hence, it is the outer sphere complex of citrate that competes with phosphate.
Trimellitate and pyromellitate are both weak competitors towards phosphate, and consequently the spectra from these competitive systems, Figure 5.3D-E, display rather poor signal-to-noise depending on low carboxylate adsorption. There are, however, indications that the deprotonated outer sphere complexes dominate in these systems (see Paper III for details).
No change in carboxylate surface speciation is detected in the competitive system of hemimellitate compared to the corresponding single ligand system.
BTCA, trimesoate, and mellitate all form only outer sphere complexes on the goethite surface (Paper III, 36). In the pH range of successful competition towards phosphate, these carboxylates are partially protonated. From the spectra in Figure 5.3G-I, it is seen that the same speciation is found in the competitive systems as in the single ligand systems. In the competitive system of trimesoate and mellitate, a tendency is observed for the formation of more protonated species. This is seen from the higher relative intensities of the –COH originating peaks in comparison to the s
COν - peaks, illustrated by the dotted lines in Figure 5.3H-I. This finding supports the finding from the previous section that protonation is beneficial for the competitive ability of the carboxylates. This increased protonation also shows that an increased surface coverage by negatively charged ligands is compensated for by a larger number of protons. It is likely that the increased competitive effectiveness of the partially protonated complexes is due to the ability of these complexes to act both as proton acceptors and proton donors to neighbouring surface sites in hydrogen bonds.
28
a
b
a
b
a
b
F) HemimellitateD) Trimellitate
G) BTCA I) MellitateH) Trimesoate
E) Pyromellitate
a
b
a
b
a
b
1800 1600 1400 1200 1600 1400 1200 1600 1400 1200
Wavenumber / cm-1
B) Phthalate C) CitrateA) Oxalate
a
b
a
b
a
b
i.s.
o.s.
i.s.
o.s.
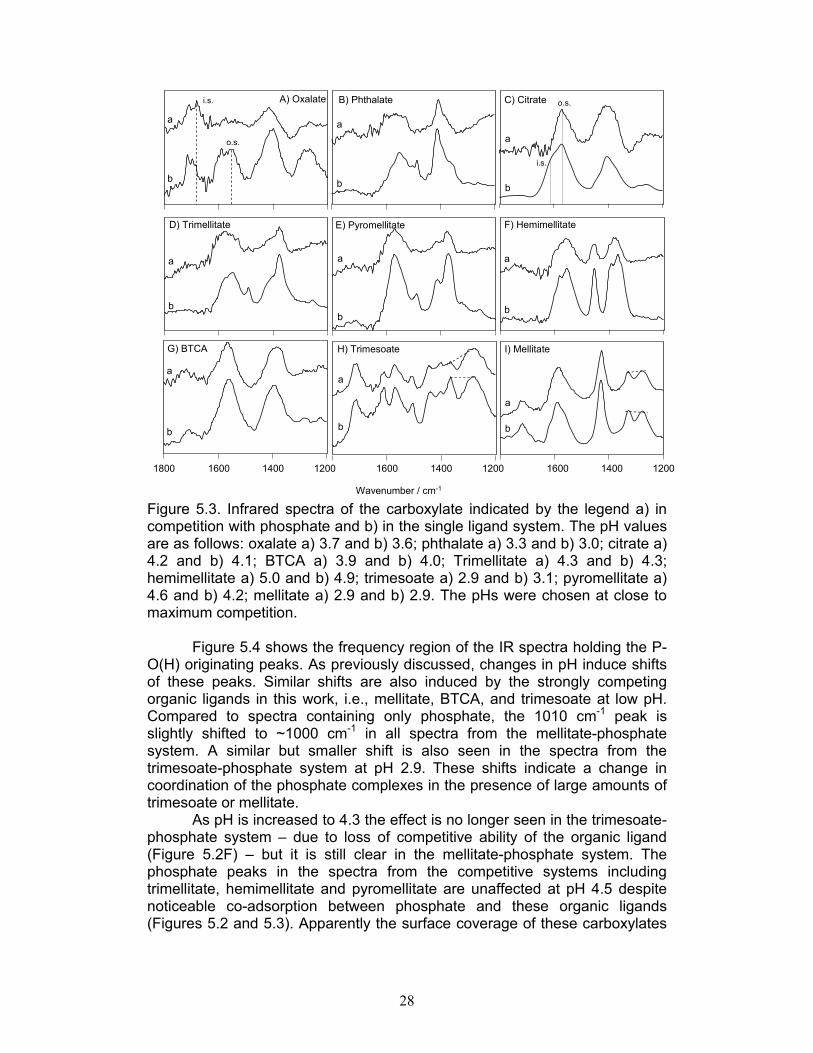
Figure 5.3. Infrared spectra of the carboxylate indicated by the legend a) in competition with phosphate and b) in the single ligand system. The pH values are as follows: oxalate a) 3.7 and b) 3.6; phthalate a) 3.3 and b) 3.0; citrate a) 4.2 and b) 4.1; BTCA a) 3.9 and b) 4.0; Trimellitate a) 4.3 and b) 4.3; hemimellitate a) 5.0 and b) 4.9; trimesoate a) 2.9 and b) 3.1; pyromellitate a) 4.6 and b) 4.2; mellitate a) 2.9 and b) 2.9. The pHs were chosen at close to maximum competition.
Figure 5.4 shows the frequency region of the IR spectra holding the P-O(H) originating peaks. As previously discussed, changes in pH induce shifts of these peaks. Similar shifts are also induced by the strongly competing organic ligands in this work, i.e., mellitate, BTCA, and trimesoate at low pH. Compared to spectra containing only phosphate, the 1010 cm-1 peak is slightly shifted to ~1000 cm-1 in all spectra from the mellitate-phosphate system. A similar but smaller shift is also seen in the spectra from the trimesoate-phosphate system at pH 2.9. These shifts indicate a change in coordination of the phosphate complexes in the presence of large amounts of trimesoate or mellitate.
As pH is increased to 4.3 the effect is no longer seen in the trimesoate-phosphate system – due to loss of competitive ability of the organic ligand (Figure 5.2F) – but it is still clear in the mellitate-phosphate system. The phosphate peaks in the spectra from the competitive systems including trimellitate, hemimellitate and pyromellitate are unaffected at pH 4.5 despite noticeable co-adsorption between phosphate and these organic ligands (Figures 5.2 and 5.3). Apparently the surface coverage of these carboxylates

29
in the competitive systems is not high enough to affect the phosphate speciation.
BTCA, on the other hand, can affect the phosphate peaks at pH 4.9; there is a small increase in the relative intensity of the 1010 cm-1 peak in the spectrum from the competitive system. As this spectrum is collected at a higher pH value than the phosphate only spectrum, a higher degree of phosphate protonation is evident in the presence of BTCA. No effect is seen in the spectra from the BTCA-phosphate system at pH 3.5 or 6.3 where BTCA has little or no competitive ability (spectra not shown).
i
j
h
k
g
fed
c
b
a
1210 1130 1050 970Wavenumber / cm -1
1050 1010
i
j
h
k
g
fed
c
b
a
1210 1130 1050 970Wavenumber / cm -1
1050 1010
Figure 5.4. Infrared spectra of phosphate adsorbed on the surface of goethite at pH a) 5.8 in presence of mellitate b) in absence of carboxylates, c) 4.5 in presence of mellitate d) 4.6 in presence of pyromellitate, e) 4.3 in presence trimesoate, f) 4.3 in presence of trimellitate, g) 4.4 in presence of hemimellitate h) 4,6 in absence of carboxylates, i) 2.9 in presence of mellitate, j) 2.9 in presence of trimesoate, and k) 2.8 in absence of carboxylates.
Thus, the collective information from the quantitative and qualitative evaluations infer that inner sphere carboxylate complexes are able to co-exist with phosphate on the goethite surface while outer sphere complexes – particularly protonated species - are able to successfully compete for surface sites. This successful competition seems to be caused mainly by hydrogen bond interactions and competition for either H-acceptor or H-donor sites, depending on pH.

30
6. Desorption Reactions Involving Carboxylic Acids In Paper V, the desorption of nine benzenecarboxylates was studied at pH 5. The experiments were carried out in the SIPT set-up (Figure 3.3), rendering a series of spectra showing how the carboxylate adsorption and speciation varies as a function of time and surface coverage. All collected spectra were baseline corrected and integrated over the frequency range of the s
COν of each ligand. The achieved area was normalized against the area of the spectrum collected at time zero and is shown as a function of time in Figure 6.1.
The lability of surface complexes of the carboxylates judged by the amount remaining on the surface after 14 hours of reaction time is noted below:
mellitate < hemimellitate < trimellitate ≲ pyromellitate < trimesoate < isophthalate ≲ phthalate ≲ terephthalate < benzoate
40 8 120
0.4
0.6
0.8
1Mellitate
BenzoateIsophthalate
Terephthalate
PhthalateTrimesoate
Trimellitate
Hemimellitate
Pyromellitate
Time / hours
Nor
mal
ized
are
a
40 8 120
0.4
0.6
0.8
1Mellitate
BenzoateIsophthalate
Terephthalate
PhthalateTrimesoate
Trimellitate
Hemimellitate
Pyromellitate
Time / hours
Nor
mal
ized
are
a
Figure 6.1. Area of adsorbed species normalized against the spectrum collected at time zero as a function of time. To investigate the changes in speciation over time, all spectra of each ligand were subtracted from the corresponding time zero spectrum to produce a series of difference spectra. These difference spectra display the features of the desorbing species. In Figure 6.2, a representative selection of these spectra are displayed together with the time zero spectrum – showing the

31
features of the initially adsorbed species – and the final spectrum that shows the features of the species persisting on the surface towards the end of the experiments.
75 h
Difference spectra
Wavenumber / cm-1
1800 1600 1400 1200
75 h17.5 h
6.6 h2.6 h1.1 h
30 min
0 minutes
75 h
Difference spectra
Wavenumber / cm-1
1800 1600 1400 1200
75 h17.5 h
6.6 h2.6 h1.1 h
30 min
0 minutes
A
12 min5.0 min2.9 min1.1 min
12 min
Difference spectra
Wavenumber / cm-1
1800 1600 1400 1200
0 minutes
B
12 min5.0 min2.9 min1.1 min
12 min
Difference spectra
Wavenumber / cm-1
1800 1600 1400 1200
0 minutes
B
40.8 h
Wavenumber / cm-1
Differencespectra
1800 1600 1400 1200
0 minutes
40.8 h26.0 h16.4 h8.7 h4.9 h2.6 h1.0 h
15 min
40.8 h
Wavenumber / cm-1
Differencespectra
1800 1600 1400 1200
0 minutes
40.8 h26.0 h16.4 h8.7 h4.9 h2.6 h1.0 h
15 min
C
40 h
Wavenumber / cm-1
Difference spectra
1250 1150 1050 950
0 minutes
48 h9.3 h6.0 h2.6 h1.1 h
20 min
D
Figure 6.2. ATR-FTIR spectra of A) mellitate, B) benzoate, C) hemimellitate, and D) phosphate collected at time zero and after A) 75 hours, B) 12 minutes, C) 40.8 hours, and D) 40 hours. In the difference spectra the spectrum collected after the times indicated by the label is subtracted from the time zero-spectrum.
32
The most rapid desorption is seen in the benzoate system where both types of outer sphere surface complexes32 are sufficiently labile to leave the surface in less than 12 minutes (Figure 6.2B). On the other extreme, only 9% of the outer sphere complexes of mellitate36 desorb in the first 14 hours of reaction time (Figure 6.1); from the difference spectra in Figure 6.2A it is seen that it is preferentially the protonated surface species that desorb. This preferential desorption of protonated complexes is also seen in the spectra of trimesoate, pyromellitate, and trimellitate in Paper IV. In the hemimellitate, phthalate and probably the terephthalate systems, both inner-, and outer sphere complexes desorb simultaneous (Paper IV).
No correlation was found between types of surface complex, i.e. inner- or outer sphere, and rate of desorption, but there did seem to be a correlation between the number of contact points between the ligand and the surface and the lability of the complex, that is: fewer points seemed to increased the lability. It is also clear, from the difference spectra in Figure 6.2 and Paper IV, that protonated species are more labile than fully deprotonated analogues.
Also included in Figure 6.2 are the spectra from a phosphate desorption experiment at pH 5.0. From the spectra in this figure, it is clear that the doubly-protonated phosphate complex is the most labile. A mixture of protonation states are seen in the spectrum collected at time zero, whereas the difference spectra almost exclusively contain features originating from the doubly-protonated complex, and at the end of the experiment primarily deprotonated species remain on the surface.
33
7. Adsorption Reactions Involving Phosphate from Fluorapatite As already mentioned in the introduction, fluorapatite (FAP) and goethite both commonly occur in soils throughout the world where FAP is a source of phosphate and goethite can act as a phosphate sink. Paper V was designed to investigate the potentially goethite induced FAP dissolution. By making series of batches with varying FAP/goethite ratios, knowledge was gained about dissolution, adsorption and phase transformations in this system.
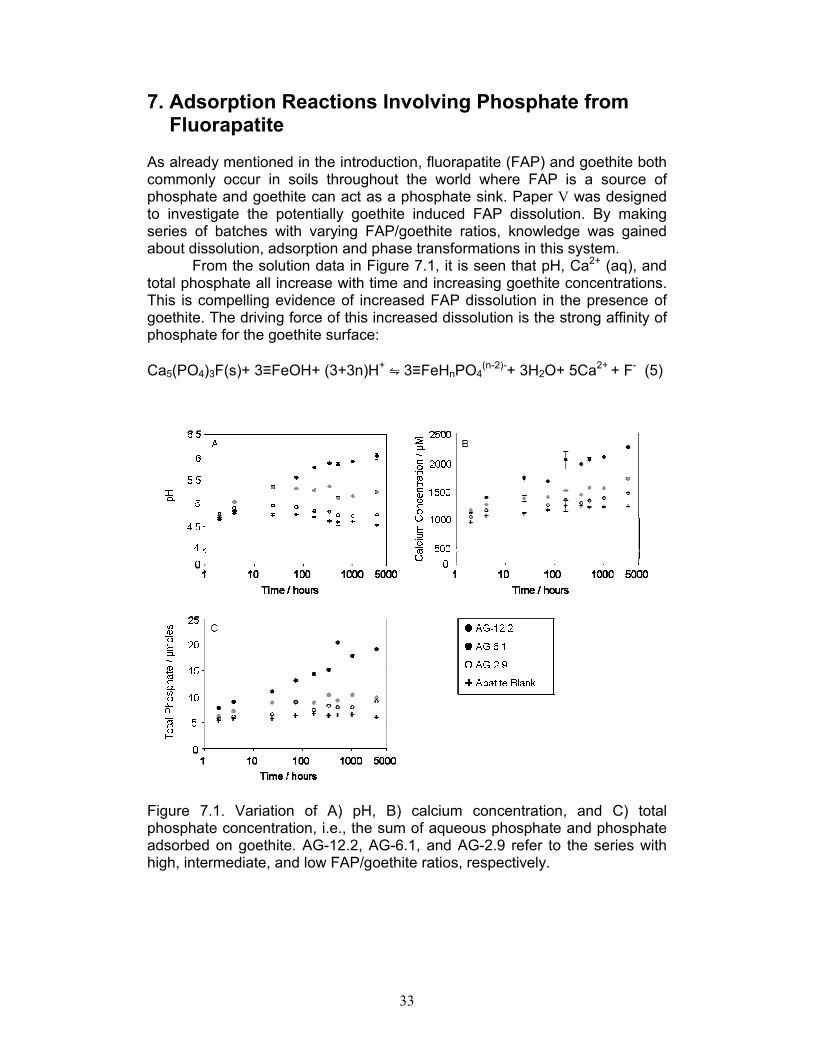
From the solution data in Figure 7.1, it is seen that pH, Ca2+ (aq), and total phosphate all increase with time and increasing goethite concentrations. This is compelling evidence of increased FAP dissolution in the presence of goethite. The driving force of this increased dissolution is the strong affinity of phosphate for the goethite surface: Ca5(PO4)3F(s)+ 3≡FeOH+ (3+3n)H+ ⇋ 3≡FeHnPO4
(n-2)-+ 3H2O+ 5Ca2+ + F- (5)
Figure 7.1. Variation of A) pH, B) calcium concentration, and C) total phosphate concentration, i.e., the sum of aqueous phosphate and phosphate adsorbed on goethite. AG-12.2, AG-6.1, and AG-2.9 refer to the series with high, intermediate, and low FAP/goethite ratios, respectively.
34
Ref B
129 days
42 days
21 days
7 days
72 h
24 h
4 h
2 h
15 days
B
Ref A
129 days
42 days
21 days
7 days
72 h
24 h
4 h
2 h
15 days
A
Ref B
129 days
42 days
21 days
7 days72 h
24 h4 h
2 h
C
1200 1100 1000100010001100 11001200 1200
Wavenumber / cm-1
Ref B
129 days
42 days
21 days
7 days
72 h
24 h
4 h
2 h
15 days
B
Ref B
129 days
42 days
21 days
7 days
72 h
24 h
4 h
2 h
15 days
B
Ref A
129 days
42 days
21 days
7 days
72 h
24 h
4 h
2 h
15 days
A
Ref B
129 days
42 days
21 days
7 days72 h
24 h4 h
2 h
C
Ref B
129 days
42 days
21 days
7 days72 h
24 h4 h
2 h
C
1200 1100 1000100010001100 11001200 1200
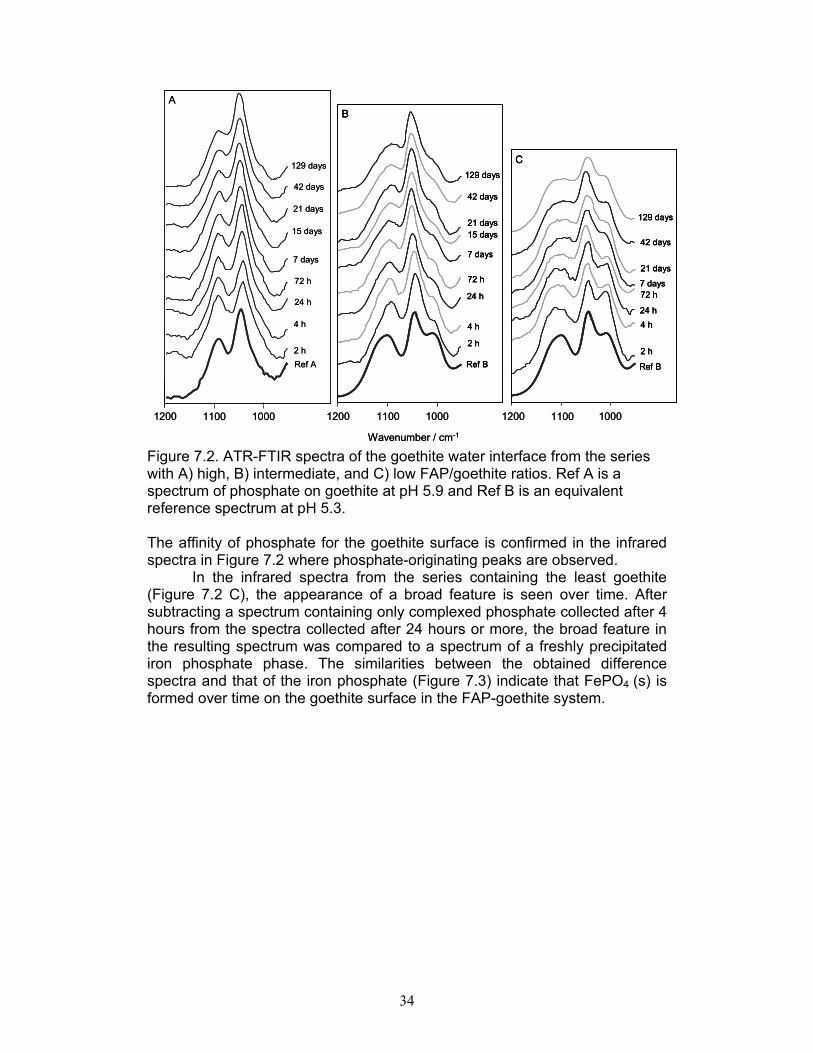
Wavenumber / cm-1 Figure 7.2. ATR-FTIR spectra of the goethite water interface from the series with A) high, B) intermediate, and C) low FAP/goethite ratios. Ref A is a spectrum of phosphate on goethite at pH 5.9 and Ref B is an equivalent reference spectrum at pH 5.3. The affinity of phosphate for the goethite surface is confirmed in the infrared spectra in Figure 7.2 where phosphate-originating peaks are observed.
In the infrared spectra from the series containing the least goethite (Figure 7.2 C), the appearance of a broad feature is seen over time. After subtracting a spectrum containing only complexed phosphate collected after 4 hours from the spectra collected after 24 hours or more, the broad feature in the resulting spectrum was compared to a spectrum of a freshly precipitated iron phosphate phase. The similarities between the obtained difference spectra and that of the iron phosphate (Figure 7.3) indicate that FePO4 (s) is formed over time on the goethite surface in the FAP-goethite system.

35
Figure 7.3. a) Spectrum of a precipitated phosphate phase and the remaining features of the IR spectra after subtracting the spectrum from the experimental point withdrawn after 4 h from the spectra of samples withdrawn after b) 129 days, c) 21 days and d) 15 days e) 24 h.

36
8. Conclusions By combining quantitative adsorption data and spectroscopic evaluations of surface complexes, a better insight to the competitive interactions between phosphate and carboxylic acids has been gained. In agreement with previous studies it was found that an increasing number of carboxylic groups is important to the competitive ability of the organic acids towards phosphate, but it was also shown that the positions of the groups are highly relevant to this ability, and more specifically the tight arrangement of the groups is most effective. In addition, partially protonated species were shown to be more competitive than fully deprotonated equivalents at low pH. This effectiveness is attributed to the ability to act both as proton donors and acceptors in hydrogen bond formation. For many of these carboxylates, it is also interesting to note that the effective competition towards phosphate coincides with the pH range where phosphate is doubly protonated. Another central finding in this work is that competitive interactions do not necessarily involve ligand-exchange reactions between inner sphere surface complexes. Instead, we find that it is mainly the outer sphere carboxylate complexes that effectively out-compete phosphate inner sphere complexes, whereas the inner sphere carboxylate complexes can co-exist with phosphate to a larger extent. The order of increasing lability of the surface complexes of the benzenecarboxylates were found to match the order in which they decrease in competitive ability towards phosphate at pH 5. In addition, protonated complexes were found to be more labile than deprotonated counterparts and the number of contact points was identified as essential to lability. In addition, this thesis demonstrates the ability of goethite to increase the dissolution of fluorapatite mainly through the high affinity of the phosphate ions for the goethite surface.

37
9. References 1 Gross K A & Berndt C C 2002 Biomedical application of apatites. In Phosphates,
geochemical, geobiological, and materials importance, Vol. 48 Mineralogical Society of America, Washington D C
2 Marklund K 1991 Nationalencyclopedin Peak 6 Bokförlaget Bra Böcker AB, Höganäs
3 Hinsinger P 2001 Bioavailability of soil inorganic P in the rhizosphere as affected by root-induced chemical changes: a review Plant and Soil, 237, 173-195
4 Reddy K R, Kadlec R H, Flaig E & Gale P M 1999 Phosphorus retention in streams and wetlands: A review Critical reviews in Environmental Science and Technology, 29, 83-146
5 Howarth R W & Marino R 2006 Nitrogen as the limiting nutrient for eutrophication in costal marine ecosystems: Evolving views over three decades Limnology and Oceanography 51, 364-376
6 Föllmi K B 1996 The phosphorus cycle, phosphogenesis and marine phosphate-rich deposits Earth-Science Reviews 40, 55-124
7 Compton J, Mallinison D, Glenn C R, Filippelli G, Föllmi K, Shields G & Zanin Y 2000 Variation in the global phosphorus cycle. Marine authigenesis: From global to microbial, SEPM (Society for Sedimentary Geology) Special Publication 66, 21-33 in Jordan et al. 8
8 Jordan T E, Cornwell J C, Boynton W R & Anderson J T 2008 Changes in phosphorus biogeochemistry along an estuarine salinity gradient: The iron conveyer belt Limnology and oceanography 53, 172-184
9 Hoffland E, Findenegg G R & Nelemans J A 1989 Solubilisation of rock phosphate by rape. II. Local root exudation of organic acids as a response to P-starvation Plant and Soil 113, 161-165
10 Keerthisinghe G, Hocking P J, Ryan P R & Delhaize E 1998 Effect of phosphorus supply on the formation and function of proteoid roots of white lupin (Lupinus albus L.) Plant, Cell & Environment 21, 467-478
11 Neumann G & Römheld V 1999 Root excretion of carboxylic acids and protons in phosphorus-deficient plants Plant and Soil 211, 121-130
12 Zhang F S Ma J & Cao Y P 1997 Phosphorus deficiency enhances root exudation of low-molecular weight organic acids and utilization of sparingly soluble inorganic phosphates by radish (Raghanus satiuvs L.) and rape (Brassica napus L.) plants, Plant and Soil 196, 261-164
13 Lipton D S, Blanchar R W & Blevins D G 1987 Citrate, Malate, and Succinate Concentration in Exudates from P-Sufficient and P-Stressed Medicago sativa L. Seedlings, Plant Physiology 85, 315-317
14 Imas P, Bar-Yosef B, Kafkafi U & Ganmore-Neumann R 1997 Phosphate induced carboxylate and proton release by tomato roots Plant and Soil, 191, 35-39
15 Radersma S & Grierson P F 2004. Phosphorus mobilization in agroforestry: Organic anions, phosphatase activity and phosphorus fractions in the rhizosphere Plant and Soil 259, 209-219
16 Ali M A & Dzombak D A 1996 Competitive Sorption of Simple Organic Acids and Sulfate on Goethite Environmental Science and Technology 30, 1061–1071
17 Schwertmann U & Taylor R M 1977 Minerals in soil environments Ch. 5 Soil Science Society of America Inc. Madison, Wisconsin
18 Garrels R M & Mackenzie F T 1971 Evolution of sedimentary rocks W.W. Norton & Company Inc. New York
19 Boily J F, Lüzenkirchen J, Balmes O, Beattie J & Sjöberg S 2001 Modeling proton binding at the goethite (alpha-FeOOH)-water interface Colloids and surfaces. A, Physicochemical and engineering aspects 179, 11-27

38
20 Filippelli G M 2002. Phosphates: Geochemical, Geobiological, and Material Importance. Reviews in Mineralogy and geochemistry vol. 48. Ch. 10 Mineralogical Society of America, Washington D C
21 Rakovan J 2002 Growth and surface properties of apatite. In Phosphates – Geochemical, Geobiological, and materials importance, Vol 48 Mineralogical Society of America, Washington D C
22 Marklund K 1990 Nationalencyclopedin Peak 4 Bokförlaget Bra Böcker AB, Höganäs
23 Marklund K 1994 Nationalencyclopedin Peak 14 Bokförlaget Bra Böcker AB, Höganäs
24 Saiz-Jimenez C 1994 Pyrolysis/Methylation of soil fulvic acids: Benzenecarboxylic acids revisited, Environmental Science and Technology 26, 197-200
25 Apelblat A, Manzurola E & Balal N A 2006 The solubilities of benzene polycarboxylic acids in water Journal of Chemical Thermodynamics 38, 565-571
26 Noda I & Yukihiro O 2005 Two-Dimensional correlation spectroscopy - Applications in vibrational and optical spectroscopy John Wiley & Sons Ltd, Chichester
27 Boily J F, Nilsson N, Persson P & Sjöberg S 2000 Benzenecarboxylate surface complexation at the goethite (alpha-FeOOH)/water interface: I. A mechanistic description of pyromellitate surface complexes from the combined evidence of infrared spectroscopy, potentiometry, adsorption data, and surface complexation modeling Langmuir 16, 5719-5729
28 Colthup N B, Daly L H & Wiberley S E 1990 Introduction to Infrared and Raman Spectroscopy 3 rd ed. Academic Press, San Diego
29 Axe K & Persson P 2001 Time-dependent surface speciation of oxalate at the water-boehmite (γ-AlOOH) interface: Implications for dissolution Geochimica et Cosmochimica Acta 65, 4481-4492
30 Nordin J, Persson P, Laiti E & Sjöberg S 1997 Adsorption of o-Phthalate at the Water- Boehmite (γ-AlOOH) Interface: Evidence for Two Coordination Modes Langmuir 13, 4085-4093
31 Nordin J, Persson P, Nordin A. & Sjöberg S 1998 Inner-Sphere and Outer-Sphere Complexation of a Polycarboxylic Acid at the Water-Boehmite (γ-AlOOH) Interface: A Combined Potentiometric and IR Spectroscopic Study Langmuir 14, 3655-3662
32 Norén K & Persson P 2007 Adsorption of monocarboxylates at the water/goethite interface: The importance of hydrogen bonding Geochimica et Cosmochimica Acta 71, 5717-5730
33 Persson P & Axe K 2005 Adsorption of oxalate and malonate at the water-goethite interface: molecular surface speciation from IR spectroscopy. Geochimica et Cosmochimica Acta 69, 541-552
34 Persson P, Nordin J, Rosenqvist J, Lövgren L & Sjöberg S 1998 Comparison of the adsorption of o-phthalate on boehmite, aged Al2O3 and goethite Journal of Colloid and Interface Science 206, 252-266
35 Boily J F, Persson P, & Sjöberg S 2000 Benzenecarboxylate surface complexation at the goethite (alpha-FeOOH)/water interface: II. Linking IR spectroscopic observations to mechanistic surface complexation models for phthalate, trimellitate, and pyromellitate Geochimica et Cosmochimica Acta 64, 3453-3470
36 Johnson B B, Sjöberg S & Persson P 2004 Surface complexation of mellitic acid to goethite: An attenuated total reflection Fourier transform infrared study Langmuir 20, 823-828

39
37 Atkinson R J, Parfitt R L & Smart R C 1974 Infra-Red Study of Phosphate Adsorption on Goethite Journal of Chemical Society Faraday Transaction I 70, 1472-1479
38 Parfitt R L, Russel J D & Farmer V C 1976 Confirmation of the Structure of Goethite (α-FeOOH) and Phosphated Goethite by Infrared Spectroscopy Journal of Chemical Society Faraday Transaction I 72, 1082-1087
39 Tejedor-Tejedor I M & Anderson M A 1990 Protonation of Phosphate on the Surface of Goethite As Studied by CIR-FTIR and Electrophoretic Mobility. Langmuir, 6, 602-611
40 Nilsson N, Lövgren L & Sjöberg S 1992 Phosphate Complexation at the Surface of Goethite. Chemical Speciation and Bioavailability 4, 121-130
41 Persson P, Nilsson N & Sjöberg S 1996 Structure and bonding of orthophosphate ions at the iron oxide aqueous interface Journal of Colloid and Interface Science 177, 263-275
42 Loring J S, Sandström M H, Norén K & Persson P 2009 Rethinking Arsenate Coordination at the Surface of Goethite Chemistry: a European Journal 15, 5063-5072
43 Geelhoed J S, Hiemstra T & Van Riemsdijk W H 1998 Competitive interaction between phosphate and citrate on goethite Environmental Science and Technology 32, 2119-2123
44 Parfitt R L 1979 The Availability of P from Phosphate-Goethite Bridging Complexes. Desorption and Uptake by Ryegrass Plant and Soil 53, 55-65
45 Hu H Q, He J Z, Li X Y & Liu F 2001 Effect of several organic acids on phosphate adsorption by variable charge soils of central China Environment International 26, 353-358
46 Johnson S E & Loeppert R H 2006 Role of organic acids in phosphate mobilization from iron oxide Soil Science Society of America Journal 70, 222-234
47 Nilsson N, Persson P, Lövgren L & Sjöberg S 1996 Competitive surface complexation of o-phthalate and phosphate on goethite (a-FeOOH) particles Geochimica et Cosmochimica Acta 60, 4385-4395