aquarium lighting and resource monitor - ucf … · web viewaquarium lighting and resource monitor...
TRANSCRIPT

UNIVERSITY OF CENTRAL FLORIDA
Aquarium Lighting and Resource MonitorGroup 18 Senior Design I Paper
Loren Robinson, Britt Phillips, Kameron Lewis, Jeff Masson
12/5/2012

1
Chapter 1 Introduction
1.1 Executive SummaryThe acquisition of saltwater aquariums has become a popular hobby across the world, but can sometimes be expensive. Although expensive, the satisfaction provided to aquarists who have one is priceless. The mechanical operations of saltwater aquariums can lead to mass amounts of power usage, which usually goes unmonitored and uncontrolled. A majority of this power usage is used in the operation of the lighting system and the filtration system. An aquarium is essentially a lighting system, a filtration system, and a heater, which monitor and maintain certain parameters of the aquarium. The two most significant parameters are the temperature and pH of the water.
The ALARM system will aid avid saltwater aquarists not only with the maintenance of their saltwater aquariums, but also with monitoring and conserving electric power. The information and functions provided to the user from the ALARM system will be critical in helping the user become aware of ways power can be conserved, while also helping better maintain their saltwater aquarium health. The parameters that the ALARM system will monitor are power usage, temperature, and pH. These parameters will be continuously monitored and presented to the user through an online web interface. This online website will be a key feature of the ALARM system. The website will provide the user a valuable graphical interface with the aquarium. This information cannot be gained with other aquariums that do not utilize an online interface. The website will effectively display the power usage, temperature and pH of the aquarium through graphs which show the fluctuation of these parameters over several months. It is anticipated that through these valuable graphs the user will be better able to make conscious decisions about ways in which they can better conserve power.
Another key feature of the website will be ability of the user to control the lighting system of the saltwater aquarium. Through the website the user will be able to set a custom schedule for the lighting system, which will eliminate the need for the user to remain physically near their aquarium to turn the lights on or off. The lighting system of an aquarium typically requires the most power; therefore, the ability to remotely control the lights online will save a considerable amount of energy and effort. Typically saltwater aquarists prefer to keep their lights on rather than off when they are away from their aquariums for an extended amount of time. Additionally, not only will power be saved by the lighting system through the website, but also through the use of PV panels which will power the lighting system and the use of LEDs instead of other high-power consuming bulbs. For convenience the user will be given the option of manually controlling the lighting system also.

2
Along with limiting the power usage of the lighting system, the ALARM system will monitor the power usage of other elements of an aquarium such as the pumps, heaters, and power heads. When pumps stay in water for a long period of time they become less efficient because of a buildup of organic and inorganic materials. When this happens the ALARM system will send an alert to the user letting them know that the pump should be cleaned out. This will provide better circulation throughout the aquarium and help limit power consumption. Another feature of the ALARM system that will alert the user is a leak detector. The leak detector can save an aquarium and personal property in the event of an overflow or cracked tank. These alerts will be sent to the user through a front display panel and through email. The front display panel will also display the temperature and pH of the system, along with the current date and time.
Finally, the ALARM system will allow the user to place the aquarium in a ‘feed mode’. This feed mode will help keep food from being blown into the filtration system before eaten, reducing the amount of food needed to adequately feed the inhabitants of the aquarium. It will also limit the excess nutrients in the tank. Through this and the above stated features the ALARM will effectively monitor and conserve valuable resources and energy.
1.2 Motivation and GoalsHaving an aquarium is one of the most popular hobbies in the United States and around the world. There are over nine million aquariums in the United States alone. A large portion of these aquariums use antiquated and inefficient lighting systems with little to no water quality monitoring. This leads to a large power bill and lower quality of life for the inhabitants of the aquariums. Americans own approximately 9 million saltwater fish. Poor water quality and temperature swings are two of the major factors that lead to deaths of millions of fish each year. Our goal is to help eliminate these unneeded deaths, and help modernize the hobby at a reasonable cost to the user.
Having aquarium owners in our group provides great insight into the practical issues associated with the hobby. One of the key issues is the need to be physically near the aquarium in order to maintain the correct lighting and water conditions. The ALARM provides a practical solution to the issues that have been frustrating aquarists and may also result in new interest in the hobby.
Lighting systems of aquariums differ in the duration in which certain lights are left on or off. Most are manually operated, requiring the owner to manually turn the lights on or off at desired times. The group has found that this can lead to several problems when the owner of the aquariums is unable to turn off the lights due to being out of town or gone for the night. The end result is the owner will usually leave the lights on and waste power for an extended amount of time that the lights could actually be off. This is usually the case with saltwater aquariums that contain coral, which require a certain amount of light each day. Instead of

3
depriving these expensive corals of the required lights they need and risk them dying, the lead result is an unneeded waste energy which can be averted by using the ALARM system lighting controls.
Another area where energy is commonly wasted is in the filtration system of aquariums. The filtration system consists of several pumps and power heads that help circulate the water of the aquarium through certain chemical and physical media to be purified of waste. These pumps and power heads are usually kept on at all times and require cleaning every three to six months. When these pumps become clogged with algae or waste they require more power than to run at normal conditions. A significant amount of power can be saved if these pumps and power heads were monitored and the owner was notified when these parts needed cleaning. These pumps and power heads could also be shut down when the fish were fed; preventing some of the food from immediately being circulated into the filtration system or stuck in the pumps and power heads before the inhabitants of the aquarium have a chance to eat them.
The group’s goal is to come up with solutions to the problems stated above that will help conserve power and allow for a user interface with the aquarium that can aid in the control of these systems. The group is looking for the ALARM design to be easy to operate; monitor the temperature, pH, and any water leaks; monitor the power consumption of the lighting system, heaters, and filtration system; and to allow users interface with the system not only through a display on the front of the aquariums, but also through the internet. The ALARM system will accept inputs from sensors, the users, power inputs, including one from a PV panel, and the networking subsystem. The ALARM system will output power management/controls, network information, and data to a front display as well as information to an online database.
The different sensors that the group will install into the ALARM system are temperature sensors, a pH sensor, a leak detection sensor and current sensors to measure power consumption. The temperature sensor would monitor the temperature of the water, which must stay within a couple of degrees of an optimal temperature which is different for different aquarium biomes. It is not desirable for the temperature to vary much because certain organisms in an aquarium can only live within a certain temperature range, and drastically varying temperature can cause unwanted stress, which could lead to death. The temperature of the system does not have to be polled continuously Because the temperature of a system will not change drastically over the course of a couple of minutes; therefore the temperature can be polled only every several minutes to increase the lifespan of the temperature sensor. The pH sensor would monitor the pH through a pH probe, which like the temperature must stay within a certain range for different aquariums biomes. Like the temperature sensor, the pH probe does not have to be polled continuously either. The pH of a system varies throughout the day and is usually the lowest in the morning because of the

4
temperature of the aquarium. Therefore, if the pH is polled every couple of hours this would increase the lifespan of the temperature probe.
Additionally, the ALARM system will incorporate a leak detection sensor that would alert the owner of any kind of leak or overflow from the aquarium. If caught early enough, this detection could potentially save an aquarium from being ruined. We also want to install some current sensors to monitor the power consumption of the lights, the heater and the power heads. The monitoring of power consumption can be a powerful tool to the owner by providing insight into how much power different parts of their aquarium are consuming during different time periods. This data will be displayed in graphs through an online website so the user can track the power consumption during different times of the year.
The ALARM system will be able to accept user input from the website and from a front display panel at the front of the aquarium. The front display will contain a feed mode push button. This feed mode will cut off all the power heads and pumps in the aquarium to allow the organisms’ being feed to actually eat all of the food, instead of some of the food being immediately blown into the filtration system. This feed mode will be automatically set to end after a few minutes after the feed mode button has been pressed. The group also wants the user to have the capability to control the lighting system over the web or through a push button on the front display. This will be convenient for the user by allowing them to turn their lights on or off when they don’t have direct access to their aquarium, yet still allowing them to quickly change settings without a computer. This controlling of the lightening system will save a significant amount of energy as explained earlier. We also want to allow the user not only to be able turn the lights on and off, but also vary the intensity of the lighting system which, will also lead to the energy conservation
Aquariums can be expensive and mean a lot to their owners. The group wants to provide these owners with a product that communicates the status of their aquarium at all times and at any place through the web. We strongly believe that this communication can be a vital factor in the health of these aquariums and in saving energy that is commonly wasted in the operation of aquariums. The group believes that the ALARM system will provide better living conditions for the aquarium inhabitants, lower the power usage of the aquarium, and allow the user to have more information and control of their aquarium.

5
Chapter 2 Specifications and Requirements
2.1 Functional RequirementsIn the daily operation of saltwater aquariums the potential for better resource management is substantial. The ALARM system must provide the user with several features that will aid in the monitoring and control of their saltwater aquarium. The control and monitoring ability of the ALARM system will provide better insight into the operation of saltwater aquariums. The ALARM system must provide different features that provide different functions and through these features it is strongly believed that several resources, especially power, will be saved in the operation of saltwater aquariums. The power usage of an aquarium and different power saving techniques can be vital to a user that wants to save energy while operating their saltwater aquarium and the ALARM system will need to offer that.
The ALARM system will not only need to be capable of measuring the pH of a saltwater aquarium, but also will need to be capable of measuring the temperature of the aquarium. Both the temperature and pH will need to be displayed at the aquarium and through an online website. The history of the pH and temperature of the aquarium will need to be available to the user through the online ALARM website over an expanded period of time. The ALARM system will need to be capable of monitoring the power used by the heaters, pumps, lights and power heads of the saltwater aquarium. Just as history of the temperature and pH will need to be kept and displayed on the online website; so will the power used by the heaters, pumps, lights and power heads. The temperature, pH, and power usage of the power heads, pumps, lighting and heater will need to be presented to the user on the website through charts and graphs. The charts and graphs will need to show the change in these different parameters over a specified span of time. This span of time will need to be long enough so that data will actually be beneficial to the user.
Additionally, the ALARM system will need provide the necessary lighting for the inhabitants of a small saltwater aquarium through a low power lighting system. The lighting system will need to be made with the most power efficient bulbs to save energy. The lighting system will need to consist of white and blue bulbs that can be dimmed separately and controlled in two different manners. The first manner will need to allow the user dim the bulbs while at the aquarium. The second manner will need to allow the user to access the control for dimming the lights while not being physically near the aquarium through a web site. On the website the user will need to be able to create a custom lighting schedule for the lighting system. To save even more energy the lighting system will need to be powered by a PV panel when conditions permit.

6
Finally, The ALARM will need to display different parameters of the saltwater aquarium through a front display. Along with these different parameters, the date, time and certain alerts will also need to be displayed through the front display. The ALARM will need to be capable of detecting leaks; therefore, when a leak occurs an alert will need be sent to the user through the front display and the online website. Another alert that will need to be displayed through the front display is an alert that will notify the user when a power head or pump needs to be cleaned or replaced. The ALARM system will need to allow the user to turn off the power heads and pumps of their saltwater aquarium during feeding through a relay system. However, this feature will not be accessible through the online website because the user is usually at the aquarium when feeding occurs. The user will not need to bring the ALARM system out of feed mode manually because once the saltwater aquarium is placed into feed mode the ALARM system will need to automatically turn the power heads and pumps back on after a reasonable period of time.
2.2 Performance RequirementsThe performance of all of the features that the ALARM system offers need to be optimized for them to be useful to the user. However, there needs to be a balance between optimization of performance of the ALARM system and the lifetime of the system. The lifetime of certain parts of the ALARM system will significantly decrease if they are operating at their full potential for continuous amounts of time. The multiple features that the ALARM system offers to the user will mean nothing if they do not operate in a timely manner; but, a timely manner is not necessarily defined by continuous operation of all features. Not only may bad performance hinder the usefulness of the ALARM system to the user, but it may also lead to serious problems with the quality of the saltwater aquariums. Therefore, the performance requirements of the ALARM are taken into heavy consideration, while keeping in mind the lifetime of the ALARM as well. The lifetime of the ALARM will need to be at least ten years.
The pH and temperature of a saltwater aquarium does not vary drastically over a short period of time; therefore, the ALARM will need to poll the pH and temperature of the aquarium every 10 minutes. This is a reasonable time interval that will not overdrive the components of the ALARM system responsible for measuring the temperature and pH of the saltwater aquarium. Another feature that will need to be polled in a similar fashion is the power usage of the power heads, heaters, lighting and pumps. These power readings will need to be polled every minute. The higher polling of the power will give a better accuracy of how much power is being used by the saltwater aquarium. The temperature, pH, and power usage of the saltwater aquarium will need to be stored for at least 6 months through the ALARM before it is replaced with new data. Therefore, the ALARM system memory must be large enough to handle this amount of data. In addition the ALARM needs to be able to display these 6 months of data through

7
the online website. Therefore, the website must be modeled to handle at least 6 months of data that the ALARM system will send to it.
The PV panels of the ALARM system will need to reduce the power needed by the lighting system by at least. When the conditions do not permit the PV panels to power the lighting system of the ALARM system completely, the switch to a backup power supply will need to happen in less than 10ms. The switch needs to happen this quickly so that the lighting system of the ALARM system is not disturbed. At this speed the time the lighting system is off between switches will be a flicker that is too fast for the human eye to notice. In addition, the change of the lighting system condition will need to be less than one second for the dimming control at the aquarium and less than 3 seconds for the dimming control through the website.
Finally, The ALARM system will need to alert the user within thirty seconds of a leak and within a day after a pump or filter needs to be cleaned or replaced. The pH, temperature, time, date and alerts will need to be updated on the front display within half a second after they are polled or noticed. When the feed mode option is implemented at the aquarium, the pumps and filters will need to turn off within a second of feed mode implementation. This is critical in saving the amount of time the user needs to wait to begin feeding the inhabitants of their saltwater aquarium. In addition, after five minutes the pumps and filters of the saltwater aquarium need to be turned back on automatically.
2.3 Hardware Specifications2.3.1 Sensor Specifications2.3.1a Temperature Sensor SpecificationsThe ALARM system will have two different applications for temperature sensors. The application of the first temperature sensor will be to measure the temperature of the water in the aquarium. This sensor will need to be submerged at all times; therefore it needs to be waterproof and resistant to salinity. The application of the second temperature sensor will be used to measure the temperature of the heat sink of the lighting system. This sensor will send data to the microcontroller and if the temperature of the heat sink becomes too hot, the fans will need to turn on. The ALARM system needs both sensors to abide by the following specifications:
Measure temperature from 10oC to +38oC (50oF to 100oF) +/- 1oC Accuracy Power Supply 3V – 5.5V

8
2.3.1b pH Sensor SpecificationsThe pH will be measured to keep track of the acidity level of the aquarium. The pH probe will need to be submerged at all times in the aquarium and will take measurements every 10 minutes. Commercial pH probes tend to use a BNC cable to connect to devices, if this is true for the pH probe the ALARM system will use, and then it will need an adapter to communicate with the microcontroller. The adapter must have a three pin output. The ALARM system requires the probe and adapter to possess the following features:
pH Adapter
Supply voltage of 3V to 5.5V Current Consumption <50mA Smaller than 2 cubic inches
pH Probe
Fast Response Can measure pH in the range of 5 -9 Maximum pH error of +/- 0.1 Cable length >=2 feet Non-toxic
2.3.1c Leak Detection Sensor SpecificationsThe leak detection sensor will need to send a voltage immediately back to the input of the microcontroller once water connects two wires to conduct voltage. One wire will come from an output pin supplying 5V. The inputs of the microcontroller will receive the 5V signal once a leak is detected. The leak detector will need to set off an interrupt to the microcontroller in order to alert the aquarium owner as soon as possible.
2.3.1d Current Sensor SpecificationsThe ALARM system will use current sensors to monitor the amount of power being used by the system. The current being sensed will be a maximum of 8 Amps. Current will need to be polled every minute to monitor the power usage accurately. The current measured will need to be transmitted to the microcontroller which will store the data. Power must be measured within a range of +/- 10%.
9
2.3.2 Microcontroller SpecificationsThe microcontroller will be the brain of this project, sending and receiving signals to all other parts of the system. The microcontroller needs to have enough IO pins to handle the many inputs that will be coming from the various sensors. It needs to have the ability to communicate with other devices over I2C or UART, because it will communicate with a networking interface for the website and data storage from the database. It also needs these communication channels to display various information on the LCD display screen, which will be placed on the front display of the ALARM system. Because many of the sensors are analog it will have to have an analog to digital convertor, or ADC, to properly relay the information to the user. It needs to have the ability to control pulse width modulation, or PWM, for the LED drivers which are a separate part of the ALARM system. It needs to have enough internal memory to store all of the code and libraries needed for the project.
2.3.3 Relay SpecificationsThe relays can be utilized to switch high power components with a low power signal from a component such as a microcontroller. There will need to be several relays involved with the ALARM system. There will be relays for each of the LED power supplies, one for the heater, one for the 2 separate power heads, and one for the pumps. Also, there may be two more for auxiliary control. Both of these switching situations involve fairly high amounts of power. The power heads will have to be switched where the electrical connection is plugged into the wall. This is so the cables for the power heads don’t have to be cut or spliced. This means that the load power will be 120VAC and at least 5A. The microcontroller that is being used utilizes 3.3V or 5V to send logic signals. The relays will then have to be able to switch between 3.3V to 5V and must be able to withstand the switching of at least 22V on the load.
Relays can be bulky since they are electromechanical. They must be able to fit onto a PCB. Solid-state relays are viable option as well. They act in the same ways any other relay, but there are no moving parts. The packaging for them sometimes mimics that of the electromechanical relays for continuity, so they can still become bulky. If space becomes an issue there are integrated chip solid-state relays might be an option.
2.3.4 Lighting System SpecificationsThere are several different types of lighting systems that are utilized in aquariums. The ALARM system will need to utilize an LED lighting system for saltwater aquariums because of the low cost, power efficiency, long life time and

10
controllability of LEDs. The three main areas of specification of the ALARM system are the LED, LED driver, and luminaire.
2.3.4a LED SpecificationsAn LED is a type of diode that is current-driven and emits lights, hence the name light emitting diode, proportional to the forward current. The light emission is the result of a forward voltage applied to a PN junction. When a forward voltage is applied to PN junction electrons and holes combine near the junction and release light. Every LED has a minimum forward voltage that must be applied to for the device to emit light. The color of an LED is a result of the different semiconductor materials used to make the device. Indium gallium nitride (InGaN) is used to make the blue and white LEDs used in the ALARM system lighting system. [1]
A single LED is a relatively low power device; therefore, LEDs are commonly put into strings. The ALARM system will need to utilize two series tied strings of LEDs: one white string of LEDs and one blue string of LEDs. Each LED in a particular string will be connected in series with each other so that they all will require the same current. When LEDs are tied in series with one another they call for a higher forward voltage because the voltage of each LED is in series with each other .. However, the entire string of LEDs will require the same amount of current, which leads to lower power consumption. This lower power consumption is one of the main advantages of using LEDs for lighting.
However, fairly expensive PV panels will be needed to provide the forward voltage necessary to drive a large amount of LEDs. Due to the budget, the ALARM system cannot provide the expensive commercial PV panels that would be needed to power the lighting system of a large aquarium. Therefore, the ALARM system will be downsized to only power enough LEDs to light a small aquarium no larger than thirty gallons and two feet in depth.
There are two main types of LEDs: indicator LEDs and illumination-grade LEDs. An indicator LED typically requires a drive current of 20ma and an illumination-grade LED typically requires a drive current of 350ma. The illumination-grade LEDs require more current, but output a higher light intensity. The ALARM system needs to utilize illumination-grade LEDs for the light intensity required for coral growth in aquariums. However, these LEDs can still be overdriven, leading to a reduction in useful life of the LED. LEDs can typically provide at least 50,000 hours (5.7 years if left on continuously) of useful lifetime before they degrade below 70% of their initial light output (also called lumen maintenance). LEDs have maximum ratings for either current or forward voltage. If the LED is driven higher than this rating, then the lifetime of the LED will dramatically decrease, sometimes immediately; when overdriven LEDs will give off heat that can be dissipated through a heat sink. [1]

11
The ALARM system will need to allow the user to set a custom lighting schedule through the website. This lighting schedule will be crucial in allowing the user to supply the best simulation of the sun through different parts of the year. The user will simulate the different lighting patterns through different intensities of blue and white LEDs for various parts of the day. The ALARM system will also need to incorporate a push button that will allow the user to choose between five different preset lighting conditions.
The first condition will need to have the white and blue LEDs at full intensity. The second condition will need to have the white and blue LEDs completely off. This condition will be useful if the user wants no light because of the addition of coral or for other reasons. The third condition will need to have the white lights at half of their maximum intensity and the blue lights at half of their maximum intensity. This condition will be useful if the user wants to manually simulate sunrise or sunset. The fourth condition will need to have the white lights off and the blue lights at half of their maximum intensity. This condition will be useful if the user wants to manually simulate full moon conditions. The last condition will need to have the LEDs set at the custom lighting schedule provided by the user through the database.
These conditions will need to be set according to the current condition state when the user presses the push button and what the next condition state that follows this current state.. The condition can be thought of an as finite state machine that only goes in one direction. Therefore, the push button will be used to cycle through these 5 conditions of this finite state machine.
2.3.4b LED Driver SpecificationsThe purpose of the LED driver is to deliver a constant current to a string of LEDs over a wide range of load voltages. Therefore, the LED driver is not only used to supply a string of LEDs with the minimum current needed to drive them, but also protect them from being overdriven. The current can be controlled in two ways: using the LED V-I curve to determine what voltage is needed to be applied to generate the desired forward current or to drive the LED with a constant current source [2]. The ALARM system will need to utilize the second method because of the possibility of having a wide range of load voltage makes the first method unreliable. Therefore, the ALARM system utilizes two LED drivers for each string of LEDs.
The brightness of each string of LEDs is proportional to the forward current applied by the LED driver over a decent range. However, at the bottom of the current range the LEDs may flicker or even change color. Therefore, dimming LEDs by reducing the forward current is not the best approach. Instead, pulse width modulation (PWM) is a widely used technique to safely dim the LED strings from 0%-100% of its peak brightness. This is accomplished by providing a PWM

12
signal that changes the amount of time this forward current is supplied to the LED string. [2]
The amount of time the LED string is on compared to the amount of time the LED string off is called the duty cycle. The duty cycle correlates to the amount time the LED is turned on. For example, if the duty cycle is 90%, then the LED string is turned on for 90% of the clock cycle and turned off the remaining 10% of the clock cycle. As the duty cycle of the PWM signal increase so will the perceived brightness of the LED because of the average time the LED is on is increasing. Therefore, each driver can utilized PWM to dim the LED strings from 0%-100% of the optimal intensity. [1]
One PWM signal could be used to dim both strings of LEDs in the ALARM system. However, the user would not have control over each string of LED separately. Therefore, the ALARM system will need to use two separately generated PWM signals to separately dim the blue string of LEDs and the white string of LEDs. This will allow for more accurate real life scenarios for different parts of the day when the sun or moon are not completely out. This will also be critical in setting the conditions of the finite state machine discussed earlier that is cycled through by a push button.
2.3.4c Luminaire SpecificationsLuminaire is the reflector and lenses that direct the light of the LEDs in a desired direction. The optimal lenses for the ALARM system will need to be eighty degree lenses because of the lumen focus they provide over a condensed area. The luminaire should also be made to control the heat of system because heat can be devastating to semiconductors. Therefore, protecting the junction from heat is critical. A heat sink is usually incorporate for thermal protections and takes heat generated by the LED and LED drivers then dissipates this heat away from the devices. A good rule of thumb for the size of the heat sink is four square inches of heat sink per LED [3]. The ALARM system will need to utilize a heat sink that is not previously drilled and tapped. This will allow for better flexibility in the placement of the LEDs, but will require manual drilling and tapping to hold the LEDs in place.
There should also be a fan incorporated to cool the heat sink and this fan should be at least half the width of the heat sink. Without this fan the lifetime of the LEDs decreases significantly. This fan should be temperature controlled so that it is not running at optimum RPM all the time. The fan only needs to be on when the LEDs are on and producing excess heat.

13
2.3.5 PV Panel SpecificationsA photovoltaic (PV) cell is a device that converts energy from the sun into electrical energy. These PV cells contain semi-conductor materials that produce electricity when photons from the sun cause electrons in the material to break from their lattice. PV cells are connected in groups on support systems to make up a PV panel. From here PV panels are then connected into arrays to convert light into usable electrical energy. Solar Panels differ in efficiency based on the size and quality of the PV panels and the quantity of light received. These factors will directly determine how much electrical power a PV panel will produce.
The ALARM system will need to use the electrical power provided by the PV panels to power lighting system. Therefore, the voltage produced by the PV panels has to be more than or equal to the total forward voltage of each string of LEDs. This is obviously not realistically possible because the PV panels will provide no electrical power at night or in bad weather conditions where the sun is not out. So the PV panels will only be used to power the lighting system when the sun permits it too. However, these PV panels will still save a lot of energy that would usually be provided at all times of the day through the grid.
2.3.6 Storage SpecificationsThe onboard storage on the microcontroller does not have to be that large because the data gathered from the sensors will be uploaded to a web server for storage and analysis. It should be able to store a few days’ worth of data just to be safe. That means that it should have a database capacity of at least 800KB, which is larger than the memory of the microcontroller. Therefore an external storage deceive must be used.
The storage subsystem on the remote server should have a capacity of at least 1GB so it can hold 6 months’ worth of data before information needs to be discarded. The data should be in a format in which it can be easily parsed and analyzed by the server and then displayed on the interface.
2.3.7 Networking SpecificationsThe networking module needs to connect to the microcontroller via an SPI, I2C, or UART bus. The networking module should have a built in TCP/IP stack for ease of use. The networking module should support at least Cat3 which has speeds of 10MB/s and should be able to support Cat5e which has a higher bandwidth. The system will not need to transmit that much data so speed it not that vital of a factor in deciding which module to choose.

14
2.3.8 Power Management SpecificationsThe power management is a vital part of this project. There are various components that need power and 3 total sources of power. A photovoltaic panel will supply the power to the LED drivers, which will supply the power to the LEDs, whenever possible. A failsafe supply will take over whenever the panel cannot supply any power. The failsafe supply will either consist of a battery, a power supply, which converts the AC power from the wall outlet into usable DC power, or both will be used. An additional power supply will power the rest of the components. The components operating off of the second power supply are the microcontroller, 3 temperature sensors, 1 pH sensor, 5 current sensors, the LCD character display and the relay control power.
The LEDs will utilize the majority of the power. One string of the LEDs will use a maximum voltage 20V. This means that the PV panel and the failsafe supply must be able provide this much voltage to the LED drivers. If a battery scheme is used it must be at least a 24V battery. In addition to the battery, a charge controller that can sustain the 24V is also needed. If a power supply is used the supply voltage should be at least 24V. The PV panel must supply a higher voltage than this to ensure that the power supply is not always on. Since the LEDs are high powered the failsafe supply and the PV panel must be able to supply between 3A.
All of the other components will be powered with 3.3V to 12V. The second power supply will need to be 12V. The sensors and the LCD screen should operate on 5V. A 5V linear regulator will be needed to step down this voltage. The sensors and the LCD should not utilize much more current than 10mA. The relays, depending on the type, can use a large amount of current around 100mA. There will be at least 5 relays. Therefore, the current for the second power supply should be at least 1A. This will allow the relays to be powered as well as the sensors, microcontroller, and the LCD. Since efficiency is important in power supplies an efficiency of 85% or higher is preferred. As long as the maximum the voltage can be supplied from each of the sources then the rest of the mechanisms can be powered.
2.3.9 Front Display Specifications At all times the LCD display will display information that is vital to the aquarium, including information related to power consumption. The LCD display will need to display important information at all times. It will display critical information vital to the fish tank itself as well as the information relating to power consumption. Important information such as average aquarium temperature, pH balance, and the status of feed mode will all be displayed on the LCD display. The status of feed mode is an important feature that turns off the power heads and pumps. On the LCD display there will be average tank temperature, pH balance, and the
15
status of feed mode (this mode turns the power heads and pumps) that are displayed. In addition to the critical information, there will be date and time shown on the screen. The display should not be too large because there are no more than 4 components to be shown. Therefore, a 2 line by 16-character display should be sufficient to display the data. In which each character conforms to a 5 by 8 pixel-formatting scheme or a similar format. The LCD screen will only display about four components therefore, it should be no smaller than 2 lines and no larger than 4.
Since there are only two lines and four different types of data to be displayed then at maximum only two can be shown at once. Since there is no on board control for the display, then the display should be able to cycle the information that is displayed in at least 5 seconds from one set of data to the next. This will allow for the user to see all of the information in a timely manner.
If the cost is only marginally high then 4 line by 16 or 20-character LCD display is an option. Given that there 4 lines for display then the will be no need for the display to cycle information. Thus, the specifications for the data to cycle will not be as critical. A low power, energy saving design the LCD screen is preferred; therefore the display should not more than a supply of 5V.
2.4 Website SpecificationsThe ALARM system will have a website where the user can control various components of the system as well as monitor the power usage and parameters of the aquarium (such as temperature and pH). The website will use a database to store past data measurements so the user can follow changes in their aquarium. The data stored will consist of power usage, temperature, and pH measurements. There will be an easy to use interface for users on the website for the user to manually control the components of the ALARM system. The user will be able to control the brightness of the LED lighting system by setting the intensity of lighting system the user would like. The user will also have the option of selecting a custom lighting schedule according to the time of year so that the organisms in the aquarium can have a more natural environment. The website will also be used to send the aquarium owner an email if an alert has been made and the aquarium needs immediate attention. An alert could be if the pH or temperature has changed too rapidly or if the leak detector interrupt is activated.

16
Chapter 3 Research
3.1 Similar Projects and ProductsThere are many similar products to the Aquarium Lighting and Resource Monitor on the web. Many of these similar systems are very expensive but can do a number of aquarium maintenance jobs so that the aquarium owner does not need to worry about doing all of the work. There are systems that control the lighting systems; these can give different light patterns to give a natural lighting environment for the aquarium. This might include having moon lighting patterns or even simulate different weather patterns that would happen in a natural environment. There are many controllers that measure the temperature and pH of an aquarium on a regular basis. These systems can control the pumps as well as have automatic feeding so the owner doesn’t have to even get off of the couch. Many of the modern systems can be controlled through the internet or smartphone and send alerts to the owner by email or text message. There are numerous aquarium enthusiasts that use these controllers to make their lives easier without having to constantly watch over and perform maintenance for their aquariums while still enjoying the hobby.
The product Doctor Aquarium is data acquisition and control software. With doctor aquarium you can monitor the pH, temperature, light levels, and take action to stabilize your aquarium or warn you of problems. These are all features of the ALARM system. The doctor aquarium can mirror natural temperature cycles. This could be something that may be incorporated in to the ALARM, but has not been discussed as a feature for the system requirements. Doctor aquarium allows its users to view their aquarium from anywhere using a webcam and the doctor aquarium software. This product uses a sensor board to receive data from the sensors and has a data logger to keep a log file of the aquariums past conditions. The doctor aquarium uses X10 technology to transmit signals through the homes power lines to receiver modules that control different parts of the aquarium. This product is very similar to the ALARM with all of its aquarium functions but it does not use solar energy to power the system or track the power usage of the aquarium as the ALARM does.
The Home Energy Management System is a former Senior Design project at UCF that is similar to this project in the sense of monitoring the power usage of home and controlling devices that require power. This project used Hall Effect current sensors to track the amount of power being used by three different modules. The data is sent back and forth from the main control board to each current sensing module using Xbee wireless radios. .

17
3.2 Power Management ResearchPower distribution is important for all of the components to work properly and give accurate data. There a various components that need power as well various mechanisms with which to supply them. There is photovoltaic panel involved to save energy. The idea is to power the LEDs with only the PV panel and failsafe power supply of either a battery or the AC power from an outlet. The rest of the components will run off of power supply, since they are low power devices.
Since there is a photovoltaic panel and standard 120VAC power to consider there are some extra considerations. Since this system provides crucial information on the status of the tank it is important the power is maintained. Therefore the PV panel must have some sort of supplement, such as a battery, power from a standard outlet, or both. If a battery is involved, then a battery needs to be purchased such that it can sustain the charge of the PV panel. In addition to the battery, a charge controller is needed [4]. This will make sure that battery isn’t overcharge as this can be harmful to the components of the battery. Running just the battery can also be a problem because it won’t be able to supplement the PV panel for very long. So, if there is cloud cover for a whole day the battery cannot power the system for that length of time.
The next idea for a more continuous power management is running an AC to DC power supply. In this scheme the power from the PV panel will be the primary source for the power. If the power were to drop below the sufficient amount of voltage then the system will be powered from the power supply. An issue with this method is that power supply would obviously be using power from the house. However, it is more of an uninterrupted system, which is desired.
The last method is to run all three of them parallel. The primary source would be the PV panel, as in all of the other schemes. The next failsafe would be the battery. The last line of defense would be the power supply. This the most advantageous design as far as uninterrupted power. Also, in the aspect of energy saving since, it will use power from the house as the last option. The drawback is cost of a battery or batteries to hold the charge as well as the power supply.
Since the LEDs will utilize the majority power they will be connected to solar panel scheme. The voltage needed to power the LEDs is at least 22V. The PV panel needs to be a nominal voltage higher than this. A standard power supply is usually only available in nominal voltages of 9V, 12V, and 24V. To power the LEDs the 24V supply would be the best fit. In this case the PV panel must supply more voltage than the power supply. This ensures that the power supply does not turn on until the PV panel drops below 24V.
The other components in the system such as, the microcontroller, temperature sensors, pH sensor, power/current sensor and LCD display will need at most 12V. To power these components at 12V or lower, depending on the final

18
decision of parts, is desirable. The 24V failsafe power supply could be used to power these components too. However, this would prove to be extremely inefficient. Most of the power would be lost to heat in the conversion process and thus this conversion process would not be an effective way to save energy. It would be more beneficial to supply the components on an independent power supply.
All of the components run on different supply voltages. Therefore, once a power supply is chosen there needs to circuitry to supply the parts with the correct supply voltages. There are a couple ways to do this. One way is to use linear regulators. They will step down the voltage to a nominal supply voltage. Another option is to use operational amplifiers and resistors to step down the gain. This will achieve the same thing.
3.2.1 Power Supply There will be 2 separate power supplies. One will act as the failsafe for the LEDs if the solar panel cannot be utilized. The other will be power all of the other components. The power supply for the LEDs will need to be 24V to provide enough forward voltage across the diodes. Large current is not a contingency it just needs to be above 700mA, for the separate LED driver circuits. So anywhere around an 18W power supply is more than sufficient. The other power supply will need to be at least 12V depending on the sensors, because the microcontroller and the LCD display won’t need more than 5V. The current supply also does not have to be too high for this application.
PSAA20R-240
The PSAA20R-240 from TRC Electronics, IRC is a 24V power supply at 830mA. The total wattage is 20W. This meets the standards for the failsafe power supply. It is also Energy Level V compliance. This means (Energy Star) that the efficiency is greater than or equal to [0.0626(ln(20)]+0.622, which is 81%. [5] The efficiency is decent, but efficiency closer to 90% would be better.
3.2.2 Charge ControllerIf the power system with the battery in it is considered, then there needs to be a charge controller. This will make sure the battery is not overcharged. PV panels can put out more voltage than they are marked for therefore the battery can have more voltage across it than it is rated for, due to fluctuation in the temperature of the panels. This can damage the battery. Charge controllers usually will also indicate the status of the battery life.

19
PS-15M
The PS-15M is a charge controller form Morningstar. It is available in 12V and 24V models. Depending on the battery scheme this is helpful. It is also rated up to 15A, which is more than sufficient. This charge controller uses pulse width modulation to charge the battery. Using this method, the controller sends pulses to the battery to charge whilst constantly checking the voltage across it. Figure 3.1 below shows the full charging cycle [6]. The controller displays the present voltage and current on LCD screen. This charge controller is good fit for the project, but the price is a steep $150.42. When the cost of the battery and the PV panel is factored in the price for these three parts is staggering compared to the cost of the rest of the components.
Figure 3.1 shows the charging cycle for the PS-15M charge controller. Copyright 2012 Morningstar Corporation
EHPC-PWM-10
This particular charge controller is functional with either 12V or 24V. It is a very simple controller as far as the design and the status of the battery. It has 3 LEDs green, yellow, and red to indicate the status of the battery. There are also additional LEDs to indicate charging and to indicate a critical error. There is a 4 stage charging system. It starts with a bulk charge then, switches to pulse width modulation this keeps the battery from over charging. After the first 2 stages it switches to a boost and float charge. This charging pattern protects and preserves overall battery longevity. [7]
3.2.3 Linear RegulatorsLinear regulators are an option to step down the DC current from the DC power supply. They will be needed to help supply power to the various other components not including the LEDS, such as the sensors and the LCD display. Based on the ALARM specifications the sensors will be operating on power

20
between 3V and 5V. Also based on the specifications the LCD display will be operating on power that is no more than 5 volts. The microcontroller will operate between 7V and 22V. Therefore, it will be beneficial for the linear regulator to have an output of at least 5V. It is also possible that there will only be a need for one linear regulator.
LM 7805This is a common regulator. It has three pins: Vin, Vout, and ground. It is also PCB mountable. Depending on the application the part can become hot. It has a built in heat sink to help dissipate some of the heat. If needed an additional heat sink can be attached to cool the part even further. The typical output of the regulator is 5V with a load current of 500mA. The voltage input to maintain constant regulation is 7.2 at the load current [8] . This linear regulator can drive the sensors and the LCD with its given specifications.
3.3 Microcontroller ResearchThere are many different microcontrollers on the market today ranging in many different specifications important to this project. There are a wide variety of microcontroller families to choose from with varying architectures, input/output ports and internal memory. Deciding on a proper form factor will be important to the design process because it can make the programming and realization of the specifications very easy or very hard. There needs to be a balance between cost and the performance. There are some microcontrollers that lack PWM pins, internal ADCs, or an internal NIC. These devices may cost less than their competitors, but adding those features with other modules may be time consuming and end up costing more money.
The alarm system will have 5 current sensors, 5 relays, 3 temperature sensors, a pH sensor and a leak sensor. All of these will require IO pins. The temperature and pH sensors will most likely be analog as well as the power sensors, which means there will need to be at least 8 analog input pins. There will also be an LCD display which will require between 4 and 8 IO pins depending on the model resolution. On the front display, along with the LCD display screen , will be buttons for the user to operate the controller. There will be a feed mode button as well as a light select button which will control the LED subsystem. There are three common types of microcontroller that can meet all of these requirements, the TI Stellaris platform, the Microchip PIC family of microcontrollers, and finally the ATMEL AVR family of microcontrollers. Ideally there would be one product that has the best features at the lowest cost, but that is unlikely and there will have to be tradeoffs. Since we are only building one prototype the cost of the chip is not that large of a factor since all the chips are within a few dollars of each other.

21
TI Stellaris
The Texas Instruments Stellaris is an ARM based microprocessor with an integrated networking controller and can contain up to 512KB of flash memory and 64KB of RAM. They have many different I2C and UART busses for communication and many different timers for various different functions. The chips operate at or above 25 MHz, which seems to be more powerful that what is needed for the scope of this project. The 6000 series seems to be limited to 30 general purpose IO ports which may not be enough for all of the sensors and various outputs we need for the project.
To program a Stellaris device you need to have access to the TI software library and have a license. You will also need a Stellaris flash programmer in order to connect to a computer to receive programs. You should be able to use GCC to compile C code to an ARM assembly file, which can be uploaded to the Stellaris chip through the programmer. [9]
ATMEL 2560
The Atmel 2560 is a chip in the 1280 family of Atmel chips. It is an 8 bit AVR modified RISC architecture , with 32 8 bit general purpose registers. It has 54 digital IO pins, 16 analog input pins. It has 128KB of flash memory and 8KB of RAM . The clock speed of the chip is 16 MHz and CPU speed capable of 16 MIPS. There are a few different power modes for the chip for power saving. When active at 1 MHz it will draw 500 micro amps, but will only draw .1 micro amps in power down mode. Our system will not need to be active at all times so this feature will save power.
The 2560 is the chip in the Arduino Mega development board. This means that there are many open source libraries that work directly with the chip which will greatly reduce the amount of coding necessary for the project. There are also many examples of projects using this chip. Another perk of using this chip is that you can program them with another Arduino connected via USB to the computer with the source code, and you do not have to buy an expensive In System Programming (ISP) device. [10]
PIC30F6012A
The PIC30F6012A is a 16 bit microcontroller by PIC. It has 52 IO pins, a 16 channel 12 bit analog to digital converter along with 144 KB of storage space and 8KB of RAM along with 4KB of non-volatile EEPROM. The chip has a faster clock rate than the Atmel 2560 and the Stellaris 6100 at 30 MHz. There is a C compiler optimized for use with the PIC30F6012A. Each pin is a sink and source of 25mA. The PIC30F6012A contains 5 16bit timers/counters which can be combined to create a 32bit counter. It also has an on-chip watchdog timer with built in low-
22
power oscillator. There are 8 pins that can be used for PWM, only 2 of which will be needed for the ALARM system though. [11]
3.4 Lighting SystemThere is a lot of information that goes into choosing the correct type of lighting system for an aquarium. An aquarist needs to fully understand the needs of their plant life or coral and provide these needs through the correct choice of a lighting system. Most aquarist believe in a general rule of 2-5 watts per gallon; but, watts per gallon is not the only aspect that needs to be considered in aquarium lighting systems. Other aspects of lighting that should be considered are lumen, lumen per square meter (LUX), and photo-synthetically active radiation (PAR)/ photo-synthetically useful radiation (PUR). The goal of a successful aquarium lighting system is to provide the appropriate amount of each aspect to replicate natural sunlight which covers the full spectrum of light. [3]
3.4.1 Aspects of Lighting3.4.1a WattsWhen it comes to fish aquarium lighting watts is a measurement on how much the lighting system is using, not the amount of light it is outputting. This is where many aquarists make the mistake of using the rule of 2-5 watts per gallon. This rule was created when the only type of bulbs used were T12 bulbs. However, newer bulbs have more watts spread over a shorter distance. Therefore, the watt per gallon rule can be misleading to aquarist.
The amount of light output is measured in lumen not watts. It takes a certain amount of watts to produce a certain amount of lumen. Therefore, a 24 watt bulb that outputs 80 lumens per watt is more powerful than a 24 watt bulb that only puts out 40 lumens per watt. [3]
3.4.1b LumenA lumen is defined as the SI unit of luminous flux, equal to the amount of light given out through a solid angle by a source of one candela intensity radiating equally in all directions. For a bulb this is simply the total amount of visible light emitted. The lumen per watt of a bulb can be calculated by dividing the lumen rating of the bulb by watt rating. This lumen per watt is more important than watts per gallon.
However, the lumen per watt rating can also be misleading if this light is not focused. The more focused the lumen from a bulb the less lumen will be required to provide essential light energy to plants and corals. This focused energy waste

23
little essential light energy and is one of the main reasons that LEDs are more efficient than other bulbs. [3]
3.4.1c LUXLux is equal to lumens per square meter. This lumen focus is an important aspect of aquarium lighting systems for plants and especially coral. Many coral contain zooxanthellae, a type of algae that is found in the tissue of corals. Zooxanthellae use essential light energy and turn it into oxygen for the coral. Therefore, when lux is low the corals become deprived of oxygen supply. Then, the health of the coral diminishes, sometimes this can lead to death. The minimum light intensity should be no less than 20,000 lux when it reaches the bottom of an aquarium. However, too much lux can be just as harmful to an aquarium. The maximum light intensity should be no more than 110,000 to 120,000 lux at the surface of an aquarium. [3]
3.4.1d PAR/PURPAR is the spectral range of solar light from 400nm to 700nm that is needed for plants and zooanthellic algae for photosynthesis. This spectrum range goes from actinic UVA to infrared, but only a certain range of this spectrum is necessary for plant and coral photosynthesis. This useful spectrum is what is known as PUR. The different photosynthetic responses that occur at different spectrums are shown in Figure 3.2 below:
Figure 3.2 shows the photosynthesis response of PAR at different spectrum levels. Reprinted with permission from American Aquarium
Products

24
The response that correlates to A is called the phototrophic response. This is the Chlorophyll containing plant or algae "moving" to respond to a positive light source to begin the process of photosynthesis (initial growth of plants, zooxanthellae, etc.). This is found in the 420-500nm "blue" spectrum. The response that correlates to B is called the photosynthetic response which is the process which begins energy from light is absorbed by proteins called photosynthetic reaction centers that contain chlorophylls. The response that correlates to C is called chlorophyll synthesis. Chlorophyll synthesis occurs soon after the exposure from the wavelength around 670nm and results in the continued growth of a plant, algae or zooxanthellae. Lack of light over 620nm would result in stunted freshwater plant growth and poor health of corals in reef tanks.
2500K bulbs are capable of providing the spectrum in C and 10,000K or actinic bulbs are capable of providing the 420-500nm “blue” spectrum. These two spectrums are what make up the PUR. Plants in freshwater aquariums require more of the infrared spectrum of the PAR and corals in saltwater aquariums require more of the actinic spectrum of the PAR. Therefore, the right spectrum should be targeted based on what type of aquarium is being used. Saltwater aquariums typically get away with 6500K bulbs or higher because they contain more of the actinic spectrum. It should be noted that a Kelvin rating is used in lighting to describe the color temperature of a bulb. High color temperature bulbs above 5500K are cool colors and low color temperature bulbs are warm colors. The higher the Kelvin rating of a bulb the deeper it will penetrate the water, but there will be less of an infrared spike. [3]
3.4.2 Different Kinds of Lighting Systems3.4.2a T-SeriesThe T-series light bulbs are the T8, T12, T5 and T2. The T-12 is a standard pin, one and a half inch wide bulb. This bulb is extremely inexpensive, but has a poor lumen to watt ratio. Many aquarists try to make up for this lack of efficiency by using many of these lights to make up for the poor efficiency. The T-8 is similar to the T-12, but is more efficient with less wattage and is only one inch wide. The T-8 is more commonly used than the T-12 in aquarium lighting systems because of this better efficiency. The T-5 is smaller than the T-8 bulb and uses less watts per lumen. These bulbs have become highly popular because they are small, 13mm in diameter, diverse, and provide good lumen per watt. However, these bulbs are not recommended for tanks deeper than 20 inches because of the lack of LUX at these depths provided by these bulbs.
A newer technology is the even smaller T-2 bulbs that measure on 7mm, which is the main advantage of these bulbs. The small size allows aquarists to pack many of these bulbs into a small area with one bulb typically producing around 70 lumens per watt. These bulbs commonly come with a linkable fixture feature

25
that allows for them to be connected in series or in parallel with each other. This feature gives aquarists diversity in creating a lighting system that matches their need and space requirements. A disadvantage of these bulbs is the lack of variety and availability, because they are relatively new. Another problem with these lights has been quality control. Many defects have been found, but with these being a new technology this is expected. As the technology matures these defects should be resolved. [3]
3.4.2b Very High Output (VHO) VHO bulbs come in the T-5 thru T-12 sized mentioned earlier. However, these bulbs can output up to 180 watts out of lamps smaller than forty inches. The downfall to these lights is their high cost and the short lifespan of the electronic ballast. The lifespan of the ballast tends to be under 3-5 years and the cost of replacing them can exceed the cost of the entire fixture. The reason for the short lifespan of the ballast is in part due to how hard it must be driven to provide such a high wattage in a relatively short bulb. Therefore, the tradeoff between the high output wattage of these bulbs to the cost of these bulbs tends to discourage aquarist from using them. [3]
3.4.2c Power Compact (PC)PC bulbs produce a similar lumen per watt rating as the T-5 bulbs, but come in many pin configurations. These bulbs will fit in a common incandescent bulb and therefore do not require special fixtures. That are why these bulbs are so economically reasonable to use by many aquarists. Although these bulbs only have a lifetime of about half a year, the inexpensiveness of these bulbs compared to the lumens per watt they produce attract many aquarist who have a type budget to use these bulbs for their aquarium. [3]
3.4.2d Metal Halide (MH)Metal Halide is traditionally known as the best kind of lighting for fish aquariums because of their depth penetration, output, spectrum, and shimmer affect that cause the colors of corals to really stand out. However, LEDs are beginning to surpass the metal halides in plant in coral growth for certain tank sizes. For aquariums deeper than thirty inches the metal halide provides the best possible solution for lighting to date. The metal halide is capable producing anywhere from fifty to ninety lumens per watt, which is far more than any other aquarium lights available.
However, the disadvantage to using metal halides is the amount of heat that these bulbs produce. Metal halide work through a gas bubble held in place by metal wires and supports. The electricity running between the bubble and the

26
metal generates a large quantity of heat and is the reason metal halides produce more heat than any other bulb. This excess heat often calls for the use of fans in the hood of the system or even sometimes the use of a chiller to cool the water down. With these facts considered, the metal halides can become expensive and unattractive to some aquarists. [3]
3.4.3 LEDsLED lighting is a relatively new technology in fish aquariums, but is quickly becoming the lighting of choice because of the many advantages that it offers. The use of LEDs allows for aquarist to correctly choice with areas of the spectrum they want to incorporate into their lighting systems for maximum plant or coral growth. The green-yellowish spectrum is essentially useless in the process of photosynthesis, but other full spectrum bulbs have to have this spectrum. Not only is this green-yellowish spectrum useless, it is also the spectrum that is most visible to the human eye and encourages the growth of a nuisance algae called red slime. Therefore, a lot of light in this spectrum can be harsh on human highs, taking away from the clarity of an aquarium. Considering these factors mentioned above, a lot of energy is wasted in these spectrums by other bulbs. This waste can be eliminated by choosing certain LEDs that incorporate only the low infrared and actinic blue spikes in the full spectrum, which correlate to the maximum PUR spectrums.
However, extra circuitry is needed for LEDs to control voltage or current for spikes or drops in the voltage source. This circuitry consists of what is known as LED drivers. Although this circuitry may seem tedious, it actually allows for LEDs to be easily controlled or dimmed which is another advantage of LEDs. Other bulbs can only output lumens at a fixed rate which is unrealistic. However, LEDs can provide different realistic scenarios that the sun exhibits. The dimming of LEDs is commonly done through PWM.
Another advantage that LEDs offer is their power and heat dissipation. LEDs require less power than other bulbs, but usually output less lumens. This may seem like a disadvantage; however, LEDs are capable of focusing lumens in a way more concentrated area than other bulbs. This lumen focus is crucial for photo-synthesis in many plants and corals. The amount of LUX that an LED is capable of delivering is unmatched by any other bulb. Even with this lumen focus the LED relatively dissipates a low amount of heat and does not result in an increase of heat of the water. Therefore, many cooling fans or chillers are not needed with LEDs lighting systems. The great lumen focus that LEDs offers allows for a 12 watt LED lighting system to replace at least a 100 watt metal halide of the same Kelvin rating.
Similarly, a LED lighting systems’ lifetime and flexibility is unmatched by any other bulb. Assuming that the LED is continuously left on, a typical LED last for 50,000 hours before its lumen decrease to seventy percent of its maximum

27
output. However, plants and coral typically only receive 10-12 hours of maximum lumens per day. So this 50,000 hour lifespan of an LED will typically last for twelve years. The lifespan of other bulbs is typically 8,000 hours, which equates to a lifespan of only about 2 years. The size of a single LED also allows for an aquarist to arrange these LEDs in an almost endless amount of configurations. Therefore, certain parts of an aquarium can be selectively target by the placement of LEDs. This type of targeting is only seen in the small T-2 bulbs, but even these bulbs cannot match the flexibility on an LED.
Finally, an aquarist should take extreme caution in the type of LED that they choose to incorporate into their lighting system. When selecting which type of LEDs should be used for an aquarium lighting system the Kelvin temperature and nanometer spectrum of the LED should be considered. There are two different kinds of LEDs: indicator LEDs and illumination LEDs. Indicator LEDs are commonly used in many housing application and contains spikes in the green-yellowish portions of the PAR and little to no spikes in the useful low infrared portions of the PAR. Therefore, using these LEDs will certainly rid plants or corals of the energy they need from photosynthesis. Illumination-grade LEDs contain more of a spike in the low infrared portion of the spectrum and significantly less portion of the green-yellowish portion of the spectrum and is what should be used in aquarium lighting systems. Illumination-grade LEDs do require more money, but are still cheaper than other bulbs because of their long life span. LEDs are still a relatively new technology for aquarium lighting system so there is still great potential for growth. This margin for growth is why LEDs seem very promising in being the future of aquarium lighting systems. [3]
3.4.4 LED DriverThe purpose of the LED driver is similar to a DC-to-DC power supply. It converts an input DC voltage into a different DC voltage with a constant current that will drive a single LED or a string of LEDs. They differ from standard power supplies because they create a constant current rather than a constant voltage. They also differ from regular power supplies because most models allow pulse width modulation. This changes the duty cycle and will allow the LED’s to dim.
The LEDs that are being used in this application have a forward voltage of 3.5V and a quiescent current of 800mA as well as 2.2A. These are considered fairly high-powered LEDs. Therefore the driver will need to have a high current and voltage output. Also, there will be at least to strands of LEDs to be driven. So, either 2 drivers are needed or 1 driver that can control two chains of LEDs independently. The LED driver can be built somewhat discreetly using a LED driver IC and other external components. By utilizing a discrete structure there will be more flexibility in the design. However, the efficiency of building this discreetly may not be as promising.

28
LM3401
The LM3401 is a step down DC-DC converted and considered a high-powered LED driver. To achieve greater accuracy and speed the LM3401 has hysteretic control. The input voltage ranges from 4.5V-35V. The constant current output can be designed to support up to 1.5A within 6%. The LM3401 also supports pulse width modulation. It has a total of 8 pins:
CS - current sense DIM - dimming input SNS - current feedback HYS - hysteresis GND - ground HG - gate drive output VIN - power supply input ILIM - current limit
The LM3401 has many features that are important to the function of the LED system. It also is only about a $1 per part and can be sampled for free. However it does have some external circuitry to consider, such as, an inductor and a PFET transistor, various resistors and other diodes. This means that the PCB will become more congested and more complicated to layout. Also, this driver can only drive one system of LEDs. There will be 2 separate strands containing LEDs. Therefore, 2 drivers plus their external components will be needed. These external will affect the total price of using this driver to about $5.
3021-D-I-350
The 3021 is a LED driver from LuxDrive by LEDdynamics. This driver is highly efficient (typical efficiency is 95%) and designed to supply high-powered LEDs. It is a preassembled LED driver therefore neither external circuitry nor a heat sink is required. A microcontroller can be connected to this driver for pulse width modulation. It is a 7-pin SIP connection, so it can be mounted on a PCB easily. The pin outs are as follows:
Vin+ Vin- LED+ LED- Ctrl Ref
The Vin+ pin is the voltage input pin. It needs to be higher than the forward voltage of the all the LEDs in series. The maximum voltage for this pin is rated at 32V. The LED+ pin is connected to the anode of the first LED. For this particular model the maximum current out of this pin is 350mA. The LED- pin is connected

29
to the cathode of the last LED. The Ctrl pin controls the status of the LEDs, which is on or off. This is also the pin in which the pulse width modulation is used.
This meets all of the specifications need for the LED driver. One of the drawbacks for this part is the price per part is $15.99. This is 3 times as much as building the part discreetly. However, this part is extremely efficient and easily PCB mountable.
3.4.5 PWMPulse Width Modulation has become a powerful tool in the dimming of LEDs and in DC motors. PWM involves turning a device on and off for a certain period of time to produce an average amount of time the device is on, but the speed that the PWM signal turns on or off remains the same. This average amount of time the device is on is directly related to the duty cycle of the PWM signal. The reason that this works is because of the latency in many devices. There are four methods to generate a PWM signal: analog method, digital method, discrete IC method, and the microcontroller method. For the alarm, the microcontroller method seemed most promising because a microcontroller was going to be needed for other applications.
A microcontroller deals with integers and a PWM signal can be made by making the microcontroller repeatedly begin counting at a number called bottom (zero) up to a number called top to produce a saw tooth wave. Then a comparator is used to decide if the output should be high or low and lays somewhere between bottom and top. If the value of the counter is higher than the comparator, then the output is high. If the value I of the counter is lower than the comparator, then the output is low. Therefore, if the comparator is made equal to top, then the output will always be low. Likewise, if the comparator is made equal to bottom, then the output will always be high. This leads to the comparator being able to control the duty cycle of the signal from one hundred percent to fifty percent. An example of the comparator producing a duty cycle of 66.6 percent is shown below:
The duty cycle is 66.6 percent saw tooth waveform produced by the counter of the microcontroller is six units high and the comparator is set two units above bottom. Therefore, the counter will be higher than the comparator for two thirds of the time, which relates to a 66.6 percent duty cycle. This example goes to show how the comparator is used to control the duty cycle of the signal.
Many microcontrollers offer the capability of producing many PWM channels. However, not all of these channels are the same bit size. The more bits a channel offers the better functionality of the signal. The basic components of many PWM signals produced by microcontrollers are the clock, the prescaler, the comparator and the output PWM signal. The clock signal serves as the saw tooth wave counter and is provided by the internal clock of the microcontroller or an external crystal. The prescaler divides the clock frequency by a value to slow

30
down the counting process by the counter. The prescaler values are usually in powers of two. The prescaler significantly minimizes the amount of programming needed to change the rate of the PWM signal. If the value of the internal clock rate is changed, the rate of the PWM signal can easily be changed by changing the prescaler value. However, this clock rate change can become difficult to handle if the rate change is not a power of two because the prescaler is a power of two. As mentioned earlier, the comparator is used to change the duty cycle. The output PWM signal is provided through a pin that is changed between high and low to produce the PWM signal.
When multiple output channels are available there are three factors that can differentiate them: modes of operation, bits of accuracy and compare output. The three modes of operation are fast PWM, phase correct PWM, and phase and frequency correct PWM. Fast PWM is a counter that produces a saw tooth wave. This is suitable in LED dimming because positional errors are not a big deal. The other two modes are similarly and incorporate counters that produce triangle waveforms. The counter produces a triangle wave because the counter counts from bottom up to top and then from top down to bottom. These two modes are commonly used in DC motors because of the need of low positional errors. The bits of accuracy dictate the range of the top value. Therefore, this chooses the amount of duty cycles the comparator can generate because microcontrollers work with integers. As a result, n bits of accuracy will provide 2N different duty cycle settings. The compare out operations are off, inverted, non-inverted and toggled. These modes give what happens to the out PWM signal when the counter reaches the comparator value. Non-inverted is the most easily realized because the duty cycles will directly correlate to the percentage of time the device is on. [12]
3.4.6 Heat Sink The most common failures in LEDs are temperature dependent. The reliability and lifespan of an LED is inversely proportional to the junction temperature. A small five degree decrease in junction temperature may possibly double the lifespan of the LED. The junction temperature is affected by three main things: ambient temperature; thermal path between the junction and the ambient; and power dissipation of the LEDs. The max junction temperature is typically specified for an individual LED. Therefore, a heat sink is utilized to transfer heat from junction of the LEDs to the ambient surroundings. This heat transfer occurs in four steps:
1. Transfer of heat from the junction of the LED to the case or PCB it is mounted on.
2. Transfer of heat from the case or PCB to the heat sink3. Transfer of heat through conduction within heat sink to the surface.
Radiation should also be considered depending on the composition of heat sink’s surface

31
4. Transfer of heat from the heat sink surface to the ambient surroundings by convection [13]
A good LED lighting system design should try to reduce the amount of heat that needs to be removed. Therefore, the LED driver circuitry should be separate from the LEDs so the drivers will not add to the junction temperature. The ambient temperature should also be reduced wherever possible. Finally, the thermal conductivity between the LED and the heat sink should be increased.
In addition, the heat in the heat sink must be dissipated or the heat sink temperature will just steadily increase. This dissipation can happen in three ways: conduction (solid to solid), convection (solid to moving fluid), or radiation (two bodies at different temperatures through electromagnetic waves). [13]
Certain factors should be taken into account when selecting a heat sink. The surface area of a heat sink should be large to allow for thermal conduction to take place within the heat sink. The aerodynamics of a heat sink should allow for adequate air flow. A lot of fins with a little space will not allow for air to pass relatively freely through the heat sink, but fewer fins will reduce the surface area needed for thermal conduction. Therefore, a compromise needs to be made between the surface area and the aerodynamics of a heat sink. [14]
In addition, a compromise between the surface area of fins and density of fins needs to be made as well. Thicker fins allow for better conductivity, which allows heat from the junction to actually reach the fins. If fins are made too, then the heat will never be transferred to them rendering them useless. The flatness of the contact area between the case or PCB and the heat sink should also be considered. A flatter contact leads to a reduced thermal resistance between the two. This flat surface can be enhanced through the use of thermal paste; which not only creates a flatter surface, but also is a good conductive material. With this being said, the mounting method of the case or PCB to the heat sink should have a high pressure to prevent any un-level contact. This is accomplished through the use of screws, springs and/or thermal paste. [13]
There are three main types of heat sinks that use different methods of dissipation differently.
1. Flat plates/Stamped heat sinks: a flat stamped piece of aluminum or copper sheet. They are a low cost solution to low thermal management applications. Commonly painted to enhance in thermal radiation. Typically a third of the heat of these heat sinks is dissipated through radiation.
2. Die-Case finned and Extruded finned heat sinks: a piece of aluminum or copper bended into fins to increase the surface area that thermal conduction takes place at. Radiation is less important because heat is typically transferred from fin to fin.

32
3. Folded fin heat sinks: similar to the other finned heat sinks, but have folded fins for increased surface area. The prevention of air flow can be a downfall for these types of heat sinks though. [14]
In addition, all heat sinks usually require a fan to provide air through the heat sink. These fans must be pointed in the correct direction so that airflow is into the heat sink and not out of the heat sink. Several small fans are PWM controllable allowing for the user to change the speeds at which the fans run. This is desirable because power will be wasted if the fans are running full speed when the heat sink is not hot. Therefore, if the temperature of the heat sink is monitored, then a set RPM rate of the fan can be selected for a certain range of temperatures.
3.4.7 DC Power SupplyThe main DC power supply for the LED lighting system will come from PV panels. However, there will be some condition where the PV panels will not be able to produce the power needed to supply the lighting system. When this happens a backup source of power can come through a wall outlet through the use of AC to DC converters. When the voltage of the PV panels fall below a certain value, then the power from the AC to DC converter will be need to supply the minimum forward voltage needed by the two individual LED strings. Power will only be used from the AC to DC converter when the PV panels fall below a certain voltage. This will still allow for a lot of power to be saved because the sun is typically out for several of hours a day.
3.4.7a Solar PanelsPV cells are usually created from Silicon, which is an extremely pure semiconductor material. However, other less pure mixtures of semiconductor materials are beginning to arise in PV cell fabrication. There are three main types of PV cells: monocrystalline cells, polycrystalline cells and amorphous cells. Monocrystalline PV cells are cut from a single silicon crystal. They have a smooth texture and are one solid color. These are the most efficient PV cells, but come at an expensive cost. Polycrystalline cells are sliced from a block of silicon contain a large number of silicon crystals. These cells are speckled and very reflective. Polycrystalline cells are slightly less efficient than monocrystalline cells, but are cheaper. Amorphous PV cells are a thin film of non-crystalline silicon. This is the least efficient and least expensive type of PV cell. The amorphous cells can be half as efficient as the other two. The power output of the amorphous cells also reduces over time; usually up to fifteen percent upon initial exposure to sunlight in the first six weeks. These amorphous cells come in a variety of colors and are typically connected in series to make panels.

33
The half volt produced by the typically PV cells is typically useless; therefore, PV cells are connected in series to increase the voltage and connected in parallel to increase the current to form a PV panel. PV panels produce max current when no resistance is in the load circuit and max voltage when there is a break (infinite resistance) in the circuit. However, for both of these cases the output power is zero watts because the voltage is equal to zero for max current and the current is equal to zero for max voltage. Therefore, manufactures’ specify max output power as a point on the curve between these two cases as a certain amount of watts at a certain voltage or current. This max output is for peak sun standard sunlight conditions. Standard sunlight conditions can change due to inclement weather or for certain times of the day. Therefore, a PV panel will not always produce this max output power. [15]
Certain precautions should be taken when using PV panels because the temperature of the panel in indirectly proportional to the output voltage. The typical reduced power estimate is .022V to .056 volts per degree of temperature Fahrenheit. Therefore, the PV panel should be installed so no air can get behind the module and heat it up. In addition, up to an eighty percent decrease in output power can occur if there is partial shading of the cells because it causes these shaded cells to heat up.
When building PV panels from scratch, the right kind of PV cells need to be chosen first. PV cells come in many different sizes, shapes types and price range. Whether the cells come already tabbed or not should be taken into consideration as well. The top side of each cell is blue and is considered the negative side of the cell. On this side there are several lengthwise strips that electrically connects are parts of the PV cell. The bottom is non-working side of the cell made of conducting material and considered the positive side. This side contains attachment points used for connecting cells in series or parallel. Tabbing involves soldering two wires perpendicular to these lengthwise strips of the negative side or to the attachment points of the positive. These tabbing wires can then be connected to the attachment points on the bottom of another PV cell to connect them in series or in parallel. Cells are can be easily damaged in the tabbing process; therefore, it is desired to start off with pre-tabbed cells.
Once wired the PV cells will need to be put into a wooden frame to securely mount them. The PV cells will be glues to this frame and the side of the frame where the negative side of the cells will face the sun should be made of a sturdy clear material. The cells should be tested before being glued onto the frame in case any of the cells need to be replaced. Glass and acrylic are common materials used for making this clear side of the frame.
Once glued into the frame, the ends of each string of cells should be connected with bus wires. These bus wires will be used to connect the negative tabs of one sting to the positive wires of another string or vice versa. Clamps can be used to attach the bus wires to the frame. At the end there should be two bus wires that

34
are not connected, one positive and one negative. These two wires will be the positive and negative leads of the entire PV panel. These wires will need to be protected from bad weather and this is where a junction box is implemented.
The junction box will connect the positive lead of the PV panel to the positive lead of the load and the negative lead of the PV panel to the negative lead of the load. Connecting wires can be used on the leads of the PV panels and load to connect them through a terminal block. A Schottky diode may be installed between the two positive leads to prevent reverse current from flowing through the panels when it is producing less voltage than a battery in the load. Finally, the PV panel should be tested to see if it produces the desired voltage and current before sealing the junction box and the clear front.[40]
3.4.7b AC to DC Power SupplyAn AC to DC power supply is used to convert the AC power that is powered through a house to a usable DC power that is provided to a device and can be thought of as a power supply. AC to DC power supplies typically consists of a plug that goes from a wall outlet into a box, and wire that comes out of the box and connects to the device. Inside of the box there is typically a transformer, a rectifier, and a regulator. The transformer is used to tune down the higher voltage from the wall outlet to a smaller voltage required by the device. Then the rectifier makes the current run in one direction, thus creating a DC voltage. Finally, the current passes through a regulator that insures a constant stream of voltage despite changes in power consumption.
There are two different kinds of power supplies converters: linear power supplies and switching power supplies. Linear power supplies takes an AC input, step down the voltage with a transformer, then rectify and filters the input into a DC output. Switching power supplies takes an AC input, but rectifies and filters in DC first, is converted back to AC at some high switching frequency, steps down the voltage through a transformer, then is rectified and filtered into a DC output. A switching power supply is more efficient than a linear power supply, but this efficiency comes at a cost. There are two different kinds of switching power supplies: unregulated power supplies and regulated power supplies. Inside of an unregulated power supply the transistor stays at a constant duty cycle. Whereas, inside of a regulated power supply the duty cycle of the transistor varies to keep the output voltage vary near the output voltage rating. Therefore, regulated power supplies provide better efficiency and protection, but also are more expensive. [16]
There are many different size power supplies .Careful consideration should be taking into the AC requirements of the power supply. Wall outlets supply different voltages in different regions of the world. The wattage of the power supply should be considered as well. Having a power supply that supplies less wattage than

35
what is needed by a device can significantly reduce the life of the power supply because of overheating.
Circuit Diagram
Figure 3.3 below, is the overall block diagram of how the LED lighting system should work. Each section is described below:
A.) This section is the DC power provided from the PV panel. The voltage of the PV panel needs to be larger than the higher forward voltage of the two strings. The strings can be connected in parallel to the PV panel; therefore, they share the same voltage. However, the current from the PV panels needs to be equal to the sum of the current that each string of LEDs will be driven at. For example. If the blue string of LEDs are driven at 1A and the white string of LEDs are driven at .5A, then the PV panel needs to provide 1.5A.
B.) This section is the power provided from the wall outlet in case the PV panel is experiencing brown out conditions. The power from the wall outlet is AC power; therefore, an AC to DC converter is needed to convert the AC power from the wall out to DC power. As noted with the PV panel, the voltage of the AC to DC converter needs higher than the larger forward voltage of the two strings and the current needs to be equal to the sum of the current each string of LEDs will be driven at.
C.) This section is where the voltage of one of the power sources will be provided to each LED driver and the current of one of the power sources will be split between the two LED drivers. This is why the current from the power source needs to be equal to the sum of the current that each string of LEDs will be driven at. The power from the AC to DC converter will only be used when the power from the PV panel is inefficient to drive the two strings of LEDs.
D.) This section is the two LED drivers that will need to drive each string of LEDs. Each LED driver will provided a constant current to each string of LEDs. Two LED drivers will be used in case the strings require different drive currents.
E.) This section is the PWM signal that will be provided to the LED drivers to dim each string of LEDs. Two different PWM channels will used so that each string of LEDs can be dimmed separately.
F.) This section is the two different strings of blue and white LEDs that will be driven. The numbers of LEDs that can be driven depend on the amount of power that can be provided by the power source. The high power provided the more LEDs can be driven in each string.
36
Figure 3.3 Block Diagram overview of Lighting System
3.4 Display ResearchThe display is the window into the present data that the ALARM system is collecting. It is important for the user to see what the current conditions of the fish tank. The parameters the tank will display are temperature, pH balance, power heads power consumption, and the time of day. Even though the information can be accessed via the Internet, it is much faster for the user to look for the information needed on the front of the tank.
There are a wide variety of displays ranging from LCD character displays to LED displays. The displays can have various sizes too. The most appropriate size and type of display is 2 by 16-character or a 4 by 20-character LCD. All of the information to be displayed can fit in this size and it is not too large either. LCD displays should have low power requirements.
HD44780U
The first display that was researched was the Hitachi HD44780U controller interfaced to a 2 by 16-character display. It is an extremely common type of set up. Since it very common there is not an issue for long lead times. This display has a simple interaction with the microcontroller also great flexibility. Different backlights and color schemes make this display versatile for any project. The price is a very reasonable at $7.90.
The supply voltage for this display is 5V at a supply current of 2mA. It can use 8 data lines from the microcontroller. However, if the microcontroller is limited, 4 data pins can be used. Other than the 4 to 8 data lines, only 3 other pins need to be connected to the microcontroller: Register Select, Read/Write, Enable Read/Write. To write to the display the RS and the Enable pins are high and the R/W line is low. Then 8 or 4 data lines can receive information from the microcontroller.

37
This display allows several types of display modes. There can be two lines of 40 characters each or one line of 80 characters. A shift register is built so that is possible to scroll the display considering only 16 characters on each line can be shown at once. A potentiometer can be added to manually control the brightness of the screen.
This display has a wide variety of characters as seen in Figure 3.5. The ALARM will display temperature, so a degrees symbol will make the display look more professional. In the case of a special character not appearing on the display sheet, the HD44780 allows for one a character to be made. In the ALARM’s display there will be a line of the display dedicated to an alert system. There are some special characters for the alert system, such as the bell in column 1001 and row 1000 in Figure 3.5, which will also make the display more appealing. [18]
Figure 3.5 shows a portion of the characters that the HD44780 can produce. Permission pending from Hitachi.
This LCD display is also available in a 4 by 16 or 20-character model. Figure 3.6 shows the 4 by 20-character display [19]. They are still interfaced in the same way as the 2-line display and use the same amount of power. Either 4 or 8 data lines can still send the data lines. Since there are 4 lines of information it could provide to be easier to use only 4 data lines. Since the information isn’t being cycled as it would be with a 2-line display. It would also free up the microcontrollers processing power. The price of the 4 by 16 is $12.90 and the 4 by 20 is $20.90.

38
AND481GST-LED
This display is a 2 x 16 character display from AND Displays that is LED backlight. It interfaces with the microcontroller in a similar way as the HD44780U. There are 8 data in/out pins. The other pins essential to the microcontroller are Enable, Register Select, and Read/Write. The way to write to this LCD display is the same as the previous one. The RS and the Enable lines are high and the R/W line is low. One benefit from using this display is that can be sample for free. If it is bought, however, it is $20.78.
3.6 Relay ResearchThe relays are integral part of the ALARM system’s function. They act as switch to turn the power heads, pumps, and heater on and off. They are designed to handle the loads of that the previously mentioned components draw but under a relatively small, in comparison to the loads, control signal. This means that a low power logic device, such as a microcontroller is able to control the relay. For the purpose of the ALARM system the user will be able to remotely turn off any of the components that are connected to the relay.
There are many types of relay switches. There are electromechanical relays that involve a coil of wire and movable armature. When the control signal reaches a specific threshold then an appropriate current passes through the coil and the armature “switches”. This in effect turns on what the relay is connected to. When the current is no longer present the armature switches back and thus the component is turned off. These types of relays are larger than most electrical components this is due to the coil. They can still be mounted onto a PCB.
There is another type of relay, which is of interest. It is a solid-state relay. A solid-state relay involves turning on an LED. This LED then powers a photovoltaic device, which allows the load to turn on. This relay is beneficial because there are no moving parts and it is more reliable. Solid-state relays can switch much faster than electromechanical relays. They are also much less noisy since this is not mechanical movement or coils. In addition, they are generally much smaller than an electromechanical relay. Figure 3.7 illustrates the relative difference in size of the two separate relays [20]. The resistance, however, is much greater than that of the electromechanical relay. Also, depending on the switching application the relays can become very hot and need heat sinks to be applied for heat dissipation.

39
Figure 3.7 shows the size comparison between a solid state relay and an electromechanical relay. Permission pending from Solid State Optronics.
The electromechanical relays typically require a high pull-in and holding current. Since a microcontroller is involved, its holding current could be an issue. The output current for a microcontroller is generally around .5mA. If an electromechanical relay is used then the current of the signal needs to be amplified via a relay driver IC. In addition to driving the load a protective diode must be added to protect the microcontroller from fly-back voltage when the relay switches to its on state. This would require more external design. Some relay drivers include this blocking diode in the chip. In the solid-state relay this is not as much of an issue. The current just has to be large enough to turn on the LED within the chip and this has a wide range.
ODC5 RelayThe ODC5 relay is a solid-state relay made by OPTO 22. It has 4 pins: Vin and Vout for the control signal and Vin and Vout for the load power. Since there are 4 pins it will act like a single pole single throw relay. Its casing has the same shape as an electromechanical relay, which makes it bulky. However, it is still possible to mount onto a PCB. This relay can turn on with a DC voltage of 5V at 12mA. This is an achievable current to turn on the relay. It will still need assistance from a relay driver a just a transistor to supply the amount of current to switch the relay from the microcontroller signal. The load voltage is rated up to 60V at 1.5A. This is sufficient for the LED drivers and the power heads.

40
VO14642AT Relay
The VO14642AT relay is a solid-state relay that is made by Vishay. This relay is package as an IC and is available in a DIP-6 package. Therefore it will have 6 pins:
• 1- Anode for the LED
• 2- Cathode for the LED
• 3- No Connect
• 4- Load in AC
• 5- Negative Load in DC
• 6- Load in AC or positive Load DC
It can be configure for AC/DC or DC only. The minimum turn on current for this chip is .5mA across pins 1 and 2. This is beneficial since the microcontroller has such a low output current. The maximum forward voltage across the LED is 1.5V. This will require some circuitry so that the max voltage is not exceeded since the microcontroller will supply 5V.
ORWH-SH-105H3F
The ORWH-SH-105H3F is an electromechanical relay by Tyco electronics. This relay is rated for a maximum 10A and 277VAC. The minimum coil current for this relay to turn on is 71.4mA. Because of this current there will need to be a driver or transistors to step up this current. This relay also requires a 5V rail on the coil, which is useful because the microcontroller has a 5V bus on board. This relay is ideal for switching the power heads, pumps, and heater since they will need to use power from the wall and it is design for this type of load. This relay is controlled by a signal by a minimum of .5V, which makes it ideal to be controlled by the microcontroller. This relay is a single pole double throw. This will allow the relays to have two different states. In addition, this relay is PCB mountable, will make it easy to utilize a number of them.
ULN2803A
The ULN2803A is an octal high voltage, high current Darlington transistor array by Texas Instruments. The purpose of this transistor is to drive the relays more specifically electromechanical relays. It is designed to be compatible with TTL. Therefore it will be able to interface with the microcontroller. It also does not require a current limiting resistor because there is one built in the IC. Another benefit of this driver is that it has diodes within the device to protect the microcontroller form fly-back voltage. Since the current output on most microcontrollers is extremely small the transistors will increase this current to turn

41
on the relay. The maximum output current for this device is 500mA.This value is more than enough current to turn on a relay that is needed. There are a total of 18 pins on this device:
pins 1-8 are the 8 input pins pins 18-11 are the corresponding outputs to the inputs, for example pin 18
is the output for pin1 pin 9 is connected to ground pin 10 is a common pin
Pin 10 is connected if the function of the blocking diode is needed, in which case it is connected to the common voltage of the relays control.
3.7 Sensor ResearchIn the Aquarium Lighting and Resource Monitor is going to use five different sensors. We will need temperature sensors to read the temperature of the water. We will use a pH sensor to measure the pH of the water to maintain a healthy pH level for the water. There is a leak detection sensor that will detect if water is running on the outside of the tank. The last sensor is a current sensor attached to wires to measure the current running through the wire. This will help us track the amount of energy being used by various parts in the system.
3.7.1 Temperature Sensor It is very important that the water temperature be consistent in aquariums. Rapid fluctuations in temperature can cause physical stress to fish that often results in disease. The water temperature needed in an aquarium can vary, depending on the organisms living in the aquarium. For a typical home Goldfish aquarium temperatures are around 65o Fahrenheit. In a tropical fish aquarium temperatures usually range from 76 to 78o Fahrenheit. The solution to maintaining the correct water temperature is a temperature sensor and an aquarium heater. [21]
Temperature sensors come in many different forms and vary in their specifications. The type of temperature sensor we’re going to use is a contact sensor. A contact temperature sensor measures the temperature of something by coming in contact with the object. It is cheaper to buy a temperature sensor and make it waterproof than to buy a submersible thermometer directly.
TMP100
The TMP100 is a temperature sensor from Texas Instruments. It features a digital output with an I2C Serial 2-wire interface. It has an accuracy of +/- 2.0°C when being used from -25°C to +85°C and a +/-3.0°C accuracy any higher than

42
85°C. This sensor can read temperatures with a resolution of 0.065°C. The input voltage for the TMP100 can range from 2.7V to 5.5V. One advantage to using the TMP100 is that it doesn’t require external components for use other than some pull up resistors. Another useful feature about the TMP100 is that it contains a Fault Queue which will count the number of consecutive measurements read by the sensor, outside the predefined temperature range programmed by the user. After a predefined number of faults the sensor will alert the ALARM so that it may turn on the fan to cool the heat sink. This prevents false alerts from happening after just one bad measurement. The TMP100 features a Shutdown Mode as well. This is where the sensor will make a reading when a 1 is written to the OS/ALERT bit then will return to the shutdown state when the reading has been made. This saves the overall power used by the sensor. These sensors are often used in power-supply temperature monitoring, battery management, environmental monitoring, HVAC, and much more. This sensor is offered as a sample through TI. Texas Instruments sells these sensors in bulk quantities of 250 or 3000 at a price range from $0.75 to $0.90 respectively [22]. The website aztronics.com sells the sensor in small quantities at $3.00 apiece. Shipping through aztronics.com is around $9.00 so the overall price of the sensor would be $12.00
DS18S20
The Maxim DS18S20 is a high-precision 1-wire digital thermometer. It is unique in that it only requires one port pin for communication. It may use this pin to power the sensor as well. This allows us to power the sensor without an external voltage supply. The DS18S20 provides 9-bit Celsius temperature measurements and has a nonvolatile user-programmable alarm function with upper and lower trigger points. This alarm function will be used to send a message to the microcontroller if the temperature of the water is too low. Each DS18S20 has a unique 64-bit serial code. This allows there to be multiple DS18S20s functioning on the same 1-Wire bus.
The DS18S20 can be powered in two ways. It has an input for an external voltage supply through its VDD pin, or it can operate in a special mode called “parasite power”. In parasite power mode, the sensor can function without a local external supply. Essentially, it steals power from the 1-Wire bus through the data pin when the bus is high. This voltage powers the sensor when the bus is high, and some of the voltage is stored on the parasite power capacitor to provide power to the sensor when the bus is low. When the sensor uses parasite power mode, the VDD pin must be connected to ground.
The DS18S20 can be powered in the range of 3 to 5.5 volts. The sensor can operate at a current as high as 1.5mA during temperature conversions or when copying data from the scratchpad memory to EEPROM. This can cause a problem due to unacceptable voltage drop across the pull up resistor and is more current than the capacitor can supply. Adding a MOSFET to pull the bus directly

43
to the microcontroller, rather than running it through a 4.7kΩ resistor, can solve the problem because the MOSFET will hold the signal high for the duration of the conversion or data transfer then switched back once the command is done. The DS18S20 can measure Temperatures from -55oC to +125oC (-67oF to +257oF). Its measurements have an accuracy of +/- 0.5oC accuracy when reading in the temperature range of -10oC to +85oC. This sensor can convert temperature reads to DC in 750ms. An advantage to using the DS18S20 is that it comes with a user-definable nonvolatile alarm. This can be useful to alert the microcontroller when the water temperature is outside of the user specified temperature range. Once the microcontroller is alerted, it will be able to turn on the heater to raise the water temperature or turn on the fans to attempt to lower the water temperature or the temperature of the lighting system. [23]
A disadvantage of using the DS18S20 would be that it is not water proof. There is a way to water proof the sensor with silicon and heat shrink tubing. This has the possibility of leaking water through and ruining the sensor and pin from the microcontroller though. This doesn’t affect whether it will be able to be used on the heat sink though.
Generic Digital Aquarium Thermometer with Probe
The ALARM can use this thermometer to receive the temperature of the water from an analog signal. This probe is normally powered by a 1.5V LR44 Button Battery so the 3V coming from the microcontroller in series with a resistor will be able to drop the voltage to 1.5V for the probe. The probe has a +/-1oC
3.7.2 pH SensorAquarium water pH is very important to the aquarium environment. It is used to judge the functionality of the tank. The pH scale runs from 0 to 14. Monitoring aquarium water’s pH levels work in increments of tenths. A pH reading of 7 indicates that the water is neutral. As the pH level goes down from the midpoint, the water is more and more acidic. As the pH level rises from the midpoint, the water is more and more alkaline. Each whole number indicates a change in acidity or alkalinity of 100 times. Having a stable pH is more important than having a specific value. Rapid changes in pH can be fatal for fish living in the aquarium. A change in the pH greater than 0.2 in a 24-hour period will cause physical stress to the fish. Most fish can live in water with a range from 6.5 to 8.0. Depending on the type of fish, some may prefer the pH to be higher or lower than that range. [24]
The ALARM system will use a pH probe to measure the pH in the aquarium once every 24 hours. pH probes need to be cleaned and recalibrated every 4 to 6 weeks. They should be fully replaced every 12 to 18 months.

44
Most pH probes are usually connected to a circuit through a Bayonet Neill–Concelman connector (BNC). Since the microcontroller that ALARM uses does not have an input for a BNC cable it will need to use an adapter to receive the data from the probe. Phidgets offers a pH/ORP adapter that takes a BNC cable input from a pH or ORP probe and transmits an analog signal to represent the measurements made. This adapter consumes 3.0mA and requires an input voltage in a range of 4.5V to 5.25V. The adapter can read an input range for pH from -400mV to +400mV. This adapter comes with a maximum error of +/- 0.09 pH and has a typical error of +/- 0.02 pH. [25]
3.7.3 Leak Detection SensorLeaks in aquariums are fairly common. Most leaks are caused by a failure in the sealant. The sealant can become weak over time and will begin to peel away from the glass. This can cause major problems for the owner in the area around the aquarium if the owner is unaware of a leak. These leaks can be fixed and it’s easier to fix a leak the earlier it is found.
There are many types of leak detectors on the market but most are for home water heaters. The leak detection sensor that the ALARM will use is going to need to run to the floor beneath the aquarium. Any water on the floor that touches the sensor will send a signal back to the microcontroller which will have to set off an interrupt to alert the aquarium owner. People have constructed such sensors to set off an audible alarm, compared to the ALARM where it will alert the owner through an email or text message.
3.7.4 Current SensorThe ALARM system is going to track the amount of power consumed by the owner’s aquarium components. To measure the energy consumed by these components, the system will need to measure both the voltage and the current waveforms. Multiplying the current and voltage together will give us the power in watts. This project will use current sensors to measure the current being used by various parts of the system. The data gained by the current sensors will be used to keep track of the amount of power being consumed by the system over long periods of time. This will allow the owner of the aquarium to monitor the cost of running the aquarium on a daily basis. Current Sensors will be used to monitor the amount of current used in the lighting system, the amount of current that will be supplied by the PV panel, the current being used by the pumps, and the current being used by the controller. The current will be put into an equation to find the amount of power ultimately being used by the system. The current sensors will be housed in the power strip that has all of the components of the ALARM system plugged into it. There are many different types of current sensors on the market, each with its own advantages and disadvantages. The most common devices used to find the power being used in a system include

45
current transformers, Hall Effect current sensors, AMR current sensors, current comparator, and shunt resistor current sensors. The ALARM system needs a sensor that will be accurate and reliable so the owner is not given false information when monitoring the power usage of the system.
Five popular current sensors are: magnetic current sensors, the Rogowski coil, Hall Effect current sensors, transformers, and resistive shunts. The ALARM system needs a sensor that will be accurate and reliable so the owner is not given false information when monitoring the power usage of the system. Current sensors monitor the current flow through a wire by measuring the voltage drop across a resistor placed in the current path. The sensor can output a voltage or a current that is proportional to the current through the measured path.
The amount of power used is found by multiplying the current times the voltage. Although, the current and voltage are continuously changing, so the 4.6 to use will be Power = Voltage(rms) * Current(rms) * cos(phase angle). This equation multiplies by the cosine of the phase angle between the current and voltage rms values to find the average power given.[26]
Hall Effect Current Sensors
The Hall Effect refers to the production of a voltage difference across an electrical conductor. In 1879, Edwin Hall discovered that a conductor that contains an electric current produces a magnetic field perpendicular to the current. These sensors are able to trace either AC or DC waveforms. Hall Effect current sensors have three terminals. Two of the terminals require a voltage for the sensor to work and the third terminal provides a voltage proportional to the current being sensed. The sensors are typically made from semiconductors. They work by measuring the Hall voltage across two of their faces when you place them in a magnetic field. To use a Hall Effect sensor, you simply run the wire being sensed through the hole of the sensor. The sensor will measure the magnetic field produced by the wire and will convert the field to a voltage that corresponds to the amount of current flowing through the wire. Hall Effect sensors usually produce small signal levels so the output signal may need to be amplified to create an appropriate reading for the microcontroller. [26]
When the sensor has no current going through the wire being sensed the output is half of the supply voltage to the sensor. For every amp that is run through the wire, the output of the sensor is increased by about 0.033 Volts. When using a Hall Effect current sensor we would use the equation:
Measured Current=(V out−
V ¿
20.033
)
46
Where Vout is equal to the output voltage the sensor is returning to the microcontroller and Vin is the voltage being supplied to the sensor.
While some current sensors can give off heat as the current being measured gets high, Hall Effect sensors do not give off heat no matter how much current being measured. Hall Effect sensors are immune to dust, dirt, and water. This is an advantage the Hall Effect sensor has over other devices. Another advantage the Hall Effect current sensors have is that they do not have a voltage transmitted to the sensor from the line being sensed which results in a safe way to measure the current. A disadvantage to using Hall Effect sensors is if there are surrounding wires to the one being sensed, the field may be affected which could result in inaccurate readings. Another disadvantage may be that the output voltage is so low that it must be amplified by a transistor-based circuit to give an accurate reading.
Honeywell offers a variety of Hall Effect Current Sensors. The CSLA2CD is a bottom mount sensor with a source output. The CSLA1CD can sense AC or DC current. This sensor has a response time or three microseconds. It requires a supply voltage of 5.7 to 13.2 Volts DC. The CSLA2CD can sense a maximum current of 72 Amps. With an operating temperature range of -25 oC to 85 oC this sensor would have no problem working in the ALARM system. These sensors are sold by Digi-Key at a price of $21.57 per sensor. [27]
Shunt
A shunt is a resistor intended for measuring high current levels. Texas Instruments offers a variety of Current Shunt sensors. Shunt current sensors measure the current in a wire by adding a resistor to the circuit and measuring the voltage drop across that resistor. The sensor will output a current or a voltage that is proportional to the current measured. To keep the shunt from disrupting the circuit, the resistor used is normally very small. Every shunt is rated by the maximum current and voltage drop it is able to measure. All shunts have a derating factor as well. The derating factor is applied when the shunt is going to be used continuously for more than two minutes. Something to keep in mind when designing a current shunt is that the current density must be kept constant for an accurate current measurement. Two types of shunt current sensors are available, high side and low side sensors. As shown in Figure 3.8 a high side current shunt sensor is a sensor that is placed between the voltage source and the load in the circuit. High side current sensing is normally used when low side sensing would create too much ground disturbance. A disadvantage to using high side sensing is that it must withstand very high common-mode voltages. Low side current sensing is when the shunt sensor is placed between the load and the ground. Low side sensing usually only requires an operational amplifier to implement the sensor. It is inexpensive, easy to implement, and accurate. The disadvantage is that it adds resistance to the ground path and may cause ground disturbance. [28]

47
Figure 3.8 Left shows Low-Side Current Shunt Circuit DesignRight shows High-Side Current Shunt Circuit Design permission pending
from TI
There are thermal limits to shunt sensors where they will no longer operate at a certain threshold. Thermal drift begins to occur at 80 degrees Celsius and becomes a significant problem at 120 degrees Celsius. Current shunts are very accurate with their measurements. Accuracy is normally within 0.25% in North America and 0.5% in the rest of the World.
Some problems may arise when using a shunt. Special material must be used to keep all of the coefficients as low as possible and maintain low levels of mechanical expansion. Another problem is that the shunt can get hot with too much current running through it. If the shunt gets too hot it can melt and can lead to big problems for the user. An advantage to using a shunt current sensor is the price.
Texas Instrument’s INA193 is a high-side current shunt monitor. The INA193 has a +/-2.2% maximum error. It has a minimum supply voltage of 2.7V and a maximum of 18V. It can sense voltage drops at common-mode voltages from -16V to +80V. The INA193 uses a transfer function to scale the output of the sensor to 20V/V. This sensor is commonly used for sensing current in notebook computers, cell phones, battery chargers, and power management systems. The INA193 can be purchased from Texas Instruments for $0.80. [28]
3.8 Database Management ResearchThe data collected from the sensors cannot stay on the main control board as there will not be enough room for a large list of data entries. This means that an external database needs to be used. The external database will be saved on the same server that runs the GUI for the controller. There will be a large collection of data that needs to be saved in a format that makes it easy to access and analyze. There should only be one person accessing the database at one time so there should not be that many complications, although there will be reading and
48
writings going on every minute, so queries need to be done quickly and in between updates.
MySQL
MySQL is a relational database management system that supports the structured query language (SQL). It is a widely used application because its open source license and many free front end programs. These front end programs allow administrators to easily go about various tasks such as backing up databases, merging databases, and restoring from backup. They also allow administrators to see the runtime of a specific query to see how they could better adjust the setting to allow for a faster result. There are also many interfaces for scripting languages such as PHP, which allow direct calls to a database from a webserver. [29]
mysql_connect("localhost", "admin", "1admin") or die(mysql_error());
SQLite
SQLite is an embedded relational database management system and is much smaller than MySQL. It is not a client-server model like MySQL and it has no running application. Data is accessed through function calls which can reduce latency in queries. Multiple threads and users can access the database at a single time with SQLite, but that is a feature that is not necessarily needed for the alarm system. [30]
$dbhandle = sqlite_open('db/test.db', 0666, $error);
3.9 Website ResearchThere are many different software systems that can be used to generate dynamic websites. Some possible systems are PHP, Perl, Python, ASP, and Ruby programming languages. Websites are hosted on at least one web server and are accessible through a network. PHP is a server-side scripting language. PHP websites can run on almost all platforms including Windows, Linux, Unix, and more. [31] Almost all servers used today are compatible with PHP.
An advantage to using PHP would be that it is easy to understand and learn for programmers with backgrounds in C, JavaScript, and HTML. Another good thing about programming with PHP is that it doesn’t use much of the system’s resources which allows the program to run fast without slowing down other processes. The PHP community is constantly working to expand the language’s capabilities. PHP allows for the use of many levels of security which can be adjusted by the programmer in the .ini file.

49
Using a modular system, PHP can interface with a variety of libraries such as graphics, XML, or encryption. Programmers can create their own extensions and their own executable if they like. This allows programmers to extend PHP as much as they need. Using PHP has many different server and database interfaces which will allow us to use an online database to track data for the aquarium. [32]
3.10 Networking ResearchWired Networking
Wiznet W5100- the Wiznet W5100 is a single chip Ethernet controller designed for embedded applications without an operating system. The device is IEEE 802.3 10BASE-T/100BASE-TX compliant, which means it can operate at 10Mb/s and 100Mb/s. The chip comes with a full TCP/IP stack with integrated MAC and PHY. It has a 16Kb buffer for sending and receiving information. It operates at 3.3V but has tolerance for 5V for the digital IO. It has multiple interfaces which include Direct Bus , Indirect Bus, and SPI. Direct bus means that there are wires connecting each pin directly to the microcontroller, which means there will be 14 wires for the address lines. Indirect bus means that it uses a register and a 2 bit address line rather than a 14. The final mode of communication is SPI, which stands for Serial Peripheral Interface. SPI uses only 4 wires for a communication channel. Figure 3.10 below shows these various connections.

50
Figure 3.9 shows the serial connections on the networking chip Pending Approval from WIZnet
The Wiznet 5100 is the main networking component of many Arduino shields including the official Ethernet shield. The Ethernet shield comes with a Networking library which allow for use of all the functions on the W5100. The shield allows for up to four simultaneous network connections. We do not expect there to be more than one or two at a given time, so this will allow for reliability in case another connection becomes stuck. The shield also provides an SD card slot for data storage, which will be helpful because the card will not have to be integrated into a different part of the PCB. The shield comes with a RJ45 jack, a reset button and LEDs to show the current of the system. [33] [34]
Figure 3.10 shows the serial connections on the networking chip Pending Approval from WIZnet
ENC28J60
The ENC28J60 is a small 28 pin 10Base-T standalone Ethernet controller with onboard MAC and PHY. It has an SPI interface with a clock rate of up to 20 MHz. It has a smaller Send/Receive buffer than the Wiznet at 8Kb. As shown in figure 3.11, it has an internal Direct Memory Access Module which means it can access the memory directly without CPU cycles, which means it has a higher throughput. It also has a hardware checksum calculator which means it does not need software to check the checksums of packets passing through. It is a 3.3V system, but along with the Wiznet it was built for integration into 5V systems, which means that is tolerant of the 5V IO. [35]

51
Figure 3.11 shows the ENC networking chip design Pending Approval from Microchip
Wireless Networking
ZeroG Wireless ZG2100 is a product created by AsyncLabs and Microchip. The chip itself contains MAC, RF and amplifier for the wireless networking . It operates at 802.11b speeds which are 1/2 Mb/s. It was designed for embedded devices with no operating system, which makes it perfect for the ALARM system. The ZG2100M is compatible with Microchips free TCP/IP stack, which means that little hardware level programming would need to be written to get a working device. The ZG2100M can use the same SPI interface as seen in the previous wired Ethernet diagrams. It can also use a UART, universal asynchronous receiver/transmitter, which can comply with standards such as RS232. Since each of the microcontrollers listed above has an SPI interface, it should be used over the UART, as shown below in Figure 3.12. [36]
Figure 3.12 shows the ZeroG networking overview Pending Approval from Microchip

52
3.11 Push Button ResearchPush buttons are essentially just switches that can be manually operated through a button. The press of the button just changes the on off condition of the switch. There are two main types of push buttons: the push to make/ tactile switch, or the push to break style switch. The push to make switch returns to its normally open (off) position when the button is released. This is the kind of switch utilized in a doorbell. The push to break switch returns to normally closed (on) when the button is released. Problems arise with push buttons when they are held too long because this may be read as multiple spikes of high and low voltages. Therefore, the push button may switch between a normally closed or normally open case several of undesired times. This can lead to problems in many applications that utilized the push button because the noise of high and low voltages may be interpreted by the digital circuit as noise more than one high or low pulse.. A solution to this problem is what is known as a de-bouncing circuit. There are two kinds of de-bouncing circuits: and analog de-bouncing circuit and a digital microcontroller based de-bouncing circuit. The analog de-bouncing circuit relays primarily on a capacitor that resist the voltage changes on the output, preventing high and low pulses from appearing on the output. The digital microcontroller based de-bouncing circuit does not prevent voltage spikes, but rather records and analyzes them in real time using software routines. The commonly used method to implement the de-bouncing is to make a counter that counts as long as a button is held high or low. If the counter reaches a certain fixed value, which should be 1 or two times larger than the noise pulses. This means that the current pulse is a valid push.

53
Chapter 4 Design
4.1 Design SummaryThe design for the ALARM breaks down into several sub-systems that all coordinate with each other to achieve its function. The subsystems that the ALARM utilizes are the LEDs, relays, the sensors and the front display. Each of these subsystems is designed to assist and maintain the quality of the aquatic life. They achieve this function by allowing the user to manipulate the functions of the tank as well automating the process to limit the user’s interaction with the system.
One of the most important subsystems is the LED system. It is vital for the marine life to receive light, as this is their natural environment. There will be 2 separate strands of LEDs that will supply this light to mimic sunlight. Since the LEDs will be mimicking sunlight, then they will be on during the day. Although LEDs consume less power than fluorescent and incandescent bulbs, they still consume a high amount of power; especially the LEDs for this application. Therefore to save some for the power there will be a PV panel to specifically power the LEDs. The sun will not always be available during the day due to cloud coverage. Therefore the ALARM will have an LED failsafe power supply. This will be connected in parallel to the PV panel. The panel will be protected from the power supply by a Schottky diode to block unwanted current flow.
The power from either the PV panel or the power supply, depending on which one is on, will go to the LED drivers. The drivers will supply constant current to the LEDs. The drivers will also allow will be the point at which the microcontroller will interface with the LEDs. The LED drivers have a pulse width modulation pin. This pin will allow the microcontroller to control the duty cycle of LEDs, going from completely off to full power. This aspect will allow the user to automate sunrise and sunset. The user can schedule sunrise and sunset through the website. In addition to automating this process, the user can manually override the function by utilizing the push buttons on the front.
The next major sub section is the relays, which involve the custom power strip. This system involves a custom power strip in which the user can plug in 6 components that are common to sustaining a marine life. Such as, power heads, pumps, heaters. The function of the custom power strip will allow the user to control the individual components through the relays control. The user will can control the relays through the website. In addition, there will be automation as well as manual overrides. For example, the systems heater can be controlled automatically based on the temperature sensors in the tank and the threshold that is desired. Also, the push buttons will allow the user to turn of the pumps and the power heads manually. This is considered the feed mode.

54
The sensor design is another important subsection. The four types of sensors are temperature sensors, a pH sensor, current sensors, and a water leak sensor. The temperature sensors are programmed to interact with the heater of the fish tank. For example, if the user wants to the heater shut off after a certain temperature is reached. Then, the microcontroller will receive data from the temperature sensors and turn the heater off. The pH is a vital sensor for monitoring the conditions of the tank. However this sensor will be purely informational to the user. Even though the pH sensor does not control the function of the ALARM, if there is a problem with the either the temperature of the pH the user will be notified on the LCD by the “Alert” line flashing. In addition to being notified on the website. The current sensors will sense the current through each of the components through the custom power strip. Then the information will be plotted on the website. This information can be used to determine if the specific component is using unnecessary power. The last sensor is the water leak sensor. This sensor will make sure the user is aware of an overflow or a leak in the tank. This is done by alerting the user through the LCD and the website; similar to the temperature and the pH.
Finally the database will store all of the information pertaining to the temperature, the pH, and the current usage. The ALARM will also plot trends of the current, pH, and temperature. The user will be able to see the past and temperatures of the aquarium. This also the point at which the user can set lighting schedules and feeding schedules. The overall integration of the subsystems can be seen below in Figure 4.1.
Figure 4.1 shows the overall hardware block diagram of the ALARM system

55
4.2 Power Management DesignPower is critical for the ALARM system because it is vital to the inhabitants of the aquarium. There are three separate power systems for this project. The first is the LEDs’ power system. This system will be the one that utilize the PV panel and a failsafe power supply. The next power scheme involves the sensors, microcontroller, LCD display, and the control power for the relays. The last power consideration is the custom power strip. This will involve the load power of the relays, which is the AC power from a standard wall outlet. This power strip will allow the user to plug in their power heads, heaters, and pumps. Then, the user will be able to remotely control each one of them.
4.2.1 LEDs powerThere are a lot of considerations with the power. The power for the LEDs has numerous ways to be set up. The same goes for the power for the rest of the circuit. The LEDs are to run primarily off of the PV panel, but for the LEDs failsafe power there were some decisions on how it should be supplemented. One scheme is to connect a battery in parallel to the solar panels. Then, when the solar panels cannot supply power the battery would take over. This option would require not only a battery but also a charge controller to maintain and monitor the batteries charge. Also, it would require maintenance of the battery. This would not be the best solution because the lights are mostly required during the day. Therefore the battery would not be used much unless it is a cloudy day. In addition, the battery and charge controller is an added cost. Therefore, this option is not ideal for operation in the ALARM system. .
Another option is to substitute the battery for a power supply. The power supply would need to have a lower voltage than the PV panel. So once the PV panel dropped below the threshold the power supply would then supply the power to the LEDs. There will need to be a diode placed to block current from going to the PV panels whilst the power supply is on. It was previously established that the LEDs would be during the day. So, the power supply will not to be on as often. A power supply is less costly than a battery and charge controller. The power supply model is more reliable and does not require much maintenance. Due to its infrequent use it will is more ideal for the ALARM system.
The LEDs that are being used are 6 Cree XM-L cool white Vf 3.3V at 2.2A and 6 Cree XP-E Royal Blue Vf 3.4V at 800mA. There are 2 strands of LEDs with 6 LEDs in each strand. Therefore to turn on each strand a minimum of 20.4V and 2.2A is required. As stated earlier, the better design to use is one that utilizes power supply in parallel with the solar panel. As stated earlier the power supply’s voltage needs to be lower than the solar panel’s average voltage. A reasonable power supply then would be one that is 24V. The PV panels should output more than 24V for this system to work without using the power supply unless it is

56
needed. For this design the PV panels are going to be custom built to supply a voltage of 28V. This is an advantage because there is no need to buy multiple panels to try and equate the total voltage to 28V. Most panels are available in voltages of 6V, 12V, and 24V. Therefore, at least 2 panels would have to be purchased to equal the necessary forward voltage. Also, the total voltage would be more than desired.
When running a PV panel in parallel to a power supply it is important that the current generated from the power supply does not flow into the PV panel. This could damage the function of the PV panel. To prevent this damage from occurring, a Schottky diode is placed with the cathode towards the power supply and the anode in the direction of the PV panel. A Schottky diode is preferred because it has a small forward voltage of around 0.3V, so the PV panel will not drop much voltage across the diode . A diode rated at 30V or higher would be enough to block the current from flowing into the PV panel.
The LEDs are going to be controlled by the user through a computer. Originally a relay was going to be used to achieve this function. The LM3401 LED driver, however, is capable of switching the device on and off through the pulse width modulation input. If the duty cycle is at zero percent then this will create an open circuit on the IC. Thus, the LEDs will be functionally turned off. By utilizing this design method the overall design will need 2 fewer relays.
4.2.2 Power Heads, Heater and PumpsThe power heads, heater, and the pumps are all powered on the user’s home grid. Since the user will be able to control these devices remotely, relays will be used. In order for the relay to work the load of the relay needs to be connected to the input power of the device. In the case of the power heads, heater, and pumps this power will be 120VAC. To hook this up to a relay the power cords for each of these components will need to be cut and spliced. This is not only dangerous; it is impractical for the user to do. The ALARM system will utilize the use of relays is to create a modified power strip. This will create a safe way to control the components without any risk to the user.
The power strip will act as any other power strip. However, inside the power strip there will be relays. Therefore, each correspond plug will be hooked to relay which is controlled by the microcontroller. The only exception is that the power heads will be controlled by the same relay. This is because there is not an advantage to disconnect one power head without the other. The total amount of relays is needed for the design is 5. Now there is no need for stripping or splicing of dangerous power cables.
The power strip will have a total of 6 plugs; this is usually the standard. Small salt-water aquariums will usually have 2 power heads, 1 heater, and 1 pump. The ALARM system’s power strip will also provide the user with 2 auxiliary power

57
inputs. Depending on different tank set ups, the user may use a protein skimmer, sump, extra pumps, or heaters. This will give the user some flexibility when for different tank variations.
The construction of the power supply will consist of 3 U.S. standard outlets. With the exception of the power heads’ outlet, each outlet plug will be separated so that control is independent. Outlets come with tabs on the positive and negative sides that can be cut to separate the ties between them [37]. Each outlet will have its own junction box. Each junction box will store the connection for the relays. From the each junction box the control signals for each of the relays will go into a serial bus. The serial bus shown in Figure 4.2 is mostly a cosmetic and functional choice. There will be at least 5 control lines and 5 lines for the control power, the 5V rail for the relay, leaving the power supply to the microcontroller. The 3 junction boxes will then be set into a larger case. Again, this design choice is for organization and functionality. Once all of the outlets are set into a larger case, the design will resemble that of a power strip. The serial bus will be mounted on the side of the outer case.
Figure 4.2 A) The left image is the ALARM system’s custom power supply. The green area is where the PCB will be mounted. The right image shows
the serial bus which is mounted near the PCB.
4.2.2a Power Strip PCBInside the larger case consisting of the power strip there will also be a PCB. This will contain the ULN2803, the 5 relays it controls, and the Hall Effect current sensors. The reason for placing the PCB inside the power strip is to minimize the amount of wires coming out of the strip. If this PCB was placed near the microcontroller and the other components then each relay would need 2 lines each, in addition to the 5 Hall Effect current sensors. This would total 16 wires. Not only are there a lot of wires, some of these particular lines would contain the load power. So, these wires would probably be best if they were contained inside the power strip. With the PCB inside the power strip only 11 lines need to leave the power strip. These lines would be the 5V rail for the relays and the common for the ULN2803, the 5 control signals going into the UL2803 and the 5 current sensor wires. All of the wires going to the microcontroller will be sent through a

58
serial bus for organization. The total amount of wires and the risk is reduced in this configuration.
The serial connecter needs to have at least 11 connection pins to fulfill the needs of the ALARM system The common types of connectors are for this application are db connectors in 9 and 25 pin configurations. There are 15 pin applications; however they are not as common. Therefore, they are not readily available. The best option is to buy utilize one set of 25 pin connector rather than use 2 sets of 9 pin connectors. Also, at Futurelec.com they are both priced the same therefore the 9 pin connection scheme would end up being twice as expensive. In addition to the connectors, a 6ft cable to combine them will need to be utilized.
4.2.2b Relay SystemThe best relay for this operation is an ORWH-SH-105H3F, which is a single pole double throw electromechanical relay shown with pin outs in Figure 4.3. There are few reasons for this relay over the others. The first is the price. This relay is $1.83 per package and most of the solid states for similar power ratings were around $10.00. Another reason to justify that cheaper is better in this situation is because the relays will not be used frequently therefore wear and tear is not a major issue. The relays will be connected to the ULN2803 to gain the extra current for switching.
Figure 4.3 shows the pin outs of the relay.
Based on Figure 4.3 the pin outs are as follows:
1. This is the pin that will be connected to the 5V rail, which is the required voltage to turn on the relay.
2. The ULN2803 will be connected to this pin to allow the control of the relay3. This pin is connected to the arm of the relay. It will be connected to the
negative of the load power4. This is the pin for the positive load when the relay is on. It can also be a
no connect pin.

59
5. This pin is active when the relay is off. It can be connected to the positive load power or it can be a no connect pin.
Since the relays are controlling the power heads, heater, pumps and auxiliary components it is important to note when each of those are on. For instance, the power heads are going to be basically all the time, unless the user has activated feed mode. In this case the relay should only turn “on” when the power heads are turned off. This will make allow the relays to not be on all of the time. For the power heads making pin 4 a no connect will allow this function. The same thing will apply for the pumps. As for the heater, either implementation will work. This is because the heater will be cycling more often due to the water temperature. Therefore, it will be turning on and off a lot more frequently and it will not be advantageous in either case of connecting pin 4 or pin 5.
The 5 control lines coming from the microcontroller into the A.LA.R.M.’s custom power supply will be going to the ULN2803. This device is an 8-channel Darlington driver. It will be able to drive up to 500mA of current to help the microcontroller turn on the relays. The output current of the ULN2803 depends on the input as well as the common voltage. The input voltage from the microcontroller is 5V. The common voltage for the relays and the ULN2803 is 12V. The resistance of the coil in the relay is 70Ω. Based on all these numbers the current going to the coil is 160mA. The coil current need to turn on the coil is 71.4mA. In the worst case when all of the relays are in there on state and conducting current across their coils they would draw at total of 800mA. Therefore, the 12V power supply needs to be able to handle this load in addition to the 100mA from the current sensors. Figure 4.4 below show the configuration of the relay subsystem.

60
Figure 1.4 shows the block diagram of the relay sub-system.
4.2.3 Sensors LCD and Microcontroller PowerThe power for the rest of the circuit is less complicated because it does not require the PV panel. It only requires a power supply and some circuitry to properly supply all of the components. All of the sensors, except the current sensors, and LCD display don’t utilize more than 5V. The microcontroller can use 3.3V-12V. To power the microcontroller can utilize a 12V power supply. The microcontroller has a regulated 5V bus built onboard. This can be used to power the LCD display, the temperature sensors, and the pH sensor. The relays need at least a 5V rail to turn on and will draw 160mA of current each. Also, the current sensors can be powered off of 12V and will draw 19.2mA each. The 12V power supply will be used to power not only the microcontroller but the current sensors, the help control the relays, and the ULN2803. The relays control power and the current sensors control power will have a total current of 900mA. The 12V power supply will need to supply at least 1.5A.
61
On the ATmega 2560 microcontroller there is a 5V out bus shown in Figure 4.5. Connected to this bus will be the LCD screen, 3 temperature sensors, and the pH sensor. The maximum current draw from this bus is 50mA. Each of the temperature sensor draw around 1.5mA each. The pH sensor will draw 3mA. The LCD display will draw a typical 2.4mA. This is definitely within in the bounds of the 5V buses maximum current. [38]
Figure 4.5 shows the 5V supply of the Mega 2560. Permission pending from Arduino.
From the 12V power supply the microcontroller the sensors and the relays can be connected in parallel. The microcontroller has a linear regulator on board this will limit the current to 800mA max and 5V max. Although the voltage is limited the microcontroller has faster clock rate at a higher voltage and is recommend to be powered with at least 7V. All of the current sensors need to have at least 100mA. A resistor of 120Ω from 12V will supply enough current. The relays will be drawing current periodically and at maximum they will need at 800mA.
In Figure 4.7 below, the general block diagram of the power scheme is shown. The 12V power supply is essentially the main power source for all the components except the LEDs. The blocks connected to the microcontroller’s output are coming built in linear regulator from Figure 4.6 located above.
62
Figure 4.7 shows the general power block diagram layout.
4.2.3a Current Sensors, Relay and Microcontroller Power SchematicThe design for the temperature sensors, pH sensor, and the LCD is separate from the microcontroller and the current sensors design. The design for the temperature sensors, pH sensor and the LCD can be seen in Figure 4.8. The resistors R1, R2, and R3 are used to simulate the temperature sensors. The sensors will drop 1.5mA. R4 is used to simulate the pH sensor and it drains 3mA. The pH sensor is not grounded instead it is sent to straight to the A/D convertor and the 5V supply is used as the reference. The LCD display has a10kΩ potentiometer to vary the contrast in the display characters.

63
Figure 4.8 shows the schematic of the temperature sensors, pH sensor, and the LCD display.
In Figure 4.9 below, the power scheme for the current sensors, the microcontroller, and the relays are shown. The 5V DC source is to simulate the logic signal sent by the microcontroller. The microcontroller simply needs 12V and it has on an onboard linear regulator to step down the voltage as well. Another portion of the 12V bus goes to the pin 1 of the relays as shown in figure XX previously. In the simulation software used, Multisim, some of the parts were not available in the current library. For instance, the ULN2803 was not available. Therefore a sub-circuit was created with the parts internal components consisting of Darlington pairs and blocking diodes. Also, the relays that are being used were not available. However, there is generic current controlled switch, which is essentially what how a relay works. By modifying the current controlled switch with a current threshold of 71.4mA and adding a resistor of 70Ω in series it is a simulated relay that is needed. The 120 Ω resistor is designed for the current sensors power. It will draw 100mA of current to drive the sensors.

64
Figure 4.9 shows the schematic for the power of the relays, microcontroller and the current sensors.
Based the schematic an estimation of power consumption can be made for these components. Since each relay will have a resistance of 70Ω and the current through the coils of the relays is 160mA, then the power for just the five relays is 8.96W. This value is also the maximum power of the relays. They will be in scheme in which when the relay is “off” the load will be on. Thus, the relays will only be consuming power when the components in the power strip are off. The power consumed across the resistor for the sensors will be 1.2W.
4.3 Microcontroller DesignThe initial design plan for the microcontroller was to design and build a PCB which would house the main MCU, the networking chip, the power management circuits and all the connectors needed for the final construction. After researching all of these individual components the group found a few products that met all these requirements, and which could be purchased for less than it would cost to build and assemble a one off PCB.
After careful considerations the Arduino Mega was chosen because it meets all of the needed criteria and also adds more features that can be used elsewhere in the project. The Arduino Mega board has built in power regulation and can take an input of 6-20 volts, and provides the proper voltage for the Atmel 2560 and the USB interface. It also provides 3.3v and 5v rails for other components via an onboard FTDI chip. The power for the board can come from either a USB connection or from an AC/DC adapter. In the final application the power should come from a 12v 1.5 Amp DC power supply. The Arduino Mega is compatible with the Arduino Ethernet Shield which will make the networking and programming portion of the project more manageable.

65
There are different pin distributions on the Arduino unit. The previous figure shows the different areas of the board starting with the PWN pins, all of which have the ability to send a 10 bit PWM signal to a device connected to the pinout. The second is the communication subsection of pins which contain the send and receive pins for the four UART serial connections that come with the Atmel 2560. The third section located on the far right contains all of the digital IO pins that may be used to connect to various sensors. Though they are capable of input, they will be used primarily for the output going to the relays which control the power aspects of the ALARM system. The fourth section is the “analog in” section located on the bottom right of the board, this section will be very full because there are many analog sensors that need to be read and converted to a digital representation for analysis at a later time. The final section is the power section located at the bottom left of the board. This section contains all of the pins that will supply power for the various sensors and the relays. This section contains a 5V pin and a 3.3V pin and the common ground which is needed for nearly all of the things connected to the board.
Pinout
There will be 4 temperature sensors and 5 power sensors, and one pH sensor in the ALARM system which will each require the analog input ports. There will be 5 relays that each requires one of the digital IO ports. Each of the two front buttons will require one digital IO port. The front LCD display will require 6 Digital IO Pins. Table 4.1 shows where each pin on the microcontroller is getting its input.
Device Name-Location Pin Number
Temp 1-Tank Analog 1
Temp 2-Tank Analog 2
Temp 3-Tank Analog 3
Temp 4- LED Analog 4
PH - Tank Analog 5
Power 1- RelayBoard Analog 6
Power 2- RelayBoard Analog 7
Power 3- RelayBoard Analog 8
Power 4- RelayBoard Analog 9
Power 5- RelayBoard Analog 10
Relay 1-RelayBoard Digital 27
Relay 2-RelayBoard Digital 28

66
Relay 3-RelayBoard Digital 29
Relay 4-RelayBoard Digital 30
Relay 5-RelayBoard Digital 31
LCD RS- FrontBoard Digital 32
LCD Enable- FrontBoard Digital 40
LCD D4-FrontBoard Digital 41
LCD D5-FrontBoard Digital 42
LCD D6-FrontBoard Digital 43
LCD D7-FrontBoard Digital 44
Button Feed-FrontBoard Digital 45
Button Lights-FrontBoard Digital 46
Table 4.1 MCU pinout
The following table contains the specifications and a summary of the Arduino Mega 2560 board. The specifications in the list meet the requirements for the microcontroller which were proposed earlier in the specifications portion of the project. This makes this board a valid microcontroller for the Alarm System.
Microcontroller Arduino Mega 2560
Operating Voltage 5V
Input Voltage (recommend) 7-12V
Input Voltage(limits) 6-20V
Digital I/O Pins 54
Analog Input Pins 16
DC Current per I/O Pin 40 mA
DC current for 3.3V Pin 50 mA
Flash Memory 128KB – 4 of which is used for a bootloader
SRAM 8KB
EEPROM 4KB
Clock Speed 16MHz
Table 4.2 Arduino Mega Summary [38]

67
Microcontroller Software Design
To write software for the Arduino Mega board you will need to install and run the Arduino development platform. It is available for free from the Arduino website and will allow you to compile and upload code from one single piece of software. Each piece of code for the Arduino will need to have at least two functions; these functions are setup and loop. Setup function is run first and set up all of the pins to correct mode for input and output before the main loop begins. The setup method is only called once by the Arduino on startup or on reset. The second method is the Loop method which will contain most of the code that is needed to run the ALARM system. The loop method runs sequentially after the setup method and will continue to run forever, or until the board is shutdown or reset. There will also needs to be interrupt sequences for the system which will allow user operations to affect the system instantly rather than waiting for the main loop to continue.
Necessary Methods and Functions
Inside the main loop there will need to be other functions which will do a variety of things for the ALARM system. These functions will be described below in detail. There is a flow of information that needs to be analyzed and saved before continuing on to the next stage of the loop. The process flow chart below, in Figure 4.11 , shows the main loop flow.

68
Figure 4.11 shows the main software logic flow
SensorInput()
sensorInput is a function that will complete an analogRead() for all the sensors in the system. It will then wait for their results to be converted to a digital number and then save them at the proper formatted number in Fahrenheit or Celsius. It will take all of this information that it has gather from all the sensors and save them in a temporary global structure which will be used by other functions in the main loop.
SendData()
sendData is a function that will take the global sensor structure that was mentioned above and format the data in a way that the database can use it. It will then establish a network connection to the MySQL database and pass the entire sensor information to the MySQL server.

69
MonitorTemp()
Monitor temp is a function that will help keep the temperature of the tank at the optimal desired level. This function will use the temperature sensor input that was saved at the most recent call of sensor input and compute what needs to be done to keep the proper temperature. If the temperature is too high, it will first turn off the heater via the relays, if that does not help lower the temperature a chiller or fan will be activated via the relays, and if that does not lower the temperature to a valid level an alert will be sent to the user letting them know that their tank is at an unsafe temperature. If the temperature is too cold the chiller/fans will be turned off via the relays and the heater will be turned on if it was in the off position.
MonitorLED()
This method can be used to control the temperature of the LED enclosure and heat-sink. The enclosure will have one fan that will be controlled via PWM. If the temperature of the heat-sink goes past a certain level the fan will be turned on, if the fan does not cool it to the proper level, the duty cycle will be increased. This will continue in intervals of 10% until the duty cycle of the fan is at 100%. If this does not bring the temperature to a safe level the LED drivers will be shut down and the lights will deactivate.
GetSpecifications()
GetSpecifications is a method that will check to see if anything has changed in the global variables. The global variables will represent all of the settings for the system and if they are changed via an interrupt. If any of these variables have changed it will affect the rest of the system and GetSpecifications will change anything that needs to be changed.
Interrupt Sequences
There will be various interrupts that will occur during the operation of the ALARM system. They will generally happen when something is changed on the website interface, or when a user interacts with the front display. They can also happen when an alarm is tripped such as the water leak detector, or a temperature warning. A few of the interrupts for the system are listed below, and shown in Figure 4.12 and Figure 4.13.
feedMode()
FeedMode is an interrupt sequence that will be activated when a user presses a button on the front display of the ALARM system. This interrupt will force all of the pumps in the aquarium to shut off for 5 minutes. This will ensure that the food will get to the inhabitants in the aquarium and will not sucked into the filters or

70
caught in the power heads or other various pumps. The figure below shows a block diagram of this interrupt.
Figure 4.12 show the feed mode interrupt sequence
LightMode()
LightMode is an interrupt sequence that will increase the state off the lighting system by one every time it is pressed. There will be five states in the lighting system. Stage one will be there both the blue and white LEDs will operate at the set PWM level for standard lighting. Stage two will be when the white LEDs are at 0 and the blue LEDs are at the normal operating PWM level. Stage three will lower the blue LEDs to a 0 PWN and have the white LEDS at the full operating level. Stage four will be there the LEDs, both white and blue, will be shut off completely. And finally stage five will be a user customizable level which can be set from the website. The figure below shows an overhead block diagram of this interrupt.

71
Figure 4.13 shows the light state sequence
Arduino Library Methods
Because the Arduino is open source it has access to many libraries that can help with prototyping of embedded systems. The libraries are there to make the programming portion easier to test and allow for faster development. These libraries have been tested thoroughly by others and the Arduino community, so if there is something that goes wrong it is least likely to be a method from the libraries, which will help in the debugging process.
delay(): The standard Arduino delay function is used to pause the program for a specific amount of time which is matured in milliseconds. This function does not disable any of the interrupts, and all of the serial communications will continue and the buffers will be saved in the same order that they are received. These functions will be used when waiting for analog signals are read or when the ALARM system is waiting until the next loop to be run. It does not need to be run continuously so delay will be used to make the main loop wait for a period of time. [39]
AnalogRead():The standard AnalogRead function is used to get input from an analog input and converts it to a digital representation. The Arduino Mega contains a 16 channel 10 bit analog to digital converter. There are 1024 possible values for the results, which means that the AnalogRead function has a precision

72
of 4.9mV. The read time for an analog input is 100 microseconds, which means that the Arduino Mega can read from a sensor 10,000 times a second [39] The programmer calls analogRead by inputting a pin number, and it will return an integer from 0 to 1023.
DigitalWrite(): DigitalWrite is the standard Arduino function that will set an IO pin to either Low(0v) or High(5v). This will be needed to send data to the relays and control the LCD display. [39]
LiquidCrystal : : LiquidCrystal is a library is used to drive LCD displays through the Arduino. The ALARM project is going to use one a 4 line LCD. The following code snippet will allow the Arduino to connect to the LCD. You initialize the connection by setting the pins in the LiquidCrystal LCD() function. The Begin method sets the Columns and Rows that will be in the LCD itself. And Finally the Print method allows the user to print a string to the LCD display.
#include <LiquidCrystal.h>
// initialize the library with the numbers of the interface pinsLiquidCrystal lcd(12, 11, 5, 4, 3, 2);
void setup() // set up the LCD's number of columns and rows: lcd.begin(16, 4);// Print a message to the LCD.lcd.print("hello, world!");
(Reprinted through LGPL license via Arduino)
4.4 Lighting system DesignThe ALARM system will utilize an LED lighting system that incorporates two dimmable strings of LEDs. The ALARM system will utilize high power CREE LEDs for their high lumen output and spectral range. The white string of CREE LEDs will consist of 6 CREE XM-L 8300K Cool White LEDs. These LEDs have a minimum lumen flux output of 280 lumens at 700mA. However, the maximum drive current of this LED is 3 A; therefore, a higher lumen flux output is possible. The blue string of CREE LEDs will consist of 6 CREE XP-E Royal Blue LEDs that have a spectral range of 450-465 nm. These LEDs have minimum lumen flux of 39.8 lumens at 350 mA. However, the maximum drive current of this LED is 1 A; therefore, a higher lumen output is possible. Both LEDs will come mounted on a star shaped PCB mount.
The ALARM system will utilize two LM3401 drivers to maintain a constant current supplied to these two stings of LEDs. The blue string of LEDs will be driven at a

73
constant 800mA. This current was chosen because to preserve the lifetime of the LEDs. At this current the LEDs will still output a high lumen without driving the LEDs at their maximum drive current. At 800 mA the forward voltage of a single CREE XP-E Royal Blue LED is 3.5V. Therefore, the entire string of 6 blue LEDs requires a forward voltage of 21V and because they will be tied in series with each other the whole string shares the 800 mA. The white string of LEDs will be driven at a constant 2.2 A. This current was chosen because to preserve the lifetime of the LEDs. At this current the LEDs will still output a high lumen without driving the LEDs at their maximum drive current. At 2.2 the forward voltage of a single CREE XM-L Cool White LED is 3.3V. Therefore, the entire string of 6 blue LEDs requires a forward voltage of 19.8V and because they will be tied in series with each other the whole string shares the 2.2A. Therefore, the LED for the blue string will need to provide a constant 800 mA and the white string will need to provide a constant 2.2A.
For the LED drivers to provide these constant voltages they must be supplied a minimum voltage of the largest forward voltage required between the two strings, which is the blue string of LEDs. Therefore, the minimum voltage required is 21V. The two strings of LEDs will be in parallel with each other and in parallel with the voltage sources. Therefore, the voltage sources will have to provide at least 21V and at least 3A to successfully power the LEDs. The power for the LED system will come from either the PV panel or the AC to DC power supply when the PV panel is experiencing brown out conditions. The two power sources will be connected in parallel with each other; therefore, there needs to be a difference in voltage between the two so that the AC to DC power supply is not always on. The minimum commercial size AC to DC supply over 21V is a 24V AC to DC power supply. This means that the PV panel will need to output around 4V more than the DC converter. However, PV panels do not come in a standard commercial size of 28V. The next highest standard commercial size is a 30V PV panel; but, at 3A a 30V a commercial PV panel can be fairly expensive. Therefore, the ALARM will utilize a self-built PV panel to save in cost.
Finally, the LEDs will be mounted onto an 8.46” by 12” extruded fin heat sink that is not tabbed. The heat sink will be cooled by a 200x200x30mm NZXT 200mm cooling fan. The cooling fan will be controlled by a PWM signal that will adjust the duty cycle based on the temperature of the heat sink. The temperature will be polled by a Maxim high-precision 1-wire digital thermometer.
4.4.1 PV PanelThe complete PV panel design discussed in this section is shown below in Figure 4.14. The PV panel will be created from 56, .5V, 3.6A Evergreen solar panels. The individual cells are presented as the blue boxes in the diagram above. The panels will be tied in series so that the overall panel will output 28V and 3.6V, which supplies the ALARM system with 1.8 Watts.

74
The frame of the PV panel will be made out of birch plywood and the dimensions of the frame will be 28.5” wide by 54” long by .5” deep. The PV panel will be split into two sections of 28 PV cells each. ¾ inch rims will be added to the border of each section of the PV cells so that an acrylic cover can be mounted over the cells. The acrylic cover will be mounted with screws around the border of the frame every 5 to 6 inches. Before, the cells mounted into the frame the frame will be painted with four coats of an extra grade semi-gloss white paint of all surfaces to aid the wood against weather. After being painted, the paint will be allowed to dry for 24 hours before the construction of the PV panel continues.
Once the frame has been allowed 24 hours to dry, a layout of where the PV cells should be placed will be sketched onto the painted frame. There will be 7 rows and 4 columns of PV cells in each section of the frame as shown above. There will also be a ½ inch split between each cell with a ¾ inch split between the side cells and the rim of the frame. This space will be left so that bussing wires can be mounted as shown in the gray in the figure above. These buses will aid in connecting one string in series with another string.
Before the strings can be connected into series the cells of each string must be connected in series with each other first. The PV panels already come with the negative front side of the PV panels tabbed. Therefore, only the attachment points on the positive backside of the PV panels need to be soldered with tabbing wire to have every cell contain two positive tabs and two negative tabs. The positive tabs should be soldered in the opposite direction of the negative tabbing wires so that the cells in a string can be connect in series to its neighboring cell by connecting two positive tabs on one cell to two negative tabs its neighboring cell. These positive and negative tabs are represented by the red and black lines in Figure 4.14, respectively.
At the end of each string there will be two unconnected positive tabs and two unconnected negative tabs. Each string will be placed so that the positive tabs that are unconnected on one side will be on the same side as the negative tabs that are unconnected on the adjacent cell. This will be critically in connecting the strings in series with one another and not parallel. Taking this into consideration, once each string has been connected the strings can be glued to the frame using silicone. An even blob of silicone should be applied to each cell in the string; the string should be lined up to the position sketched onto the frames, and then the cells should be gently pressed into place with caution taken not to press too hard and break the fragile cells. Once each string is glued into place the silicone will be allowed to dry for 24 hours before continuing.
Next, bussing wires need to be added to the end of each string as shown in the gray boxes in the figure above. The bussing wires can be connected using caulk. To connect the strings in series the positive tabs of one string will be connected to the same bussing wire of the negative tabs of the adjacent string. These tabs can be conned to the busses by first applying flux to each bus and then soldering
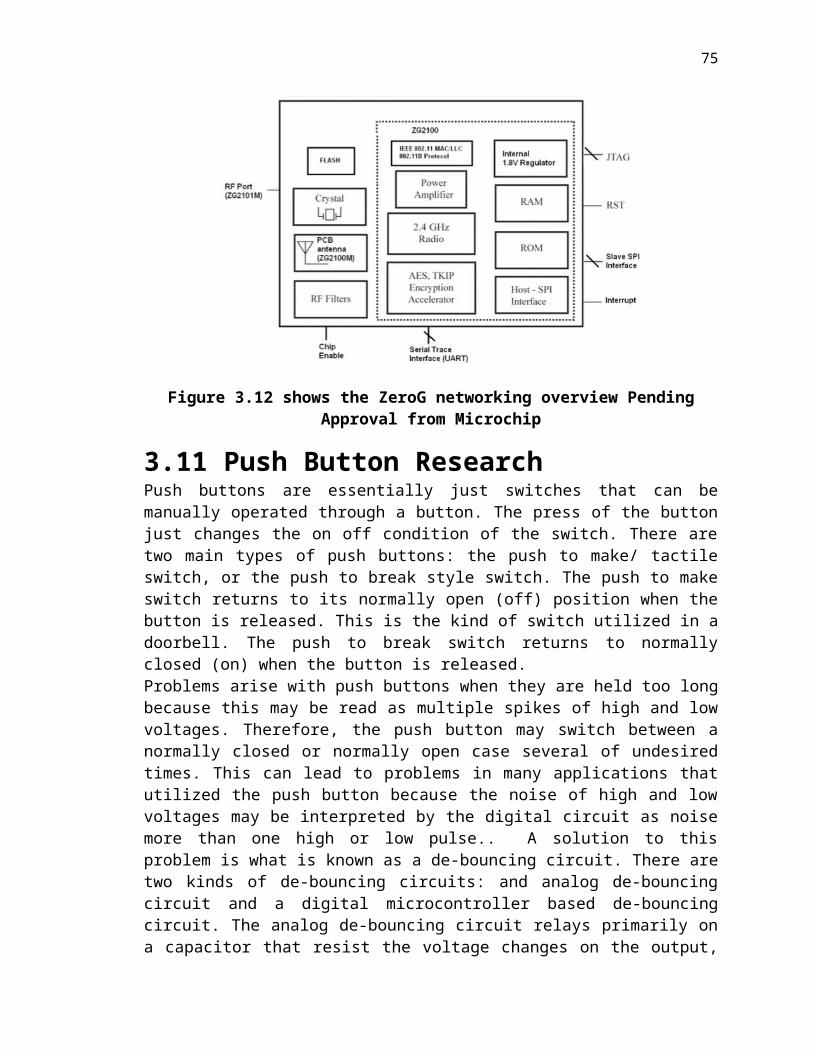
75
the tabs to the bus. The buses will be connected so that both section of the panel have a positive tab unconnected and a negative tab unconnected.
One of the positive tabs of once section will need to be connected to the negative tabs of the other section to connect each section in series with each other. This is shown by the two positive tabs of the lower panel in Figure 4.14 below that are crossing through the divider of the two sections and is connected to a bus on the other side of the panel. The wire used to cross through the frame will be a 12 gauge red wire. The negative unconnected tabs of the other panel are then connected to this same bus.
At this point, there will be two unconnected negative tabs for the lower section and two unconnected positive tabs for the upper panel. These tabs will be connected to separate bussing wire and then 12 gauge wires will connect the bussing wires to the junction box. Inside the junction box is where the load will be connected to these two wires. The two wire leads from the solar panel will be connected to ring terminals. These ring terminals will be connected to a connector that connects the load to PV panel. A 40V,5A Schottky Diode will be placed between positive connections to prevent reverse current from the load from damaging the PV panel. The white band of the diode will point towards the load. The load will consist of the LED driver strings and the AC to DC converter in parallel with one another.
Finally, the junction box will be secured to the back of the frame. Once the PV panel has been tested through the junction box, then the acrylic front can be screwed to the top of the frame. As noted above, the acrylic front will be mounted with screws every 5” to 6” around the rim of the frame. [40]

76
Figure 4.14 shows the PV panel design
4.4.2 AC to DC Power Supply The ALARM system will utilize a 24V 3.75A AC to DC regulated switching power supply for an alternate source of power for the lighting system. This AC to DC power supply will be for a 120VAC wall outlet. This AC to DC power supply will be placed in parallel with the DC power from the solar panels. The solar panels will output 28V peak and therefore will supply the voltage load to the LED drivers for most of the time. However, when the voltage from the PV panels begin to reach a 24V threshold voltage, the AC to DC power supply will begin to switch on and power the LED drivers as the PV panel voltage falls below 24V. This will provide the LED drivers of the ALARM system with an uninterruptable power supply through all conditions of the day. As noted above a 40V, 5A Schottky

77
diode will be placed between the solar panel and AC to DC power supply to keep reverse current from flowing through the PV panels and damaging them.
4.4.3 LED DriversThe ALARM system will utilize two LM3401 LED drivers by National Semiconductor. The driver for the blue string of LEDs will deliver a constant 800mA and the driver for the white string of LEDs will deliver a constant 2.2A. The input voltage to each of the drivers will come from the PV panel or the AC to DC power supply. The minimum input to the LED drivers will be 24V and the maximum input to the LED drivers will be 28V. The output current of the LED driver is adjusted with external current sensing resistors and other components as shown in Figure 4.15 below.
The LM3401 uses a comparator-based voltage mode control to directly control switching. The LED currents are controlled by monitoring peak and valley voltage at the SNS pin. When the SNS voltage falls below the reference voltage the output of an internal comparator goes low, which results in the driver output HG turning on the PFET, Q1. When the PFET is on the LED current ramps up through the PFET and the inductor, L1. As the current increases, the SNS voltage reaches its upper threshold, which forces an internal comparator to go high and turn the PFET off. When the PFET is off the current flows through the catch diode, D1, and the current through the LED and inductor decrease until the SNS voltage falls to its lower threshold. From here the cycle repeats to provide a steady current to the LED.
When the DIM pin is low the HG drive turns off, which makes the PFET turn off. Therefore, this pin will be connected to a PWM signal from the microcontroller that will be used to adjust the duty cycle of each string of LEDs. As noted earlier, there will be two different PWM signals applied to each driver so that each string can be dimmed separately.

78
Figure 4.15 shows the LED Driver design Permission pending from National Semiconductor
The LED current for each string of LEDs is set using a sense resistor R1. This sense resistor can be calculated as follows:
R1= VSNS/ILED
, where VSNS is typically 200mV, ILED for the blue string will be 800mA and ILED for the white string will be 2.2A. Therefore, the ALARM system will need a 250mΩ resistor for the blue string and a 90mΩ resistor for the white string. The resistors must be able to handle the current pass through each of them; therefore, the blue string resistor will need to be rated at ½ a watt and the white string resistor will need to be rated at 3 watts.
The current ILED is just the DC current supplied to each of the strings. However, the AC peak current will be higher than the DC current. This AC peak current, which cannot be higher than the max rating of the LEDs, is the DC current plus the ripple current divided by two. The peak current can be calculated as follows:
ILED_PK= ILED+ ILED_RIP/2
The ripple current directly controlled using the HYS pin of the driver. The hysteresis window must be kept small enough to keep the peak AC current supplied to the LEDs lower than their maximum current rating. The maximum window of the SNS pin can be calculated as follow:
SNSHYS_MAX= (ILED_MAX-ILED) x R1
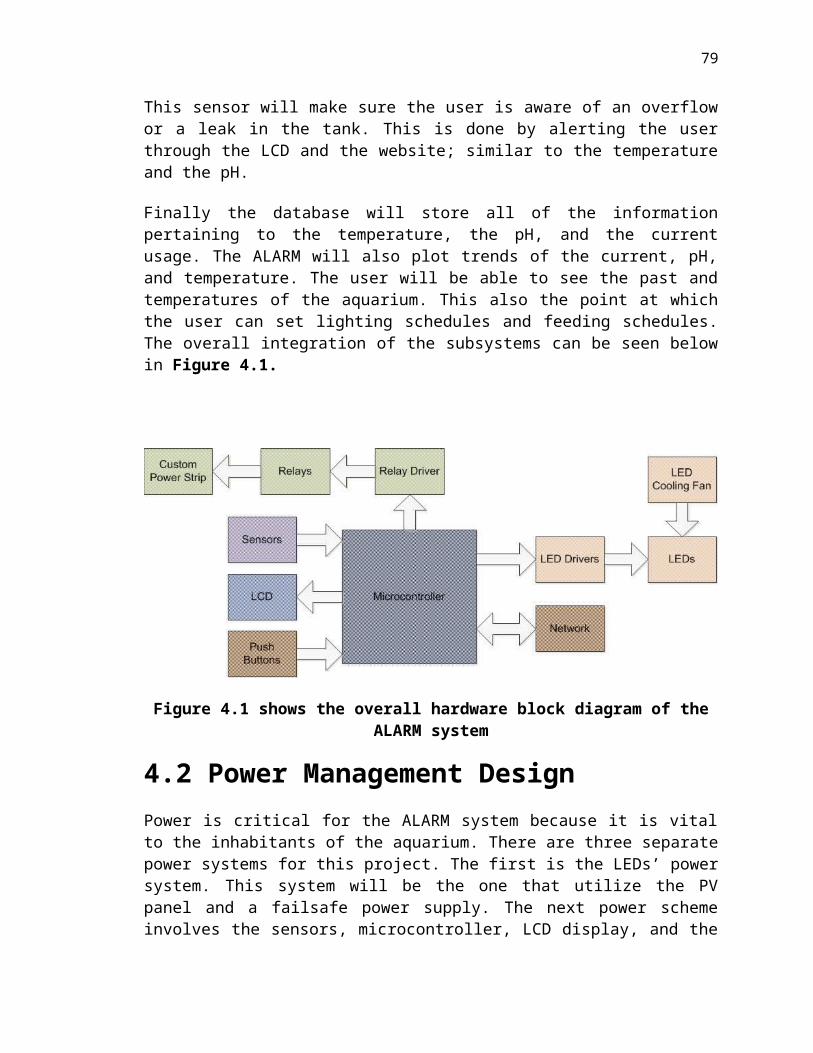
79
, where ILED_MAX is 1A for the blue string and 3A for the blue string. With the max value of SNS known it can be set using a resistor, R2, between the SNS been and ground. The value of R2 can be calculated with the following equation:
R2= (SNSHYS x 5)/ 20uA
, where 20uA is the typically HYS source current.
The switching frequency of the driver will change of the inductance, input voltage, or the LED forward current is changed. The equation of this switching frequency is as follows:
Fsw= D/ ((2 x SNSHYS x L)/ (R1 x (VIN-VANODE) + (2 x delay)
,where D is the duty cycle, defined as (VOUT+VDIODE)/VIN, VANODE is 200mV plus the sum of LED forward voltages, and the delay is the sum of the LM3401 propagation delay and the PFET delay, which is typically 46ns. This equation can be rearranged to calculate a value for the inductor. The inductor must be rated at a current greater than ILED-PEAK.
The P-FET must be rated to handle: a maximum drain to source voltage supplied by the maximum input voltage, 28V; a maximum drain current supplied by ILED_PEAK for each string, 1A (blue) or 3A (white); and a maximum drain to source resistance 350mΩ. From here R3 must be set to keep the current supplied to the LEDs from going over their maximum ratings. This resistance can be calculated as follows:
R3= ( ILIM_PK x RDS) / 4uA
, where ILIM-PK is equal to 1A for the blue string and 3A for the white string.
The capacitor, C1 prevents large current transients at the input and provides an instantaneous current when the P-FET turns on. The capacitor must be rated to handle the maximum input voltage, 28V, and the RMS current. The highest RMS current will occur around %50 percent duty cycle and can be calculated with the following equation:
IRMS= ILED x sprt( (VANODE/Vin)x(1-VANODE/Vin))
As mention above, the catch diode provides the current path to the LED strings when the P-FET is off. Therefore, the diode must be rated higher than the
IDIODE= ILED x (1-D)

80
The diode’s peak reverse voltage must also be rated higher than input voltage [41]. The design summaries for the blue and white string of LEDs are shown in Table 4.3 and Table 4.4 below:
Value Result Comment
Vin 24-28V
Vf 15.6-19.8V
R1 90mΩ 2.2A DC
R2 4.48kΩ17.8mv
hysteresis
L1 10uH >2.47A
fsw 1MHz861.42 kHz
min
ILED_PK 2.47A worst case
ILED_RIP 544.18mA worst case
Q130V,30A,350m
Ω
R3 262.5kΩ2.47 peak
current adjustable
C12.2uF, 50V
ceramic >1.8A rms
D1 40V, 2.2A Shottky
Table 4.3 White String LED Driver Design Parameters

81
Value Result CommentVin 24-28VVf 16.2-21VR1 250mΩ 800mA DCR2 5.25kΩ 21mv hysteresisL1 20uH >918.8mA
fsw 1MHz727.27 kHz
min
ILED_PK 918.8mA worst case
ILED_RIP 237.6mA worst case
Q130V,1A,350m
Ω
R3 87.5KΩ.9188A peak
current adjustable
C12.2uF, 50V
ceramic >.488mA rmsD1 40V,1A Schottky
Table 4.4 Blue String LED Driver Design Parameters
4.4.4 Heat Sink AssemblyThe star shaped PCB that the LEDs are mounted on will be mounted onto the heat sink as shown in the bottom view of Figure 4.16 below. The blue boxes in Figure 4.16 below represent the 6 CREE XP-E Royal Blue LEDs and the white boxes represent the 6 CREE XM-L Cool white LEDs. The black lines represent the fins of the heat sink that will aid in the conduction of heat. Horizontally, the LEDs will be spaced 3 inches apart from one another with 1.5 inches separating the border LEDs from the edge of the heat sink. Vertically, the LEDs will be spaced 3 inches apart from one another with 1 inch separating the border LEDs from the edge of the heat sink. The star chips will be mounted to the heat sink with Artic Silver Thermal Adhesive. Care will be taken to make sure the star chips are mounted perfectly flat onto the heat sink. The thermal paste added between the heat sink and star chip to make sure the surface is perfectly flat. 80 degree LEDLink XP-E optical lenses will be placed over each one of the LEDs. These optical lenses will focus the lumens of the LEDs, increasing the PUR.
On the top of the heat sink a NZXT 200mm cooling fan will be mounted onto the heat sink, making sure the fan is blowing air into the heat sink and not out of the heat sink as shown in the top view of Figure 4.16 below. The fan requires 12V at .7A and will be powered by the microcontroller’s 12V rail. This air will be needed to aid in the conduction process of the heat sink. The fan will be running

82
at different speeds depending on the temperature of the heat sink. The temperature of the heat sink will be monitored by a Maxim high-precision 1-wire digital thermometer represented as the black box of the top and bottom view. This thermometer is digital and outputs degrees in .5 degree Celsius intervals. This thermometer requires 5V at 1.2mA and will be powered through the microcontroller’s 5V rail. From this temperature, the microcontroller will create a PWM signal to control the fan. If the heat sink is below 50 degrees Fahrenheit, the fan will not be on. If the heat sink is between 50 degrees Fahrenheit and 70 degrees Fahrenheit, then the fan will run at 50 percent of its maximum speed. If the heat sink is between 70 degrees Fahrenheit and 90 degrees Fahrenheit, then the fan will run at 75 percent of its maximum speed. Finally, if the heat sink is greater than 90 degrees Fahrenheit, then the fan will run at its maximum speed.
4.4.5 Lighting System SummaryA detailed block diagram of the lighting system is shown below in Figure 4.17. The microcontroller will only need to read one variable from the lighting system and provide three PWM signals to the lightin system. PWM signal 1 and PWM signal 2 will be the two PWM signals generated by the microcontroller for the blue and white strings of LEDs, repectively. These signals will be controlled by input from the user from the online database or from the push button, which will be sent to the microcontroller. PWM signal 1 will be sent to the LED driver of the blue string and PWM signal 2 will be sent to the LED driver of the white string. PWM signal 3 will be the PWM signal generated by the microcontroller for the cooling fan. This signal will be controlled by the temperature of the heat sink, which will be polled by the temperature sensor. The temperature from the temperature sensor will be sent to the microcontroller and PWM signal 3 will be generated according the the range of the temperature as mentioned earlier. PWM signal 3 will be sent to the PWM input of the cooling fan.
The PWM signals just control the duty cycle of the LED strings and cooling fan, but does not provide any power. The power for the LED strings will either come from the PV panel or the AC to DC power supply. As shown below in Figure 4.17, the PV panel and AC to DC power supply will be connected in parallel to one another inside of the junction box. The PV panel will output 28V at 3A and the AC to DC power supplywill output 24V at 3A. When the voltage from the PV panel is above 24V the PV panel will supply the power to the LED strings. From the junction box, the two LED strings will be connected in parallel with the power sources. When the voltage from the PV panel falls below 24V the AC to DC power supplywill supply the power to the LED strings.
The power will be supplied to the LED drivers of each string and the LED drivers will produce a constant 2.2A and 800mA. The two strings of LEDs will be connected in parallel with the power sources; therefore, the minimum voltage needed for the strings will be the maximum forward voltage of the LEDs. The maximum forward voltage of the blue string of LEDs is 21V and the minimum

83
forward voltage is 16.2V. The maximum forward voltage of the white string of LEDs is 19.8V and the minimum forward voltage is 15.6V. Therefore, the minum power supply must be 19.8V. This is why the ALARM systemutilizes a 24V AC to DC power supply for backup. Both power sources are rated at 3A because the blue string of LEDs require 800mA and the white string of LEDs require 2.2A. Since they are in parallel with the power sources, the power sources must output 2.2A + 800mA= 3A.
Figure 4.17 shows the detailed LED lighting system block diagram
4.5 Display DesignThe LCD display that is to be used for the ALARM is the HD44780. One reason for choosing this display is that is common. It is available to buy from many vendors and it is readily available. Another reason is that is flexible with many microcontrollers. This should eliminate some of the potential troubleshooting. This display also fits in with specifications of running on 5V or less as well as a 2.5mA supply current.
For the ALARM system’s display feature it is more advantageous to utilize a 4 by 20-character LCD display. This will allow all of the critical information to be displayed at one time. These configurations will also all an auxiliary line to be displayed. This auxiliary line will be something to the effect of an alert. Its purpose is to tell the user something critical is wrong. The user then can check the server to find out what the critical error is. Another advantage with this configuration is that the display can be set up using only 4 data lines. Since the information that is being displayed should be fairly constant the microcontroller will not have to use as much processing power.

84
There are 4 lines on this display with 20 characters on each line. Figure 4.18 shows a sample of the display output. Each line has 20 characters. For example, the line that starts with “TEMP” from the “T” to the second X” in the pH slot is considered 20 characters. The first will be dedicated to the date and time. The second line will be dedicated to the temperature and the pH balance. The third will display the status of the feed mode. Either “on” or “off” will be highlighted. The fourth line will be the alert line, which will either flash or scroll when there is an alert.
Figure 4.18 shows the template of the ALARMs information to be displayed.
4.6 Sensor DesignIn the design of the ALARM there will be 4 different sensors: temperature, current, a pH, and a water leak detector. The temperature sensors will actively control the function of the ALARM, for example, turning on the aquarium’s heater when the temperature drops below a certain threshold, whereas the rest will be passive and informational sensors. They will alert the user of the current situation of the tank
4.6.1 Temperature SensorThe Aquarium Lighting and Resource Monitor will use two different types of temperature sensors, one to measure the temperature of the heat sink and the other to measure the temperature of the water. The temperature sensor that will monitor the heat sink is the DS18S20 from Maxim Integrated Products. For the aquarium the temperature sensor is a generic water proof temperature sensor that takes 5V at 1.5mA. All of the temperature sensors will read the temperature
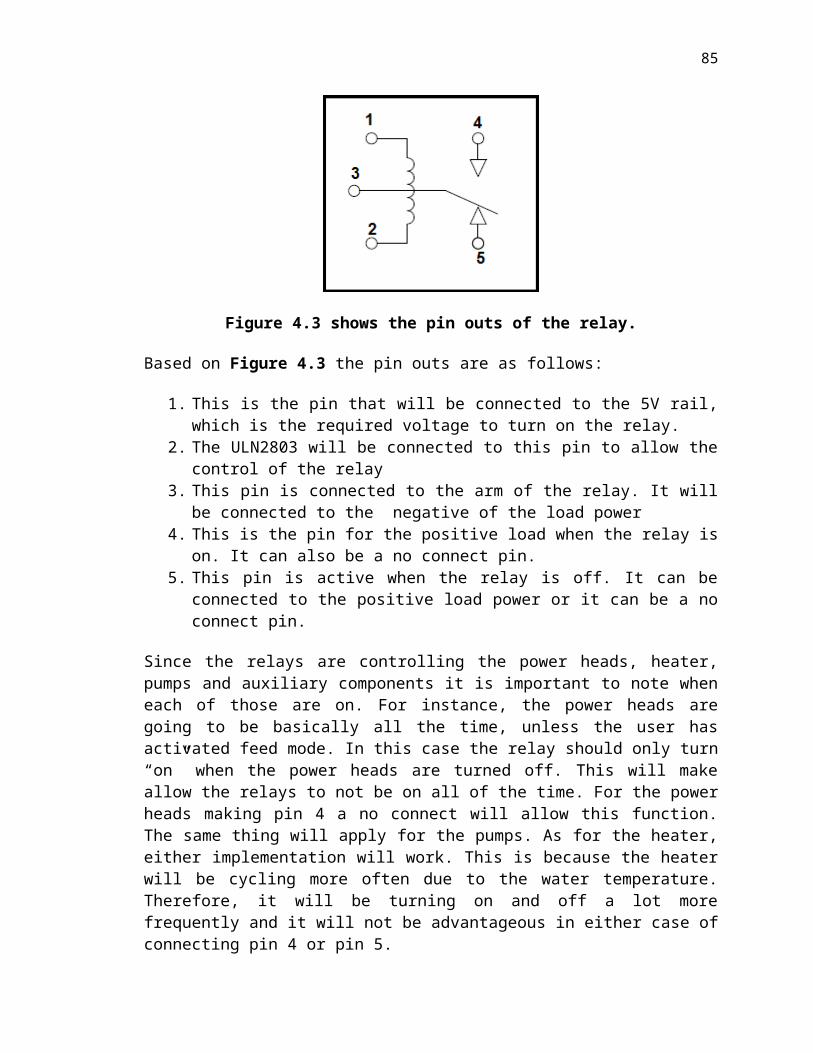
85
once every 5 minutes. The temperature of the water will be based off of a median of the three sensors. This average is the temperature that will be displayed on the LCD display at all times. When the temperature of the water drops below the desired temperature specified by the user, the heater will turn on so the water can change back to the desired temperature range. If the temperature read is below the desired temperature range in consecutive readings the aquarium owner will be alerted so they can manually check the aquarium to see if anything is wrong.
The ALARM system will use three temperature sensors placed in the water to measure different areas in the aquarium. Each sensor will take a reading at the same time. The temperature used as the official reading will be the median of the three. Having three temperature sensors allows the user to know if one of the sensors stops working correctly. This will be determined by reading all three temperatures and if one reading is significantly different than the other two, the owner will be notified to check the operation of the sensor via email from the website. The website will show the three different temperatures. This will allow the user to pinpoint the bad sensor.
The heat sink temperature sensor will be in contact with the heat sink at all times. This sensor will read whether the led lighting system is getting too hot. This is heat can affect the temperature of the aquarium as well as the efficiency of the LED itself. If the temperature measured on the heat sink is higher than the set threshold a fan will turn on to cool the LEDs. This will prevent the LEDs from getting too hot. When LED’s become too hot they do not operate at optimal efficiency and as a whole shortens their overall lifetime.
4.6.2 pH SensorThe pH probe that will be used the CD-401159. It will be set in the water to measure pH balances once a minute. The pH probe will be connected to the microcontroller by using a pH probe adapter. The reason for this configuration is because the probe uses a BNC connector. This connector only has 2 wires. The adapter will in effect create a third pin. The pH adaptor that will be use is the Phidgets 1130 – pH/ORP Adapter. This adapter has three pins used to connect to the microcontroller; one for the power supply, one for the ground, and one for the analog input. Since the adapter transmits an analog signal, it will need to be plugged into an analog to digital converter input on the microcontroller.
To measure pH using the Phidges 1130 adapter, the DIP switch on the board must be switched to pH. The pH will be measured by the probe and the sensor value will be transmitted through the adapter into the microcontroller. The equation below incorporates temperature to add accuracy in the pH measurement. This is another reason the pH probe adapter is needed. It will assist converting the value into a readable pH value.[25]

86
ph=7−2.5−SensorValue
2000.257179+0.000941468∗Temperature
4.6.3 Leak Detection SensorThe leak detection sensor will be custom constructed by the group project members. The sensor will consist of two wires, one coming from an output pin of the microcontroller and one that returns to an input of the microcontroller. These two wires will be used to detect a leak in the aquarium by being placed on the ground beneath the aquarium. If water is running to the ground and touches both wires, the water will connect the two wires which will transmit a 1 to the input of the microcontroller. In the microcontroller there will be an interrupt method for the leak detector. The instant a 1 is sent from the leak detector, the microcontroller will notify the owner of the aquarium with an email and a message on the LCD display. The wires will be 0.5 cm apart so that even the smallest amount of water will set off the interrupt. This way the owner will be able to react to the leak as quickly as possible.
4.6.4 Current SensorThe Aquarium Lighting and Resource Monitor current sensors will take a measurement every 5 minutes. These measurements will be recorded onto the microcontroller, which will then send the data to the MySQL database for logging. The Honeywell CSLA2CD Hall Effect current sensor is the best current sensor for this application. This sensor uses a magnetic flux to read the current flowing through the wire. The sensors will be placed on the printed circuit board inside the power strip. The wires that are supplying current from the relays to the outlets will be run in the hole of the Hall Effect sensor. The current being supplied to the sensor will have to be a maximum of 20mA. The supply voltage will need to be in the range of 5.4Vdc to 13.2 Vdc. The current being measured will be up to 20A. Each current sensor will run a data bus back to the microcontroller to transmit the current in a voltage that represents the current. [27]
The voltage sent from the current sensor replicates the current. To find the actual measured current you must use the equation below. [42] This equation will have to be written as a function into the microcontroller. The current will be used to find the amount of power consumed by the whole ALARM system.
Measured Current = (Vsensor - 4.0) / 0.033

87
The current will be logged into the database. Then, a graph will show the trend of the current consumption. This will enable the user to see if a particular part of the aquarium is consuming more current than normal. The user can then inspect the specific part in question. For example, the pumps have been draining more current due to a clog.
4.7 Website and Database DesignThe website will be able to control the components of the LED lighting system of the ALARM system, by telling the microcontroller how to control the pulse width modulation signal sent to the LED drivers. There will be two sliders on the lighting control page that will allow the user to slide the setting of the LED intensity from 0 to 100%. This percentage will be multiplied by 256 to give the correct PWM signal to the LED drivers.
The website will be built as a PHP website. In conjunction to using PHP we will use a MySQL server as our database for the website. This will allow the user to track past data of their aquarium. The website diagram is shown in Figure 4.19.
Figure 4.19 shows the overall diagram of the website
The website will have a home page that shows all of the current data for the aquarium. The home page will be organized similar to Figure 4.20. This data includes the temperature, pH, lighting system setting, feed mode status, next scheduled feed time and clean time. From the home page the user will be able to navigate to other pages in the website. One page will be for the data history, which will provide graphs of past measurements. There will be a section for temperature history, pH history, and power usage history. For each type of data the website will have a graph to represent the history of data logged. The PHP will get the data from the MySQL database. The database will receive data from the microcontroller every ten minutes.

88
Figure 4.20 shows the home page of the Web Interface
Another page of the website will be for the Aquarium Settings. Figure 4.21 is a design similar to what the ALARM system will have for the owner to input settings for the aquarium. On this page, the user will be able to set the desired the light settings. The feed mode will turn off the aquarium’s pumps for a certain amount of time so that the owner may feed the organisms living in the aquarium without having the food moved around by the pumps. Activating the feed mode will also indicate that the aquarium has been in feed mode that day on the home page. This will avoid over feeding of the aquarium which is healthier for the organisms inside. The cleaning mode will turn off all parts of the system so that the owner may clean the tank as regular maintenance requires. Once clean mode is activated the “Next Cleaning Scheduled” on the home page will change to the date 14 days after the current day. This will allow the owner to keep up with cleaning maintenance for the aquarium. The lighting system settings will include a number of different modes. The user may set the lights to manual mode which will have a slider bar and the user will be able to set the brightness of the lights by a percentage of pulse width modulation used. This will allow the user to dim, turn on or off the lights manually. There will be preset modes available for natural sunlight settings. The ALARM system will allow the user to create custom lighting schedules through the website. The custom schedule will be customizable by the hour. Therefore, the user will be able to manipulate the intensity of the white and blue LEDs strings for each hour of the day. This custom schedule will then be saved and implemented when the LED lighting system of the ALARM system is in the fifth push button condition.
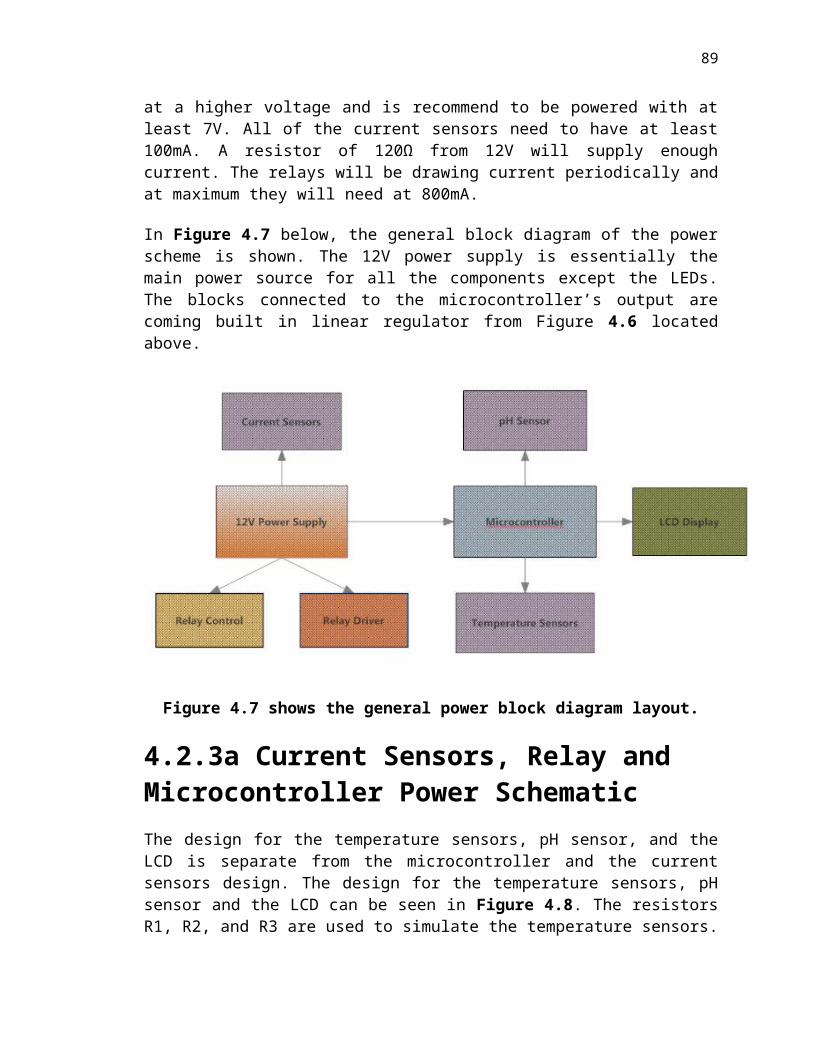
89
Figure 4.21 shows the aquarium settings page
The PHP code will use a number of methods to operate with the microcontroller correctly. The website will need to communicate with the microcontroller to save the settings to the microcontroller as well as receive data collected by the microcontroller Some methods to be written for the website are written in detail below. These methods will allow the website to communicate with the microcontroller.
submitSettings()
Once the owner of the aquarium clicks the submit button on the settings page of the website, the website will send the structure of settings to the microcontroller.

90
These settings will be saved on the microcontroller until the owner submits the settings again.
getData()
This method will be activated when the user is on the Data History page of the website. On the Data History page it prompts the user for two dates to specify the range of data the user wishes to observe. Once the dates are entered the page will show three graphs. Each graph will represent a piece of data. To find the data the website will need to communicate with the MySQL database. This database will hold all data acquired, by the microcontroller, over the last twelve months.
getCurrentTemp() & getCurrentPh()
This method will be used whenever the owner opens the home page of the website. The getCurrentTemp or getCurrentPh methods will get this data by using the MySQL database. The most recent structure on the database will return the most recent temperature and pH measurement.
getCurrentMode()
The current mode will be displayed on the home page of the website. Whenever someone visits the website, this method will be run. The current mode will be saved in the settings which are set on the Aquarium Settings page. Each mode will be different as to how the microcontroller acts on the system.
The website will have to use interrupts in order to alert the owner when there is a problem or if a timer is up. If the leak detection, temperature, pH, or current measurements are abnormal, then the microcontroller will send an interrupt to the website which will then send an automatic email to the owner.
4.8 Networking DesignNetworking for the ALARM system is vital to the success of the project. All of the settings and nearly all of the interfacing will be done over the network. There are two different components for the networking subsystem on this project, they are the hardware support for the Arduino and the software support for the connections to the web server.
4.8.1 Hardware DesignThe Networking will be realized by using an Arduino Ethernet Shield. A shield is an external component that connects to the Arduino PCB via grouping of pins, they work with nearly all the different models of the Arduino, including the Arduino Mega 2560. The connection to the Arduino to the Shield is via the ICSP

91
pins rather than using the valuable exterior pins. The figure below shows the physical appearance of the Ethernet Shield.
The schematic of the networking module is below in Figure 4.23. There are only two pins that are used for communication to the Arduino itself and they are the Tx and Rx pins. The analog inputs are coming from the RJ45 ethernet jack with the magnetic transformer built in already. The PWN pinouts are going to the 4 status LEDs that are on the surface of the shield.
Figure 4.23 shows the networking interface permission pending
4.8.2 Software The Arduino Ethernet Shield comes with a great deal of built in software libraries that make it ideal for server client programming. The ethernet shield uses a Wiznet 5100 networking chip and the Arduino software handles the TCP/IP stack. The following code snippet shows how to create a minimal server using the Arduino ethernet library.
#include <Ethernet.h>
// the media access control (ethernet hardware) address for the shield:byte mac[] = 0xDE, 0xAD, 0xBE, 0xEF, 0xFE, 0xED ;

92
//the IP address for the shield:byte ip[] = 10, 0, 0, 177 ;
void setup() Ethernet.begin(mac, ip);
(Reprinted through LGPL license via Arduino)
Networking Based InterruptsThere will also be other updates that come from the website that need to adjust global settings in the Arduino. After the settings are updated it will need to start the loop again or refresh the lighting method. Figure 4.24 below shows an overview of the web based interrupts that will need to be included in the code. A difference between these interrupts and the previous interrupts is that they will be coming from the Internet rather than a physical interface such as a button on the front control panel. Web based interrupts are not supported by the Ethernet Library so they will have to be written manually and tested thoroughly.
Figure 4.24 shows a block diagram of the interrupts
4.9 Push Button DesignThe ALARM system will utilize a push to make switch for both the feed mode push button and the lighting system push button. Both push buttons will cause the microcontroller to sense a voltage at two different pins when pressed. This

93
sense of voltage will cause the microcontroller to respond in a desired manner. When the push button is pressed the presence of a voltage across an assigned pin will be picked up by the microcontroller. The microcontroller will then turn of the pumps and power heads for 5 minutes then turn them back on through the relays.
When the push button is pressed the presence of a voltage across an assigned pin will be picked up by the microcontroller. The microcontroller will then set the LEDs to the current state of the built in state machine. The state machine will start with the lights at condition 1 on the first push button press. If the push button is pressed again, then the lighting condition will change from 1 to 2. If the push button is pressed again, then the lighting condition will change from 2 to 3. If the push button is pressed again, then the lighting condition will change from 3 to 4. If the push button is pressed again, then the lighting condition will change from 4 to 5. Finally, if the push button is pressed again, then the lighting condition will change from 5 back to 1 and the cycle will be repeated for each push button press. In addition, for both push buttons a pull down resistor will be needed between the sensing pin and ground. These two resistors will be used to protect the internal circuitry of the microcontroller from excess current. A de-bouncing circuit will be needed so that a single push button press will not be read as multiple presses. Multiple presses will cause certain condition states to be skipped, which is an undesired behavior. Arduino has a de-bouncing library therefore the ALARM system will utilize a digital microcontroller based de-bouncing circuit.

94
Chapter 5 Prototype Construction Plan
5.1 Build and Implementation StrategyThe ALARM will be constructed in different stages. Once all of the parts are acquired construction will begin. The first part to be constructed will be the PV panel. The group has decided to build their own PV panel to save on costs and achieve a supply voltage that is not normal for PV panels on the market.
The next stage will be building the power strip for the ALARM system The power strip will consist of the printed circuit board, all of the relays, all the current sensors, and all of the outlets that supply power to the ALARM system This will be housed in a junction box with the circuit board on the inside. There will be 6 outlets on the outside of the box. On the circuit board will be the relays to each outlet on the outside of the box. The wire from each relay will run through a current sensor and run to each outlet in the junction box. The circuit board will have a voltage bus as well as a ground bus for each relay to receive power. The printed circuit board will be constructed and soldiered in the UCF Senior Design lab.
The microcontroller will have all of the sensors connected as specified in the microcontroller design. The Ethernet shield will need to be mounted onto the microcontroller. The microcontroller will be housed in an acrylic box. The LCD display will be mounted so that the display is clear from the outside of the box. There will have to be a hole in the box for wires from the sensors and power to run through in order to be connected to the microcontroller. There will be a circuit board in the box. On this circuit board there will be pull up resistors in which the power will be run through. This will allow the correct current to be applied to the microcontroller. These resistors will begin each power supply bus. There will be a ground bus as well for the components to be grounded. On this circuit board will also be the pH adapter to convert the cable from the BNC probe to a digital signal that the microcontroller is able to read. The circuit board will be soldiered in the UCF Senior Design lab.
The lighting system will be built with 12 LED’s in a pattern as shown in Figure 4.16. On the heat sink, a fan will be mounted to cool the LED’S whenever the temperature sensed on the heat sink is greater than a certain level. The temperature sensor will be mounted onto the heat sink to check the temperature of the heat given off by the LEDs every 10 minutes. The lighting system will be mounted in a wooden box and hung from the ceiling over the aquarium. The housing will have holes for the lights as well as holes in the back for the power wires to run through.

95
5.2 Coding PlanIn this project there are two separate programming challenges. The first is the microcontroller embedded code, which will gather information from sensors and save this information. The second is the website and relational database which will use the saved data in the first part for analysis and sharing. The website will also be the main interface to the ALARM system. The first part of the programming will be done in the Android IDE using the Arduino language, which will utilize the AVR-C compiler to create the Sketch files that will be uploaded to the Arduino device. The website will be written in HTML and PHP but will also run CGI scripts for various other functions that need to be implemented. The code will be developed as a group therefore a software revision system will be needed to keep track of current stages of development. The group has elected to use the Subversion SVN revision control software to handle this problem.
Microcontroller Development
The Arduino IDE is a Java based multi-platform IDE with native programming support for official Arduino devices. The code that is developed in the Arduino IDE is similar to C, but does not have the exact same semantics. The code is compiled using AVR-libc and is turned into a Sketch file, which is the format that the Arduino reads. The device programming is done through a serial connection from the computer directly to the Arduino device. No other hardware is needed, just the serial connection and the android device. When the Sketches are being uploaded to the board, the user can view the progress and make the programming was completed properly though the IDE serial console. The size of the completed sketch is listed after it is compiled so you can verify that it will fit on the device you are programming. Below in in Figure 5.1 is a screenshot of the Arduino IDE and a compiled example code.

96
Figure 5.1 shows the Arduino IDE Interface Copyright Arduino – permission pending
The programing for the microcontroller can be broken down into smaller modules and functions. Because the sensors and relay circuit board will have a lead time, the code for those sections does written with the highest priority. Therefore the interface between the web-server and the microcontroller should be completed first. This interface will allow the microcontroller to send and receive information from the web server. Once the interface is completed the methods involving the sensors and relays can be written. They can be written without having access to the physical devices because of the hardware specifications for each sensor will provide the calculations needed to produce the correctly formatted output. The relay methods can be written at any time because they are very simple; they operate in the same way as a LED, which is one of simplest coding examples for the Arduino.
Web Server Software
The microcontroller software design begins with the website/microcontroller interface therefore this should be the first priority for the website software implementation. The database needs to be constructed directly after this because the rest of the website components rely on that information to display their interpretations and extrapolations of that data. After the database is created and the interface between the server and microcontroller is created a PHP script will be written to save the data to a MySQL server. After this is completed there

97
will be a skeleton web server that gets and saves sensor information from the ALARM system. Now this information is just in a database and is still inaccessible to the user, therefore a page needs to be created that can display the information in the database. This page will use another PHP script to set boundaries for an SQL query and then use JCharts to create a certain type of chart or graph of the results. After this is completed, a graphical interface then needs to be created to control all of the settings on the ALARM system. Messages must be passed from the web-server to the microcontroller to adjust the global variables controlling the various relays and PWN outputs. Finally, an entrance and security page will be added. Up until now the web-server was open to anyone, and settings could be changed to dangerous levels, and this needs to be fixed. A basic security page will ask for a user name and password to access the control page. If this is not a valid user then, they will not be able to edit any of the settings, or look at any of the charts. Almost all of the software for the website can be developed and tested without a need for the ALARM hardware to be completed.
Software Development
The software development cycle that the group will use to program both of these subsystems is the Waterfall Mode, shown below in Figure 5.2. The group chose to use this model because there is a set of requirements and specifications that are listed. These requirements and specifications should not change a great deal from the start to the finish of the design process. The waterfall model follows a single path which is as follows. The diagram below in Figure 5.2 shows these six stages in time.
1. Requirements specification2. Software design 3. Implementation4. Testing5. Deployment6. Maintenance

98
Figure 5.2 Shows the Waterfall Model
The Waterfall model is slightly restrictive because any changes in the design will cause a functional restart in the rest of the phases. Since the group already knows the requirements and specification should not change, this model is the most straight-forward to implement. Since this is only a prototype there will not necessarily be a need for the Deployment and Maintenance stage, but they still need to be considered. This means that only the Implementation and Testing phases are still needed as the Requirement and Design phase is complete. The Maintenance phase is needed for bug-fixing and implementing extra features, hopefully most, if not all, of the bugs are caught in the testing stage rather than being found after deployment. Having a proper design is crucial before the implementation phase, because a bad design can force an entire project to be rewritten. Testing will still need to be done for individual portions of the project code before the Testing phase because this phase is intended to test the overall system working together. Even though all of the modules may work individually conditions can arise that will cause problems when they are put together.
Revision History
Revision control and source versioning is a vital tool when working with multiple programmers on the same project. In the ALARM system development phase there will be many iterations of code, these come from completed modules and bug fixes from previous iteration. These iterations can each be called a different

99
version. When you have many different versions it calls for a way to keep track of all changes, their authors, and any comments they had about the revision. The way to do all of these things is using a revision history program called Subversion. The program Subversion will keep all of the code in a central repository and keep track of each change in a given version. It will also allow different versions to be merged together into a single new version. This is very helpful when you have more than one person working on different parts of the project. It will automate the collaboration process and make sure there are not two different versions of the same module in a document. Subversion will keep the most updated version of the code so programmers will stay up to date on the bug fixes work that needs to be completed.
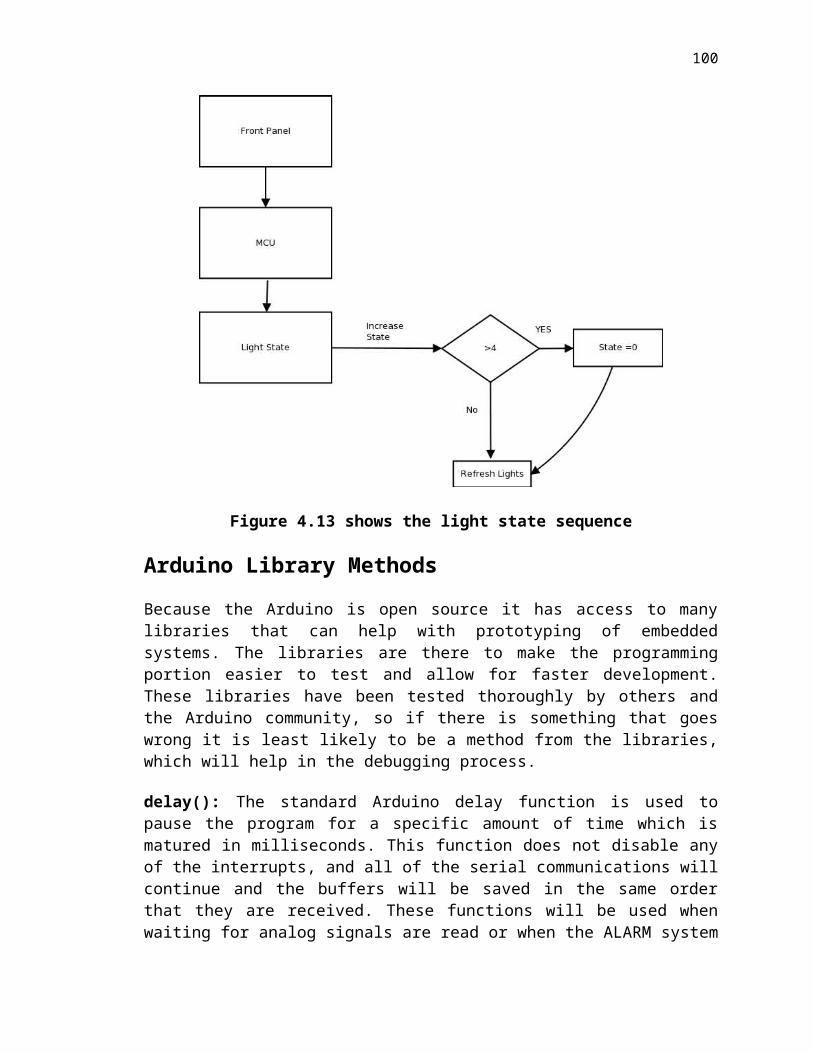
100
Chapter 6 Prototype Test Plan
6.1 Testing EnvironmentThe final prototype of the ALARM system will be tested inside of the HEC building at the UCF main campus. In order to properly simulate the normal operating conditions of the ALARM system, some conditions need to be met. Firstly, there needs to be access for a wire to reach a solar panel that is stationed outside in the sun. Secondly there needs to be access to a computer with an internet connection to show the web interface and allow for the changing of settings and updating of information. The room also needs to have an extra Ethernet jack for the ALARM system so that it may connect to the internet to upload information to the web server and receive new instructions.
There also are some operating levels that need to be retained. Temperature: The water temperature being measured needs to be
between 60 and 90 degrees Fahrenheit. This is the standard temperature window for various types of aquariums that would use the ALARM system.
pH: The pH levels of the water are between 6 and 9. This is standard window of pH for an aquarium, and the pH sensor was designed for these levels. While it may not hurt the sensor much lower or much higher levels may not be accurate. Therefore a bucket of 7.0 pH freshwater and a bucket of 8.4 pH saltwater should be used to test the pH portion of the ALARM system.
Power Level Testing: The current draw from a single plug should be no more than 5 amps which is what the relays are designed for. More current could damage them or provide inaccurate numbers. A KillAWatt power testing device should be used to verify the elements that are being measured.
6.2 Hardware Test Plan6.2.1 Lighting SystemBuilding Stage
The PV panel will be the main source of power for the LED lighting system, so it will be built and tested first. First, each individual PV cell will be tested under different sunlight conditions for voltage and current. The desired voltage and current of each cell needs to be over .5V and 3A for most periods of time. The only time the cells should output less than this is in brownout conditions where there is in climate weather or no sun out at night time. Once these 56 cells have

101
passed this test then, each string of the PV panel will be built one at a time. When one string has been completely connected the entire string will be tested under different sunlight conditions for voltage and current. The desired voltage and current of each string of 7 PV cells needs to be over 3.5V and 3A for most periods of time. The only time the strings should output less than this is in brownout conditions where there is in climate weather or no sun out at night time.
Once all of the strings have been tested then 4 strings will be connected in series with each other to construct one half of the PV panel. Then, the entire half of the PV panel will be tested under different sunlight conditions for voltage and current. The desired voltage and current of each half of 28 PV cells needs to be over 14V and 3A for most periods of time. The only time each half of the PV panel should output less than this is in brownout conditions where there is in climate weather or no sun out at night time. Finally, the other half of the PV panel will be tested the same way and the two halves will be connected in series with one another to complete the entire PV panel. The complete PV panel will then be tested under different sunlight conditions for voltage and current. The desired voltage and current of the complete PV panel of 56 PV cells needs to be over 28V and 3A for most periods of time. The only time the PV panel should output less than this is in brownout conditions where there is in climate weather or no sun out at night time.
After the PV panel has been completely tested, the AC to DC power supply will be connected in parallel with the PV panel through the junction box with a Schottky diode connected in between them. From here the voltage and current across these two voltage sources will be measured during different lighting conditions. The desired output voltage and current should be 28V and 3A during sunny conditions. During brownout conditions the power should come from the AC to DC power supply so the output voltage and current should be 24V and 3A. The output voltage and current should never fall below 24V and 3A. This is the minimum voltage and current needed to properly operate the LED drivers.
Once the voltage and current of the AC to DC power supply are tested and supply a minimum voltage and current of 24V and 3A then the blue and white LED strings will be tested. The two strings will be connected in parallel with the PV panel and AC to DC power supply on a breadboard. The PWM signals applied to the two LED drivers will be created with an oscilloscope. As the duty cycle is changed on the oscilloscope the brightness of each string of LEDs should change too. This change in duty cycle needs to be tested in all conditions; making sure that during brownout conditions the LED drivers are still properly supplying the right amount of current to each string of LEDs. Along with the dimming of the LEDs being tested, the dimming of the cooling fan can also be tested at this point. A PWM signal can be applied from an oscilloscope to vary the duty cycle and check to see if the fan slows or speeds up accordingly.

102
Finished Prototype
Once the ALARM system has been completely assembled the light system needs to be checked for different user inputs. The first input that needs to be checked is the functionality of the push button. The five conditions of the push button as stated below need to be tested:
1. First condition: white and blue LEDs at full intensity2. Second condition white and blue LEDs completely off 3. Third condition: white lights at half of their maximum intensity and the blue
lights at half of their maximum intensity4. Fourth condition: white lights off and the blue lights at half of their
maximum intensity5. Fifth condition: LEDs set at the custom lighting schedule provided by the
user through the database
The lighting conditions provided through the push button should be strictly followed by the LEDs. If the LEDs follow the different lighting conditions, then the push button of the ALARM system is working correctly.
The second input condition that needs to be checked is the custom lighting schedule provided by the user through the website. This will be accomplished by having the lighting system set in the fifth condition and providing different lighting schedules through the website. The lighting schedules provided through the website should be strictly followed by the LEDs. If the LEDs follow the different lighting schedules, then the ALARM lighting system is working correctly.
6.2.2 Relay SystemThe first part of the testing the relays is testing to make sure each sure each relay works properly. The can be tested by giving the control of the relays to 12V and a minimum of 71.4mA. This will turn the relay on. On the load pins there will be a sample circuit, such as an LED in series with a battery. Once the control is turned on, the LED will turn on. This process will be repeated 5 times to test all of the relays. Once the LED circuit is working properly then the relays can be tested on the more appropriate load that relay will be used for, such as a pump. The same sample control will be used. The pump, or similar component, will be plugged into a modified outlet that is in the custom power strip. Then, once the control is turned on the component will turn on.
The next step is to test the relays in conjunction with the UL2803. This can be done by setting up one relay up to the ULN2803. The negative of the control on the relay, pin 3 in Figure 4.3, will be connected to the output pin 18 of the ULN2803. The input pin 1 of the ULN2803 will be connected to 5V power supply at around 1.85mA. The positive pin of the relay, pin 1 in Figure 4.3, will be

103
connected to a 12V power supply. Also, pin 10 of the ULN2803 will be connected to the same 12V power supply. The load side will of the relay will first be tested with one of the possible components in the custom power strip. Once the 5V power supply is turned on, then the load will be active. After one relay is working properly with the ULN2803, then all five relays will be added to the test circuit.
After all five of the relays are working together with the ULN2803, then the relay system can be connected to the microcontroller. The input pins 1-5 on the ULN2803 will be connected to I/O pins on the microcontroller. Then the controller can be programmed to turn on each individual relay, then all of them at once. Also, the feed mode button can test the relays. When the button is pressed then the relays will turn “off”.
6.2.3 DisplayThe test procedure for the LCD is going to first test to see if it is performing as the data sheet implies. For instance, the RAM address corresponding to the first character in the first row is 80 in the display. Then a sample character will be sent from the microcontroller and written to address 80. This can be done to all of the line character and line spaces at one time and can be retested with a different character. This will make sure each character cell is working properly.
Then, the display will be set up according to the design. At this point LCD can be tested for real time updating as it should. Therefore, the microcontroller will send a test signal that will change with time to see if the LCD will respond in a timely manner. Then, concluding a successful test, one of the temperature sensors can be attached to the microcontroller. The sensor can then be heated up or cooled down in a rapid manner. The display should be corresponding to the change in the temperature.
After the previous tests are successful, then the pH sensor can be attached in similar manner to the temperature sensors. A large fluctuation in a short amount of time, such as a few minutes, is not common in the pH balance. Therefore this particular sensor will not have to change rapidly. So, if the LCD is simply responding to appropriate pH balance will demonstrate the display is working accordingly. Such appropriate pH balances would be an acidic balance of lemon juice at 2.4 or a base of soap at 10-12. If the LCD responds accordingly to the correct pH then the next part can be tested.
Once the temperature and the pH balance are displayed correctly and accurately, then the alert line can be tested. The alert line will flash if there is a high temperature, pH, or one of the components in the custom power supply is using too much power. The alert line can be tested by first setting the microcontroller to run a sample program in which it will set the alert line at a certain point. If the LCD responds by the flashing the alert line then it will be

104
working correctly. Then, the alert system can be tested by setting the thresholds of the temperature, pH, and power in the microcontroller.
The temperature sensor can be heated or cooled above the threshold. The pH sensor can be put into the aforementioned acid and base to test the pH threshold. The power sensing will be a little more difficult to test. One way to test it will be to place a component into the power strip that will use 500mA and set the threshold in the microcontroller to 400mA. Another way would be to use a pump, like an ordinary fish tank will have, and block the intake. This will make the pump draw more power, thus it should set off the alert.
Finally, once all of the individual components for the LCD are working properly they can all be incorporated together. The final test will be similar to the individual tests. First, they a sample program will change the values of the temperature, pH, and the currents for the current sensors. If the LCD copes with the changes appropriately then the real sensors can be tested together. The test for all of the real sensors individually can be applied to the complete test. If the display corresponds as it did on the individual tests with each component then the LCD display is working properly with the system.
6.3 Software Test Plan6.3.1 MicrocontrollerThe testing of the microcontroller should include three different stages. These stages are physical hardware testing, software module testing, and complete software testing. All of these needs to be tested to verify that the final product will work as specified.
The first thing that needs to be tested ,for the physical hardware section , is the ability of the microcontroller to power on and connect to a computer via the serial connection. Once a connection has been made to a computer, a test file should be programmed into the microcontroller, and once the programming is completed, the board should be reset and then the program should be verified. This can be something as simple as a blinking LED, as the only point of this test is to make sure that the device can be programmed. The second test is to verify that all of the pins are working properly. You can check the digital IO pins by setting each pin to HIGH and then checking the output with a multimeter. If there are any defective pins you can just avoid them in the programming stage because there are more pins than are actually needed. You can check the analog input pins by running the 5V pin through a resistor into each one of them and then reading the results. All of the analog readings should be within 5% of the others.

105
Software Modules
Variable PWM output
1. Connect a PWM pin through a resistor into ground 2. Connect circuit to an oscilloscope 3. Send 90% duty cycle to that pin 4. View the waveform and verify that it is 90%5. Send 50% duty cycle to the pin 6. View the waveform and verify that it is 50%7. Send 0% duty cycle to that pin8. View the waveform and verify that it is 0%9. Write a program that will cycle pin output from 0 through 90% 10.Watch waveform and make sure that it coincidences with the input
Relay Output
1. Connect a relay to a digital output pin 2. Run module that will turn on relay 3. Verify that relay is active 4. Run module that will turn off relay 5. Verify that the relay is non-active 6. Turn relay back on , and then run module that will turn on relay 7. Verify that the relay remains on 8. Turn off the relay and then run module that turns off the relay 9. Verify that the relay remains off
Power Input
1. Plug a device into the power strip that will use a standard current2. Run module that will take input from Current sensor and calculate power3. Display this result to the front display 4. Remove the device from the power supply and plug it into a KillAWatt
power measuring device5. Verify that the two outputs are within 10% of each other. 6. Run the power module again with no input and verify that the usage is
negligible.
Temperature Input
1. Connect temperature sensor to analog input 2. Run temperature module with sensor in a known temperature liquid 3. Display the result to the front panel4. Verify that the temperature is within 1 degree of the known temperature5. Run the temperature module again in a liquid with a different know
temperature

106
6. Display the result to the front panel7. Verify that the temperature is within 1 degree of the known temperature8. Verify that the data is being saved in the correct format
pH Input
1. Plug pH sensor into proper connector. 2. Insert pH sensor into distilled water which has been measured at 7pH3. Run pH module and sent output to the front display 4. Verify that the pH is within .2 units of 75. Insert pH sensor into saltwater which has been measured at 8.4 pH6. Verify that the pH is within .2 units of 8.4
Feed Mode
1. Plug lamps into the power strip2. Set all of the relays to active and verify that the lamps are on 3. Run the Feed Mode module with a time of 1 minute as the input 4. Verify that the lights turn off for 1 minute and then turn back on 5. Run steps 2 through 4 again, but run the feed mode module again 6. Verify that the lights do not stay off for an extra minute
Get Data
Preliminary testing
1. Temporarily replace the sensor input functions with functions that will return predefined numbers
2. Run the getData method module and display the results 3. Verify that the results are in the correct order, and that they coincidence
with the standard output of the temporary functions.
Final Testing
1. Make sure that all of the temperature, pH, and power sensors are connected to the device
2. run the getData method 3. Verify that all of the individual methods inside had enough time to run and
get their data properly4. Verify that the output matches that of the each individual sensor input.5. Verify that the output is saved in the proper format and in the proper order
Networking Testing
There needs to be a connection from the Arduino to the web server and this connection needs to be tested before any of the other networking and website

107
code can be tested. To test this you need to first test the hardware and initial software setup. You can do this by configuring the Arduino with the correct IP settings and connecting it to a router and beginning the basic server and client methods. From another computer on the same networking you can ping the Arduino and verify that is accepting and returning data. Once this connection has been established you can start testing the methods that use that connection.
Send Data
1. Override the storage state in the microcontroller to a defined number 2. Run the Send Data method and verify that the server has received the
defined numbers in order. 3. Verify that the information saved in the microcontroller did not change
Interrupts
1. Create a skeleton interrupt that will toggle an LED on the microcontroller2. Send the interrupt signal to this interrupt and verify that the led comes on. 3. Send the interrupt signal again and verify that the LED goes off 4. Once you have established that the networking interrupts work you can
verify the others
Completed Prototype Testing
When the prototype is complete there have to be various tests performed on the system to verify that the logic flow diagrams are being followed and that all of the information is being recorded and sent properly. The ALARM system should run consecutively for at least 180 days in a real world application, but that test is not feasible with the given time constraints of the project so other tests will have to be done. To test the reliability of the device we should run it for 24 hours straight and then make sure that there are no dangerous memory leaks or other storage problems. When the final prototype has all of the components tested the methods will need to be tested together.
Temperature Monitoring LED
1. Set the temperature to a normal setting where the fan should be off 2. Verify that the fan is not spinning 3. Set the heat-sink temperature to level that will initiate the first stage of the
cooling process4. Verify that the fan starts to spin at a 25% duty cycle 5. Raise the temperature to a high level which6. Verify that this causes the fan to spin at the maximum level 7. Allow the Heat sink to cool down to a normal level 8. Verify that the fan slows down back to the off position.
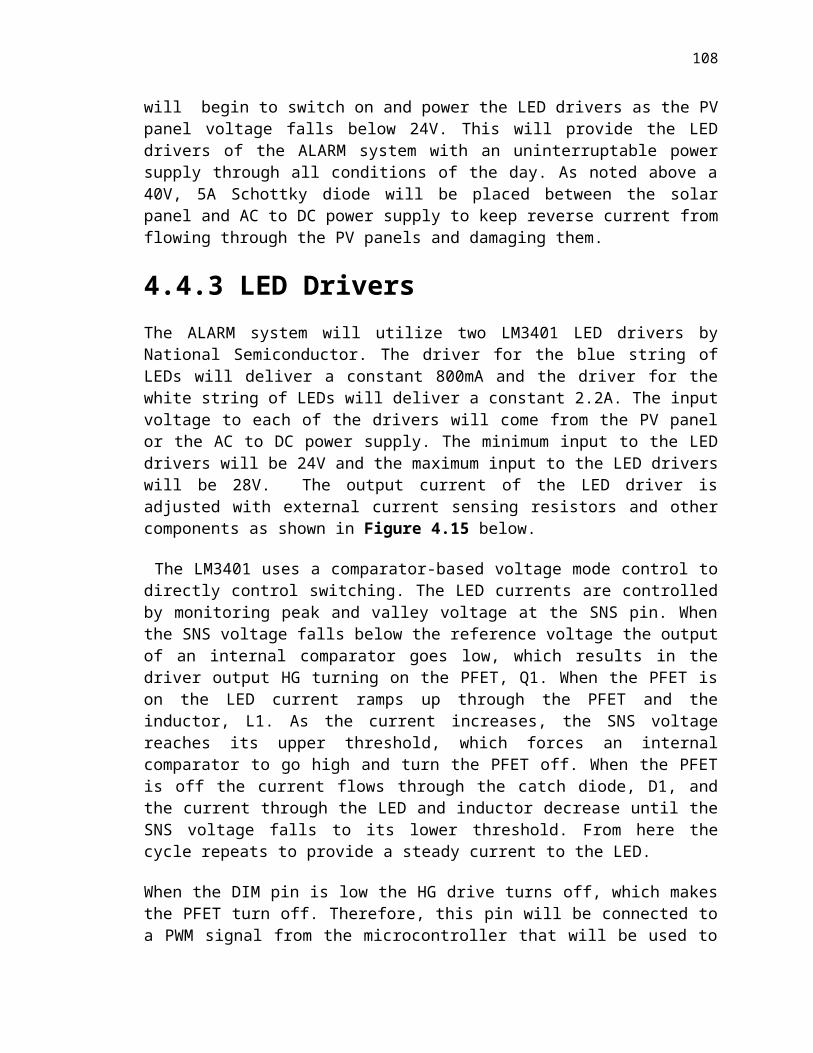
108
Temperature Monitoring Tank
Cold Testing
1. Set the temperature sensors in a 75 degree bucket of water2. Set the standard temperature in the settings to 80 degrees 3. Verify that the Heater relay is turned on and heating the water4. When the temperature reaches 80 degrees verify that the relay turns off
and the temperature stays at 80 degrees 5. Unplug the heating element 6. Verify that if the temperature does not make the target temperature in 30
minutes that an alert will be sent to the user
Hot Testing
1. Set the temperature sensors in an 85 degree bucket of water 2. Set the standard temperature to 80 degrees3. Verify that the heater is turned off and the fan/chiller relay is activated4. Leave the fan away from the tank 5. Verify that the system sends an alert to the user about the temperature
level6. Place the fan on the water 7. Verify that when the water returns to a normal level the fan/chiller relay is
turned off
6.3.2 WebsiteThe website will be tested throughout the entire coding process. The group members do not have much experience programming in PHP so they will test thoroughly while coding for the website. The tests run during the coding will be to confirm that every link brings the user to the correct page and each user interface portion works as it should. This will help the programmers learn PHP and ensure the code is correct. The website will need to test each of the functions to interact with the database. A test will be run to retrieve data from the database as well as sending information to the microcontroller. This will be used when the user needs to acquire data history or see the current mode of the ALARM system The interrupts will need to be tested for the website. Once the leak detection sensor is detected and tests confirm that the sensor works correctly, the website will be implemented to send an email to alert the owner. These tests will ensure that the leak sensor is detected; the website knows what to do when the interrupt is on, and the email sent to the user has the correct information and is sent to the correct email address. To run this test, the sensor will be placed in water and the website should be able to send an email to the email address specified in the settings page on the website.
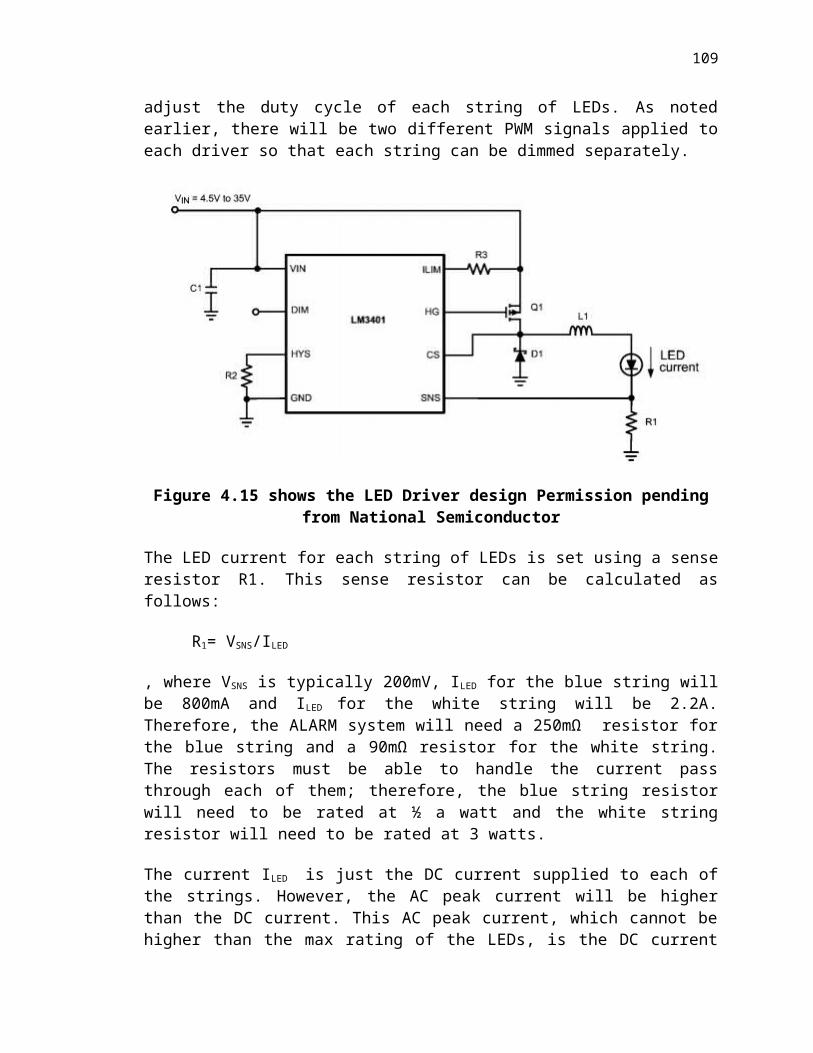
109
The home page will be tested by checking the data presented by the website. Each part of the data displayed is going to be retrieved from the most recent input to the database. The current mode should be the same as the mode specified in the settings. The next scheduled cleaning should be 14 days from the last cleaning. This date should be changed after every time the clean mode is set by the user. To test this function, the tester will put the ALARM system into cleaning mode and then back to automatic mode. Opening the home page should display a new “Next Clean Scheduled”. The testers will then test the feed time. The date will change every day but the time will be whatever the owner specifies on the settings page. The tester will change the feed time on the settings page and then check the feed time displayed on the home page to confirm that it has changed. The tester will also test the feed mode function. This function will change the feed time on the home page to notify that feed mode has been activated that day. The tester will also test the feeding interrupt. The interrupt will be set off if the feed time has passed and the owner has not activated feed mode that day. This interrupt will send an email to the owner to inform him/her of the problem.
Each of the settings submitted on the website will need to be tested. The tester will use the website to submit a desired mode for the ALARM system Once the mode is submitted the microcontroller should recognize the new settings and run accordingly. Each mode will be tested for its functionality. Once the lighting system is constructed the website will run tests to control the pulse-width modulation from the website. The first test run will test the “Light Settings”. In this section the sunrise and sunset times will be specified by the testers. Once the user click’s submit the microcontroller should recognize the new rise and set times and should turn the lights on and off accordingly. This will also test the sunrise and sunset times to make sure that the lights aren’t turned on too fast or too slow. Once this test is confirmed, the manual lighting setting will be tested. Using the slider bar on the website, the testers will set the lights to 0%. Once the settings are submitted the lights should be turned off. The testers will then gradually move the slider up in increments of 25% to test the pule-width modulation settings work. Next we will test the temperature and pH range settings function correctly. To test the temperature range the tester will input a low temperature and a high temperature on the website and submit the settings. The tester will then use the temperature sensor to sense a temperature outside of this range. The response should be that the website recognizes the measurement is outside of the range and the owner is notified. The tester will run the same test with a temperature in the range as well as below the range specified. More on the sensor testing can be found in the Microcontroller Hardware Testing section. The pH range will be tested in the same format of the temperature range. The pH will also need to be tested for a change in pH of more than 0.2 in a 24 hour period. The tester will need to change the alkalinity of the solution being tested between testing periods. This should set off an interrupt to the website to alert the owner of the aquarium.

110
Chapter 7 Estimated Project Milestones
7.1 HardwareThe hardware milestones are similar for each part of the project. Research will be a large part of the first half of the project. The research attained will allow the design portion to begin. The project will be designed by December. Once design is finished the group will start implementing the parts acquired. Building the enclosures and printed circuit boards will begin in the spring. The project will be complete by April 9th, 2012. Figure 7.1 below shows the hardware GANTT chart of the project.
Figure 7.1 shows the schedule for the hardware

111
7.2 SoftwareThe software milestones are similar to the hardware in the order that it will be constructed. Coding will begin over the winter break to get a head start on the software. Much of the hardware relies on the software to perform many specifications for the project. Completing the code early will allow the hardware parts to be implemented sooner. Figure 7.2 below shows the hardware GANTT chart of the project.
Figure 7.2 shows the schedule for the software

112
Chapter 8 Estimated Project Budget and Financing
8.1 Integrated Bill of MaterialsIn Table 8.1 and 8.2 the estimated bill of materials is displayed. Each component is listed along with its model, unit price, quantity, and total price. The total estimated budget for the ALARM is $921.40.
Bill of Materials
Component Model Quantity Unit Price
Total Price
Power Relays ORWH-SH-105H3F
5 $1.85 $9.25
Darlington Pair Driver ULN2803A 1 $1.49 $1.4920X4 LCD HD44780 1 $20.90 $20.90
15A White Duplex Outlet R52-05320-00W 3 $0.59 $1.77Single Gang Junction Box N/A 3 $0.59 $1.77
Outlet Faceplate N/A 3 $1.00 $3.002 Terminal PCB Mount PCBT2 5 $2.00 $2.0012V 1.5A Power Supply GS18A12-P1J 1 $16.00 $16.00PMOSFET White LED
DriverBSP250,115 2 $1.47 $2.94
PMOSFET Blue LED Driver
RSF010P03TL 2 $2.45 $1.40
Shottky Diode White LED Drive
1N5822-TP 2 $0.58 $1.16
Shottky Diode Blue LED Drive
1N5819 2 $0.54 $1.08
Shottky Diode PV Panel SB540E-G 2 $0.50 $1.00LED Drivers LM3401MM/NOPB 3 $2.45 $7.35
TableTop Power Supply 24V 3.75A
GS90A24-P1M 1 $44.49 $44.49
Water Resistant Plywood 4' by 4' by 1/2"
492930 1 $11.65 $11.65
Optix 48" by 96" by 1/8" Acrylic Sheet
MC-24 1 $97.96 $97.96
Heat Sink 8.46" Profile N/A 1 $29.52 $29.52Maxim High-Precision 1-Wire Digital Thermometer
DS18S20+T&R 1 $5.14 $5.14
Table 8.1 Estimated Bill of Materials

113
Component Model Quantity Unit Price
Total Price
NZXT 200mm Cooling Fan
FN 200RB 1 $18.95 $18.95
DC Barrel Jack PRT-10811 1 $0.95 $0.9525 Pin Serial Connector
FemaleDSUBF25F25 2 $2.50 $5.00
6ft DB25 Connector N/A 1 $8.99 $8.99Arduino Microcontroller Mega 2560 1 $50.00 $50.00
Ethernet Shield N/A 1 $49.95 $45.95Evergreen Solar Plant PV
CellsN/A 56 $1.43 $80.00
Artic Silver Thermal Adhesive
N/A 1 $7.95 $7.95
CREE XP-E Royal Blue XPEROY-L1-0000-00A01
6 $4.90 $29.40
CREE XM-L Cool White XMLAWT-00-0000-0000T6051
6 $9.00 $54.00
LEDLink XP-E 80 degree Optics
LL01CR-NE80L-M2
12 $1.20 $14.40
pH Sensor CD-401159 1 $39.99 $39.99pH Adapter Phidgets 1130 1 $29.10 $29.10
Temperature Sensor N/A 3 $3.00 $9.00Current Sensor CSLA2CD 5 $21.57 $107.85
Printed Circuit Board N/A 2 $50.00 $100.00Various Circuit Components
N/A N/A N/A $20.00
Shipping Costs N/A N/A N/A $40.00Total $921.40
Table 8.2 Estimated Bill of Materials Continued
8.2 Cost AnalysisThe ALARM will utilize a self-built PV panel instead of a pre-assembled PV panel because cost of the next standard size pre-assembled PV panel. As a group we knew that the backup power supply for the PV panel would have to come from an AC to DC power supply. The largest commercial standard size that an AC to DC power supply is available in is 24V. Therefore, the PV panel could not be the same size or both power supplies would always be on. We knew that the current needed to drive both string of LEDs was 3A so a 24V PV panel outputting at least 78 watt typically cost around $300. The next standard size for PV panels at 3A is 32V and the cost of these 96 watt PV panels can easily exceed $500. Therefore, we decided to equip the ALARM with a self-built PV panel in order to save money on the PV panel. The voltage of the PV panel needed to be a little over 24V;

114
therefore, we found 56 PV cells that typically outputs 5.5V at 3A. The cost of these 56 PV cells is only $80 and the cost of the other material needed to create this panel like plywood, acrylic, junction box and Schottky diode is only $110.61. Therefore, at least $309.39 could be saved by utilizing a self-built PV panel. The ALARM will utilize a regulated switching power supply that cost $44.49 as a backup power supply to the PV panel. At 24V, 3A an unregulated switching power supplies or linear power supplies typically cost at least $20 dollar less than regulated switching power supplies; however, the regulated switching power supply is needed for its efficiency and load protection. That is why we chose a regulated switching power supply over an unregulated switching power supply and linear power supply.
The cost of a single CREE XM-L Cool White LED is $9.00. Although this is a very high price, the lumen output of this LED far exceeds the lumen output of the CREE XP-E Cool White LED and CREE XR-E Cool White LED. With a minimum supply voltage of 24V from the AC to DC power supply only 6 LEDs could be put into in the white and blue strings of the ALARM so these extra lumens are necessary to provide the correct PUR to the saltwater aquarium at deeper depths. The cost of a single CREE XP-E Royal Blue LED is $4.90. This is the highest rated lumen output Royal Blue LED that CREE makes. This high lumen output is needed for the blue string as well. Even though the ALARM has to use LEDs with higher lumen output because of the lack of LEDs that can be put into a string the $309.39 dollars saved through the PV panels far exceeds the extra cost for these LEDs.
The LM3401 driver was chosen as the LED driver for the ALARM because of its low cost and its high current output. The cost of the LM3401 driver is only $2.45, but requires some external circuitry. The cost of this external circuitry only cost an additional five dollars, but allows for more versatility in the LED driver design. Although the 3021-D-I-350 driver does not require any external circuitry the cost of this driver is $15.99, nearly twice the price of the LM3401 driver. Another drawback to the 3021-D-I-350 driver is that its maximum output current is only 350mA. This is far below the current needed to drive the two LED strings of the ALARM.
The Arduino Mega and Ethernet Shield were chosen to be the main microcontroller based on their ability to meet the requirements, their price, and vast software library. The complete cost of both of these systems was under 100$ which is an improvement over what it would cost to design, build and test a custom designed microcontroller PCB. The Arduino Mega 2560 is 60$ and the Ethernet Shield is 38$. The cost of just the PCB alone would have been over 55$. The other various components would only add to that price. A custom PCB would also have a lead time which would delay the programming and testing stage. An equivalent evaluation board from TI or PIC would cost even more than that, and would not provide the amount of open source libraries that the Arduino does. The Arduino’s ICSP grants the group the ability to program directly from a
115
computer without having to buy a dedicated circuit programmer. These programmers are at minimum 40$, and would add to the already higher cost of the other devices.
The sensors used in the ALARM system have many different variations and costs. The temperature sensors used will be the generic temperature probe as well as the DS18S20. The generic temperature sensor is available on eBay for $3.00 with free shipping. The DS18S20 is sold through many semiconductor/electronics sites. Tayda Electronics offers this sensor for $1.99 and only $0.99 for shipping and handling. This is cheaper than the TMP100 due to the low cost in shipping.
The pH probe and adapter will be bought separately to save costs. The pH probe used will be the American Marine Pinpoint pH Probe. This is sold through MarineDepot.com for $39.99 with $7.99 for shipping. This is the cheapest pH probe found that fits the specifications desired. Most pH probes have a BNC connecter so the ALARM system will need an adapter to receive the info from the probe. The 1130 pH/ORP Adapter meets the specifications desired and has low current consumption. This part costs $29.10 through Phidgets with $13.14 for shipping.
The current sensors used will be the CSLA2CD. There will be five sensors located in the power supply junction box. Each sensor will cost $21.57 from the Digi-Key website. This comes out to $107.85 for all of the current sensors as well as $9.10 for shipping and handling. The ALARM system will use a virtual private server from Linux to host the website for the project. This will cost around $5.00 a month to use.
The relays that are used for the ALARM were chosen because they can withstand the load of the application as well as the price. Being that they are electromechanical relays they are large in size but they are cheaper in price when compared to the price of solid-state relays with the same load requirements. A solid state relay with the same load requirements of 120VAC average around $10 per relay, whereas the relays chosen are $1.85 per relay. In addition, size restriction was not a major factor in the design therefore the electromechanical turns out to be the better part even factoring in the cost of the cost of the IC to drive the relays.
The HD44780 LCD display was chosen because it is a simple character display. The ALARM does not require a complicated display interface. It also does not require button interface with the screen. These factors greatly reduce the price making the HD44780 the best choice.

116
8.3 Finance DetailsThe project will be sponsored by progress energy. The group has presented out initial project documentation and it has been approved by Progress Energy. With this approval Progress Energy has agreed to sponsor our requested budget of $1100 dollars. For this sponsorship our group has agreed to present at the Progress Energy Symposium in spring 2012. The sponsorship amount agreed upon by Progress Energy will completely cover the estimated cost of $921.40. The money from Progress Energy has been supplied to the UCF foundation rather than us a group directly; therefore, all purchases must be completed and documented by us as a group first. Then this documentation of receipts must be sent to the University of Central Florida for proper reimbursement. We as a group have decided to split the cost of parts before reimbursement so that none of us accumulate a lot of interest on a single credit card. To do this sponsorship through the UCF foundation, the University of Central Florida owns full rights to this prototype and it shall remain in their possession.
8.4 Parts Acquisition The parts for the ALARM will be acquired over the period of December 2012. No parts are out of stock or require a longer lead time than a week. In Table 8.1 below the supplier for ever component utilized in the ALARM is shown; along with the model number from the specific manufacturer.
Parts Acquisition
Component Model Supplier Availability
Power Relays ORWH-SH-105H3F
Digi-Key In Stock
Darlington Pair Driver ULN2803A Texas Instruments In Stock20X4 LCD HD44780 Futurelec In Stock
15A White Duplex Outlet R52-05320-00W Home Depot In StockSingle Gang Junction
BoxN/A Home Depot In Stock
Outlet Faceplate N/A Home Depot In Stock2 Terminal PCB Mount PCBT2 Futurelec In Stock12V 1.5A Power Supply GS18A12-P1J TRC Electronics In StockPMOSFET White LED
DriverBSP250,115 Digi-Key In Stock
PMOSFET Blue LED Driver
RSF010P03TL Digi-Key In Stock
Shottky Diode White LED Drive
1N5822-TP Digi-Key In Stock

117
Table 8.3 Parts Acquisition List
Component Model Supplier Availability
Shottky Diode PV Panel SB540E-G Digi-Key In StockShottky Diode Blue LED
Drive1N5819 Digi-Key In Stock
LED Drivers LM3401MM/NOPB
Digi-Key In Stock
TableTop Power Supply 24V 3.75A
GS90A24-P1M Jameco Electronics
In Stock
Water Resistant Plywood 4' by 4' by 1/2"
492930 Home Depot In Stock
Optix 48" by 96" by 1/8" Acrylic Sheet
MC-24 Home Depot In Stock
Heat Sink 8.46" Profile N/A reefledlights.com In StockMaxim High-Precision 1-Wire Digital Thermometer
DS18S20+T&R Digi-Key In Stock
NZXT 200mm Cooling Fan
FN 200RB reefledlights.com In Stock
DC Barrel Jack PRT-10811 Sparkfun In Stock25 Pin Serial Connector
FemaleDSUBF25F25 Futurelec In Stock
6ft DB25 Connector N/A Cablestogo.com In StockArduino Microcontroller Mega 2560 N/A Acquired
Ethernet Shield N/A N/A AcquiredEvergreen Solar Plant PV
CellsN/A EBay In Stock
Artic Silver Thermal Adhesive
N/A reefledlights.com In Stock
CREE XP-E Royal Blue XPEROY-L1-0000-00A01
reefledlights.com In Stock
CREE XM-L Cool White XMLAWT-00-0000-0000T6051
reefledlights.com In Stock
LEDLink XP-E 80 degree Optics
LL01CR-NE80L-M2
reefledlights.com In Stock
pH Sensor CD-401159 MarineDepot.com
In Stock
pH Adapter Phidgets 1130 Phidgets.com In StockTemperature Sensor N/A EBay In Stock
Current Sensor CSLA2CD Digi-Key In StockPrinted Circuit Board N/A PCB Express 1 week
lead
Table 8.4 Parts Acquisition List Continued

118
Chapter 9 Final Remarks and SummaryThe ALARM will incorporate a variety of software and hardware to measure the pH, temperature and power usage of a saltwater aquarium. These measurements will be presented to the user in a way that informs the user of the health status and power usage of their saltwater aquarium. Not only does the ALARM offer the user a way to monitor their saltwater aquarium, but the ALARM also offers the user a way to further control certain aspects of their aquarium. This control is made possible through continuous interaction between various hardware and software. A pivotal part of the ALARM is the ability to notify the user of the health status of their saltwater aquarium when they are away from their aquarium and offer control of the lighting system as well. We knew that the lighting system of aquariums is where the most power is used; therefore, we incorporated a PV panel into the ALARM to power the lighting system. This PV panel will save countless amounts of energy that is usually supplied through the grid.
As a group we realized the potential for significant resource conservation in the operation of aquariums. Initially the ALARM was geared for saltwater and freshwater aquariums; but, saltwater aquariums and freshwater aquariums require a little different lighting system. Therefore, the ALARM was limited to saltwater aquariums only. However, both saltwater and freshwater aquariums utilize the same resource therefore the scope of the ALARM can be extended to freshwater aquariums as well. Generally speaking, resources like power usage and food are constantly wasted in aquariums because of the lack of monitoring and control. The purpose of the ALARM is to limit this waste of resources through various monitoring and control techniques.
With the purpose of the ALARM set, we as a group had to set specific specifications and requirements of the ALARM. Then we spent countless hours of research investigating different ways that features of the ALARM could be implemented. From the various implementation ideas we had to decide which ideas would be most beneficial to the ALARM’s specific needs and requirements. From here a design for the ALARM was ready to be set into place. With the design set into place various components of the ALARM had to be picked out from different vendors while keeping a reasonable price of the ALARM into mind. Different members were assigned different sections of the ALARM; therefore, we had to meet continuously as a group to gather our final results and considerations. Finally, we had to take these different considerations and create a project budget that will be used in buying various materials.
The final prototype of the ALARM should have a positive impact on resource management of saltwater aquariums. It is strongly believed that the information the ALARM provides users about their saltwater aquariums will go a long way in helping the user save resources. Not only is the information the ALARM provides

119
vital to the success of resource management, but also the control the ALARM allows users to have over their aquariums. Lastly, lighting system of the aquarium will be powered by a PV panel, saving countless amounts of energy. Through this information, control and PV panel, the ALARM will satisfy various resource conservation needs of the user.

120
Appendix A.1: List of FiguresFigure 3.1 shows the charging cycle for the PS-15M charge controller. Copyright 2012 Morningstar Corporation.............................................................................19Figure 3.2 shows the photosynthesis response of PAR at different spectrum levels. Reprinted with permission from American Aquarium Products................23Figure 3.3 Block Diagram overview of Lighting System......................................36Figure 3.4 shows a 2 by 16-character LCD display. Permission pending from Futurlec...............................................................................................................37Figure 3.5 shows a portion of the characters that the HD44780 can produce. Permission pending from Hitachi.........................................................................38Figure 3.6 shows a 4 by 20- character LCD display. Permission pending from Futurlec...............................................................................................................38Figure 3.7 shows the size comparison between a solid state relay and an electromechanical relay. Permission pending from Solid State Optronics..........40Figure 3.8 Left shows Low-Side Current Shunt Circuit Design............................48Right shows High-Side Current Shunt Circuit Design permission pending from TI............................................................................................................................ 48Figure 3.9 shows the serial connections on the networking chip Pending Approval from WIZnet.........................................................................................51Figure 3.10 shows the ENC networking chip design Pending Approval from Microchip.............................................................................................................51Figure 3.11 shows the ZeroG networking overview Pending Approval from Microchip.............................................................................................................52Figure 4.1 shows the overall hardware block diagram of the ALARM system.....55Figure 4.2 shows A) The ALARM system’s custom power supply. The green area is where the PCB will be mounted. B) This shows the side of power strip nearest the power strip. The serial bus is mounted at the top closet to the PCB............................................................................................................................. 59Figure 4.3 shows the pin outs of the relay...........................................................60Figure 4.4 shows the block diagram of the relay sub-system..............................61Figure 4.5 shows the 5V supply of the Mega 2560. Permission pending from Arduino................................................................................................................62Figure 4.7 shows the general power block diagram layout..................................63Figure 4.8 shows the schematic of the temperature sensors, pH sensor, and the LCD display.........................................................................................................64Figure 4.9 shows the schematic for the power of the relays, microcontroller and the current sensors..............................................................................................65Figure 4.10 shows the Arduino Mega MCU – permission pending from Arduino.cc............................................................................................................................ 66Figure 4.11 shows the main software logic flow..................................................69Figure 4.12 show the feed mode interrupt sequence..........................................71Figure 4.13 shows the light state sequence........................................................72Figure 4.14 shows the PV panel design..............................................................77Figure 4.15 shows the LED Driver design Permission pending from National Semiconductor....................................................................................................79

121
Figure 4.16 shows the LED and cooling fan placement on the heat sink............83Figure 4.17 shows the detailed LED lighting system block diagram....................85Figure 4.18 shows the template of the ALARMs information to be displayed.. . .86Figure 4.19 shows the overall diagram of the website........................................89Figure 4.20 shows the homepage of the Web Interface......................................90Figure 4.21 shows the aquarium settings page...................................................91Figure 4.22 shows the Arduino Ethernet shield physical design – Permission Pending...............................................................................................................93Figure 4.23 shows the networking interface permission pending........................94Figure 4.24 shows a block diagram of the interrupts...........................................95Figure 5.1 shows the Arduino IDE Interface Copyright Arduino – permission pending................................................................................................................99Figure 5.2 Shows the Waterfall Model...............................................................101Figure 7.1 shows the schedule for the hardware...............................................113Figure 7.2 shows the schedule for the software................................................114
Appendix A.2: List of Tables
Table 4.1 MCU Pinout67Table 4.2 Arduino Mega Summary68Table 4.3 White String LED Driver Design Parameters 81Table 4.4 Blue String LED Driver Design Parameters 82Table 8.1 Estimated Bill of MaterialsTable 8.2 Parts Acquisition List120

122
Appendix A.3 Works Cited1. http://led.linear1.org/what-is-an-led/2. http://www.ti.com/lit/an/slyt084/slyt084.pdf3. http://www.americanaquariumproducts.com/Aquarium_Lighting.html4. http://www.leonics.com/support/article2_12j/articles2_12j_en.phpJ5. http://www.energystar.gov/ia/partners/prod_development/revisions
/downloads/International_Efficiency_Marking_Protocol.pdfJ6. http://www.morningstarcorp.com/en/pro-starJ7. http://www.futurlec.com/10A_Solar_Charge_Controller_EPHC.shtmlJ8. http://www.fairchildsemi.com/ds/LM/LM7805.pdf9. http://www.ti.com/product/lm3s6c11J10. http://www.atmel.com/dyn/resources/prod_documents/doc2549.pdf11. http://www.alldatasheet.com/view.jsp?Searchword=PIC30F6012A-3012. http://www.societyofrobots.com/member_tutorials/
book/export/html/22813. http://www.cree.com/products/pdf/XLampThermalManagement.pdf14. http://sound.westhost.com/heatsinks.htm#s215. http://polarpowerinc.com/info/operation20/
operation23.htm16. http://www.jameco.com/Jameco/content/walladapter.html17. http://www.futurlec.com/LED/LCD16X2BL.shtml18. http://www.futurlec.com/LED/LCD16X2BLa.shtml19. http://www.futurlec.com/LED/LCD20X4BL.shtml20. http://www.ssousa.com/appnote040.asp21. http://animals.howstuffworks.com/pets/choosing-aquarium-
equipment9.htmJ22. http://www.ti.com/product/tmp100J23. http://www.maxim-ic.com/datasheet/index.mvp/id/281524. http://www.firsttankguide.net/ph.php25. http://www.phidgets.com/products.php?product_id=1130J26. http://www.nktechnologies.com/current-sensing.htmlJ27. http://parts.digikey.ca/1/1/216878-ic-therm-microlan-hi-prec-92-
ds18s20.htmlJ28. http://focus.ti.com/analog/docs/gencontent.tsp
?familyId=57&genContentId=28020J29. http://dev.mysql.com/doc/refman/5.1/en/what-is-mysql.html30. http://www.sqlite.org/different.html31. http://www.objs.com/survey/lang.htmJ32. http://www.sitepoint.com/php-mysql-tutorial/J33. http://www.wiznet.co.kr/UpLoad_Files/ReferenceFiles/
W5100_Datasheet_v1.2.4.pdf34. http://www.arduino.cc/en/Main/ArduinoEthernetShield35. http://www.microchip.com/wwwproducts/Devices.aspx
?dDocName=en02288936. http://www.asynclabs.com/store?page=shop.product_details&

123
flypage=flypage.tpl&product_id=26&category_id=637. http://kennethfinnegan.blogspot.com/2010/01
/switching-120vac-with-5v-digital-logic.htmlJ38. http://arduino.cc/en/uploads/Main/arduino-mega2560-schematic.pdf39. http://www.arduino.cc/en/Reference/40. http://www.diypvsolarenergy.com/41. http://www.national.com/pf/LM/LM3401.html42. http://scienceshareware.com/how-to-measure-AC-DC-
current-with-a-hall-effect-clamp-.htm

124
Appendix A.4: Permissions

125

126

127
Table of ContentsChapter 1 Introduction...........................................................................................1
1.1 Executive Summary.....................................................................................11.2 Motivation and Goals...................................................................................2
Chapter 2 Specifications and Requirements.........................................................52.1 Functional Requirements.............................................................................52.2 Performance Requirements.........................................................................62.3 Hardware Specifications..............................................................................7
2.3.1 Sensor Specifications............................................................................72.3.2 Microcontroller Specifications................................................................92.3.3 Relay Specifications...............................................................................92.3.4 Lighting System Specifications..............................................................92.3.5 PV Panel Specifications.......................................................................132.3.6 Storage Specifications.........................................................................132.3.7 Networking Specifications....................................................................13

128
2.3.8 Power Management Specifications......................................................142.3.9 Front Display Specifications.................................................................14
2.4 Website Specifications...............................................................................15Chapter 3 Research............................................................................................16
3.1 Similar Projects and Products....................................................................163.2 Power Management Research...................................................................17
3.2.1 Power Supply.......................................................................................183.2.2 Charge Controller.................................................................................183.2.3 Linear Regulators.................................................................................19
3.3 Microcontroller Research...........................................................................203.4 Lighting System..........................................................................................22
3.4.1 Aspects of Lighting...............................................................................223.4.2 Different Kinds of Lighting Systems.....................................................243.4.3 LEDs....................................................................................................263.4.4 LED Driver...........................................................................................273.4.5 PWM....................................................................................................293.4.6 Heat Sink.............................................................................................303.4.7 DC Power Supply.................................................................................32
3.4 Display Research.......................................................................................363.6 Relay Research..........................................................................................393.7 Sensor Research.......................................................................................42
3.7.1 Temperature Sensor............................................................................423.7.2 pH Sensor............................................................................................443.7.3 Leak Detection Sensor.........................................................................453.7.4 Current Sensor.....................................................................................45
3.8 Database Management Research.............................................................483.9 Website Research......................................................................................493.10 Networking Research...............................................................................503.11 Push Button Research.............................................................................52
Chapter 4 Design................................................................................................544.1 Design Summary........................................................................................544.2 Power Management Design.......................................................................56
4.2.1 LEDs power.........................................................................................564.2.2 Power Heads, Heater and Pumps.......................................................57

129
4.2.3 Sensors LCD and Microcontroller Power.............................................624.3 Microcontroller Design...............................................................................654.4 Lighting system Design..............................................................................73
4.4.1 PV Panel..............................................................................................744.4.2 AC to DC Power Supply.......................................................................774.4.3 LED Drivers.........................................................................................784.4.4 Heat Sink Assembly.............................................................................824.4.5 Lighting System Summary...................................................................83
4.5 Display Design...........................................................................................854.6 Sensor Design............................................................................................86
4.6.1 Temperature Sensor............................................................................864.6.2 pH Sensor............................................................................................874.6.3 Leak Detection Sensor.........................................................................884.6.4 Current Sensor.....................................................................................88
4.7 Website and Database Design...................................................................894.8 Networking Design.....................................................................................92
4.8.1 Hardware Design.................................................................................924.8.2 Software...............................................................................................94
4.9 Push Button Design...................................................................................95Chapter 5 Prototype Construction Plan...............................................................97
5.1 Build and Implementation Strategy............................................................975.2 Coding Plan................................................................................................98
Chapter 6 Prototype Test Plan..........................................................................1036.1 Testing Environment................................................................................1036.2 Hardware Test Plan.................................................................................103
6.2.1 Lighting System.................................................................................1036.2.2 Relay System.....................................................................................1056.2.3 Display...............................................................................................106
6.3 Software Test Plan...................................................................................1076.3.1 Microcontroller...................................................................................1076.3.2 Website..............................................................................................111
Chapter 7 Estimated Project Milestones...........................................................1137.1 Hardware..................................................................................................1137.2 Software...................................................................................................114

130
Chapter 8 Estimated Project Budget and Financing..........................................1158.1 Integrated Bill of Materials........................................................................1158.2 Cost Analysis...........................................................................................1168.3 Finance Details........................................................................................1198.4 Parts Acquisition......................................................................................119
Chapter 9 Final Remarks and Summary...........................................................121Appendix A.1: List of Figures.............................................................................123Appendix A.2: List of Tables..............................................................................124Appendix A.3 Works Cited.................................................................................125Appendix A.4: Permissions................................................................................127