aquaculture nutrition research largely from d’abramo, et al
TRANSCRIPT

Aquaculture Nutrition Aquaculture Nutrition ResearchResearch
Largely from D’Abramo, et al.

IntroductionIntroduction
Besides the constraints imparted Besides the constraints imparted on successful aquaculture by site on successful aquaculture by site variance, nutritional research also variance, nutritional research also shows substantial shortcomingsshows substantial shortcomings
this affects the interpretation and this affects the interpretation and comparison of resultscomparison of results

IntroductionIntroduction
virtually no standardization exists in the virtually no standardization exists in the industry todayindustry today
major areas requiring standards:major areas requiring standards:– experimental designexperimental design– diet formulationdiet formulation– production techniquesproduction techniques– type and purity of feed ingredientstype and purity of feed ingredients– culture conditionsculture conditions– analytical methodologiesanalytical methodologies

IntroductionIntroduction Several authors have made suggestionsSeveral authors have made suggestions some of the first were made by New some of the first were made by New
(1976), but have had little impact(1976), but have had little impact he suggested the development of a he suggested the development of a
standard reference dietstandard reference diet these semi-purified diets were largely these semi-purified diets were largely
developed using crustaceans tissues as developed using crustaceans tissues as protein sourcesprotein sources
species: species: Homarus americanusHomarus americanus, , Panulirus Panulirus argusargus, various penaeids, various penaeids

IntroductionIntroduction
Part 1Part 1: Experimental Culture Systems: Experimental Culture Systems Part 2Part 2: Selection of Experimental : Selection of Experimental
OrganismsOrganisms Part 3Part 3: Experimental Diets: Experimental Diets Part 4Part 4: Evaluation of Nutrient : Evaluation of Nutrient
RequirementsRequirements Part 5Part 5: Recommended Guidelines: Recommended Guidelines
I. Experimental Culture I. Experimental Culture SystemsSystems
Water Source and QualityWater Source and Quality first step to proper researchfirst step to proper research holding system must not interfere holding system must not interfere
with the response to the nutritional with the response to the nutritional factor under investigationfactor under investigation
water supplied might profoundly water supplied might profoundly affect resultsaffect results
a major decision in planninga major decision in planning

I. Experimental Culture I. Experimental Culture SystemsSystems
Water Source and Quality (continued)Water Source and Quality (continued) contaminants (pesticides, heavy metals, contaminants (pesticides, heavy metals,
ammonia, nitrite) can ammonia, nitrite) can cause stresscause stress and and depress depress growthgrowth
also avoid high levels of chlorine , dissolved iron, also avoid high levels of chlorine , dissolved iron, hardness and alkalinityhardness and alkalinity
avoid high levels of suspended or dissolved avoid high levels of suspended or dissolved nutrients in water (they could serve as sufficient nutrients in water (they could serve as sufficient source of nutrition)source of nutrition)
you would fail to recognize deficiency responseyou would fail to recognize deficiency response

I. Experimental Culture I. Experimental Culture SystemsSystems
Water Source and Quality Water Source and Quality (continued)(continued)
growth enhancing effect of pond growth enhancing effect of pond water well established (Moss, 1992)water well established (Moss, 1992)
ultimately causes substantial ultimately causes substantial variation in the level of treatmentvariation in the level of treatment
must include filtration and, often, UVmust include filtration and, often, UV summary:summary: no standardization of no standardization of
water leads to erroneous conclusionswater leads to erroneous conclusions
I. Experimental Culture I. Experimental Culture SystemsSystems
Experimental ConditionsExperimental Conditions physiochemical factors affecting response physiochemical factors affecting response
variables include temp, salinity, photoperiodvariables include temp, salinity, photoperiod need to be controlled within normal criteria need to be controlled within normal criteria
for growth, monitored, reportedfor growth, monitored, reported probably should be standardized for each probably should be standardized for each
developmental stage of each speciesdevelopmental stage of each species goalgoal: physiologically optimal conditions: physiologically optimal conditions

I. Experimental Culture I. Experimental Culture SystemsSystems
System DesignSystem Design flow-through systems usually assure flow-through systems usually assure
constancy of chemical compositionconstancy of chemical composition that is, unless external conditions that is, unless external conditions
fluctuate substantiallyfluctuate substantially recirc systems are acceptable, but recirc systems are acceptable, but
require more careful and frequent require more careful and frequent monitoringmonitoring

I. Experimental Culture I. Experimental Culture SystemsSystems
System Design (continuedSystem Design (continued)) must also minimize intraspecific behavioral must also minimize intraspecific behavioral
interactionsinteractions these can produce differential growth ratesthese can produce differential growth rates solutionsolution: individual containers (Port A): individual containers (Port A) water should not have come in contact with water should not have come in contact with
other individuals (lobsters, Hedgecock and other individuals (lobsters, Hedgecock and Nelson, 1978)Nelson, 1978)
caveatcaveat: could : could bebe required in some cases (schooling species)
II. Experimental Culture . Experimental Culture SystemsSystems
System Design (continued)System Design (continued) benefits to housing animals
individually include:– reduced cannibalism (molt and die)– increased sample sizes (each indivi-dual is
considered a single, independent observation– large sample size is required for those species
that exhibit a high degree of variation in size– growth, molting, behavioral responses can be
observed and recorded for the duration of the experiment

I. Experimental Culture I. Experimental Culture SystemsSystems
System Design (continued)System Design (continued) size of culture containers is also critical most species exhibit density-
dependent growth (even for one individual per container)
weight increase is influenced by surface area and volume of container
can reduce molt frequency (growth) may wind up with high growth rate in
tanks with higher mortality!!

II. Selection of Experimental II. Selection of Experimental OrganismsOrganisms
Must know the feeding history of animals to Must know the feeding history of animals to be used be used
inconsistent results increase when not knowninconsistent results increase when not known often resolved by feeding a preconditioning often resolved by feeding a preconditioning
control diet, prior to studycontrol diet, prior to study length of period depends on type of nutritional length of period depends on type of nutritional
investigationinvestigation faster growing juveniles need less faster growing juveniles need less
conditioningconditioning conditioning less when studying nutrients that conditioning less when studying nutrients that
are readily metabolizedare readily metabolized (COH, AA’s, etc.) (COH, AA’s, etc.)

II. Selection of Experimental II. Selection of Experimental OrganismsOrganisms
Preconditioning period increases the Preconditioning period increases the probability of obtaining well-defined probability of obtaining well-defined responses to different levels of a dietary responses to different levels of a dietary nutrientnutrient
in general, animals of similar size in general, animals of similar size (weight/length) should be chosen(weight/length) should be chosen
however, might be misleading: depends on however, might be misleading: depends on history of disease, nutrition, etc.history of disease, nutrition, etc.
small shrimp are not necessarily the same small shrimp are not necessarily the same age (e.g., RDS)age (e.g., RDS)

III. Experimental DietsIII. Experimental Diets
Standard Reference DietsStandard Reference Diets not all species have been that well researched
(crustacean<fish<terrestrials) most work on small terrestrials gives insight
into research on aquatics SRD’s for mice were only established 25 years
ago differences in nutrition of animals can result in
up to 5-fold differences in LC50 data for some species/toxicants (Bengston et al., 1985)

III. Experimental DietsIII. Experimental DietsStandard Reference DietsStandard Reference Diets SRD’s have been developed due to a need
to minimize variation in ingredient composition of nutritional test diets
SRD1: vitamin-free casein (Conklin et al., 1983) reasonable growth
SRD2: crab protein concentrate (Castell et al., 1989b) reasonable growth
TAMU-SMP reference diet

Effect of Lecithin on Cholestrol in Effect of Lecithin on Cholestrol in Lobster (Baum et al., 1990)Lobster (Baum et al., 1990)
IngredientIngredient % dry weight% dry weightcaseincasein 31.031.0 0.0 0.0 31.031.0 0.0 0.0egg albuminegg albumin 4.0 4.0 0.0 0.0 4.0 4.0 0.0 0.0isolated crab proteinisolated crab protein 0.0 0.0 35.035.0 0.0 0.0 35.035.0soy lecithin (refined)soy lecithin (refined) 10.010.0 10.010.0 0.0 0.0 0.0 0.0cellulosecellulose 12.212.2 12.212.2 22.222.2 22.222.2corn starchcorn starch 24.024.0 samesame samesame samesamelipid mixlipid mix 6.0 6.0 wheat glutenwheat gluten 5.0 5.0vitamin mixvitamin mix 4.0 4.0 mineral mixmineral mix 3.0 3.0cholestrolcholestrol 0.5 0.5vit Evit E 0.1 0.1vit Avit A 0.1 0.1vit Dvit D 0.1 0.1

Requirement for Lysine by Penaeus Requirement for Lysine by Penaeus vannamei (Fox et al., 1992)vannamei (Fox et al., 1992)
IngredientsIngredients Experimental Diets (% lysine)Experimental Diets (% lysine)1.501.50 1.901.90 2.102.10 2.302.30 2.502.50 3.003.00
wheat glutenwheat gluten 31.1531.15 25.3725.37 21.8621.86 18.3618.36 14.8614.86 6.10 6.10lysine glutenlysine gluten 0.00 0.00 5.73 5.73 9.20 9.20 12.6612.66 16.1316.13 24.7924.79fish mealfish meal 27.0027.00 27.0027.00 27.0027.00 27.0027.00 27.0027.00 27.0027.00wheat starchwheat starch 27.5127.51 27.5627.56 27.6027.60 27.6427.64 27.6727.67 27.7727.77menhaden oilmenhaden oil 1.66 1.66 1.66 1.66 1.66 1.66 1.66 1.66 1.66 1.66 1.66 1.66cholestrolcholestrol 0.25 0.25 0.25 0.25 0.25 0.25 0.25 0.25 0.26 0.26 0.25 0.25lecithinlecithin 0.50 0.50 0.50 0.50 0.50 0.50 0.50 0.50 0.50 0.50 0.50 0.50cellulosecellulose 2.74 2.74 2.74 2.74 2.74 2.74 2.74 2.74 2.74 2.74 2.74 2.74diatomaceous earthdiatomaceous earth 2.69 2.69 2.69 2.69 2.69 2.69 2.69 2.69 2.69 2.69 2.69 2.69ascorbic acidascorbic acid 0.50 0.50 0.50 0.50 0.50 0.50 0.50 0.50 0.50 0.50 0.50 0.50vitamin premixvitamin premix 2.00 2.00 2.00 2.00 2.00 2.00 2.00 2.00 2.00 2.00 2.00 2.00mineral premixmineral premix 4.00 4.00 4.00 4.00 4.00 4.00 4.00 4.00 4.00 4.00 4.00 4.00

III. Experimental DietsIII. Experimental Diets
CompositionComposition should contain as few ingredients as possibleshould contain as few ingredients as possible minimizes availability and compositional change minimizes availability and compositional change
issues (I.e., SRD diets must be reproducible)issues (I.e., SRD diets must be reproducible) must use purified diets (composed primarily of must use purified diets (composed primarily of
refined ingredients)refined ingredients) ingredient nomenclature must follow published ingredient nomenclature must follow published
guidelines (International Union of Nutritional guidelines (International Union of Nutritional Sciences, 1978)Sciences, 1978)

III. Experimental DietsIII. Experimental Diets
CompositionComposition caveat: use of ingredients with greater than
99% purity is cost prohibitive (even for research)
however, more pure = more control changing levels of supplemented
micronutrients by changing levels of feed ingredients leads to concomitant alteration in levels of micronutrients
III. Experimental DietsIII. Experimental Diets
PreparationPreparation careful attention must be paid when mixing
dietary ingredients factors: particle shape, density, static
charge, hygroscopicity, adhesiveness satisfactory mixing time required for all diets
(affected by quality of ingredient and mixer) we use “V”-type mixers
III. Experimental DietsIII. Experimental Diets
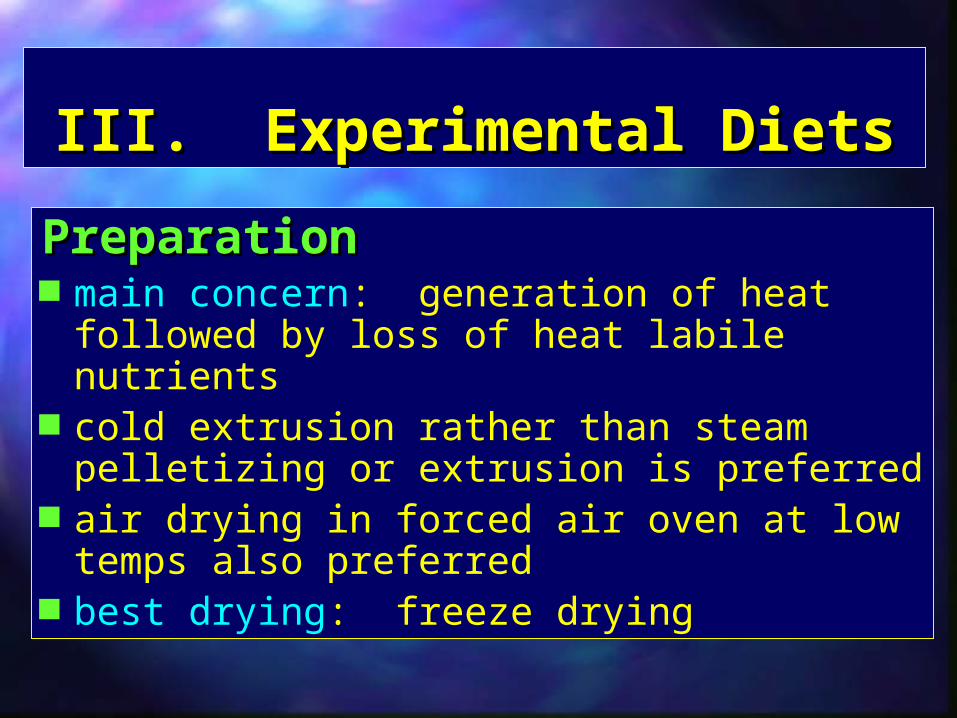
PreparationPreparation main concern: generation of heat
followed by loss of heat labile nutrients cold extrusion rather than steam
pelletizing or extrusion is preferred air drying in forced air oven at low
temps also preferred best drying: freeze drying

III. Experimental DietsIII. Experimental DietsBindersBinders as mentioned, crustaceans find food by
chemoreception, not sight some are real picky and may not consume
feeds for hours (rarely) somehow stability must be standardized D’Abramo and Castell (1997) recommend
16 hours’ stability glutens appear useful, but are pretty bad in
terms of leaching of CAA’s, ascorbic acid

III. Experimental DietsIII. Experimental DietsInteractionsInteractions regards the possible effect of each
ingredient on bioavailability of other nutrients in diet
alginate binds with phytic acid and reduces availability of calcium
zinc bioavailability reduced by calcium, phosphorus, phytic acid
some COH’s affect uptake of proteins and amino acids

III. Experimental DietsIII. Experimental DietsDigestibility StudiesDigestibility Studies as mentioned, digestibility determinations
are undertaken primarily with Cr2O7
may not pass homogenously through gut due to sequestering (probably in HP)
Does concentration in fecal material increase with time? If so, you have a problem.
Other suggestion: check each ingredient or nutrient source being tested at 15% and 30% levels (remainder is a base formulation)
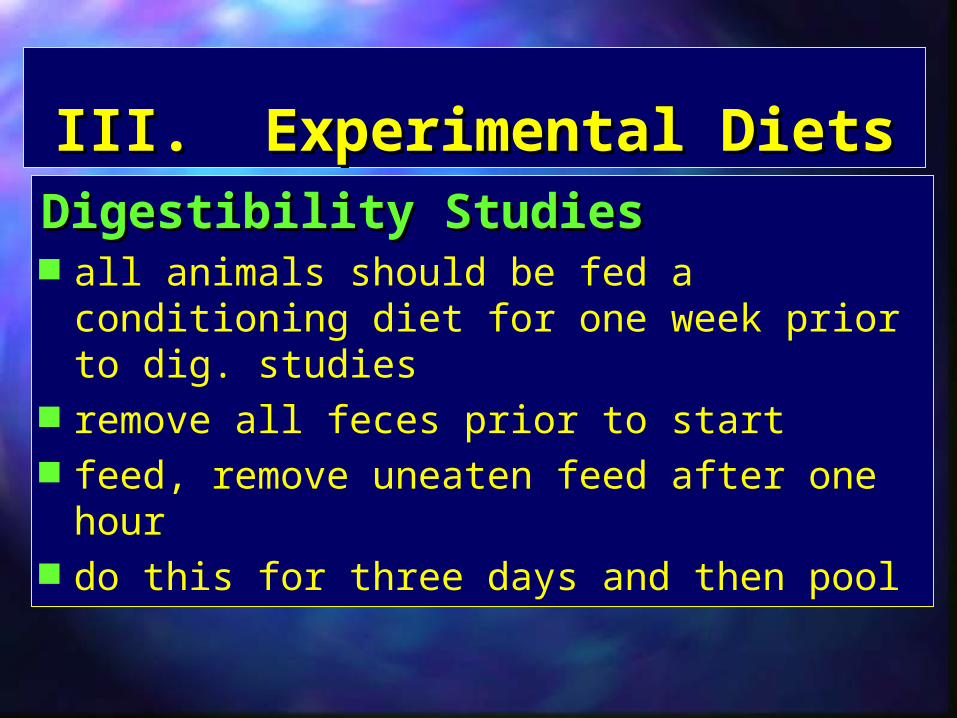
III. Experimental DietsIII. Experimental DietsDigestibility StudiesDigestibility Studies all animals should be fed a conditioning
diet for one week prior to dig. studies remove all feces prior to start feed, remove uneaten feed after one
hour do this for three days and then pool

III. Experimental DietsIII. Experimental DietsProcessing and StorageProcessing and Storage identical formulations and feed ingredient
sources do not guarantee that diets will have identical nutritional value
ingredient particle size, grinding, mixing, processing technique, temperature, moisture content affect nutritional value
conditions and length of storage do also 44-66% loss of vit C occurs as a result of high
temp processing (1/2 this via cold processing)

IV. Evaluation of Nutrient IV. Evaluation of Nutrient RequirementsRequirements
Methods of EvaluationMethods of Evaluation studies should be repeated at various
times to confirm reproducibility proves experimental design indices: weight gain, survival, tissue
levels, biochemical indices minimum of 4 dietary levels of the
nutrient being studied

IV. Evaluation of Nutrient IV. Evaluation of Nutrient RequirementsRequirements
Methods of EvaluationMethods of Evaluation less than 4 levels means curve fitting is
difficult level of nutrient must be confirmed in
each diet (i.e., don’t just calculate it!) also: check out actual availability of the
nutrient to the organism measured dietary requirements generally
assume 100% availability

IV. Evaluation of Nutrient IV. Evaluation of Nutrient RequirementsRequirements
Methods of EvaluationMethods of Evaluation water soluble nutrients leach, especially water soluble nutrients leach, especially
when feed particles are handled over when feed particles are handled over long periods of timelong periods of time
possible impact of leaching on nutrient possible impact of leaching on nutrient levels is virtually impossible to quantifylevels is virtually impossible to quantify
nutrients must eventually be provided in nutrients must eventually be provided in water insoluble form (e.g., water insoluble form (e.g., microencapsulation)microencapsulation)

IV. Evaluation of Nutrient IV. Evaluation of Nutrient RequirementsRequirements
Experimental PeriodExperimental Period how long should be ascertained in how long should be ascertained in
advance via tissue deposition studiesadvance via tissue deposition studies without this, you don’t know if levels are without this, you don’t know if levels are
higher or lower than when you startedhigher or lower than when you started if you have high levels at the start, you if you have high levels at the start, you
may not ever see a significant increasemay not ever see a significant increase if period is too short, you may never see if period is too short, you may never see
deficiency signsdeficiency signs
IV. Evaluation of Nutrient IV. Evaluation of Nutrient RequirementsRequirements
Comparison of Growth Rate Comparison of Growth Rate EstimatesEstimates
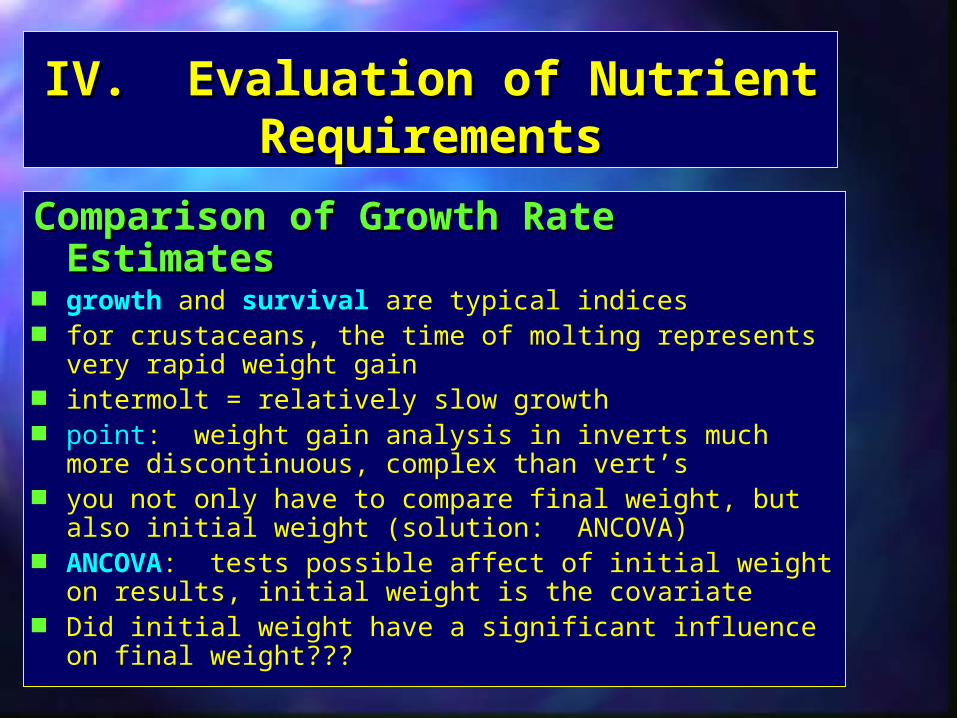
growth and survival are typical indices for crustaceans, the time of molting represents very
rapid weight gain intermolt = relatively slow growth point: weight gain analysis in inverts much more
discontinuous, complex than vert’s you not only have to compare final weight, but also
initial weight (solution: ANCOVA) ANCOVA: tests possible affect of initial weight on
results, initial weight is the covariate Did initial weight have a significant influence on final
weight???
IV. Evaluation of Nutrient IV. Evaluation of Nutrient RequirementsRequirements
Comparison of Growth Rate Comparison of Growth Rate EstimatesEstimates
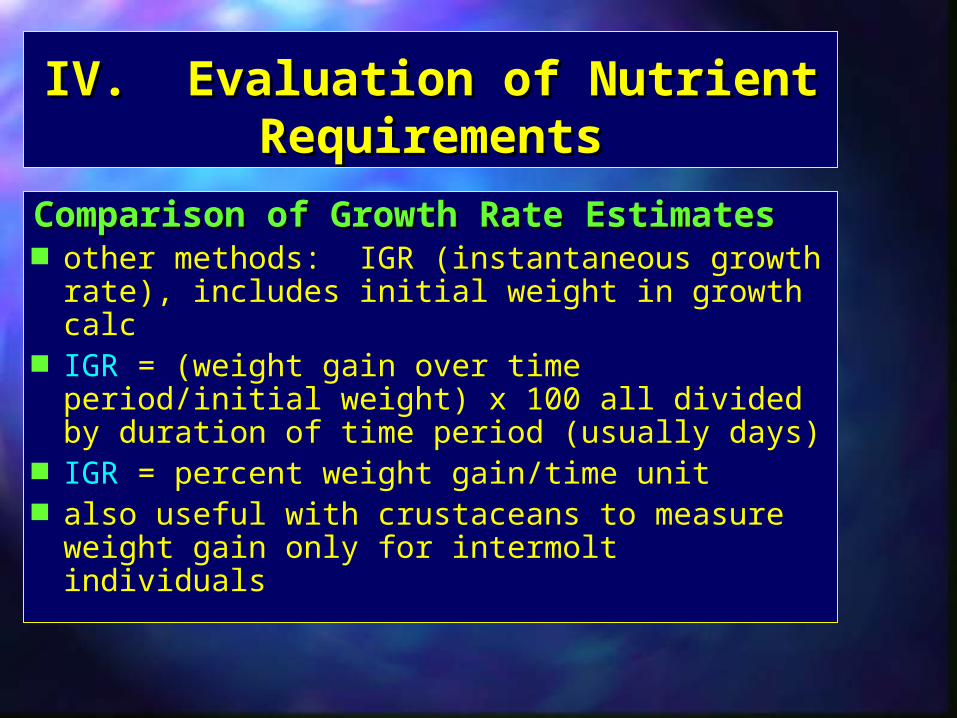
other methods: IGR (instantaneous growth rate), includes initial weight in growth calc
IGR = (weight gain over time period/initial weight) x 100 all divided by duration of time period (usually days)
IGR = percent weight gain/time unit also useful with crustaceans to measure
weight gain only for intermolt individuals

IV. Evaluation of Nutrient IV. Evaluation of Nutrient RequirementsRequirements
SurvivalSurvival another typical index used; however,
highly influenced by environmental stress death can occur just due to handling at onset of trial, replace dead for a period
of one week replacements should have been fed same
control diet and be acclimated to system must also consider frequency of handling

IV. Evaluation of Nutrient IV. Evaluation of Nutrient RequirementsRequirements
SurvivalSurvival for crustaceans, sampling throughout the
feeding trial is virtually impossible the cause of mortality might not be evident need to check HP in shrimp, see if
hepatosomatic index is normal survival of less than 80% should be suspect have a look at Japanese studies in the 80’s

IV. Evaluation of Nutrient IV. Evaluation of Nutrient RequirementsRequirements
Statistical AnalysisStatistical Analysis an expression of the degree of variation of
measured responses for each dietary treatment within an experiment should be presented
standard error (SE) is usually the appropriate statistic for comparing variation among treatments
if error variances are homogenous, then the degree of variation should be expressed as pooled standard error for all experimental animals

IV. Evaluation of Nutrient IV. Evaluation of Nutrient RequirementsRequirements
Statistical AnalysisStatistical Analysis as mentioned, survival should not be
less than 80% in any treatment less than 80% reduces the number of
observations, reduces accuracy of statistical analysis
coefficient of variation should be less than 15%
higher values could yield incorrect conclusions
IV. Evaluation of Nutrient IV. Evaluation of Nutrient RequirementsRequirements
Estimating Nutrient Estimating Nutrient RequirementsRequirements
different methods have been useddifferent methods have been used usually linear regression from a series of usually linear regression from a series of
selected pointsselected points each point represents a response (e.g., each point represents a response (e.g.,
weight gain) to a set level of dietary nutrientweight gain) to a set level of dietary nutrient graph showing all responses should increase graph showing all responses should increase
linearly with dose/level and then plateaulinearly with dose/level and then plateau the “requirement” is where the sloped line the “requirement” is where the sloped line
intersects with the plateau/flat lineintersects with the plateau/flat line
IV. Evaluation of Nutrient IV. Evaluation of Nutrient RequirementsRequirements
Estimating Nutrient Estimating Nutrient RequirementsRequirements
however, this can sometimes be however, this can sometimes be misleading, especially if dose/levels are misleading, especially if dose/levels are widely distributed (e.g., 0, 100, 200, 300, widely distributed (e.g., 0, 100, 200, 300, 400, 500 mg/kg diet vs. 200, 250, 300, 350, 400, 500 mg/kg diet vs. 200, 250, 300, 350, 400, 450 mg/kg diet)400, 450 mg/kg diet)
best method: broken-line analysisbest method: broken-line analysis also known as spline interpolation, fits a also known as spline interpolation, fits a
series of linear regression to determine series of linear regression to determine exact point of inflection of growth curveexact point of inflection of growth curve