aquaculture in the united states of america: present …. 6. united states shellfish value trend...
TRANSCRIPT

7
Aquaculture in the United States of America: Present Status and Future Opportunities
Paul G. OLIN*
水研センター研報,第35号,7-13,平成24年Bull. Fish. Res. Agen. No. 35, 7-13, 2012
2011年8月22日受理(Received on August 22, 2011)* University of California Sea Grant Extension Program, U.C. San Diego Scripps Institution of Oceanography, San Diego, California 92093 USA [email protected]
Abstract:This represents a review of the status and trends in aquaculture development in the United States. The paper covers current levels of American production and species diversity, production trends over the last decade, available resources and governmental sup-port, and projections for future industry growth and development. Total aquaculture production in the United States of 496,907 metric tonnes in 2008 gener-ated US$924 million. The aquaculture industry grew between 1998 and 2008, increasing 12 percent in tonnage and 19 percent in value. This increase resulted entirely from the shellfish sector, where production increased 65 percent from 127,059 to 209,775 tonnes, with a cor-responding 186 percent increase in value from US$113 to US$323 million. In contrast, the finfish sector declined 9 percent in both tonnage and value with 2008 production of 287,132 tonnes worth US$601 million. The increase in shellfish production was achieved primarily through additional production of Pacific and Eastern oysters, hard clams, manila clams and red swamp crayfish. While still the dominant species, the U.S. channel catfish industry has experienced strong competition as a result of significant increases in imports of basa and tra from Southeast Asia and has declined in recent years. In 2008, American catfish growers produced 201,000 metric tonnes of fish valued at US$389 million. FAO has projected the need for an additional 40 million metric tonnes of seafood by 2030 to meet anticipated increases in global demand. There is potential for significant increases in production in the United States. The NOAA Aquaculture Program within the National Marine Fisheries Service released a Ten Year Plan for Marine Aquaculture in 2007, which identified opportunities for potential growth in the sector. While not specific targets, esti-mates are that domestic aquaculture production has the potential to increase in value from US$1 billion to more than US$3 billion by 2025. This additional production would be com-prised of 760,000 tons of finfish, of which 590,000 tons would be marine finfish, 47,000 tons of crustaceans, and 245,000 tonnes of molluscs. Future significant growth in the American aquaculture industry will likely follow the successful model demonstrated by the Atlantic salmon industry in Canada with new tech-nologies enabling net-pen culture to move further offshore. There are ample areas for this expansion and pilot projects in the U.S. have demonstrated the viability of this approach. However, in some regions there is considerable opposition and whether a significant indus-try sector develops will require the establishment of a regulatory regime that insures envi-ronmental protection while enabling the economic viability of aquaculture ventures.
Key Words:aquaculture, United States, shellfish, finfish, production
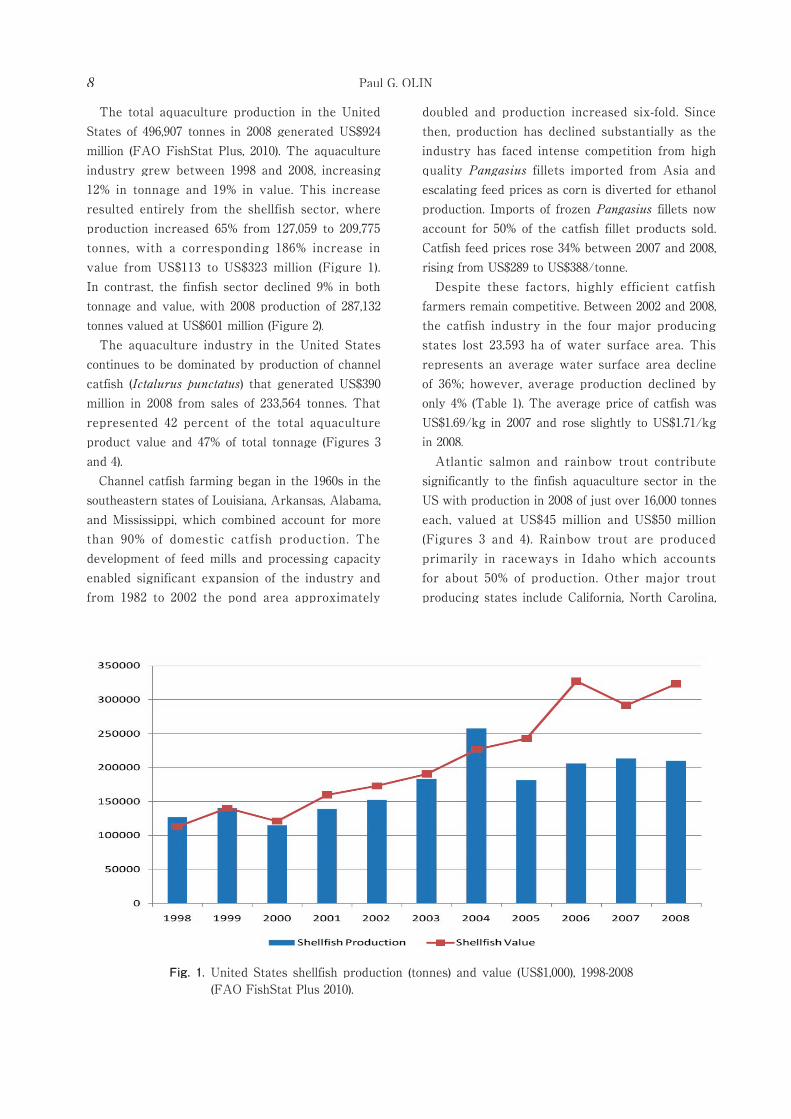
Fig. 1. United States shellfish production (tonnes) and value (US$1,000), 1998-2008 (FAO FishStat Plus 2010).
Paul G. OLIN8
The total aquaculture production in the United States of 496,907 tonnes in 2008 generated US$924 million (FAO FishStat Plus, 2010). The aquaculture industry grew between 1998 and 2008, increasing 12% in tonnage and 19% in value. This increase resulted entirely from the shellfish sector, where production increased 65% from 127,059 to 209,775 tonnes, with a corresponding 186% increase in value from US$113 to US$323 million (Figure 1). In contrast, the finfish sector declined 9% in both tonnage and value, with 2008 production of 287,132 tonnes valued at US$601 million (Figure 2). The aquaculture industry in the United States continues to be dominated by production of channel catfish (Ictalurus punctatus) that generated US$390 million in 2008 from sales of 233,564 tonnes. That represented 42 percent of the total aquaculture product value and 47% of total tonnage (Figures 3 and 4). Channel catfish farming began in the 1960s in the southeastern states of Louisiana, Arkansas, Alabama, and Mississippi, which combined account for more than 90% of domestic catfish production. The development of feed mills and processing capacity enabled significant expansion of the industry and from 1982 to 2002 the pond area approximately
doubled and production increased six-fold. Since then, production has declined substantially as the industry has faced intense competition from high quality Pangasius fillets imported from Asia and escalating feed prices as corn is diverted for ethanol production. Imports of frozen Pangasius fillets now account for 50% of the catfish fillet products sold. Catfish feed prices rose 34% between 2007 and 2008, rising from US$289 to US$388/tonne. Despite these factors, highly efficient catfish farmers remain competitive. Between 2002 and 2008, the catfish industry in the four major producing states lost 23,593 ha of water surface area. This represents an average water surface area decline of 36%; however, average production declined by only 4% (Table 1). The average price of catfish was US$1.69/kg in 2007 and rose slightly to US$1.71/kg in 2008. Atlantic salmon and rainbow trout contribute significantly to the finfish aquaculture sector in the US with production in 2008 of just over 16,000 tonnes each, valued at US$45 million and US$50 million (Figures 3 and 4). Rainbow trout are produced primarily in raceways in Idaho which accounts for about 50% of production. Other major trout producing states include California, North Carolina,

Fig. 2. United States finfish production (tonnes) and value (US$1,000), 1998-2008 (FAO FishStat Plus 2010).
Fig. 3. United States Aquaculture Market Values in 2008, in US$1,000 (FAO FishStat Plus, 2010).
Aquaculture in USA: Present Status and Future Opportunities 9

Fig. 4. United States Aquaculture Production 2008 in tonnes (FAO FishStat Plus, 2010).
Table 1. Catfish farm water surface area decline and production by major states
Paul G. OLIN10
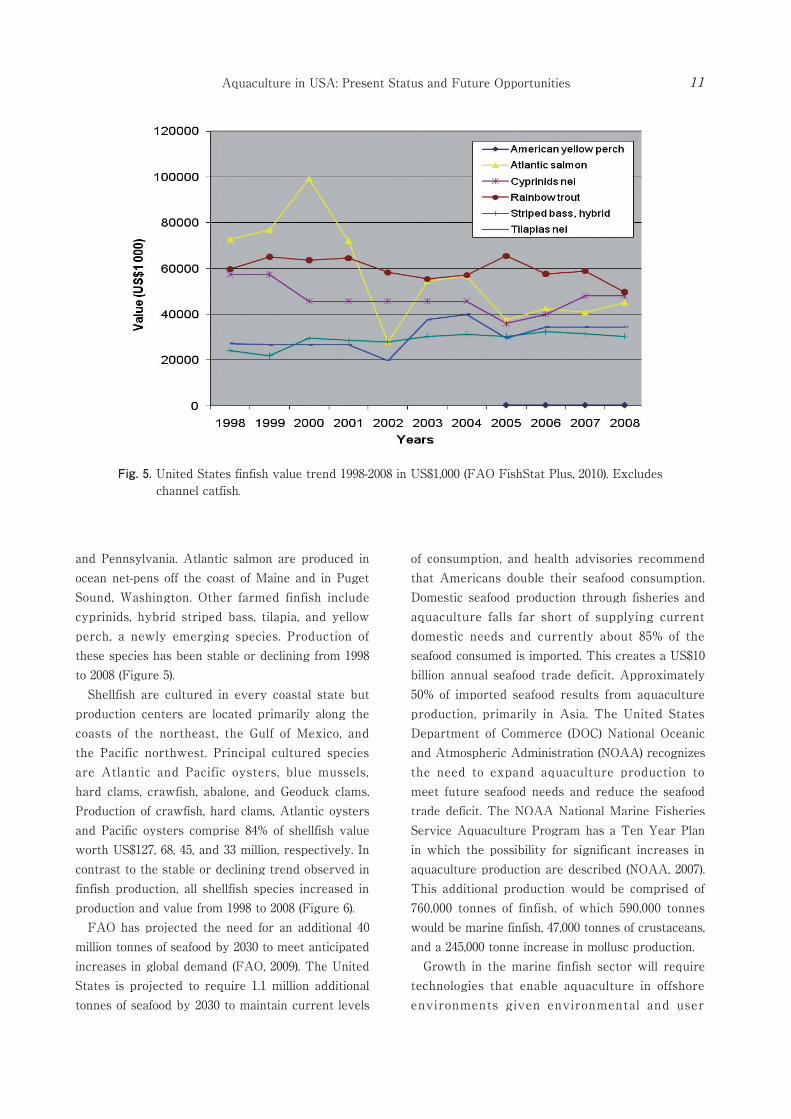
Fig. 5. United States finfish value trend 1998-2008 in US$1,000 (FAO FishStat Plus, 2010). Excludes channel catfish.
Aquaculture in USA: Present Status and Future Opportunities 11
and Pennsylvania. Atlantic salmon are produced in ocean net-pens off the coast of Maine and in Puget Sound, Washington. Other farmed finfish include cyprinids, hybrid striped bass, tilapia, and yellow perch, a newly emerging species. Production of these species has been stable or declining from 1998 to 2008 (Figure 5). Shellfish are cultured in every coastal state but production centers are located primarily along the coasts of the northeast, the Gulf of Mexico, and the Pacific northwest. Principal cultured species are Atlantic and Pacific oysters, blue mussels, hard clams, crawfish, abalone, and Geoduck clams. Production of crawfish, hard clams, Atlantic oysters and Pacific oysters comprise 84% of shellfish value worth US$127, 68, 45, and 33 million, respectively. In contrast to the stable or declining trend observed in finfish production, all shellfish species increased in production and value from 1998 to 2008 (Figure 6). FAO has projected the need for an additional 40 million tonnes of seafood by 2030 to meet anticipated increases in global demand (FAO, 2009). The United States is projected to require 1.1 million additional tonnes of seafood by 2030 to maintain current levels
of consumption, and health advisories recommend that Americans double their seafood consumption. Domestic seafood production through fisheries and aquaculture falls far short of supplying current domestic needs and currently about 85% of the seafood consumed is imported. This creates a US$10 billion annual seafood trade deficit. Approximately 50% of imported seafood results from aquaculture production, primarily in Asia. The United States Department of Commerce (DOC) National Oceanic and Atmospheric Administration (NOAA) recognizes the need to expand aquaculture production to meet future seafood needs and reduce the seafood trade deficit. The NOAA National Marine Fisheries Service Aquaculture Program has a Ten Year Plan in which the possibility for significant increases in aquaculture production are described (NOAA, 2007). This additional production would be comprised of 760,000 tonnes of finfish, of which 590,000 tonnes would be marine finfish, 47,000 tonnes of crustaceans, and a 245,000 tonne increase in mollusc production. Growth in the marine finfish sector will require technologies that enable aquaculture in offshore environments given environmental and user
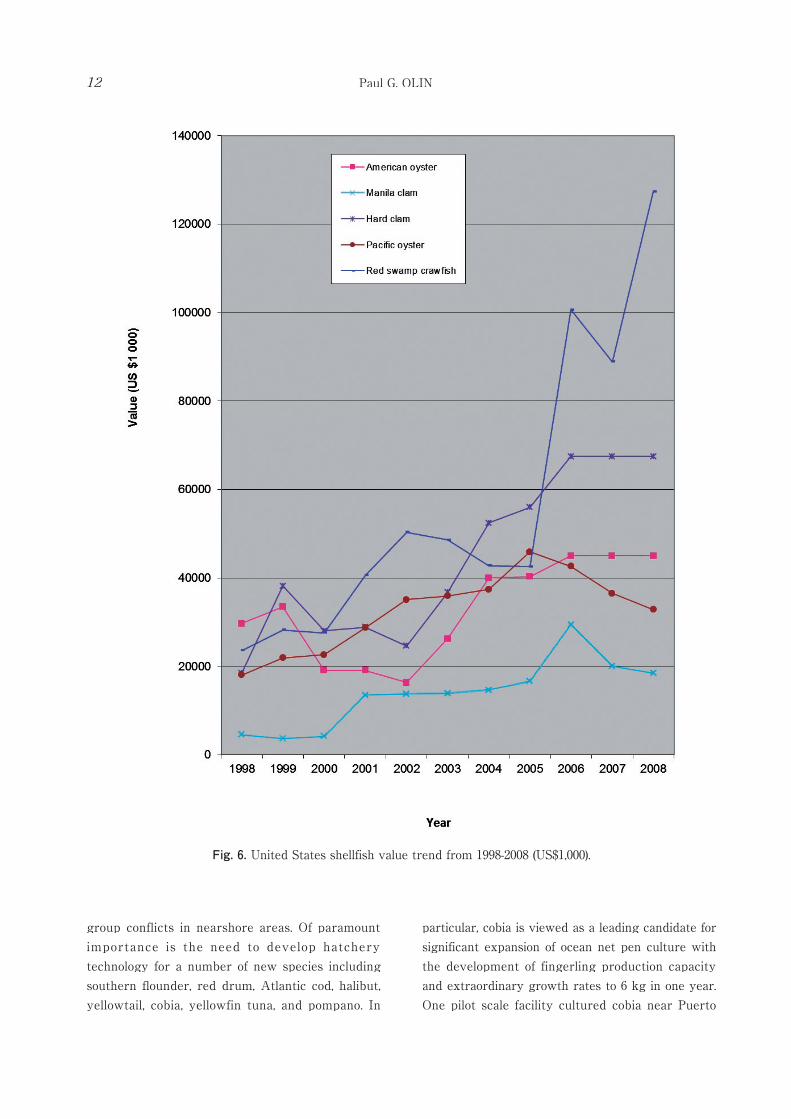
Fig. 6. United States shellfish value trend from 1998-2008 (US$1,000).
Paul G. OLIN12
group conflicts in nearshore areas. Of paramount importance is the need to develop hatchery technology for a number of new species including southern flounder, red drum, Atlantic cod, halibut, yellowtail, cobia, yellowfin tuna, and pompano. In
particular, cobia is viewed as a leading candidate for significant expansion of ocean net pen culture with the development of fingerling production capacity and extraordinary growth rates to 6 kg in one year. One pilot scale facility cultured cobia near Puerto

Aquaculture in USA: Present Status and Future Opportunities 13
Rico, and two facilities are using ocean net pens in Hawaiian waters, raising Hawaiian amberjack and moi. The University of New Hampshire’s Atlantic Marine Aquaculture Center has piloted culture of Atlantic cod, halibut, and flounder. There is also a project supported by the Hubbs SeaWorld Research Institute to develop an ocean cage production operation in Mexico raising Pacific yellowtail, striped bass, and white seabass. To date, there has been no significant private investment in offshore aquaculture, largely because of regulatory uncertainties and opposition by groups fearful of adverse environmental impacts, competition, and user group conflicts. The DOC and NOAA recognize this and in February 2011 released draft aquaculture policies designed to provide guidance for the development of a comprehensive regulatory framework to enable aquaculture development in the U.S. The policy has eight priority policy statements that are designed to “Create a business climate and technological base for industry to develop sustainable aquaculture” (DOC, 2011). The companion policy of NOAA contains nine policy statements to “Enable sustainable aquaculture that provides domestic jobs, products, and services and that is in harmony with healthy, productive, and resilient marine ecosystems, compatible with other uses of the marine environment, and consistent with the National Policy for the Stewardship of the Ocean, our Coasts, and the Great Lakes” (NOAA, 2011). These are promising policies that provide a foundation for the development of a regulatory framework for aquaculture. Pilot projects in the U.S. have demonstrated the viability of net pen farming of marine finfish. However, in some regions there is considerable opposition and whether a
significant industry sector develops will depend on the establishment of a regulatory regime that insures environmental protection while enabling the economic viability of aquaculture ventures.
References
DOC., 2011: Department of Commerce Draft Aquaculture Policy. http://www.nmfs.noaa.gov/aquaculture/docs/docdraftaqpolicy.pdf
FAO (Food and Agriculture Organization of the United Nations)., 2009: The State of World Fisheries and Aquaculture 2008. FAO Fisheries and Aquaculture Department, Food and Agriculture Organization of the United Nations, Rome, Italy
FAO FishStat Plus, 2010: Fisheries and Aquaculture Information and Statistics Service, 2009. Aquaculture production 1950-2008. - Universal software for fishery statistical time series. Food and Agriculture Organization of the United Nations, Available at: www.fao.org/fishery/statistics/software/fishstat/en
NOAA., 2007: NOAA 10-Year Plan for Marine Aquaculture. U.S. Department of Commerce, N a t i o n a l O c e a n i c a n d A tm o s p h e r i c Administration, National Marine Fisheries Service, Available at: http://aquaculture.noaa.gov/pdf/finalnoaa10yrrweb.pdf
NOAA., 2011: Draft Aquaculture Policy. http://www.nmfs.noaa.gov/aquaculture/docs/noaadraftaqpolicy.pdf
USDA-NASS., 2009. http://usda.mannlib.cornell.edu/MannUsda/viewDocumentInfo.do?documentID=1016