april 9, 2015
TRANSCRIPT
Graphing Quadratic FunctionsToday:
NotebooksWarm-Up
Review: Vertex and Axis of Symmetry:The effects of a, b, & c on the parabola
Graphing Various Quadratic FunctionsClass Work: 4.1 (Front and back)
Graphing Quadratic Functions
x = 0
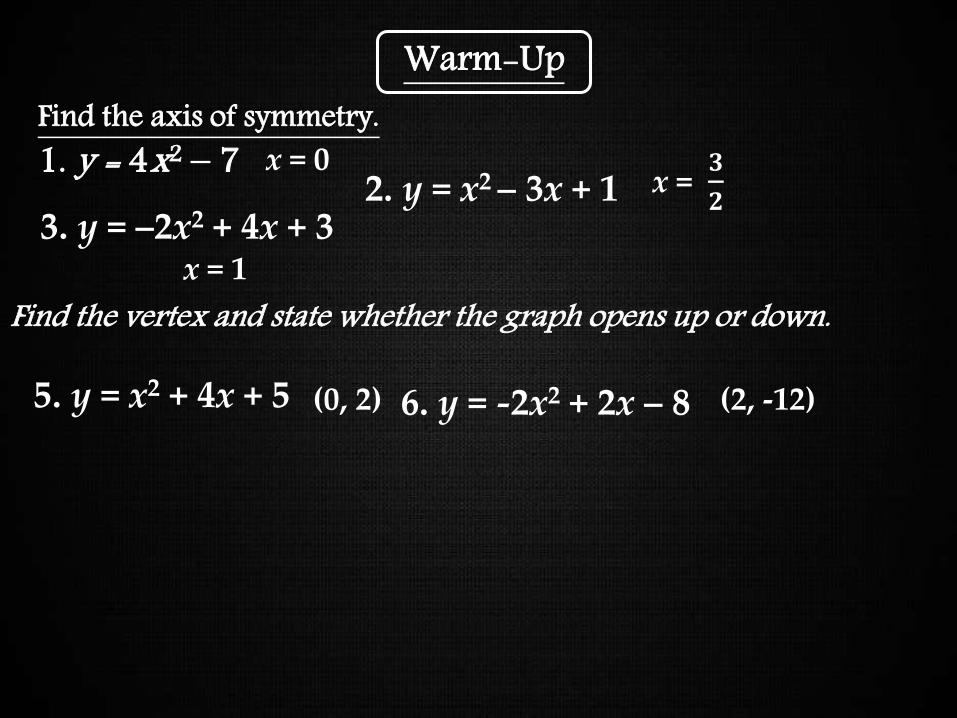
x = 1
(0, 2)
1. y = 4x2 – 72. y = x2 – 3x + 1
Find the axis of symmetry.
3. y = –2x2 + 4x + 3
(2, -12) 5. y = x2 + 4x + 5 6. y = -2x2 + 2x – 8
Find the vertex and state whether the graph opens up or down.
x = 𝟑
𝟐
Warm-Up
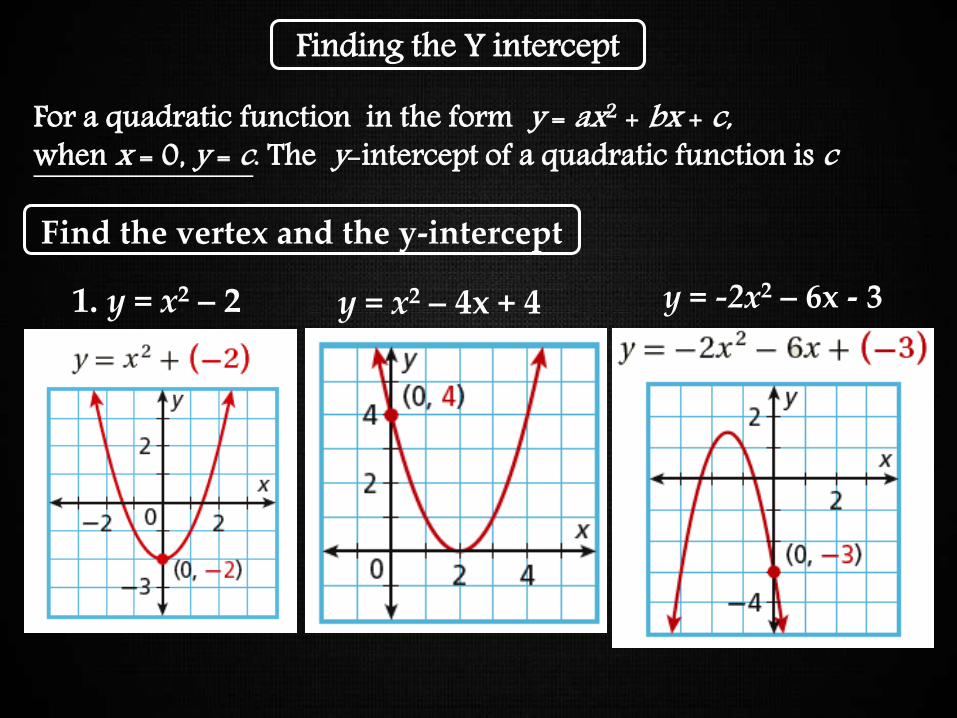
Graphing Quadratic FunctionsFor a quadratic function in the form y = ax2 + bx + c, when x = 0, y = c. The y-intercept of a quadratic function is c
Finding the Y intercept
Find the vertex and the y-intercept
1. y = x2 – 2 y = x2 – 4x + 4 y = -2x2 – 6x - 3
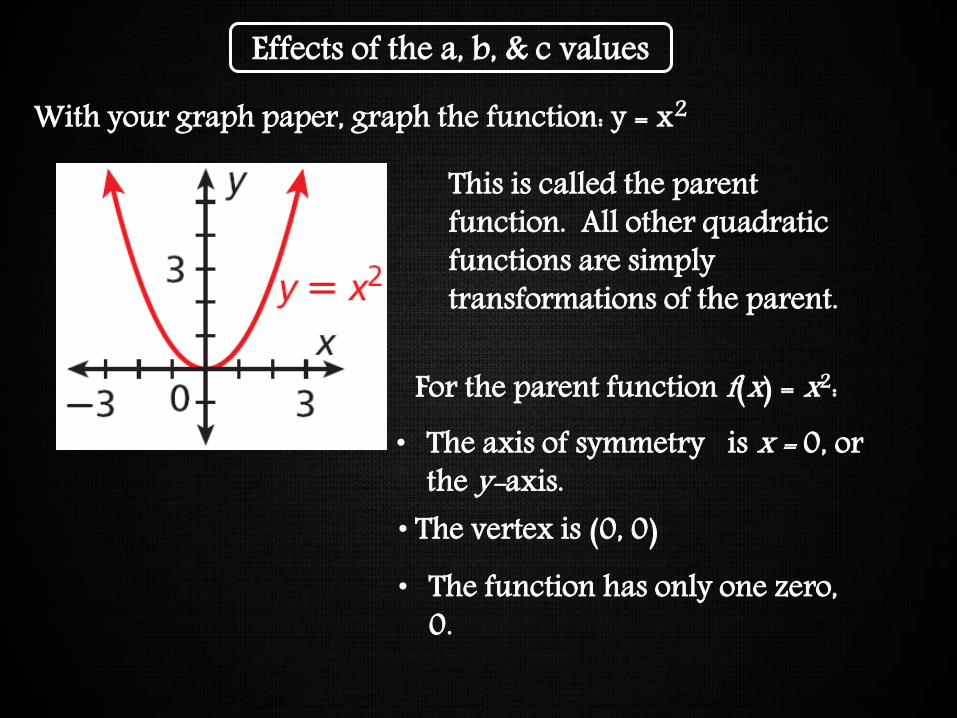
Graphing Quadratic FunctionsEffects of the a, b, & c values
With your graph paper, graph the function: y = x2
This is called the parent function. All other quadratic functions are simply transformations of the parent.
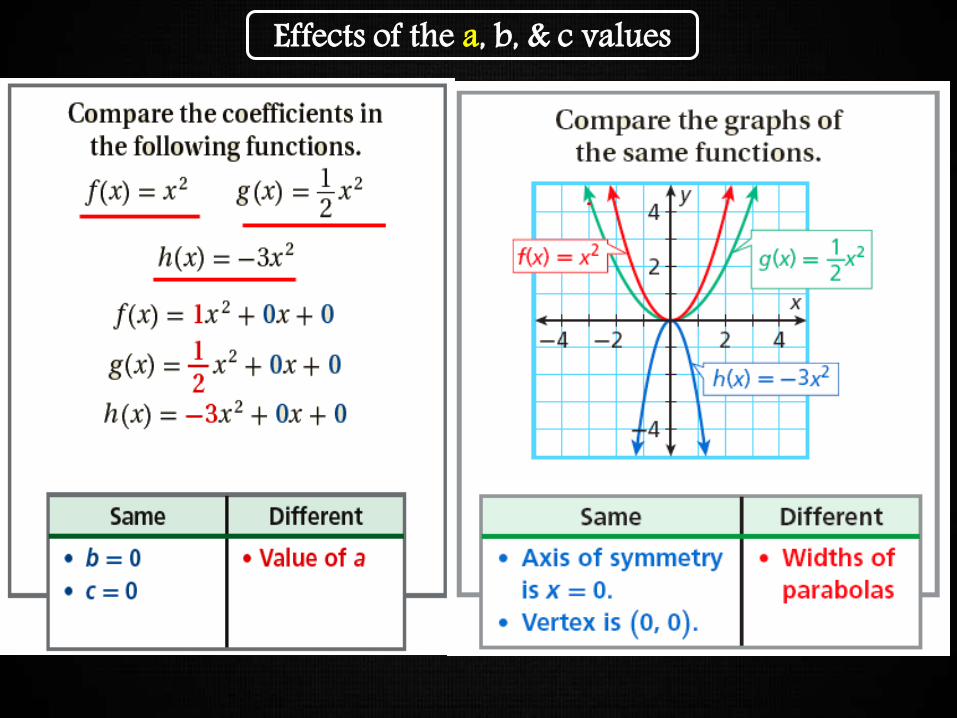
For the parent function f(x) = x2:• The axis of symmetry is x = 0, or
the y-axis.• The vertex is (0, 0)• The function has only one zero,
0.
Graphing Quadratic FunctionsEffects of the a, b, & c values

Graphing Quadratic Functions
The value of a in a quadratic function determines not only the direction a parabola opens, but also the width of the parabola.
Effects of the a, b, & c values
Graphing Quadratic FunctionsEffects of the a, b, & c values
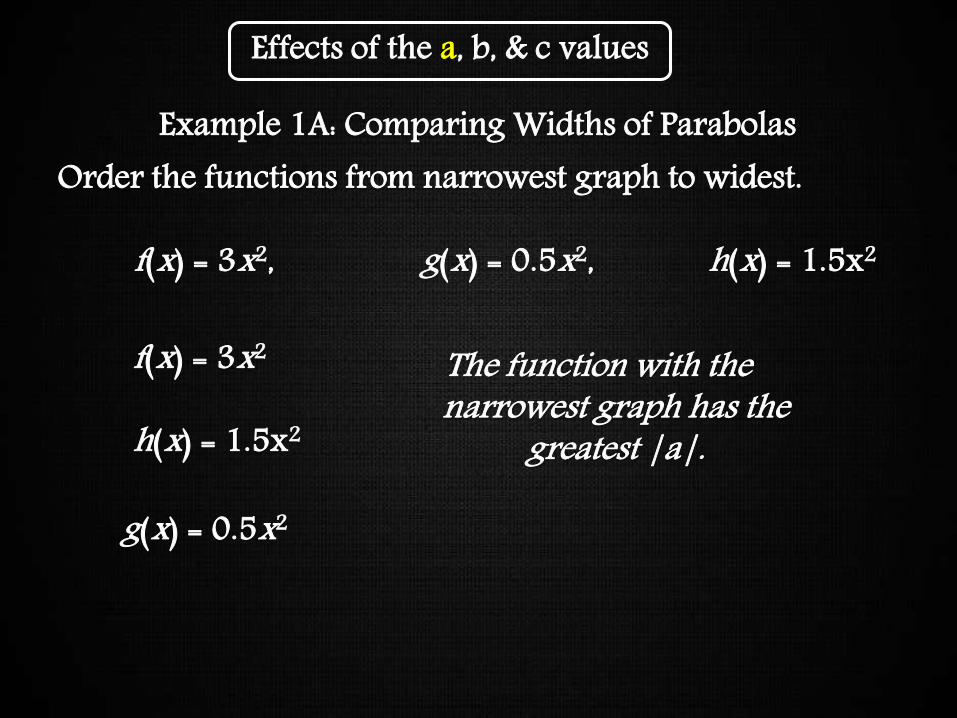
Example 1A: Comparing Widths of Parabolas Order the functions from narrowest graph to widest.
f(x) = 3x2, g(x) = 0.5x2, h(x) = 1.5x2
f(x) = 3x2
h(x) = 1.5x2
g(x) = 0.5x2
The function with the narrowest graph has the
greatest |a|.

Graphing Quadratic FunctionsEffects of the a, b, & c values

Graphing Quadratic FunctionsEffects of the a, b, & c values
The value of 'c' in a quadratic function determines not only the value of the y-intercept but also a vertical translation of the graph of f(x) = ax2 up or down the y-axis.
Tomorrow we look at how the 'b' value affects the parabola
Graphing Quadratic FunctionsComparing Graphs of Quadratic Functions
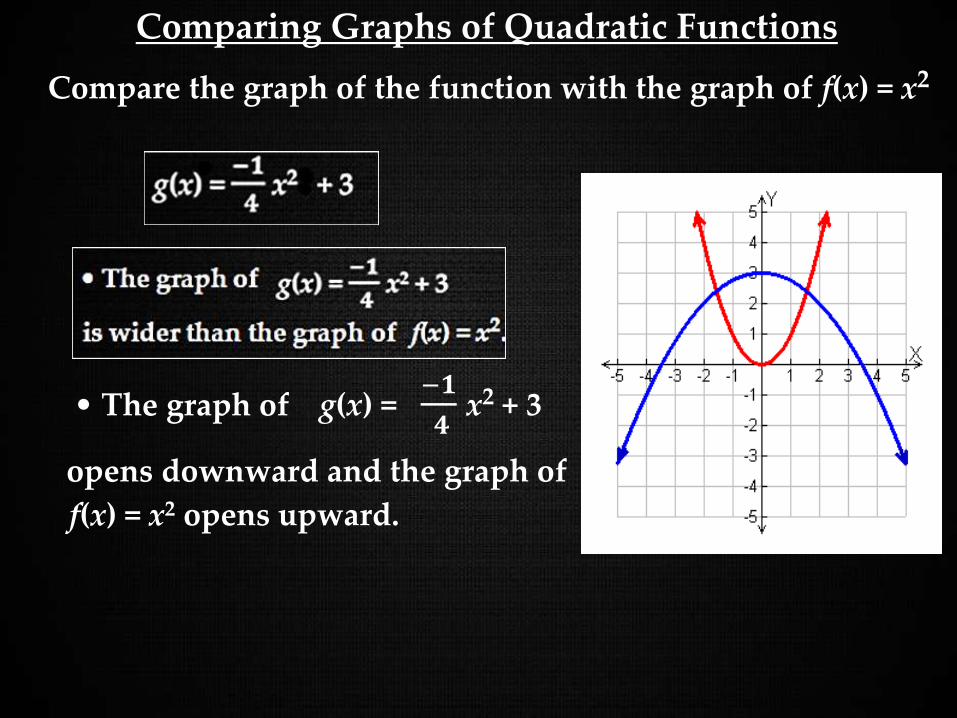
Compare the graph of the function with the graph of f(x) = x2
opens downward and the graph of
f(x) = x2 opens upward.
g(x) = −𝟏
𝟒x2 + 3• The graph of

Graphing Quadratic FunctionsCompare the graph of each the graph of f(x) = x2.g(x) = –x2 – 4
• The graph of g(x) = –x2 – 4 opens downward and the graph of f(x) = x2opens upward.
The vertex of g(x) = –x2 – 4 f(x) = x2 is (0, 0).
is translated 4 units down to (0, –4).
• The vertex of • The axis of symmetry is the same.

Graphing Quadratic Functions
SOLUTIONIdentify the coefficients of the function. STEP 1
STEP 2 Find the AOS and the vertex. Calculate the x - coordinate.
Then find the y - coordinate of the vertex.
(–2) 2(1)= = 1x = b
2a –
y = 12 – 2 • 1 + 1 = – 2
The coefficients are a = 1, b = – 2, and c = – 1. Because a > 0, the parabola opens up.
Graph a function of the form y = ax2 + bx + c
y = x2 – 2x – 1Label the axis of symmetry. and the vertexGraph the function

Graphing Quadratic FunctionsGraph a function of the form y = ax2 + bx + c
SOLUTIONIdentify the coefficients of the function. STEP 1
STEP 2 Find the AOS and the vertex. Calculate the x - coordinate.x = b
2a =(– 8) 2(2)– –
Then find the y - coordinate of the vertex.y = 2(2)2 – 8(2) + 6 = – 2
So, the vertex is (2, – 2). Plot this point.
The coefficients are a = 2, b = – 8, and c = 6. Because a > 0, the parabola opens up.
= 2
y = 2x2 – 8x + 6.Graph

Graphing Quadratic FunctionsSTEP 3 Draw the axis of symmetrySTEP 4 Identify the y - intercept c,
STEP 5 Find the roots by using one of the solution methods, (factoring, for now)
(x - 3)(2x - 2); the solutions are:
Plot the point (0, 6). Then reflect this point overthe axis of symmetry to plot another point, (4, 6).
Plot the solutionsx = 3, x = 1STEP 6 Draw a parabola through
the plotted points.
y = 2x2 – 8x + 6. factor how?y = 2x2 – 6x - 2x + 6 =
x = 2.
Graphing Quadratic Functions
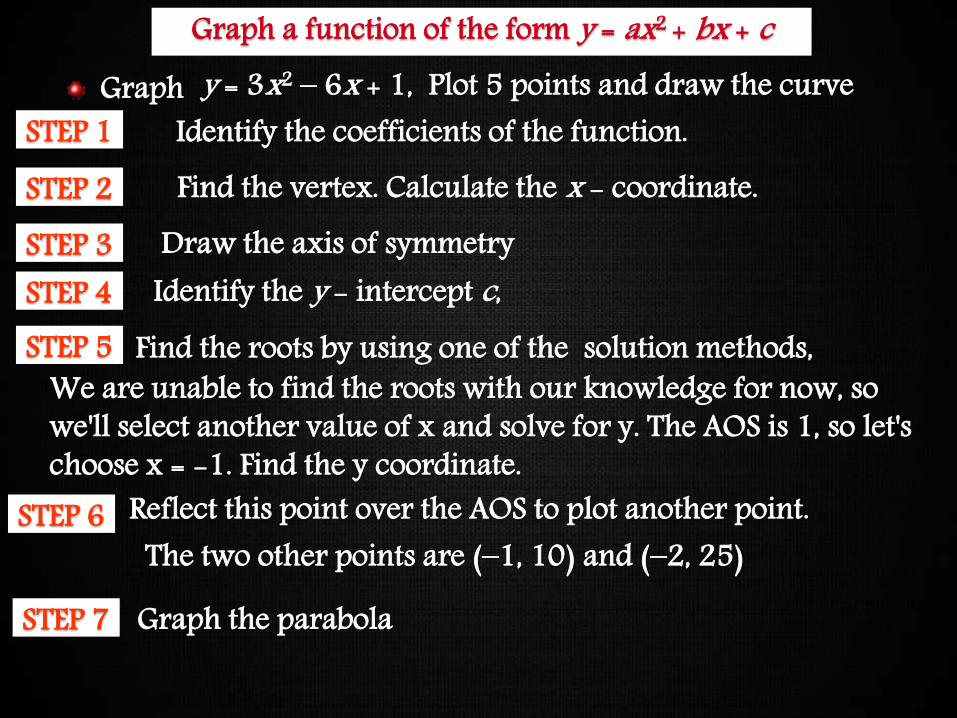
STEP 1 Identify the coefficients of the function. STEP 2 Find the vertex. Calculate the x - coordinate.STEP 3 Draw the axis of symmetrySTEP 4 Identify the y - intercept c, STEP 5 Find the roots by using one of the solution methods,
We are unable to find the roots with our knowledge for now, so we'll select another value of x and solve for y. The AOS is 1, so let's choose x = -1. Find the y coordinate.
The two other points are (–1, 10) and (–2, 25) STEP 6 Reflect this point over the AOS to plot another point.
STEP 7 Graph the parabola
Graph a function of the form y = ax2 + bx + cy = 3x2 – 6x + 1, Plot 5 points and draw the curveGraph

Graphing Quadratic Functions
x = 1
(–1, 10)
(0, 1)
(1, –2)
(–2, 25)
Graphing Quadratic FunctionsGraph a function of the form y = ax2 + bx + c
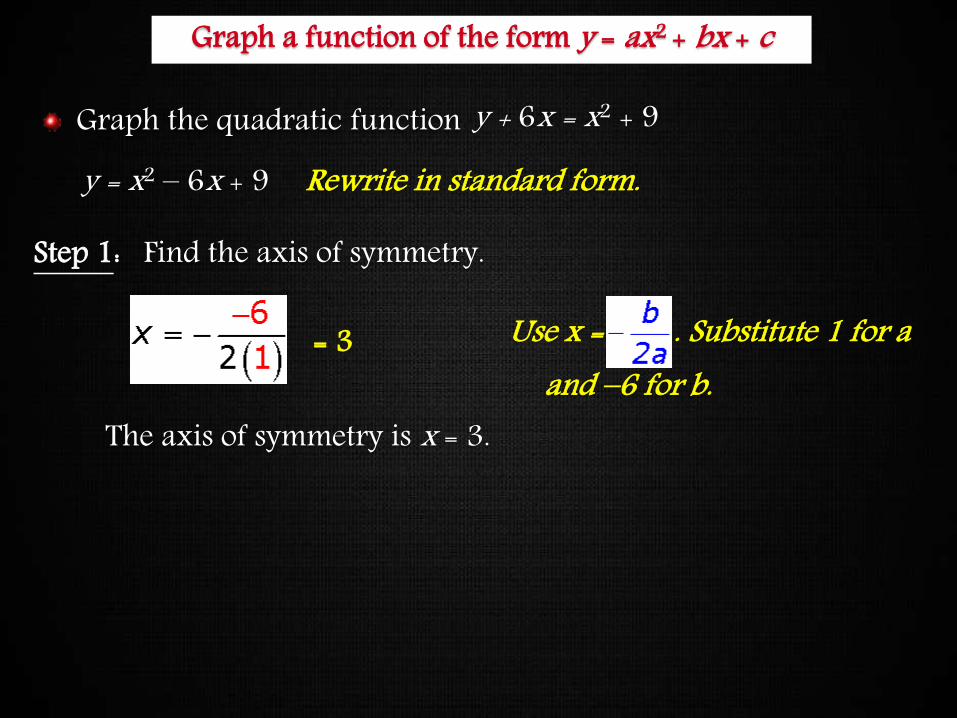
Step 1: Find the axis of symmetry.
Use x = . Substitute 1 for a and –6 for b.
The axis of symmetry is x = 3.
= 3
y = x2 – 6x + 9 Rewrite in standard form.y + 6x = x2 + 9Graph the quadratic function
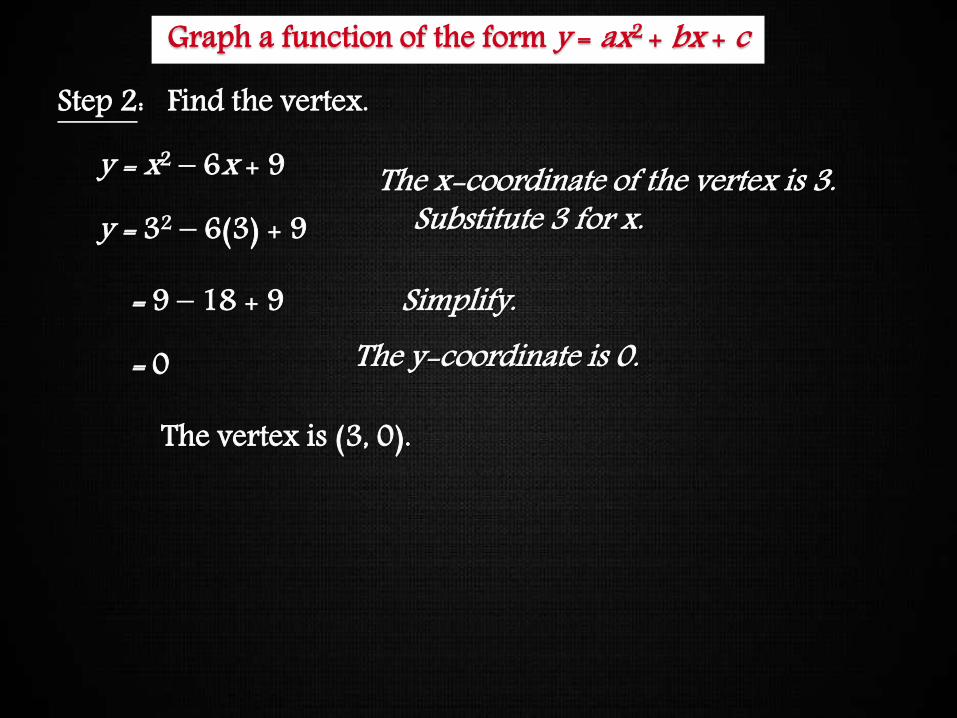
Graphing Quadratic FunctionsStep 2: Find the vertex.
Simplify.= 9 – 18 + 9
= 0
The vertex is (3, 0).
The x-coordinate of the vertex is 3. Substitute 3 for x.
The y-coordinate is 0.
y = x2 – 6x + 9
y = 32 – 6(3) + 9
Graph a function of the form y = ax2 + bx + c

Graphing Quadratic Functions
Step 3: Find the y-intercept.y = x2 – 6x + 9
y = x2 – 6x + 9
The y-intercept is 9; the graph passes through (0, 9).
Identify c.
Graph a function of the form y = ax2 + bx + c
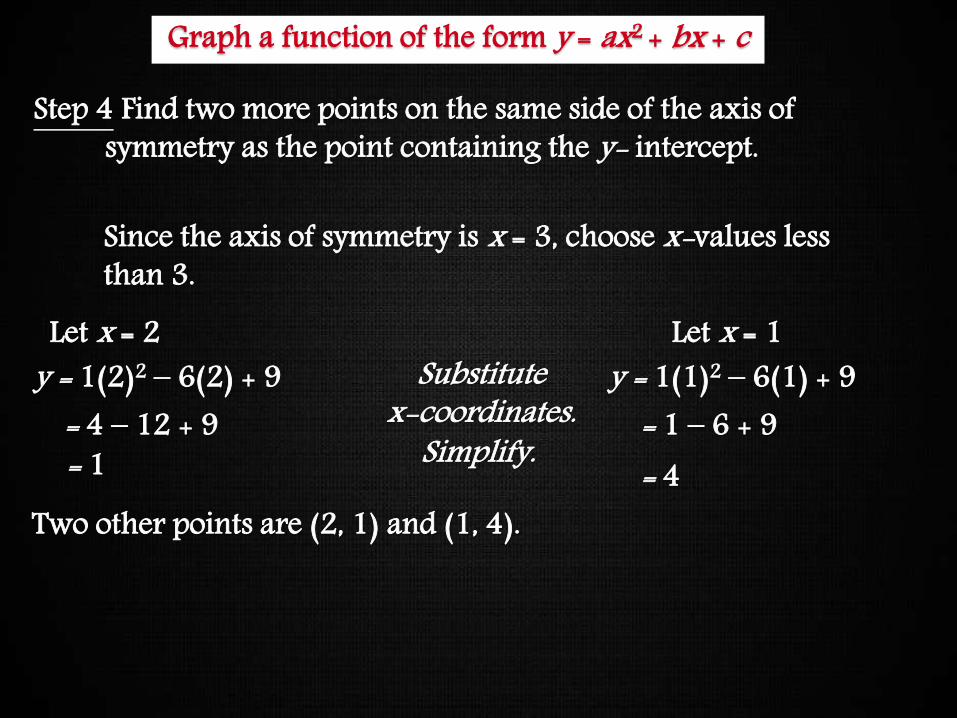
Graphing Quadratic FunctionsStep 4 Find two more points on the same side of the axis of
symmetry as the point containing the y- intercept.
Since the axis of symmetry is x = 3, choose x-values less than 3.
Let x = 2y = 1(2)2 – 6(2) + 9
= 4 – 12 + 9= 1
Let x = 1 y = 1(1)2 – 6(1) + 9
= 1 – 6 + 9= 4
Substitutex-coordinates.
Simplify.
Two other points are (2, 1) and (1, 4).
Graph a function of the form y = ax2 + bx + c
Graphing Quadratic Functions
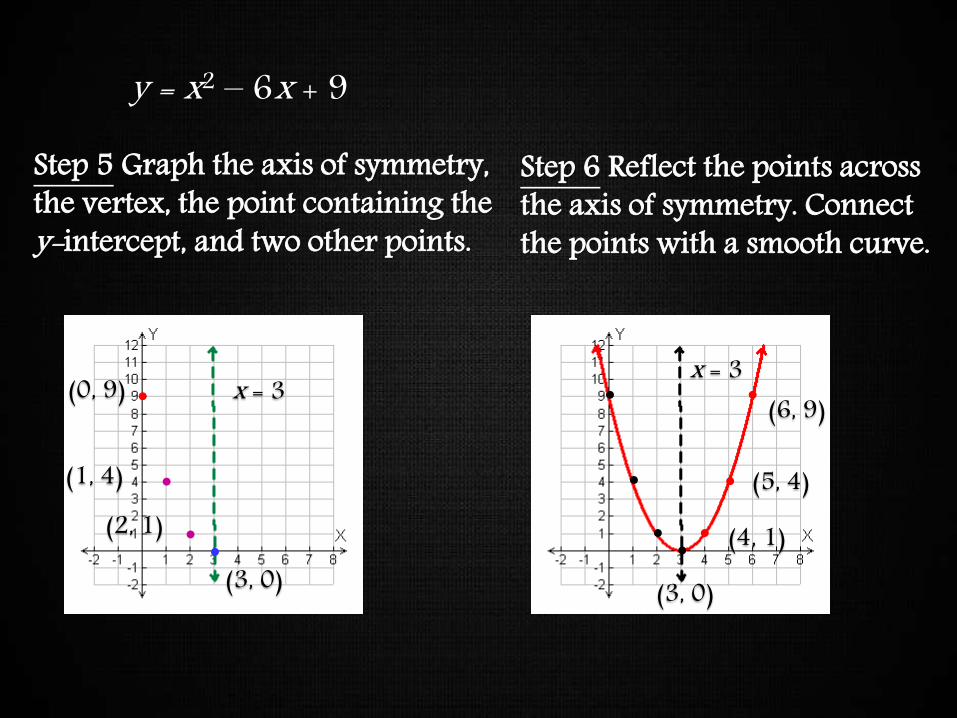
Step 5 Graph the axis of symmetry, the vertex, the point containing the y-intercept, and two other points.
Step 6 Reflect the points across the axis of symmetry. Connect the points with a smooth curve.
y = x2 – 6x + 9
x = 3
(3, 0)
(0, 9)
(2, 1)(1, 4)
(6, 9)
(5, 4)
(4, 1)
x = 3
(3, 0)

Graphing Quadratic Functions
Class Work 4.1
Front & Back
Show all work for credit

Graphing Quadratic Functions