april 28, 2004 mr. subhash pal - texas commission on ... · april 28, 2004 mr. subhash pal ... 44%...
TRANSCRIPT


April 28, 2004 Mr. Subhash Pal Texas Commission on Environmental Quality Page 2 Selected soil and groundwater samples were analyzed by an on-site mobile laboratory (ESN) which was mobilized to the site support the field activities for a limited time. (Note: The results from all soil analysis performed by the on-site mobile laboratory were reported on a wet weight basis.) Summary of Geoprobe Field Activities Twenty-one DPT borings were performed to a maximum depth of thirty-five feet below ground surface (bgs) during the period from October 22 through October 29, 2003. Figure 1 shows the approximate location of each of these borings. The locations of the borings were selected jointly by Shaw and TCEQ representatives to assess the whereabouts of potential discharge areas of the contaminant of interest, PCE. Potential discharge areas investigated included:
• Area near the surface water storm drainage grate at the back (north side) of the dry cleaning facility, represented by the GP-4 location which discharges into the roadside ditch along 11600 Jones Road; the GP-3 location represents grassy area just off of the paved area where the drainage grate is located.
• Roadside ditch area along 11600 Jones Road which receives surface water discharge in
proximity of the Former Bell Dry Cleaner site, represented by locations GP-12 and GP-13. • Area associated with the septic tank at 11600 Jones Road, represented by GP-14 and GP-15
locations. • Secondary discharges along a sewer discharge pipe that conveyed wastewater from the dry
cleaner to the septic tank system, represented by locations GP-1, GP-2, and GP-16. • Area associated with the septic field serving 11600 Jones Road, represented by locations
GP-18 through GP-20. • Area surrounding the 11600 Jones Road building foundation, represented by locations GP-5
through GP-11. Concrete cores were cut by a coring company (Cores ETC) at all DPT locations in paved areas. Initially a tractor mounted DPT rig was used to install the borings (GP6, GP18, and GP19). However, significant resistance to penetration was encountered at the interface with a firm, hard clay containing calcareous nodules observed at approximately 20 to 28 feet bgs depth interval. A CME 45 drill rig with DPT capabilities beyond those of the trailer mounted unit was mobilized to the site and used to complete borings GP1, GP2, GP3, GP4, GP5, GP7, GP8, GP9, GP10, GP11, GP12, GP13, GP14, GP16, GP17, and GP20. The tractor-mounted rig was then remobilized to to complete DPT borings GP15 and GP21 because access to these locations was not possible with the CME 45 rig mounted DPT unit.

April 28, 2004 Mr. Subhash Pal Texas Commission on Environmental Quality Page 3 The soil sampling interval selection strategy was based upon previous knowledge of the subsurface lithology at the site obtained through the previous investigation work based primarily on interpretations from Cone Penetrometer pushes. The first sample interval targeted shallow soil below the surface in the 1 to 3 foot depth bgs zone. A second zone of interest was the interval just above a clay rich zone interbedded with calcareous nodules (16 to 19 foot depth bgs). The third zone of interest was near the capillary zone (top) of first water bearing zone that ranged in depth generally from 19 to 30 feet bgs. A final (fourth) zone of interest was taken at the final total depth of the boring, generally between 30 to 35 feet bgs. As required by the Field Sampling Plan (FSP), three Encore samples were collected from each targeted sample zone and sent to the EPA CLP laboratory for VOC analyses using method OLCO4.2. A sample aliquot from each interval was also collected in a 4 oz jar and submitted to the fixed-base lab for analyses of the moisture content of the soil. In addition, one sample aliquot was collected from each interval and field screened using the Color Tec method. For the period that the mobile laboratory was on site (October 22, 23, and 24), water samples collected from DPT borings were submitted to the on-site mobile laboratory for analysis using EPA Method 8260. At the completion of each DPT boring, slotted PVC pipe was placed into the borehole and a groundwater sample was collected and field screened using the Color Tec method. Summary of Analytical Results Soil The analytical results from the EPA CLP laboratory for PCE, TCE, cis-DCE, and VC for each of the DPT borings are tabulated in Table 1 and plotted on Figure 2. The analytical results from the EPA CLP laboratory show impacts to the soil in nine (GP3, GP4, GP5, GP6, GP7 ,GP8, GP13, GP16, and GP20) of the 21 DPT borings (presented in Figure 3). The following discussion will present the results for PCE and VC. PCE represents the primary composition of the product discharged by the former dry cleaner operations. Results of VC are discussed as this chemical is a third order degradation by-product of the PCE; its presence (or absence) provides an indication of how much mass of PCE may still be present in the shallow subsurface (e.g., a large mass quantity of VC relative to the mass of PCE observed would indicate that degradation of the PCE source has been substantially completed). Detections of PCE were observed in the shallow soil zone (1 to 2 feet) at DPT locations GP3, GP4, and GP16; trace levels were also observed at GP-1, GP-2, and GP-13 (presented in Figure 4). No detectable levels of VC were observed in samples collected from this zone. Detectable concentrations of PCE were also observed in the second soil zone of interest (16 to 19 feet). Specifically, PCE was detected in DPT locations GP-1 (trace), GP-3, GP-4, and GP-13 (presented in Figure 5). VC was detected in samples collected at DPT locations GP–3 (trace), GP-6, and GP-13 (Figure 6).

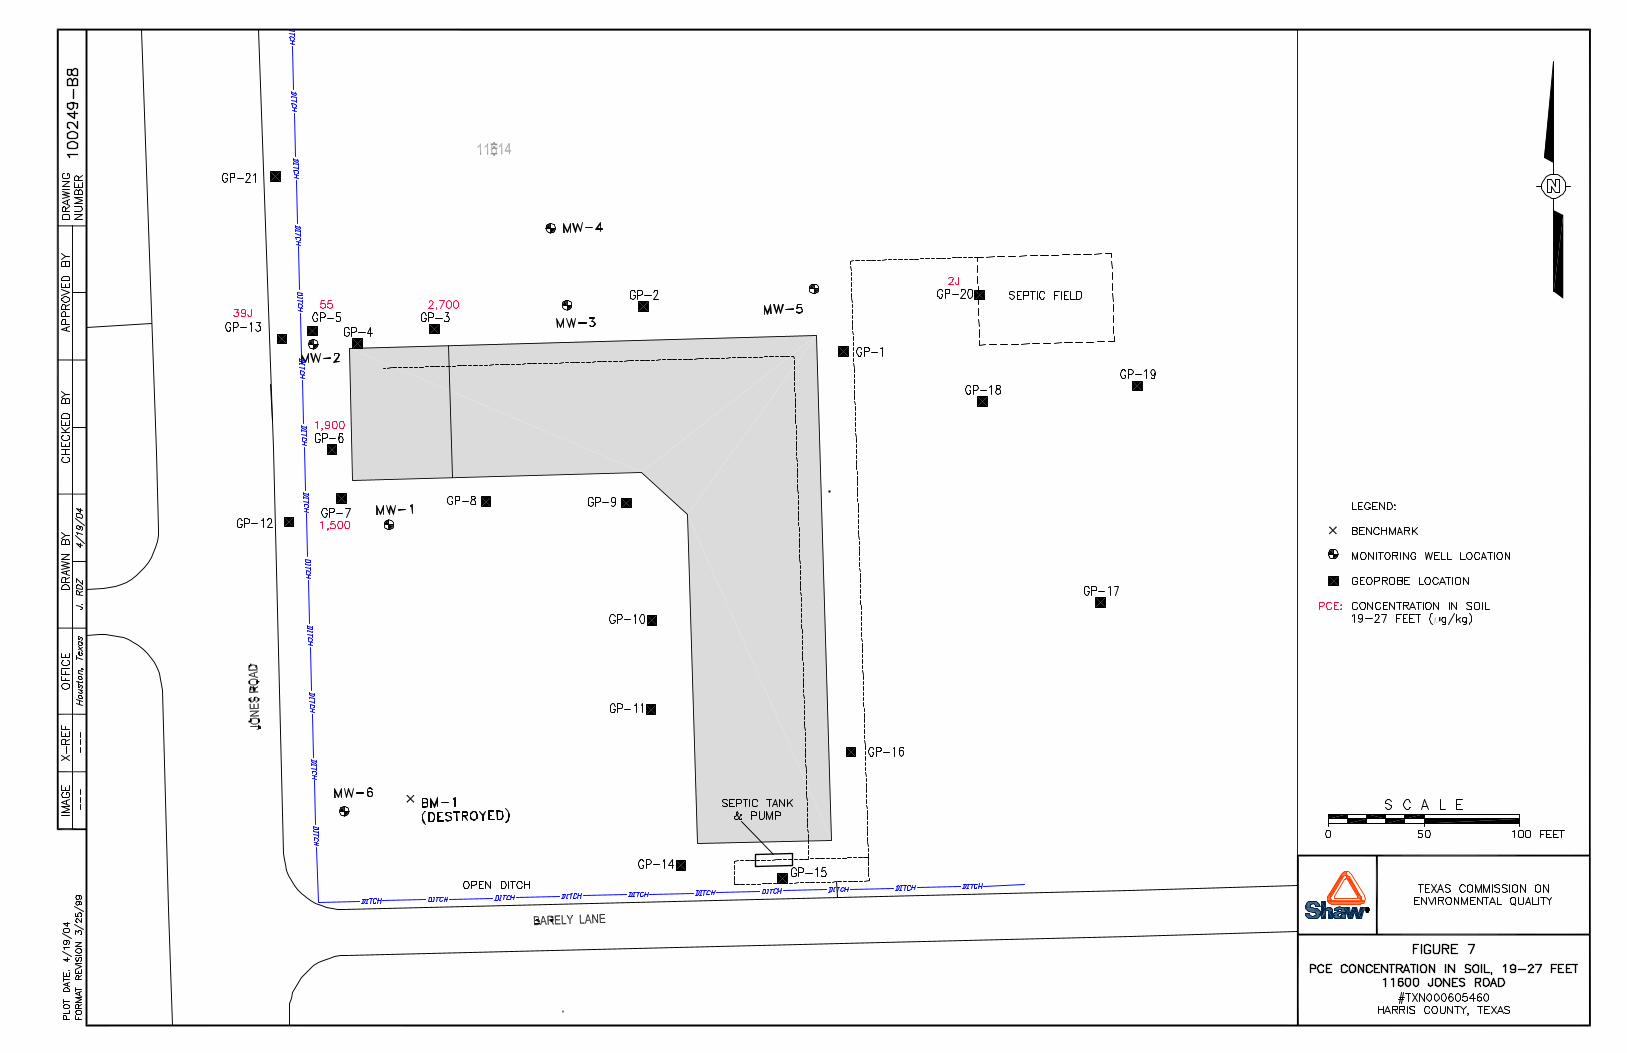
April 28, 2004 Mr. Subhash Pal Texas Commission on Environmental Quality Page 4 In the third soil zone (19–30 feet), detections of PCE were observed at DPT locations GP-3, GP-5, GP-6, GP-7, GP-13, and GP-20 in samples collected specifically from the 19 to 27 foot bgs depth (presented in Figure 7). VC was detected in samples collected at DPT locations GP-3, GP-5(trace), GP-6, GP-7, and GP-13 (Figure 8). In samples collected from the 27 to 30 foot bgs depth, PCE was detected again at GP-3 and GP-7, and also at locations GP-4, GP-8, and at trace levels at GP-1, GP-3, and GP-9 (Figure 9). VC was detected in a single sample collected from this same depth interval at DPT location GP-7. From the zone representing the 30 to 35 feet depth bgs (bottom of each DPT boring, respectively), PCE was detected at DPT borings GP-4, GP-7, and GP-8 (Figure 10). No quantifiable levels of VC were observed in samples collected from this zone. The comparison of the analytical results derived from select soils submitted to the on-site mobile laboratory for analyses and the Color Tec field screening tests are presented in Table 2. Correlation between positive Color Tec field test indication and the detection of contaminants of interest by the on-site mobile laboratory results (reported on a wet weight basis) as shown in Table 2 was poor with a 44% “false positive” reporting rate. The results of the Color Tec field screening tests and results from soils analyzed by the EPA CLP laboratory are tabulated in Table 1. The correlation between positive Color Tec field test indication and the detection of the contaminants of interest by the EPA CLP laboratory results as shown in Table 1 was relatively good, with a 11% “false positive” reporting rate. Groundwater All groundwater samples collected were field screened using the Color Tec method. In addition, groundwater samples collected from DPT locations GP-1, GP-2, GP-3, GP-6, GP-7, GP-8, GP-9, GP-17, GP-18, GP-19, and GP-20 were also run for Method 8260 analyses using the on-site mobile laboratory. These results are depicted on Table 2. Figure 11 shows the Color Tec and the corresponding mobile laboratory results for each water sample collected as applicable. Preliminary Conclusions As stated previously, the objectives of this phase of the RI investigation included:
• identification of potential discharge (“hot spot source”) areas of contamination into the shallow soil (upper 35 feet) in the immediate vicinity of the Former Bell Dry Cleaner;
• characterization of the nature and extent of shallow contamination in the immediate vicinity
of the Former Bell Dry Cleaner; and • assessment of the efficacy of the Color Tec field screening method on soil matrix by
comparing screening test results with soil analyses performed by an on-site mobile laboratory.
April 28, 2004 Mr. Subhash Pal Texas Commission on Environmental Quality Page 5 In the following text, preliminary assessment of the data (i.e., data collected during the Geoprobe Field activities and subsequent laboratory results) with respect to each individual investigative objective will be discussed. Identification of Potential Discharge Areas Potential discharge areas investigated included:
• Area near the surface water storm drainage grate at the back (north side) of the dry cleaning facility, represented by the GP-4 location which discharges into the roadside ditch along 11600 Jones Road; the GP-3 location represents grassy area just off of the paved area where the drainage grate is located.
• Roadside ditch area along 11600 Jones Road which receives surface water discharge in
proximity of the Former Bell Dry Cleaner site, represented by locations GP-12 and GP-13. • Area associated with the septic tank at 11600 Jones Road, represented by GP-14 and GP-15
locations. • Secondary discharges along a sewer discharge pipe that conveyed wastewater from the dry
cleaner to the septic tank system, represented by locations GP-1, GP-2, and GP-16. • Area associated with the septic field serving 11600 Jones Road, represented by locations
GP-18 through GP-20. • Area surrounding the 11600 Jones Road building foundation, represented by locations GP-5
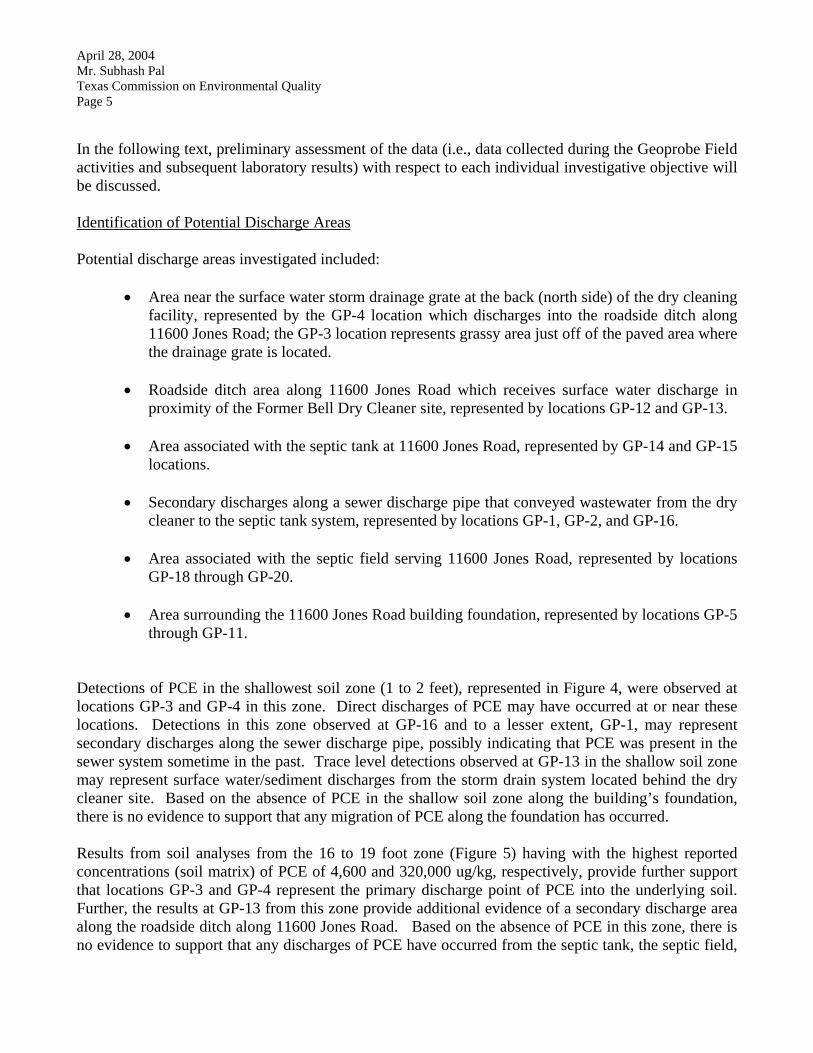
through GP-11. Detections of PCE in the shallowest soil zone (1 to 2 feet), represented in Figure 4, were observed at locations GP-3 and GP-4 in this zone. Direct discharges of PCE may have occurred at or near these locations. Detections in this zone observed at GP-16 and to a lesser extent, GP-1, may represent secondary discharges along the sewer discharge pipe, possibly indicating that PCE was present in the sewer system sometime in the past. Trace level detections observed at GP-13 in the shallow soil zone may represent surface water/sediment discharges from the storm drain system located behind the dry cleaner site. Based on the absence of PCE in the shallow soil zone along the building’s foundation, there is no evidence to support that any migration of PCE along the foundation has occurred. Results from soil analyses from the 16 to 19 foot zone (Figure 5) having with the highest reported concentrations (soil matrix) of PCE of 4,600 and 320,000 ug/kg, respectively, provide further support that locations GP-3 and GP-4 represent the primary discharge point of PCE into the underlying soil. Further, the results at GP-13 from this zone provide additional evidence of a secondary discharge area along the roadside ditch along 11600 Jones Road. Based on the absence of PCE in this zone, there is no evidence to support that any discharges of PCE have occurred from the septic tank, the septic field,

April 28, 2004 Mr. Subhash Pal Texas Commission on Environmental Quality Page 6 or the building foundation. A trace level of PCE detected in GP-1 provides some evidence to support that secondary discharges along the sewer discharge pipe may have occurred.
Characterization of the Nature and Extent of Shallow Contamination The following preliminary conclusions can be drawn from an interpretation of the results from the Geoprobe field investigation: Soil
Contaminant mass represented in the soil matrix throughout the shallow subsurface (upper 35 feet) is primarily composed of PCE. Contaminant mass in the zone near the ground surface is predominantly centered around locations GP-3 and GP-4, representing the potential primary discharge area of the PCE. Highest mass of the contaminant appears to have "accumulated" at the second (16 to 19 foot) zone; concentrations “migrate” and then dissipate towards the west and south of the source area with increasing depth (in the direction of GP-5 through GP-9). Lateral extent of contamination for each zone has not been fully defined (focus of the investigation was aimed at assessing potential source areas, not delineation of extent of impacts.) Secondary discharges of relatively low concentrations of PCE appear to have occurred along the sewer line located along the east side of the 11600 Jones Road building occurred (the water well serving this property is located along this sewer line).
Groundwater
Contaminant mass in groundwater matrix is primarily PCE; however, the presence of degradation daughter products (TCE, cis-DCE, VC) is more evident in the groundwater than the soil matrix. Lateral extent of the contaminants of interests in the groundwater is relatively greater than the extent observed in the soil matrix.
Presence of VC in GP-17, GP-18, and GP-19 with the lack of PCE in GP-18 and GP-19 as well as nearby GP-1 and GP-20 may be an indication of a southeasterly flow gradient in this shallow zone (assuming lateral diffusion is relatively insignificant).


TABLE 1JONES ROAD REMEDIAL INVESTIGATION
EPA CLP LABORATORY ANALYTICAL RESULTS WITH COLOR TECGEOPROBE - OCTOBER 2003
Station Location
Depth Interval
CLP Number
PCE in ug/kg Qualifier
TCE in ug/kg Qualifier
cis DCE ug/kg Qualifier
VC in ug/kg Qualifier
Color Tec Soils (ppm) Date
GP-04-1 1 - 2 F0PG3 57 B 10 U 10 U 10 U >3.0 10/27/2003GP-03-1 1 - 2 F0PD6 37 62 19 JD 10 U >3.0 10/24/2003GP-16-1 1 - 2 F0PG7 29 B 10 U 10 U 10 U 2.6 10/27/2003GP-19-1 1 F0P92 10 U 10 U 10 U 10 U ND,ND,ND 10/22/2003GP-05-1 1 - 2 F0PG1 10 JB 10 U 10 U 10 U ND,ND,ND 10/27/2003GP-07-1 1 - 2 F0PC1 10 U 10 U 10 U 10 U ND,ND,ND 10/23/2003GP-09-1 1 - 2 F0PB2 10 U 10 U 10 U 10 U ND,ND,ND 10/23/2003GP-10-1 1 - 2 F0PE6 10 U 10 U 10 U 10 U ND,ND,ND 10/27/2003GP-11-1 1 - 2 F0PF4 10 U 10 U 10 U 10 U ND,ND,ND 10/27/2003GP-12-1 1 - 2 F0PH5 10 U 10 U 10 U 10 U ND,ND,ND 10/28/2003GP-14-1 1 - 2 F0PH6 10 U 10 U 10 U 10 U ND,ND,ND 10/28/2003GP-15-1 1 - 2 F0PR3 10 U 10 U 10 U 10 U ND,ND,ND 10/29/2003GP-20-1 1 - 2 F0PC5 10 U 10 U 10 U 10 U ND,0.6 10/23/2003GP-06-1 2 F0PA3 10 U 10 U 10 U 10 U ND,ND,ND 10/22/2003GP-08-1 2 F0PA8 10 U 10 U 10 U 10 U ND,ND,ND 10/23/2003GP-18-1 2 F0P97 10 U 10 U 10 U 10 U ND,ND,ND 10/22/2003GP-01-1 1 - 2 F0PC9 7 J 10 U 10 U 10 U ND,ND,0.4 10/24/2003GP-02-1 1 - 2 F0PE1 3 J 10 U 10 U 10 U ND,ND,ND 10/24/2003GP-13-1 1 - 2 F0PH1 2 J 4 J 18 10 U 0.5 10/28/2003
GP-21-4 5 - 6 F0PS2 10 U 10 U 10 U 10 U ND,ND,ND 10/29/2003
GP-04-2 16 - 17 F0PG4 260000 D 5400 4200 1400 U >3.0 10/27/2003GP-03-2 18 - 19 F0PD7 4600 D 170 470 JD 6 J >3.0 10/24/2003GP-13-2 16 - 17 F0PH2 37 JD 140 33 JD 54 >3.0 10/28/2003GP-12-2 16 - 17 F0PR0 10 U 10 U 10 U 10 U ND,ND,ND 10/28/2003GP-21-1 16 - 17 F0PR9 10 U 10 U 10 U 10 U ND,ND,ND 10/29/2003GP-06-2 18 - 19 F0PA4 10 U 10 U 10 5 J ND,ND,0.7 10/22/2003GP-14-2 18 - 19 F0PH7 10 U 10 U 10 U 10 U ND,ND,ND 10/28/2003GP-15-2 18 - 19 F0PR4 10 U 10 U 10 U 10 U ND,ND,ND 10/29/2003GP-01-2 18 - 19 F0PD0 9 J 11 U 11 U 11 U ND,ND,ND 10/24/2003
GP-03-3 21 - 22 F0PD8 2700 D 380 E 1200 JD 19 >3.0 10/24/2003GP-06-3 26 - 27 F0PA5 1900 D 390 E 770 JD 110 >3.0 10/22/2003GP-07-2 24 - 25 F0PC2 1500 D 31 86 18 >3.0 10/23/2003GP-13-3 22 - 23 F0PH3 39 JD 170 73 D 54 >3.0 10/28/2003GP-05-2 24 - 25 F0PF8 55 B 15 12 6 J 1.3 10/27/2003GP-20-2 22 - 23 F0PC6 18 11 U 11 U 11 U 0.3 10/23/2003GP-09-2 19 - 20 F0PB3 12 U 12 U 12 U 12 U ND,ND,ND 10/23/2003GP-08-2 19 - 20 F0PA9 11 U 11 U 11 U 11 U ND,ND,ND 10/23/2003GP-19-3 19 - 20 F0P94 11 U 11 U 10 J 11 U ND,ND,ND 10/22/2003GP-18-3 26 - 27 F0P99 11 U 11 U 11 U 11 U ND,ND,ND 10/22/2003GP-12-3 21 - 22 F0PR1 10 U 10 U 10 U 10 U ND,ND,ND 10/28/2003GP-18-2 21 - 22 F0P98 10 U 10 U 10 U 10 U ND,ND,ND 10/22/2003GP-21-2 21 - 22 F0PS0 10 U 10 U 10 U 10 U ND,ND,ND 10/29/2003GP-10-2 22 - 23 F0PE7 10 U 10 U 10 U 10 U ND,ND,ND 10/27/2003GP-11-2 23 - 24 F0PF5 10 U 10 U 10 U 10 U ND,ND,ND 10/27/2003GP-15-3 23 - 24 F0PR5 10 U 10 U 10 U 10 U ND,ND,ND 10/29/2003GP-16-2 23 - 24 F0PG8 10 JB 10 U 10 U 10 U 0.65 10/27/2003GP-14-3 25 - 26 F0PH8 10 U 10 U 10 U 10 U ND,ND,ND 10/28/2003GP-10-3 26 - 27 F0PE8 10 U 10 U 10 U 10 U ND,ND,ND 10/27/2003GP-20-3 26 - 27 F0PC7 2 J 10 U 10 U 10 U 0.3 10/23/2003
GP-07-3 29 - 30 F0PC3 19000 D 720 JD 3000 D 140 >3.0 10/23/2003GP-08-3 27 - 28 F0PB0 780 E 21 47 12 U >3.0 10/23/2003GP-04-3 28.5 - 29.5F0PG5 19 10 U 10 U 10 U >3.0 10/27/2003GP-02-2 27 - 28 F0PE2 11 U 11 U 11 U 11 U ND,ND,0.2 10/24/2003GP-17-1 27 - 28 F0PE4 10 U 10 U 10 U 10 U ND,ND,ND 10/24/2003GP-05-3 28 - 29 F0PG0 10 JB 10 U 10 U 10 U ND,ND,ND 10/27/2003GP-11-3 28 - 29 F0PF6 10 U 10 U 10 U 10 U ND,ND,ND 10/27/2003
N:\Jones Road\Geoprobe Report jan04\Geoprobe RI Tables2-wbh.xls
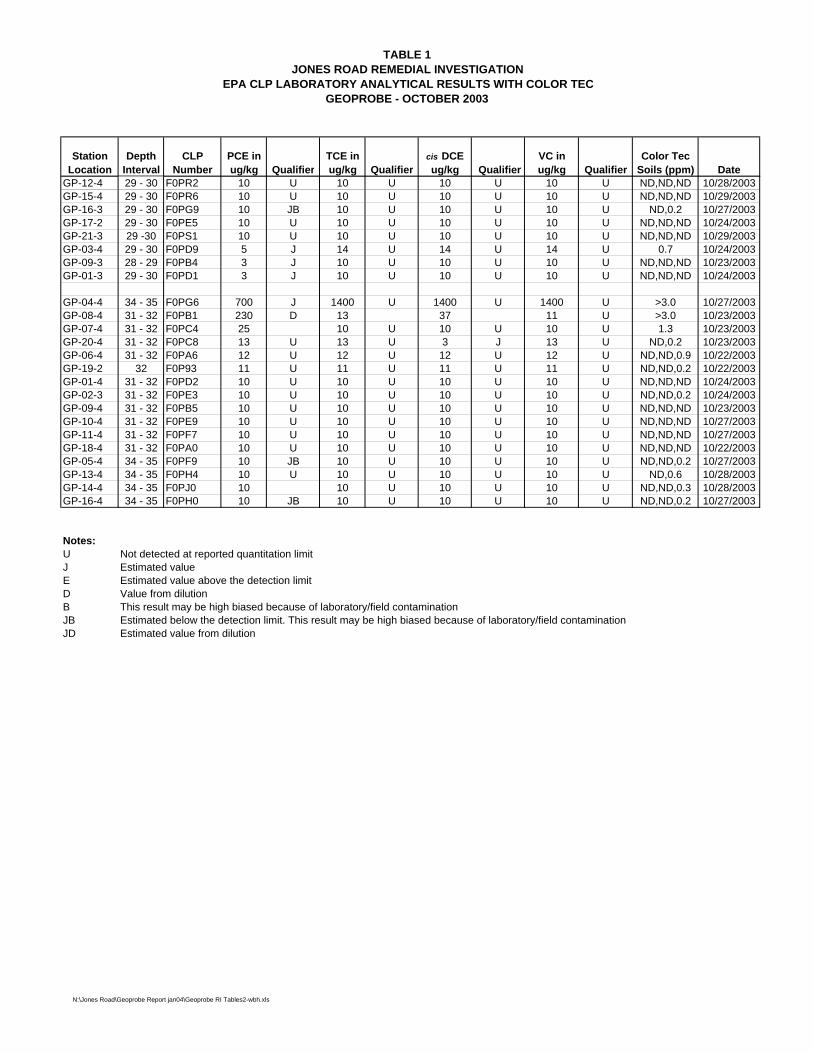
TABLE 1JONES ROAD REMEDIAL INVESTIGATION
EPA CLP LABORATORY ANALYTICAL RESULTS WITH COLOR TECGEOPROBE - OCTOBER 2003
Station Location
Depth Interval
CLP Number
PCE in ug/kg Qualifier
TCE in ug/kg Qualifier
cis DCE ug/kg Qualifier
VC in ug/kg Qualifier
Color Tec Soils (ppm) Date
GP-12-4 29 - 30 F0PR2 10 U 10 U 10 U 10 U ND,ND,ND 10/28/2003GP-15-4 29 - 30 F0PR6 10 U 10 U 10 U 10 U ND,ND,ND 10/29/2003GP-16-3 29 - 30 F0PG9 10 JB 10 U 10 U 10 U ND,0.2 10/27/2003GP-17-2 29 - 30 F0PE5 10 U 10 U 10 U 10 U ND,ND,ND 10/24/2003GP-21-3 29 -30 F0PS1 10 U 10 U 10 U 10 U ND,ND,ND 10/29/2003GP-03-4 29 - 30 F0PD9 5 J 14 U 14 U 14 U 0.7 10/24/2003GP-09-3 28 - 29 F0PB4 3 J 10 U 10 U 10 U ND,ND,ND 10/23/2003GP-01-3 29 - 30 F0PD1 3 J 10 U 10 U 10 U ND,ND,ND 10/24/2003
GP-04-4 34 - 35 F0PG6 700 J 1400 U 1400 U 1400 U >3.0 10/27/2003GP-08-4 31 - 32 F0PB1 230 D 13 37 11 U >3.0 10/23/2003GP-07-4 31 - 32 F0PC4 25 10 U 10 U 10 U 1.3 10/23/2003GP-20-4 31 - 32 F0PC8 13 U 13 U 3 J 13 U ND,0.2 10/23/2003GP-06-4 31 - 32 F0PA6 12 U 12 U 12 U 12 U ND,ND,0.9 10/22/2003GP-19-2 32 F0P93 11 U 11 U 11 U 11 U ND,ND,0.2 10/22/2003GP-01-4 31 - 32 F0PD2 10 U 10 U 10 U 10 U ND,ND,ND 10/24/2003GP-02-3 31 - 32 F0PE3 10 U 10 U 10 U 10 U ND,ND,0.2 10/24/2003GP-09-4 31 - 32 F0PB5 10 U 10 U 10 U 10 U ND,ND,ND 10/23/2003GP-10-4 31 - 32 F0PE9 10 U 10 U 10 U 10 U ND,ND,ND 10/27/2003GP-11-4 31 - 32 F0PF7 10 U 10 U 10 U 10 U ND,ND,ND 10/27/2003GP-18-4 31 - 32 F0PA0 10 U 10 U 10 U 10 U ND,ND,ND 10/22/2003GP-05-4 34 - 35 F0PF9 10 JB 10 U 10 U 10 U ND,ND,0.2 10/27/2003GP-13-4 34 - 35 F0PH4 10 U 10 U 10 U 10 U ND,0.6 10/28/2003GP-14-4 34 - 35 F0PJ0 10 10 U 10 U 10 U ND,ND,0.3 10/28/2003GP-16-4 34 - 35 F0PH0 10 JB 10 U 10 U 10 U ND,ND,0.2 10/27/2003
Notes:UJEDBJBJD
This result may be high biased because of laboratory/field contaminationEstimated below the detection limit. This result may be high biased because of laboratory/field contaminationEstimated value from dilution
Not detected at reported quantitation limit
Estimated value above the detection limitEstimated value
Value from dilution
N:\Jones Road\Geoprobe Report jan04\Geoprobe RI Tables2-wbh.xls

TABLE 2JONES ROAD REMEDIAL INVESTIGATION
ONSITE MOBILE LABORATORY ANALYTICAL RESULTS WITH COLOR TECGEOPROBE - OCTOBER 2003
Location Interval PCE TCE cis DCE VC 1st Pull 2nd Pull 3rd Pull DateGP-1 Water 12.6 0.13 <0.25 <0.18 0.4 10/23/2003GP-2 Water 0.65 <0.11 0.34 <0.18 ND ND ND 10/23/2003GP-3 Water 7860 821 2290 34.2 >3.0 10/23/2003GP-4 Water NS NS NS NS >3.0 10/27/2003GP-5 Water NS NS NS NS >3.0 10/27/2003GP-6 Water 366 132 1780 176 >3.0 10/22/2003GP-7 Water 7030 787 5450 511 >3.0 10/23/2003GP-8 Water 264 28.8 107 1.11 >3.0 10/23/2003GP-9 Water 8.29 2.73 6.07 0.19 0.4 10/23/2003
GP-10 Water NS NS NS NS ND ND ND 10/27/2003GP-11 Water NS NS NS NS ND ND ND 10/27/2003GP-12 Water NS NS NS NS 0.5 10/28/2003GP-13 Water NS NS NS NS >3.0 10/28/2003GP-14 Water NS NS NS NS >3.0 10/28/2003GP-15 Water NS NS NS NS ND ND ND 10/29/2003GP-16 Water NS NS NS NS ND ND ND 10/27/2003GP-17 Water 1.82 <0.11 2 0.46 ND ND 0.3 10/23/2003GP-18 Water <0.21 <0.11 0.72 0.77 ND ND ND 10/22/2003GP-19 Water <0.21 <0.11 3.93 0.36 ND ND ND 10/22/2003GP-20 Water 1.93 <0.11 1.42 <0.18 ND 0.4 10/23/2003GP-21 Water NS NS NS NS ND ND 0.2 10/29/2003
GP-3 1-2 0.12 0.13 0.29 0.03 >3.0 10/23/2003GP-1 1-2 <0.01 <0.02 <0.02 <0.03 ND 0.4 10/23/2003GP-9 1-2 <0.01 <0.02 <0.02 <0.03 ND ND ND 10/23/2003GP-8 0.5-2 <0.01 <0.02 <0.02 <0.03 ND ND ND 10/23/2003GP-7 1-2 <0.01 <0.02 <0.02 <0.03 ND ND ND 10/23/2003
GP-20 1-2 <0.01 <0.02 <0.02 <0.03 ND 0.6 10/23/2003GP-2 1-2 <0.01 <0.02 <0.02 <0.03 ND ND ND 10/23/2003
GP-19 0.5-2 <0.01 <0.02 <0.02 <0.03 ND ND ND 10/22/2003GP-18 0.5-2 <0.01 <0.02 <0.02 <0.03 ND ND ND 10/22/2003
GP-6 2-3 <0.01 <0.02 <0.02 <0.03 ND ND 0.4 10/22/2003
GP-3 8-9 2.11 0.41 0.89 <0.03 >3.0 10/24/2003
GP-3 18-19 1.43 0.03 0.17 <0.03 >3.0 10/23/2003GP-9 19-20 <0.01 <0.02 <0.02 <0.03 ND ND ND 10/23/2003GP-8 19-20 <0.01 <0.02 <0.02 <0.03 ND ND ND 10/23/2003
GP-19 19-20 <0.01 <0.02 <0.02 <0.03 ND ND ND 10/22/2003GP-1 18-19 <0.01 <0.02 <0.02 <0.03 ND ND ND 10/23/2003GP-6 18-19 NS NS NS NS ND ND 0.7 10/22/2003
GP-3 21-22 1.62 0.07 0.46 <0.03 >3.0 10/23/2003GP-7 24-25 1.47 0.04 0.13 0.03 >3.0 10/23/2003GP-6 26-27 0.81 0.08 0.23 0.4 >3.0 10/22/2003GP-8 27-28 0.63 <0.02 0.04 <0.03 >3.0 10/23/2003
GP-20 22-23 <0.01 <0.02 <0.02 <0.03 0.3 10/23/2003GP-20 26-27 <0.01 <0.02 <0.02 <0.03 0.3 10/23/2003GP-17 27-28 <0.01 <0.02 <0.02 <0.03 ND ND ND 10/23/2003GP-18 21-22 <0.01 <0.02 <0.02 <0.03 ND ND ND 10/22/2003GP-18 26-27 <0.01 <0.02 <0.02 <0.03 ND ND ND 10/22/2003GP-2 27-28 <0.01 <0.02 <0.02 <0.03 ND ND 0.2 10/23/2003GP-9 28-29 <0.01 <0.02 <0.02 <0.03 ND ND ND 10/23/2003
Mobile Laboratory ResultsSoil in mg/Kg, Water in ug/L
Color-Tec Results(ppm)

TABLE 2JONES ROAD REMEDIAL INVESTIGATION
ONSITE MOBILE LABORATORY ANALYTICAL RESULTS WITH COLOR TECGEOPROBE - OCTOBER 2003
Location Interval PCE TCE cis DCE VC 1st Pull 2nd Pull 3rd Pull Date
Mobile Laboratory ResultsSoil in mg/Kg, Water in ug/L
Color-Tec Results(ppm)
GP-7 29-30 7.75 0.37 1.57 0.07 >3.0 10/23/2003GP-8 31-32 0.37 <0.02 0.04 <0.03 >3.0 10/23/2003GP-7 31-32 0.07 <0.02 0.03 <0.03 1.3 10/23/2003GP-2 31-32 <0.01 <0.02 <0.02 <0.03 ND ND ND 10/23/2003
GP-19 31.5-32 <0.01 <0.02 <0.02 <0.03 ND ND 0.2 10/22/2003GP-18 31-32 <0.01 <0.02 <0.02 <0.03 ND ND ND 10/22/2003GP-17 29-30 <0.01 <0.02 <0.02 <0.03 ND ND ND 10/23/2003GP-1 29-30 <0.01 <0.02 <0.02 <0.03 ND ND ND 10/23/2003GP-1 31-32 <0.01 <0.02 <0.02 <0.03 ND ND ND 10/23/2003
NS Not sampledND Not Detected