april 2017 results report arlington independent school ... · 0 district services survey april 2017...
TRANSCRIPT

0
District Services Survey April 2017 Results Report Arlington Independent School District
1
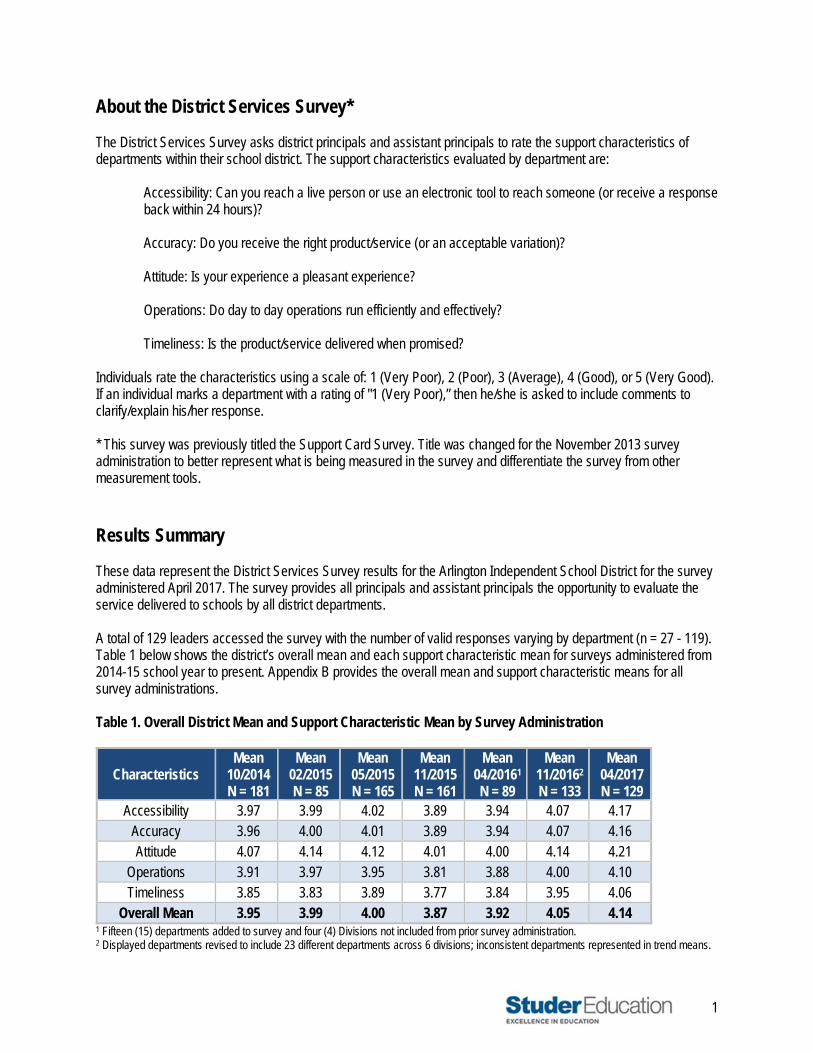
About the District Services Survey*
The District Services Survey asks district principals and assistant principals to rate the support characteristics of departments within their school district. The support characteristics evaluated by department are:
Accessibility: Can you reach a live person or use an electronic tool to reach someone (or receive a response back within 24 hours)? Accuracy: Do you receive the right product/service (or an acceptable variation)? Attitude: Is your experience a pleasant experience? Operations: Do day to day operations run efficiently and effectively? Timeliness: Is the product/service delivered when promised?
Individuals rate the characteristics using a scale of: 1 (Very Poor), 2 (Poor), 3 (Average), 4 (Good), or 5 (Very Good). If an individual marks a department with a rating of "1 (Very Poor),” then he/she is asked to include comments to clarify/explain his/her response. * This survey was previously titled the Support Card Survey. Title was changed for the November 2013 survey administration to better represent what is being measured in the survey and differentiate the survey from other measurement tools. Results Summary These data represent the District Services Survey results for the Arlington Independent School District for the survey administered April 2017. The survey provides all principals and assistant principals the opportunity to evaluate the service delivered to schools by all district departments. A total of 129 leaders accessed the survey with the number of valid responses varying by department (n = 27 - 119). Table 1 below shows the district’s overall mean and each support characteristic mean for surveys administered from 2014-15 school year to present. Appendix B provides the overall mean and support characteristic means for all survey administrations. Table 1. Overall District Mean and Support Characteristic Mean by Survey Administration
Characteristics Mean
10/2014 N = 181
Mean 02/2015 N = 85
Mean 05/2015 N = 165
Mean 11/2015 N = 161
Mean 04/20161
N = 89
Mean 11/20162
N = 133
Mean 04/2017 N = 129
Accessibility 3.97 3.99 4.02 3.89 3.94 4.07 4.17 Accuracy 3.96 4.00 4.01 3.89 3.94 4.07 4.16 Attitude 4.07 4.14 4.12 4.01 4.00 4.14 4.21
Operations 3.91 3.97 3.95 3.81 3.88 4.00 4.10 Timeliness 3.85 3.83 3.89 3.77 3.84 3.95 4.06
Overall Mean 3.95 3.99 4.00 3.87 3.92 4.05 4.14 1 Fifteen (15) departments added to survey and four (4) Divisions not included from prior survey administration. 2 Displayed departments revised to include 23 different departments across 6 divisions; inconsistent departments represented in trend means.

2
Percentile ranks were developed to provide a normed comparison for each district’s support characteristic means and its overall mean. Table 2 displays the percentile ranks for each of the district’s characteristic means and its overall mean. Two benefits of using percentile ranks include:
(a) a standardized frame of reference for the support characteristic mean / overall mean interpretation, and (b) showing where a score, in this case the district’s support characteristic means and overall mean, fits within a larger distribution of scores.
The “larger distribution of scores” in this report includes responses from all Studer Education partners across all survey administrations through November 2015 (more than 5,200 individual leader responses across the equivalent of 117 districts utilized for a Monte Carlo study simulation.) Using Monte Carlo simulation, the survey administration data are used to generate a dataset with 100,000 districts. The simulated dataset is based on the mean and standard deviation of the actual dataset, but has enough cases to smooth out the curve. The simulated dataset is used to calculate the percentile ranks. Table 2. Overall Mean and Support Characteristic Means for the current Survey Administration for AISD and Percentile Rank across Benchmark Districts
AISD’s overall mean of 4.14 ranks in the 33rd percentile of all benchmark districts’ overall means, meaning the AISD overall mean is higher than 33% of benchmark districts’ overall means.
The AISD overall mean increased from 4.05 (Fall 2016) to 4.14, moving the mean from the 23rd to 33rd percentile rank among all benchmark districts’ overall means.
Table 3 shows the division mean across survey administrations for the current academic year, and change by quarter and year. All divisions and departments have the goal of achieving a mean of a 4.50 or above on the District Services Survey. This indicates excellence of service from the division or department to their clients.
Characteristics AISD 04/2017
Percentile Rank
Accessibility 4.17 40
Accuracy 4.16 34
Attitude 4.21 29
Operations 4.10 36
Timeliness 4.06 36
Overall Mean 4.14 33

3
Table 3. Division4 Means by Survey Administration and Change by Quarter and by Year
Divisions Mean
05/2015 Mean
11/2015 Mean
04/2016 Mean
11/2016 Mean
04/2017 Change
(Quarter) Change
(Year)
Administration 4.09 3.68 3.895 3.98 4.01 0.03 0.12
Communication 4.18 4.21 4.43 4.53 4.44 -0.09 0.01
Educational Support Services 3.50 3.48 3.91 4.02 0.11 0.54
Finance 4.21 4.19 4.23 4.32 0.09 0.13
Food and Nutrition1 4.18 4.29 4.51 4.47 4.46 -0.01 -0.05
Human Resources 3.47 2.83 3.555 3.93 4.12 0.19 0.57
Plant Services 3.99 3.98 3.84 3.71 3.91 0.20 0.07
Research and Accountability7 4.23 4.30 4.40 4.25 4.40 0.15 0.00
Teaching and Learning2 3.76 3.75 3.76 3.75 3.99 0.24 0.23
Technology3 4.06 4.07 4.085 4.24 4.31 0.07 0.23
Transformational Learning 3.87 3.93 3.97 4.18 0.21 0.25
Business Office 4.03 - - - - - -
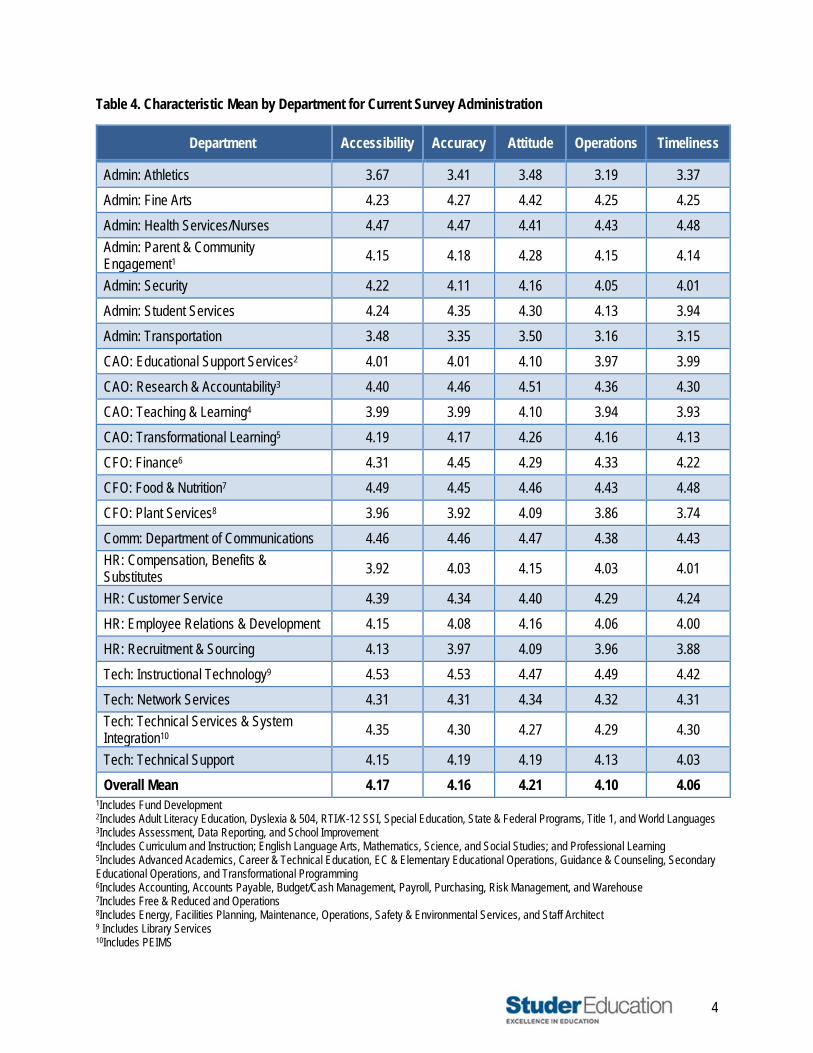
Overall Mean 6 4.005 3.895 4.06 4.05 4.14 0.09 0.08 1 Titled “Food Service” prior to Nov 2015 survey administration. 2 Titled “Curriculum and Instruction” prior to Nov 2015 survey administration. 3 Titled “Technology & Telecommunications” prior to Nov 2015 survey administration. 4 Divisions identified by school district for inclusion in table. 5 Provided by school district. 6 Includes only Divisions listed within Table 3. 7 titled “Accountability, Planning and Testing” prior to Apr 2016 survey administration. On the following page, Table 4 shows the support characteristic means by department for the current survey administration.
4
Table 4. Characteristic Mean by Department for Current Survey Administration
Department Accessibility Accuracy Attitude Operations Timeliness
Admin: Athletics 3.67 3.41 3.48 3.19 3.37
Admin: Fine Arts 4.23 4.27 4.42 4.25 4.25
Admin: Health Services/Nurses 4.47 4.47 4.41 4.43 4.48
Admin: Parent & Community Engagement1 4.15 4.18 4.28 4.15 4.14
Admin: Security 4.22 4.11 4.16 4.05 4.01
Admin: Student Services 4.24 4.35 4.30 4.13 3.94
Admin: Transportation 3.48 3.35 3.50 3.16 3.15
CAO: Educational Support Services2 4.01 4.01 4.10 3.97 3.99
CAO: Research & Accountability3 4.40 4.46 4.51 4.36 4.30
CAO: Teaching & Learning4 3.99 3.99 4.10 3.94 3.93
CAO: Transformational Learning5 4.19 4.17 4.26 4.16 4.13
CFO: Finance6 4.31 4.45 4.29 4.33 4.22
CFO: Food & Nutrition7 4.49 4.45 4.46 4.43 4.48
CFO: Plant Services8 3.96 3.92 4.09 3.86 3.74
Comm: Department of Communications 4.46 4.46 4.47 4.38 4.43
HR: Compensation, Benefits & Substitutes
3.92 4.03 4.15 4.03 4.01
HR: Customer Service 4.39 4.34 4.40 4.29 4.24
HR: Employee Relations & Development 4.15 4.08 4.16 4.06 4.00
HR: Recruitment & Sourcing 4.13 3.97 4.09 3.96 3.88
Tech: Instructional Technology9 4.53 4.53 4.47 4.49 4.42
Tech: Network Services 4.31 4.31 4.34 4.32 4.31
Tech: Technical Services & System Integration10 4.35 4.30 4.27 4.29 4.30
Tech: Technical Support 4.15 4.19 4.19 4.13 4.03
Overall Mean 4.17 4.16 4.21 4.10 4.06 1Includes Fund Development 2Includes Adult Literacy Education, Dyslexia & 504, RTI/K-12 SSI, Special Education, State & Federal Programs, Title 1, and World Languages 3Includes Assessment, Data Reporting, and School Improvement 4Includes Curriculum and Instruction; English Language Arts, Mathematics, Science, and Social Studies; and Professional Learning 5Includes Advanced Academics, Career & Technical Education, EC & Elementary Educational Operations, Guidance & Counseling, Secondary Educational Operations, and Transformational Programming 6Includes Accounting, Accounts Payable, Budget/Cash Management, Payroll, Purchasing, Risk Management, and Warehouse 7Includes Free & Reduced and Operations 8Includes Energy, Facilities Planning, Maintenance, Operations, Safety & Environmental Services, and Staff Architect 9 Includes Library Services 10Includes PEIMS

5
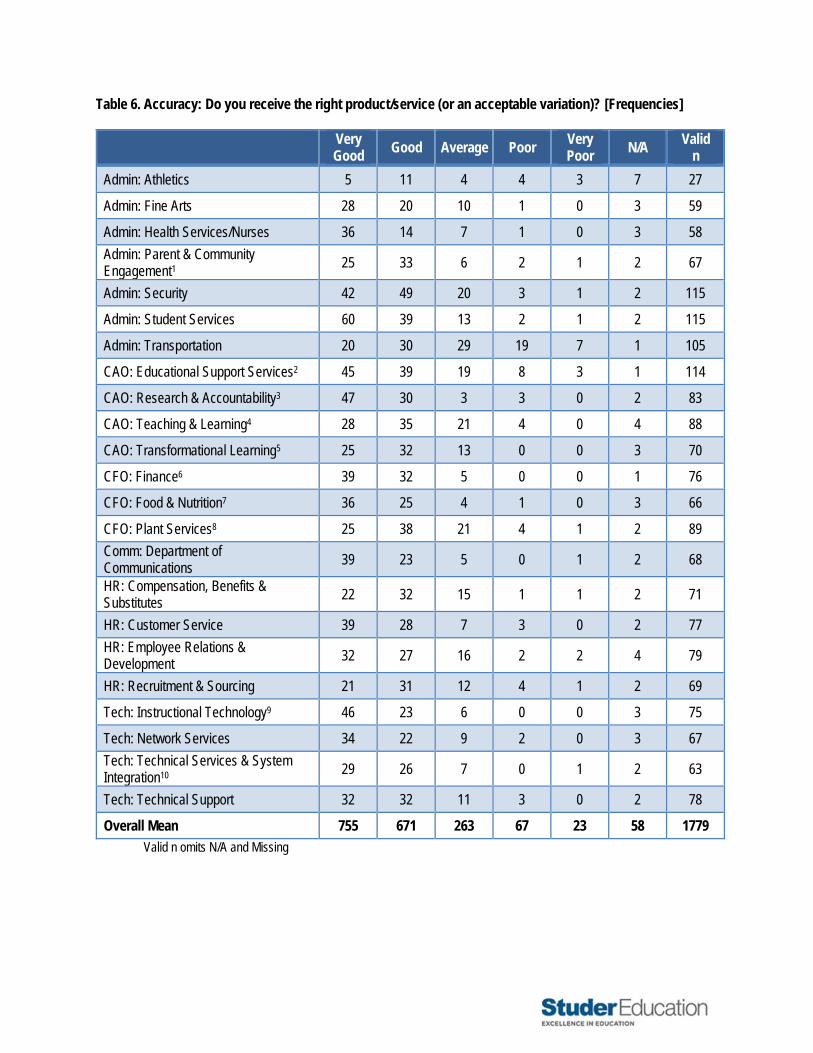
Tables 5 – 7 provide the frequency distribution of responses by support characteristic and department for the baseline survey administration. Comments by department begin after Table 7. Appendix A shows participation by principals and assistant principals, and overall means and support characteristic means by department and by leader role. Table 5. Accessibility: Can you reach a live person or use an electronic tool to reach someone (or receive a response back within 24 hours)? [Frequencies]
Very Good
Good Average Poor Very Poor
N/A Valid
n
Admin: Athletics 9 8 5 2 3 7 27
Admin: Fine Arts 29 21 8 2 1 2 61
Admin: Health Services/Nurses 34 18 5 1 0 3 58
Admin: Parent & Community Engagement1 28 27 9 3 1 2 68
Admin: Security 53 43 17 2 2 0 117
Admin: Student Services 61 32 22 2 2 0 119
Admin: Transportation 25 31 28 14 8 0 106
CAO: Educational Support Services2 45 40 21 7 3 0 116
CAO: Research & Accountability3 44 31 5 3 0 2 83
CAO: Teaching & Learning4 29 38 18 6 0 2 91
CAO: Transformational Learning5 26 32 11 1 0 3 70
CFO: Finance6 36 30 10 1 0 1 77
CFO: Food & Nutrition7 38 25 3 1 0 2 67
CFO: Plant Services8 27 36 23 4 0 1 90
Comm: Department of Communications
39 23 5 0 1 2 68
HR: Compensation, Benefits & Substitutes
20 31 16 2 2 2 71
HR: Customer Service 44 23 7 2 1 3 77
HR: Employee Relations & Development
35 28 14 3 1 2 81
HR: Recruitment & Sourcing 25 32 10 3 0 1 70
Tech: Instructional Technology9 46 24 6 0 0 2 76
Tech: Network Services 34 23 10 0 1 2 68
Tech: Technical Services & System Integration10 31 23 9 0 0 2 63
Tech: Technical Support 33 28 15 3 0 1 79
Overall Mean 791 647 277 62 26 42 1803
Valid n omits N/A and Missing
6
Table 6. Accuracy: Do you receive the right product/service (or an acceptable variation)? [Frequencies]
Very Good
Good Average Poor Very Poor
N/A Valid
n
Admin: Athletics 5 11 4 4 3 7 27
Admin: Fine Arts 28 20 10 1 0 3 59
Admin: Health Services/Nurses 36 14 7 1 0 3 58
Admin: Parent & Community Engagement1 25 33 6 2 1 2 67
Admin: Security 42 49 20 3 1 2 115
Admin: Student Services 60 39 13 2 1 2 115
Admin: Transportation 20 30 29 19 7 1 105
CAO: Educational Support Services2 45 39 19 8 3 1 114
CAO: Research & Accountability3 47 30 3 3 0 2 83
CAO: Teaching & Learning4 28 35 21 4 0 4 88
CAO: Transformational Learning5 25 32 13 0 0 3 70
CFO: Finance6 39 32 5 0 0 1 76
CFO: Food & Nutrition7 36 25 4 1 0 3 66
CFO: Plant Services8 25 38 21 4 1 2 89
Comm: Department of Communications
39 23 5 0 1 2 68
HR: Compensation, Benefits & Substitutes
22 32 15 1 1 2 71
HR: Customer Service 39 28 7 3 0 2 77
HR: Employee Relations & Development
32 27 16 2 2 4 79
HR: Recruitment & Sourcing 21 31 12 4 1 2 69
Tech: Instructional Technology9 46 23 6 0 0 3 75
Tech: Network Services 34 22 9 2 0 3 67
Tech: Technical Services & System Integration10 29 26 7 0 1 2 63
Tech: Technical Support 32 32 11 3 0 2 78
Overall Mean 755 671 263 67 23 58 1779
Valid n omits N/A and Missing
7
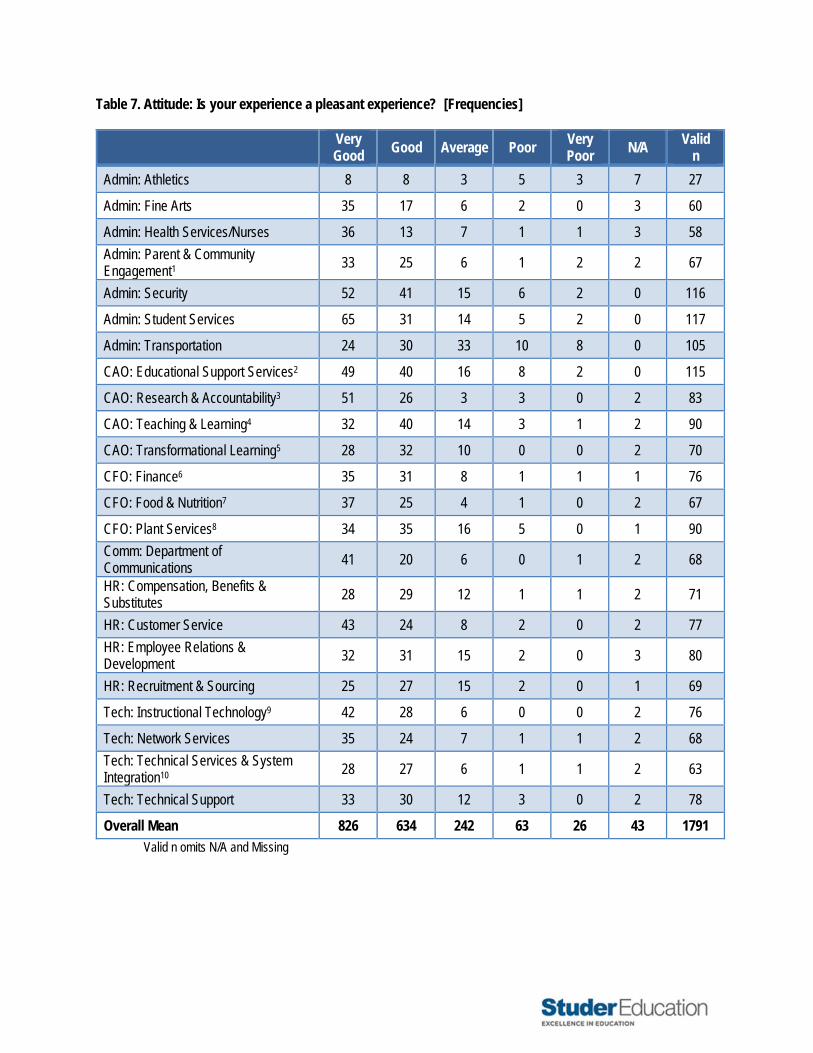
Table 7. Attitude: Is your experience a pleasant experience? [Frequencies]
Very Good
Good Average Poor Very Poor
N/A Valid
n
Admin: Athletics 8 8 3 5 3 7 27
Admin: Fine Arts 35 17 6 2 0 3 60
Admin: Health Services/Nurses 36 13 7 1 1 3 58
Admin: Parent & Community Engagement1 33 25 6 1 2 2 67
Admin: Security 52 41 15 6 2 0 116
Admin: Student Services 65 31 14 5 2 0 117
Admin: Transportation 24 30 33 10 8 0 105
CAO: Educational Support Services2 49 40 16 8 2 0 115
CAO: Research & Accountability3 51 26 3 3 0 2 83
CAO: Teaching & Learning4 32 40 14 3 1 2 90
CAO: Transformational Learning5 28 32 10 0 0 2 70
CFO: Finance6 35 31 8 1 1 1 76
CFO: Food & Nutrition7 37 25 4 1 0 2 67
CFO: Plant Services8 34 35 16 5 0 1 90
Comm: Department of Communications
41 20 6 0 1 2 68
HR: Compensation, Benefits & Substitutes
28 29 12 1 1 2 71
HR: Customer Service 43 24 8 2 0 2 77
HR: Employee Relations & Development
32 31 15 2 0 3 80
HR: Recruitment & Sourcing 25 27 15 2 0 1 69
Tech: Instructional Technology9 42 28 6 0 0 2 76
Tech: Network Services 35 24 7 1 1 2 68
Tech: Technical Services & System Integration10 28 27 6 1 1 2 63
Tech: Technical Support 33 30 12 3 0 2 78
Overall Mean 826 634 242 63 26 43 1791
Valid n omits N/A and Missing

8
Table 8. Operations: Do day to day operations run efficiently and effectively? [Frequencies]
Very Good
Good Average Poor Very Poor
N/A Valid
n
Admin: Athletics 5 9 3 6 4 6 27
Admin: Fine Arts 28 21 9 2 0 3 60
Admin: Health Services/Nurses 33 18 6 1 0 3 58
Admin: Parent & Community Engagement1 25 29 10 1 1 4 66
Admin: Security 41 47 23 3 2 0 116
Admin: Student Services 49 39 22 3 2 2 115
Admin: Transportation 14 29 32 18 11 1 104
CAO: Educational Support Services2 42 39 24 9 1 0 115
CAO: Research & Accountability3 42 31 8 2 0 2 83
CAO: Teaching & Learning4 26 39 18 5 1 3 89
CAO: Transformational Learning5 26 30 11 2 0 3 69
CFO: Finance6 36 29 11 0 0 1 76
CFO: Food & Nutrition7 36 25 5 1 0 2 67
CFO: Plant Services8 25 36 22 5 2 1 90
Comm: Department of Communications
37 23 6 1 1 2 68
HR: Compensation, Benefits & Substitutes
21 35 10 3 1 3 70
HR: Customer Service 38 29 5 4 1 2 77
HR: Employee Relations & Development
29 34 12 3 2 3 80
HR: Recruitment & Sourcing 20 35 9 4 2 1 70
Tech: Instructional Technology9 46 22 7 1 0 2 76
Tech: Network Services 33 26 7 2 0 2 68
Tech: Technical Services & System Integration10 28 26 8 1 0 2 63
Tech: Technical Support 30 32 14 3 0 1 79
Overall Mean 710 683 282 80 31 49 1786
Valid n omits N/A and Missing
9
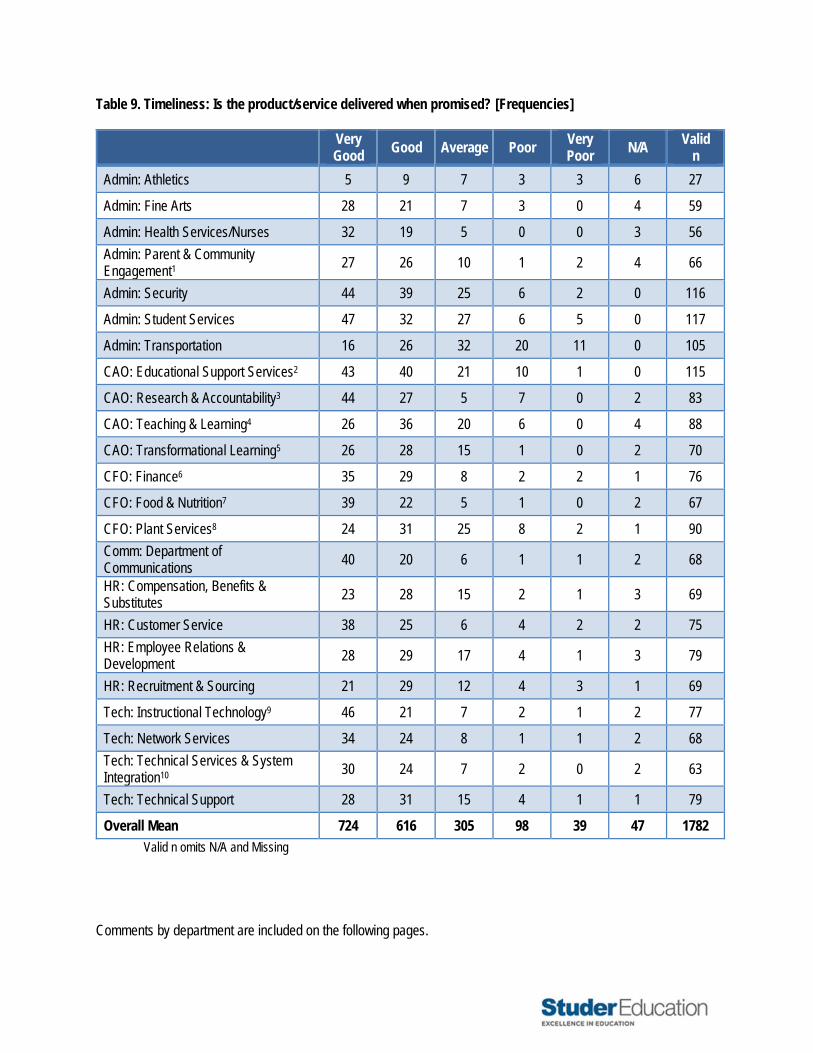
Table 9. Timeliness: Is the product/service delivered when promised? [Frequencies]
Very Good
Good Average Poor Very Poor
N/A Valid
n
Admin: Athletics 5 9 7 3 3 6 27
Admin: Fine Arts 28 21 7 3 0 4 59
Admin: Health Services/Nurses 32 19 5 0 0 3 56
Admin: Parent & Community Engagement1 27 26 10 1 2 4 66
Admin: Security 44 39 25 6 2 0 116
Admin: Student Services 47 32 27 6 5 0 117
Admin: Transportation 16 26 32 20 11 0 105
CAO: Educational Support Services2 43 40 21 10 1 0 115
CAO: Research & Accountability3 44 27 5 7 0 2 83
CAO: Teaching & Learning4 26 36 20 6 0 4 88
CAO: Transformational Learning5 26 28 15 1 0 2 70
CFO: Finance6 35 29 8 2 2 1 76
CFO: Food & Nutrition7 39 22 5 1 0 2 67
CFO: Plant Services8 24 31 25 8 2 1 90
Comm: Department of Communications
40 20 6 1 1 2 68
HR: Compensation, Benefits & Substitutes
23 28 15 2 1 3 69
HR: Customer Service 38 25 6 4 2 2 75
HR: Employee Relations & Development
28 29 17 4 1 3 79
HR: Recruitment & Sourcing 21 29 12 4 3 1 69
Tech: Instructional Technology9 46 21 7 2 1 2 77
Tech: Network Services 34 24 8 1 1 2 68
Tech: Technical Services & System Integration10 30 24 7 2 0 2 63
Tech: Technical Support 28 31 15 4 1 1 79
Overall Mean 724 616 305 98 39 47 1782
Valid n omits N/A and Missing Comments by department are included on the following pages.
40
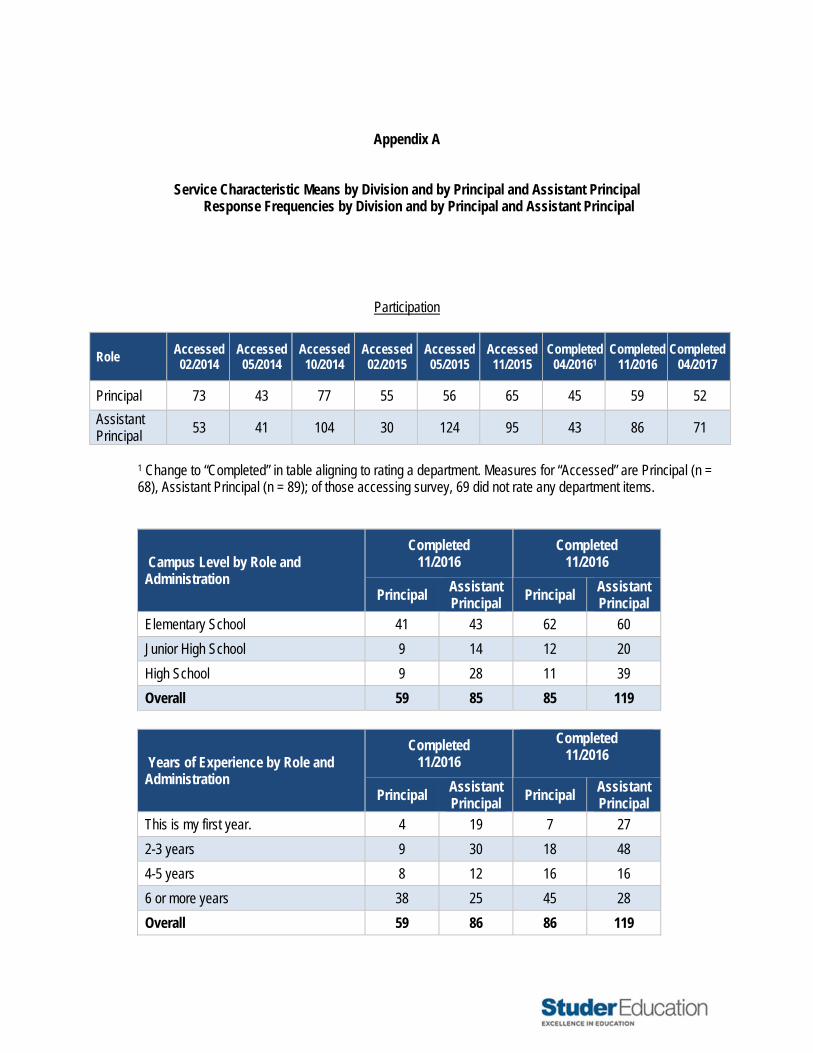
Appendix A
Service Characteristic Means by Division and by Principal and Assistant Principal Response Frequencies by Division and by Principal and Assistant Principal
Participation
Role Accessed 02/2014
Accessed 05/2014
Accessed 10/2014
Accessed 02/2015
Accessed 05/2015
Accessed 11/2015
Completed 04/20161
Completed 11/2016
Completed 04/2017
Principal 73 43 77 55 56 65 45 59 52
Assistant Principal
53 41 104 30 124 95 43 86 71
1 Change to “Completed” in table aligning to rating a department. Measures for “Accessed” are Principal (n = 68), Assistant Principal (n = 89); of those accessing survey, 69 did not rate any department items.
Campus Level by Role and Administration
Completed 11/2016
Completed 11/2016
Principal Assistant Principal
Principal Assistant Principal
Elementary School 41 43 62 60
Junior High School 9 14 12 20
High School 9 28 11 39
Overall 59 85 85 119
Years of Experience by Role and Administration
Completed 11/2016
Completed 11/2016
Principal Assistant Principal
Principal Assistant Principal
This is my first year. 4 19 7 27
2-3 years 9 30 18 48
4-5 years 8 12 16 16
6 or more years 38 25 45 28
Overall 59 86 86 119
26
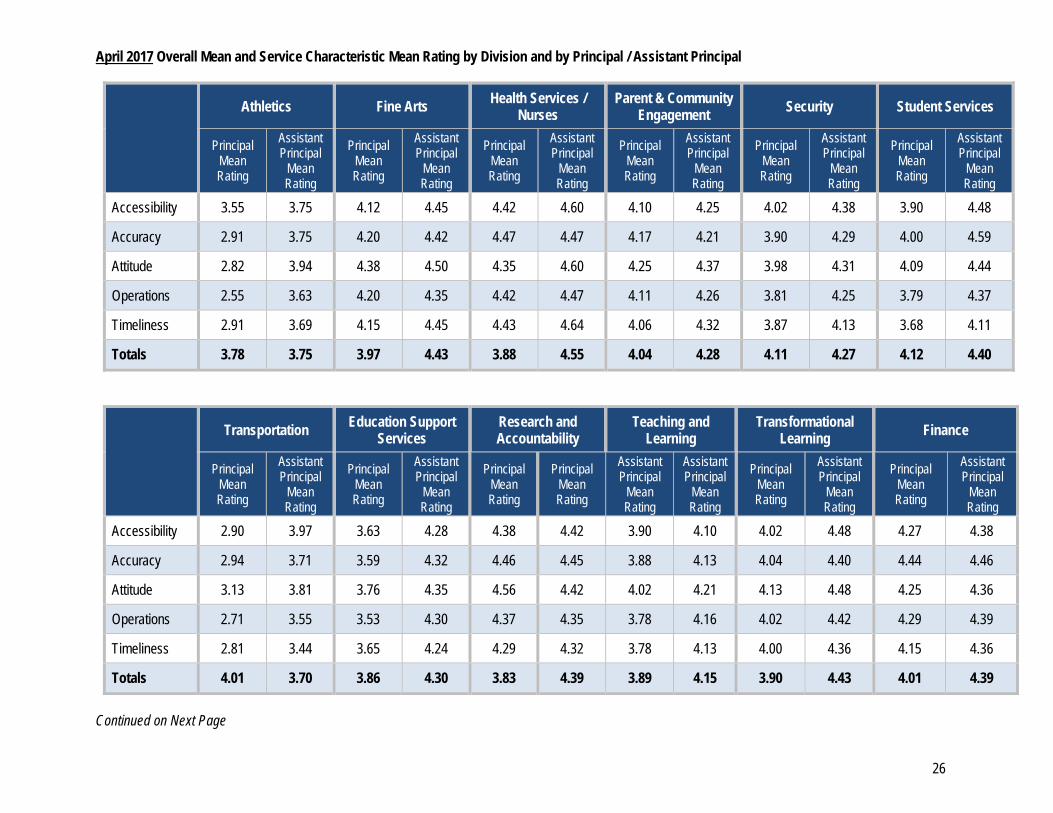
April 2017 Overall Mean and Service Characteristic Mean Rating by Division and by Principal / Assistant Principal
Athletics Fine Arts Health Services /
Nurses Parent & Community
Engagement Security Student Services
Principal Mean Rating
Assistant Principal
Mean Rating
Principal Mean Rating
Assistant Principal
Mean Rating
Principal Mean Rating
Assistant Principal
Mean Rating
Principal Mean Rating
Assistant Principal
Mean Rating
Principal Mean Rating
Assistant Principal
Mean Rating
Principal Mean Rating
Assistant Principal
Mean Rating
Accessibility 3.55 3.75 4.12 4.45 4.42 4.60 4.10 4.25 4.02 4.38 3.90 4.48
Accuracy 2.91 3.75 4.20 4.42 4.47 4.47 4.17 4.21 3.90 4.29 4.00 4.59
Attitude 2.82 3.94 4.38 4.50 4.35 4.60 4.25 4.37 3.98 4.31 4.09 4.44
Operations 2.55 3.63 4.20 4.35 4.42 4.47 4.11 4.26 3.81 4.25 3.79 4.37
Timeliness 2.91 3.69 4.15 4.45 4.43 4.64 4.06 4.32 3.87 4.13 3.68 4.11
Totals 3.78 3.75 3.97 4.43 3.88 4.55 4.04 4.28 4.11 4.27 4.12 4.40
Transportation Education Support
Services Research and Accountability
Teaching and Learning
Transformational Learning
Finance
Principal Mean Rating
Assistant Principal
Mean Rating
Principal Mean Rating
Assistant Principal
Mean Rating
Principal Mean Rating
Principal Mean Rating
Assistant Principal
Mean Rating
Assistant Principal
Mean Rating
Principal Mean Rating
Assistant Principal
Mean Rating
Principal Mean Rating
Assistant Principal
Mean Rating
Accessibility 2.90 3.97 3.63 4.28 4.38 4.42 3.90 4.10 4.02 4.48 4.27 4.38
Accuracy 2.94 3.71 3.59 4.32 4.46 4.45 3.88 4.13 4.04 4.40 4.44 4.46
Attitude 3.13 3.81 3.76 4.35 4.56 4.42 4.02 4.21 4.13 4.48 4.25 4.36
Operations 2.71 3.55 3.53 4.30 4.37 4.35 3.78 4.16 4.02 4.42 4.29 4.39
Timeliness 2.81 3.44 3.65 4.24 4.29 4.32 3.78 4.13 4.00 4.36 4.15 4.36
Totals 4.01 3.70 3.86 4.30 3.83 4.39 3.89 4.15 3.90 4.43 4.01 4.39
Continued on Next Page

27
April 2017 Overall Mean and Service Characteristic Mean Rating by Division and by Principal / Assistant Principal continued
Food and Nutrition Plant Services Communications HR: Compensation,
Benefits & Substitutes
HR: Customer Service
HR: Employee Relations &
Development
Principal Mean Rating
Assistant Principal
Mean Rating
Principal Mean Rating
Assistant Principal
Mean Rating
Principal Mean Rating
Assistant Principal
Mean Rating
Principal Mean Rating
Assistant Principal
Mean Rating
Principal Mean Rating
Assistant Principal
Mean Rating
Principal Mean Rating
Assistant Principal
Mean Rating
Accessibility 4.49 4.50 3.66 4.33 4.35 4.68 3.73 4.22 4.40 4.37 4.16 4.13
Accuracy 4.43 4.50 3.66 4.26 4.35 4.68 3.82 4.37 4.30 4.41 4.00 4.20
Attitude 4.45 4.50 3.86 4.38 4.37 4.68 4.00 4.41 4.42 4.37 4.14 4.19
Operations 4.40 4.50 3.60 4.18 4.24 4.68 3.82 4.38 4.22 4.41 4.00 4.16
Timeliness 4.45 4.55 3.50 4.05 4.30 4.68 3.79 4.38 4.24 4.23 3.94 4.10
Totals 4.14 4.51 4.16 4.24 4.21 4.68 4.09 4.35 4.12 4.36 4.25 4.16
HR: Recruitment & Sourcing
Tech: Instructional Technology
Tech: Network Services
Tech: Technical Services & System
Integration
Tech: Technical Support
Overall
Principal Mean Rating
Assistant Principal
Mean Rating
Principal Mean Rating
Assistant Principal
Mean Rating
Principal Mean Rating
Principal Mean Rating
Assistant Principal
Mean Rating
Assistant Principal
Mean Rating
Principal Mean Rating
Assistant Principal
Mean Rating
Principal Mean Rating
Assistant Principal
Mean Rating
Accessibility 4.00 4.39 4.39 4.73 4.17 4.52 4.27 4.53 3.98 4.36 4.05 4.3.4
Accuracy 3.87 4.18 4.39 4.76 4.17 4.54 4.18 4.58 3.98 4.46 4.04 4.34
Attitude 4.00 4.27 4.37 4.63 4.22 4.52 4.16 4.53 3.98 4.44 4.11 4.35
Operations 3.89 4.09 4.33 4.73 4.20 4.52 4.18 4.53 3.93 4.36 3.97 4.28
Timeliness 3.74 4.18 4.28 4.61 4.17 4.52 4.20 4.53 3.81 4.28 3.95 4.21
Totals 4.24 4.22 4.06 4.69 4.00 4.52 4.00 4.54 3.84 4.38 4.02 4.30

28
November 2016 Overall Mean and Service Characteristic Mean Rating by Division and by Principal / Assistant Principal
Athletics Fine Arts Health Services /
Nurses Parent & Community
Engagement Security Student Services
Principal Mean Rating
Assistant Principal
Mean Rating
Principal Mean Rating
Assistant Principal
Mean Rating
Principal Mean Rating
Assistant Principal
Mean Rating
Principal Mean Rating
Assistant Principal
Mean Rating
Principal Mean Rating
Assistant Principal
Mean Rating
Principal Mean Rating
Assistant Principal
Mean Rating
Accessibility 4.00 4.10 4.29 4.71 4.39 4.39 4.10 4.21 4.04 4.42 3.83 4.42
Accuracy 3.42 4.32 4.35 4.47 4.47 4.35 4.25 4.17 3.91 4.29 4.13 4.54
Attitude 3.75 4.45 4.50 4.82 4.31 4.13 4.17 4.09 3.82 4.31 4.11 4.51
Operations 3.58 4.20 4.42 4.47 4.39 4.32 4.02 3.96 3.77 4.17 3.87 4.40
Timeliness 3.58 4.05 4.29 4.44 4.36 4.38 3.98 4.00 3.77 4.17 3.51 4.21
Totals 3.67 4.22 4.37 4.58 4.38 4.31 4.11 4.08 3.86 4.27 3.89 4.42
Transportation Education Support
Services Research and Accountability
Teaching and Learning
Transformational Learning
Finance
Principal Mean Rating
Assistant Principal
Mean Rating
Principal Mean Rating
Assistant Principal
Mean Rating
Principal Mean Rating
Principal Mean Rating
Assistant Principal
Mean Rating
Assistant Principal
Mean Rating
Principal Mean Rating
Assistant Principal
Mean Rating
Principal Mean Rating
Assistant Principal
Mean Rating
Accessibility 2.98 3.40 3.58 4.28 4.30 4.18 3.53 4.08 3.88 4.11 4.18 4.39
Accuracy 2.98 3.32 3.55 4.13 4.31 4.11 3.42 3.89 3.90 4.07 4.20 4.42
Attitude 3.23 3.54 3.74 4.30 4.44 4.24 3.80 4.09 4.00 4.18 4.20 4.28
Operations 2.94 3.10 3.52 4.01 4.28 4.14 3.40 3.89 3.95 4.04 4.12 4.35
Timeliness 2.83 3.06 3.40 4.13 4.19 4.20 3.40 3.92 3.73 4.07 4.10 4.22
Totals 2.99 3.28 3.56 4.17 4.31 4.17 3.51 3.97 3.89 4.09 4.16 4.33
Continued on Next Page

29
November 2016 Overall Mean and Service Characteristic Mean Rating by Division and by Principal / Assistant Principal continued
Food and Nutrition Plant Services Communications HR: Compensation,
Benefits & Substitutes
HR: Customer Service
HR: Employee Relations &
Development
Principal Mean Rating
Assistant Principal
Mean Rating
Principal Mean Rating
Assistant Principal
Mean Rating
Principal Mean Rating
Assistant Principal
Mean Rating
Principal Mean Rating
Assistant Principal
Mean Rating
Principal Mean Rating
Assistant Principal
Mean Rating
Principal Mean Rating
Assistant Principal
Mean Rating
Accessibility 4.45 4.52 3.54 4.05 4.54 4.47 3.67 3.98 4.06 4.02 4.08 3.72
Accuracy 4.43 4.45 3.60 3.97 4.58 4.41 3.93 3.98 4.11 4.00 4.10 3.78
Attitude 4.55 4.52 3.77 4.03 4.63 4.50 3.96 4.07 4.30 3.98 4.16 3.72
Operations 4.38 4.48 3.48 3.97 4.56 4.45 3.69 3.95 4.15 3.95 4.12 3.74
Timeliness 4.48 4.45 3.29 3.71 4.56 4.48 3.71 3.88 4.06 3.78 4.10 3.58
Totals 4.46 4.48 3.53 3.95 4.58 4.46 3.79 3.97 4.14 3.95 4.11 3.71
HR: Recruitment & Sourcing
Tech: Instructional Technology
Tech: Network Services
Tech: Technical Services & System
Integration
Tech: Technical Support
Overall
Principal Mean Rating
Assistant Principal
Mean Rating
Principal Mean Rating
Assistant Principal
Mean Rating
Principal Mean Rating
Principal Mean Rating
Assistant Principal
Mean Rating
Assistant Principal
Mean Rating
Principal Mean Rating
Assistant Principal
Mean Rating
Principal Mean Rating
Assistant Principal
Mean Rating
Accessibility 3.88 3.94 4.49 4.48 4.26 4.21 4.14 4.31 3.98 4.13 3.99 4.17
Accuracy 3.90 3.86 4.44 4.42 4.21 4.27 4.12 4.28 4.02 4.21 4.01 4.13
Attitude 3.94 3.94 4.51 4.48 4.26 4.21 4.19 4.34 4.04 4.33 4.09 4.20
Operations 3.75 3.78 4.42 4.42 4.18 4.12 4.14 4.24 4.00 4.23 3.95 4.06
Timeliness 3.69 3.67 4.44 4.48 4.28 4.18 4.12 4.28 4.00 4.02 3.89 4.01
Totals 3.83 3.84 4.46 4.46 4.24 4.20 4.14 4.29 4.01 4.18 3.99 4.11
30
April 2016 Overall Mean and Service Characteristic Mean Rating by Division and by Principal / Assistant Principal
Athletics Communication Educational Support
Services Finance Food and Nutrition
Health Services / Nurses
Principal Mean Rating
Assistant Principal
Mean Rating
Principal Mean Rating
Assistant Principal
Mean Rating
Principal Mean Rating
Assistant Principal
Mean Rating
Principal Mean Rating
Assistant Principal
Mean Rating
Principal Mean Rating
Assistant Principal
Mean Rating
Principal Mean Rating
Assistant Principal
Mean Rating
Accessibility 3.57 4.14 4.40 4.38 3.20 3.84 4.24 4.26 4.52 4.45 4.14 4.52
Accuracy 2.81 4.14 4.42 4.48 3.16 3.95 4.20 4.28 4.57 4.48 4.31 4.50
Attitude 3.52 4.24 4.47 4.48 3.44 3.81 4.24 4.23 4.55 4.45 4.17 4.37
Operations 2.76 4.15 4.42 4.41 3.00 3.65 4.09 4.25 4.55 4.48 4.19 4.38
Timeliness 3.00 4.10 4.40 4.45 3.00 3.63 3.93 4.10 4.52 4.48 4.24 4.40
Totals 3.13 4.15 4.42 4.44 3.16 3.78 4.14 4.22 4.54 4.47 4.21 4.43
HR: Compensation, Benefits & Substitutes
HR: Customer Service
HR: Employee Relations &
Development
HR: Recruitment & Sourcing
Parent & Community Engagement
Plant Services
Principal Mean Rating
Assistant Principal
Mean Rating
Principal Mean Rating
Assistant Principal
Mean Rating
Principal Mean Rating
Principal Mean Rating
Assistant Principal
Mean Rating
Assistant Principal
Mean Rating
Principal Mean Rating
Assistant Principal
Mean Rating
Principal Mean Rating
Assistant Principal
Mean Rating
Accessibility 3.29 3.68 3.82 3.38 3.70 3.33 3.51 3.34 3.91 3.93 3.58 4.28
Accuracy 3.60 3.85 3.80 3.55 3.60 3.46 3.44 3.46 3.93 3.90 3.53 4.22
Attitude 3.76 3.83 4.13 3.50 3.84 3.34 3.67 3.49 4.09 3.93 3.76 4.22
Operations 3.38 3.80 3.78 3.45 3.58 3.40 3.33 3.40 3.80 3.93 3.51 4.11
Timeliness 3.29 3.70 3.64 3.43 3.47 3.26 3.31 3.26 3.70 4.00 3.33 4.11
Totals 3.46 3.77 3.84 3.46 3.64 3.36 3.45 3.39 3.89 3.94 3.54 4.19
Continued on Next Page
31
April 2016 Overall Mean and Service Characteristic Mean Rating by Division and by Principal / Assistant Principal continued
Research and Accountability
Security Student Services Teaching and
Learning
Technology: Instructional Technology
Technology: Network Services
Principal Mean Rating
Assistant Principal
Mean Rating
Principal Mean Rating
Assistant Principal
Mean Rating
Principal Mean Rating
Assistant Principal
Mean Rating
Principal Mean Rating
Assistant Principal
Mean Rating
Principal Mean Rating
Assistant Principal
Mean Rating
Principal Mean Rating
Assistant Principal
Mean Rating
Accessibility 4.51 4.30 3.71 4.24 3.78 4.44 3.64 3.95 4.11 4.24 3.86 4.10
Accuracy 4.51 4.30 3.69 4.24 3.96 4.51 3.44 3.93 3.91 4.30 3.86 4.10
Attitude 4.58 4.32 3.62 4.12 4.02 4.37 3.73 3.93 4.18 4.30 3.91 4.15
Operations 4.47 4.32 3.60 4.12 3.89 4.35 3.49 3.95 3.91 4.22 3.84 4.08
Timeliness 4.42 4.22 3.49 4.20 3.67 4.30 3.53 3.95 3.95 4.27 3.88 4.10
Totals 4.50 4.29 3.62 4.19 3.86 4.40 3.57 3.94 4.01 4.26 3.87 4.11
Technology: Technical Services & System Integration
Technology: Technical Support
Transformational Learning
Transportation Overall
Principal Mean Rating
Assistant Principal
Mean Rating
Principal Mean Rating
Assistant Principal
Mean Rating
Principal Mean Rating
Principal Mean Rating
Assistant Principal
Mean Rating
Assistant Principal
Mean Rating
Principal Mean Rating
Assistant Principal
Mean Rating
Accessibility 4.09 4.16 3.87 4.28 3.73 4.16 3.33 3.72 3.85 4.04
Accuracy 4.12 4.08 3.84 4.25 3.76 4.06 3.21 3.64 3.83 4.07
Attitude 3.98 4.16 3.98 4.15 3.91 4.22 3.26 3.74 3.95 4.05
Operations 4.05 4.11 3.93 4.23 3.69 4.16 2.95 3.53 3.76 4.01
Timeliness 4.02 4.13 3.84 4.20 3.64 4.19 3.02 3.47 3.71 3.98
Totals 4.05 4.13 3.89 4.22 3.75 4.16 3.15 3.62 3.82 4.03
39
November 2015 Overall Mean and Service Characteristic Mean Rating by Division and by Principal / Assistant Principal
Accountability, Planning and Testing
Administration Communication Educational Support
Services Finance Food and Nutrition
Principal Mean Rating
Assistant Principal
Mean Rating
Principal Mean Rating
Assistant Principal
Mean Rating
Principal Mean Rating
Assistant Principal
Mean Rating
Principal Mean Rating
Assistant Principal
Mean Rating
Principal Mean Rating
Assistant Principal
Mean Rating
Principal Mean Rating
Assistant Principal
Mean Rating
Accessibility 4.47 4.26 3.28 3.99 4.32 4.14 3.09 3.81 4.28 4.21 4.29 4.31
Accuracy 4.19 4.15 3.36 4.09 4.26 4.14 3.21 3.84 4.32 4.23 4.33 4.29
Attitude 4.62 4.39 3.42 4.16 4.43 4.22 3.19 3.94 4.25 4.14 4.39 4.22
Operations 4.38 4.10 3.17 3.93 4.31 4.05 3.04 3.79 4.21 4.15 4.30 4.21
Timeliness 4.30 4.20 3.11 3.80 4.23 4.11 2.96 3.68 4.23 4.12 4.31 4.27
Totals 4.39 4.22 3.27 3.99 4.31 4.13 3.10 3.81 4.26 4.17 4.33 4.26
Human Resources Plant Services Teaching and
Learning Technology
Transformational Learning
Overall
Principal Mean Rating
Assistant Principal
Mean Rating
Principal Mean Rating
Assistant Principal
Mean Rating
Principal Mean Rating
Principal Mean Rating
Assistant Principal
Mean Rating
Assistant Principal
Mean Rating
Principal Mean Rating
Assistant Principal
Mean Rating
Principal Mean Rating
Assistant Principal
Mean Rating
Accessibility 2.35 3.06 3.75 4.33 3.43 4.06 4.06 4.12 3.78 4.02 3.74 4.01
Accuracy 2.55 3.28 3.67 4.16 3.33 4.03 4.06 4.18 3.73 3.95 3.73 4.02
Attitude 2.92 3.42 3.86 4.43 3.61 4.09 4.18 4.14 3.92 4.07 3.89 4.10
Operations 2.35 3.02 3.56 4.18 3.32 3.97 3.96 4.14 3.66 3.93 3.66 3.94
Timeliness 2.02 2.90 3.51 4.17 3.27 4.02 3.94 3.92 3.65 3.93 3.60 3.91
Totals 2.44 3.13 3.67 4.25 3.39 4.03 4.04 4.10 3.75 3.98 3.72 4.00

39
May 2015 Overall Mean and Service Characteristic Mean Rating by Division and by Principal / Assistant Principal
Accountability, Planning and Testing
Communication Curriculum and
Instruction Business Office Food Service Plant Services
Principal Mean Rating
Assistant Principal
Mean Rating
Principal Mean Rating
Assistant Principal
Mean Rating
Principal Mean Rating
Assistant Principal
Mean Rating
Principal Mean Rating
Assistant Principal
Mean Rating
Principal Mean Rating
Assistant Principal
Mean Rating
Principal Mean Rating
Assistant Principal
Mean Rating
Accessibility 4.58 4.16 4.58 4.17 3.40 3.95 4.13 4.03 4.35 4.16 3.97 4.09
Accuracy 4.27 4.19 4.27 4.15 3.38 3.86 4.23 4.03 4.22 4.09 3.94 4.02
Attitude 4.51 4.26 4.51 4.20 3.75 4.05 4.23 3.94 4.22 4.17 4.00 4.16
Operations 4.29 4.11 4.29 4.09 3.30 3.83 4.13 4.00 4.22 4.12 3.82 3.97
Timeliness 4.27 4.15 4.27 4.10 3.15 3.79 3.92 3.96 4.28 4.20 3.64 3.92
Totals 4.38 4.17 4.38 4.14 3.40 3.90 4.13 3.99 4.26 4.15 3.88 4.03
Administration Human Resources Technology and
Telecommunications Overall
Principal Mean Rating
Assistant Principal
Mean Rating
Principal Mean Rating
Assistant Principal
Mean Rating
Principal Mean Rating
Assistant Principal
Mean Rating
Principal Mean Rating
Assistant Principal
Mean Rating
Accessibility 4.05 4.02 3.24 3.60 4.15 4.03 4.03 4.02
Accuracy 4.08 4.14 3.34 3.68 4.11 4.03 4.00 4.02
Attitude 4.18 4.24 3.61 3.81 4.26 4.18 4.13 4.11
Operations 4.10 4.07 3.03 3.51 3.97 4.02 3.91 3.97
Timeliness 3.82 4.04 2.63 3.37 3.92 3.97 3.77 3.94
Totals 4.05 4.10 3.17 3.59 4.08 4.04 3.97 4.01

39
February 2015 Overall Mean and Service Characteristic Mean Rating by Division and by Principal / Assistant Principal
Accountability, Planning and Testing
Communication Curriculum and
Instruction Business Office Food Service Plant Services
Principal Mean Rating
Assistant Principal
Mean Rating
Principal Mean Rating
Assistant Principal
Mean Rating
Principal Mean Rating
Assistant Principal
Mean Rating
Principal Mean Rating
Assistant Principal
Mean Rating
Principal Mean Rating
Assistant Principal
Mean Rating
Principal Mean Rating
Assistant Principal
Mean Rating
Accessibility 4.35 4.26 4.26 3.95 3.47 3.76 4.18 4.00 4.38 4.43 4.15 3.94
Accuracy 4.13 4.30 4.28 4.20 3.45 3.90 4.13 4.11 4.36 4.13 4.00 4.06
Attitude 4.58 4.30 4.32 4.11 3.98 4.00 4.16 4.00 4.44 4.27 4.20 4.11
Operations 4.30 4.32 4.22 4.10 3.46 3.84 4.02 4.17 4.40 4.40 4.03 3.94
Timeliness 4.26 4.26 4.13 4.20 3.32 3.80 3.89 4.05 4.39 4.40 3.80 3.76
Totals 4.32 4.29 4.24 4.11 3.53 3.86 4.08 4.06 4.39 4.32 4.03 3.97
Administration Human Resources Technology and
Telecommunications Overall
Principal Mean Rating
Assistant Principal
Mean Rating
Principal Mean Rating
Assistant Principal
Mean Rating
Principal Mean Rating
Assistant Principal
Mean Rating
Principal Mean Rating
Assistant Principal
Mean Rating
Accessibility 3.86 4.26 2.81 3.32 4.37 4.20 3.98 4.01
Accuracy 3.98 4.37 2.86 3.58 4.26 4.30 3.94 4.11
Attitude 4.09 4.21 3.19 3.58 4.47 4.35 4.16 4.10
Operations 4.02 4.28 2.63 3.50 4.24 4.10 3.92 4.07
Timeliness 3.68 4.26 2.02 3.37 4.12 4.00 3.74 4.01
Totals 3.93 4.28 2.70 3.47 4.29 4.19 3.95 4.06

39
October 2014 Overall Mean and Service Characteristic Mean Rating by Division and by Principal / Assistant Principal
Accountability, Planning and Testing
Communication Curriculum and
Instruction Business Office Food Service Plant Services
Principal Mean Rating
Assistant Principal
Mean Rating
Principal Mean Rating
Assistant Principal
Mean Rating
Principal Mean Rating
Assistant Principal
Mean Rating
Principal Mean Rating
Assistant Principal
Mean Rating
Principal Mean Rating
Assistant Principal
Mean Rating
Principal Mean Rating
Assistant Principal
Mean Rating
Accessibility 4.18 4.20 4.25 4.24 3.53 3.94 3.94 4.02 4.34 4.15 3.81 4.00
Accuracy 4.08 4.10 4.19 4.18 3.45 3.94 4.01 4.07 4.17 4.07 3.70 3.87
Attitude 4.33 4.29 4.31 4.29 3.95 4.09 4.13 4.01 4.35 4.08 3.88 3.95
Operations 4.11 4.05 4.20 4.16 3.41 3.84 3.97 4.01 4.25 4.09 3.64 3.79
Timeliness 4.00 4.15 4.15 4.22 3.27 3.83 3.90 3.99 4.28 4.15 3.39 3.65
Totals 4.14 4.16 4.22 4.22 3.52 3.93 3.99 4.02 4.28 4.11 3.69 3.85
Administration Human Resources Technology and
Telecommunications Overall
Principal Mean Rating
Assistant Principal
Mean Rating
Principal Mean Rating
Assistant Principal
Mean Rating
Principal Mean Rating
Assistant Principal
Mean Rating
Principal Mean Rating
Assistant Principal
Mean Rating
Accessibility 3.96 4.14 2.97 3.63 3.89 4.10 3.88 4.05
Accuracy 4.04 4.24 3.17 3.69 3.83 4.13 3.85 4.04
Attitude 4.08 4.26 3.21 3.60 4.01 4.16 4.03 4.09
Operations 3.96 4.26 3.00 3.56 3.64 4.08 3.80 3.99
Timeliness 3.88 4.16 2.65 3.44 3.77 4.07 3.70 3.97
Totals 3.98 4.21 3.00 3.58 3.83 4.11 3.85 4.03
39
May 2014 Overall Mean and Service Characteristic Mean Rating by Division and by Principal / Assistant Principal
Accountability, Planning and Testing
Communication Curriculum and
Instruction Business Office Food Service Plant Services
Principal Mean Rating
Assistant Principal
Mean Rating
Principal Mean Rating
Assistant Principal
Mean Rating
Principal Mean Rating
Assistant Principal
Mean Rating
Principal Mean Rating
Assistant Principal
Mean Rating
Principal Mean Rating
Assistant Principal
Mean Rating
Principal Mean Rating
Assistant Principal
Mean Rating
Accessibility 4.42 4.44 4.19 4.28 3.61 3.82 4.14 4.13 4.34 4.28 3.94 4.07
Accuracy 4.25 4.30 4.36 4.28 3.53 3.79 4.31 4.13 4.26 4.19 3.85 4.03
Attitude 4.56 4.47 4.42 4.28 4.00 4.00 4.20 3.96 4.40 4.22 4.09 4.14
Operations 4.36 4.38 4.26 4.13 3.51 3.81 4.11 4.04 4.37 4.19 3.88 3.93
Timeliness 4.25 4.29 4.11 4.13 3.34 3.79 4.11 3.96 4.26 4.33 3.71 3.79
Totals 4.37 4.38 4.27 4.22 3.60 3.84 4.18 4.04 4.33 4.24 3.89 3.99
Administration Human Resources Technology and
Telecommunications Overall
Principal Mean Rating
Assistant Principal
Mean Rating
Principal Mean Rating
Assistant Principal
Mean Rating
Principal Mean Rating
Assistant Principal
Mean Rating
Principal Mean Rating
Assistant Principal
Mean Rating
Accessibility 3.74 4.03 3.54 3.88 3.85 4.23 3.98 4.13
Accuracy 3.89 4.27 3.60 3.97 3.88 4.23 3.99 4.13
Attitude 3.69 4.21 3.77 3.97 3.91 4.27 4.12 4.18
Operations 3.74 4.21 3.54 3.84 3.73 4.27 3.95 4.09
Timeliness 3.54 4.12 3.03 3.69 3.59 4.31 3.77 4.04
Totals 3.72 4.17 3.50 3.87 3.79 4.26 3.96 4.11

40
February 2014 Overall Mean and Service Characteristic Mean Rating by Division and by Principal / Assistant Principal
Accountability, Planning and Testing
Communication Curriculum and
Instruction Business Office Food Service Plant Services
Principal Mean Rating
Assistant Principal
Mean Rating
Principal Mean Rating
Assistant Principal
Mean Rating
Principal Mean Rating
Assistant Principal
Mean Rating
Principal Mean Rating
Assistant Principal
Mean Rating
Principal Mean Rating
Assistant Principal
Mean Rating
Principal Mean Rating
Assistant Principal
Mean Rating
Accessibility 4.19 4.20 4.29 4.29 3.60 3.90 4.15 4.29 4.21 4.41 3.46 4.41
Accuracy 4.00 4.29 4.24 4.43 3.68 3.95 4.27 4.43 4.21 4.45 3.45 4.28
Attitude 4.44 4.32 4.32 4.29 3.99 4.10 4.16 4.36 4.36 4.39 3.81 4.45
Operations 4.21 4.13 4.17 4.27 3.53 3.88 4.18 4.30 4.15 4.37 3.51 4.07
Timeliness 3.97 3.95 3.94 4.15 3.36 3.88 4.16 4.39 4.16 4.39 3.28 3.93
Totals 4.16 4.18 4.19 4.29 3.63 3.94 4.19 4.35 4.22 4.40 3.50 4.23
Administration Human Resources Technology and
Telecommunications Overall
Principal Mean Rating
Assistant Principal
Mean Rating
Principal Mean Rating
Assistant Principal
Mean Rating
Principal Mean Rating
Assistant Principal
Mean Rating
Principal Mean Rating
Assistant Principal
Mean Rating
Accessibility 3.78 4.11 3.60 3.67 3.89 4.35 3.91 4.16
Accuracy 3.90 4.17 3.89 3.89 4.00 4.43 3.96 4.25
Attitude 3.96 4.31 3.81 3.77 4.08 4.50 4.10 4.27
Operations 3.86 4.15 3.65 3.69 3.88 4.32 3.91 4.12
Timeliness 3.59 4.11 3.46 3.57 3.72 4.31 3.74 4.06
Totals 3.82 4.17 3.68 3.72 3.91 4.38 3.92 4.17
41
Appendix B Table 1. Overall District Mean and Support Characteristic Mean by Survey Administration [All Administrations]
Characteristics Mean
05/2013 N = 123
Mean 11/2013 N = 142
Mean 02/2014 N = 126
Mean 05/2014 N = 70
Mean 10/2014 N = 181
Mean 02/2015 N = 85
Mean 05/2015 N = 165
Mean 11/2015 N = 161
Mean 04/20161
N = 89
Mean 11/20162
N = 133
Accessibility 4.02 3.86 3.99 4.05 3.97 3.99 4.02 3.89 3.94 4.07
Accuracy 4.07 3.93 4.05 4.06 3.96 4.00 4.01 3.89 3.94 4.07
Attitude 4.17 4.00 4.16 4.14 4.07 4.14 4.12 4.01 4.00 4.14
Operations 3.96 3.86 3.97 4.02 3.91 3.97 3.95 3.81 3.88 4.00
Timeliness 3.88 3.71 3.84 3.90 3.85 3.83 3.89 3.77 3.84 3.95
Overall Mean 4.02 3.87 4.00 4.03 3.95 3.99 4.00 3.87 3.92 4.05