april 18-19, 2009 homebuyers fair leslie appleton-young c.a.r. vice president and chief economist...
TRANSCRIPT

April 18-19, 2009
HOMEBUYERS FAIR Leslie Appleton-Young
C.A.R. Vice President and Chief Economist
2009 California Real Estate:Opportunities for First Time-Buyers

California Real Estate
Market Update

Sales Hit Bottom in 2007, Up in 2008
UNITS/MEDIAN PRICE $
SOURCE: California Association of REALTORS®
0
100,000
200,000
300,000
400,000
500,000
600,000
700,000
19
70
19
72
19
74
19
76
19
78
19
80
19
82
19
84
19
86
19
88
19
90
19
92
19
94
19
96
19
98
20
00
20
02
20
04
20
06
20
08
Sales of Existing Detached Homes Median Price
California Sales of Existing Homes and Median Price
-61% -25%
-44%
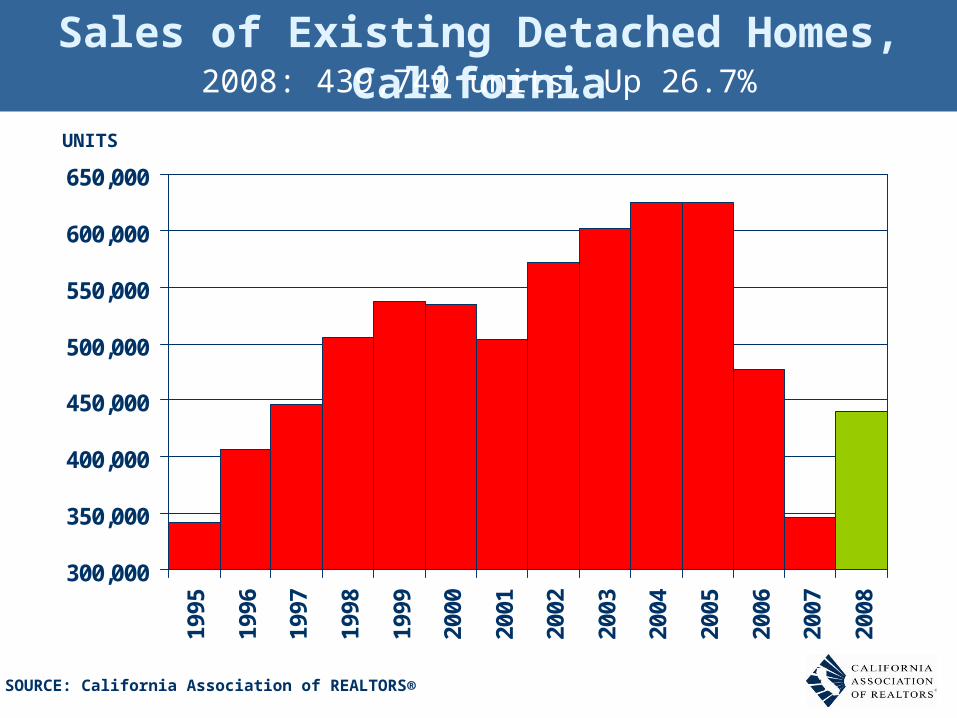
Sales of Existing Detached Homes, California2008: 439,740 units, Up 26.7%
300,000
350,000
400,000
450,000
500,000
550,000
600,000
650,00019
95
1996
1997
1998
1999
2000
2001
2002
2003
2004
2005
2006
2007
2008
UNITS
SOURCE: California Association of REALTORS®

Sales of Existing Detached Homes and Pacific West Consumer Confidence
California, Feb. 2009 Sales: 620,410 Units, Up 91.6% YTD, Up 83.0% YTY
0
100,000
200,000
300,000
400,000
500,000
600,000
700,000
Ja
n-0
0A
pr-
00
Ju
l-0
0O
ct-
00
Ja
n-0
1A
pr-
01
Ju
l-0
1O
ct-
01
Ja
n-0
2A
pr-
02
Ju
l-0
2O
ct-
02
Ja
n-0
3A
pr-
03
Ju
l-0
3O
ct-
03
Ja
n-0
4A
pr-
04
Ju
l-0
4O
ct-
04
Ja
n-0
5A
pr-
05
Ju
l-0
5O
ct-
05
Ja
n-0
6A
pr-
06
Ju
l-0
6O
ct-
06
Ja
n-0
7A
pr-
07
Ju
l-0
7O
ct-
07
Ja
n-0
8A
pr-
08
Ju
l-0
8O
ct-
08
Ja
n-0
9
0
20
40
60
80
100
120
140
160
Sales Consumer Confidence INDEXUNITS
SOURCE: California Association of REALTORS®; The Conference Board
*Sales are seasonally adjusted and annualized

4,000,000
4,200,000
4,400,000
4,600,000
4,800,000
5,000,000
5,200,000
5,400,000
5,600,000
5,800,000
6,000,000
6,200,000
6,400,000
6,600,000J
an
-00
Ap
r-0
0J
ul-
00
Oc
t-0
0J
an
-01
Ap
r-0
1J
ul-
01
Oc
t-0
1J
an
-02
Ap
r-0
2J
ul-
02
Oc
t-0
2J
an
-03
Ap
r-0
3J
ul-
03
Oc
t-0
3J
an
-04
Ap
r-0
4J
ul-
04
Oc
t-0
4J
an
-05
Ap
r-0
5J
ul-
05
Oc
t-0
5J
an
-06
Ap
r-0
6J
ul-
06
Oc
t-0
6J
an
-07
Ap
r-0
7J
ul-
07
Oc
t-0
7J
an
-08
Ap
r-0
8J
ul-
08
Oc
t-0
8J
an
-09
$130,000$135,000$140,000$145,000$150,000$155,000$160,000$165,000$170,000$175,000$180,000$185,000$190,000$195,000$200,000$205,000$210,000$215,000$220,000$225,000$230,000$235,000$240,000
Existing Single-Family Home Sales Median Price
US Sales and Median PriceFeb. 2009 - Sales: Down 3.6% YTY, Median Price: Down 15.0%
YTY

Median Price of Existing Detached HomesCalifornia, February 2009: $247,590, Down 40.8% YTY
$0
$100,000
$200,000
$300,000
$400,000
$500,000
$600,000
$700,000J
an
-00
Ju
l-0
0
Ja
n-0
1
Ju
l-0
1
Ja
n-0
2
Ju
l-0
2
Ja
n-0
3
Ju
l-0
3
Ja
n-0
4
Ju
l-0
4
Ja
n-0
5
Ju
l-0
5
Ja
n-0
6
Ju
l-0
6
Ja
n-0
7
Ju
l-0
7
Ja
n-0
8
Ju
l-0
8
Ja
n-0
9
SOURCE: California Association of REALTORS®

82%
0%
10%
20%
30%
40%
50%
60%
70%
80%
90%
20
04
.10
20
05
.01
20
05
.04
20
05
.07
20
05
.10
20
06
.01
20
06
.04
20
06
.07
20
06
.10
20
07
.01
20
07
.04
20
07
.07
20
07
.10
20
08
.01
20
08
.04
20
08
.07
20
08
.10
Under 500 500 to 999 1 Mil +
Sales By Price Range
SOURCE: Mortgage Bankers Association, C.A.R.
Financial Turmoil: 8/07-Now
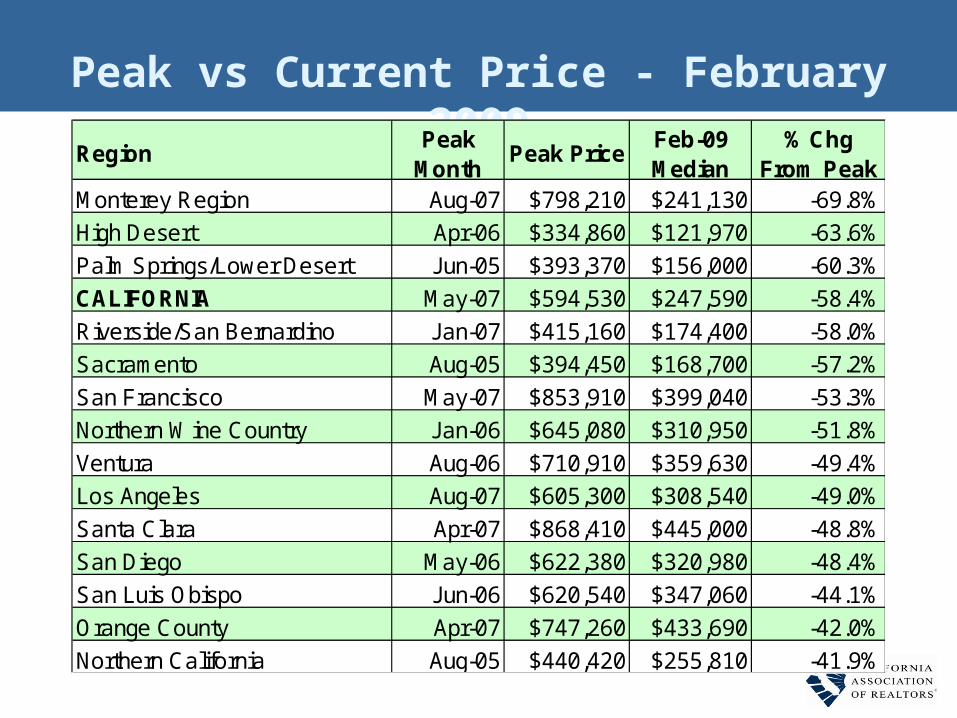
Peak vs Current Price - February 2009
RegionPeak
MonthPeak Price
Feb-09 Median
% Chg From Peak
Monterey Region Aug-07 $798,210 $241,130 -69.8%
High Desert Apr-06 $334,860 $121,970 -63.6%
Palm Springs/Lower Desert Jun-05 $393,370 $156,000 -60.3%
CALIFORNIA May-07 $594,530 $247,590 -58.4%
Riverside/San Bernardino Jan-07 $415,160 $174,400 -58.0%
Sacramento Aug-05 $394,450 $168,700 -57.2%
San Francisco May-07 $853,910 $399,040 -53.3%
Northern Wine Country Jan-06 $645,080 $310,950 -51.8%
Ventura Aug-06 $710,910 $359,630 -49.4%
Los Angeles Aug-07 $605,300 $308,540 -49.0%
Santa Clara Apr-07 $868,410 $445,000 -48.8%
San Diego May-06 $622,380 $320,980 -48.4%
San Luis Obispo Jun-06 $620,540 $347,060 -44.1%
Orange County Apr-07 $747,260 $433,690 -42.0%
Northern California Aug-05 $440,420 $255,810 -41.9%

Unsold Inventory IndexCalifornia, February 2009: 6.5 Months
0
2
4
6
8
10
12
14
16
18
20
Ja
n-8
8J
ul-
88
Ja
n-8
9J
ul-
89
Ja
n-9
0J
ul-
90
Ja
n-9
1J
ul-
91
Ja
n-9
2J
ul-
92
Ja
n-9
3J
ul-
93
Ja
n-9
4J
ul-
94
Ja
n-9
5J
ul-
95
Ja
n-9
6J
ul-
96
Ja
n-9
7J
ul-
97
Ja
n-9
8J
ul-
98
Ja
n-9
9J
ul-
99
Ja
n-0
0J
ul-
00
Ja
n-0
1J
ul-
01
Ja
n-0
2J
ul-
02
Ja
n-0
3J
ul-
03
Ja
n-0
4J
ul-
04
Ja
n-0
5J
ul-
05
Ja
n-0
6J
ul-
06
Ja
n-0
7J
ul-
07
Ja
n-0
8J
ul-
08
Ja
n-0
9
SOURCE: California Association of REALTORS®
MONTHS

76.8%75.4%
67.3%66.2%
53.8%
47.6%44.1%
42.7%
7.9%
19.9%
0%
20%
40%
60%
80%
Men
docino
Mar
in
Los
Ange
les
Oran
ge
Napa
Sono
ma
Sacr
amen
to
Rive
rside/
San
Bern
ardino Ke
rn
Sola
no
Distressed Sales
Distressed Sales to Total Sales RatioBi-Furcated Marketplace

Proportion of First-Time Home Buyers2008: 35.9%
38.3%
0%
10%
20%
30%
40%
50%
60%
81 83 85 87 89 91 93 95 97 99 01 03 05 07
% First-Time Home Buyers Long Run Average
Q. Was the buyer a first-time buyer?

$0
$500
$1,000
$1,500
$2,000
$2,500
$3,000
$3,500
$4,000
20
00
Q1
20
01
Q1
20
02
Q1
20
03
Q1
20
04
Q1
20
05
Q1
20
06
Q1
20
07
Q1
20
08
Q1
0%
10%
20%
30%
40%
50%
60%
70%
80%
PITI Payment as Share of Income % ChangePITI/Month
Entry-Level Monthly House Payment and Payment as Share of Median Household Income
SOURCE: California Association of REALTORS®
Peak 2007-Q2: $3,380/moLatest 2008-Q4: $1,630/mo
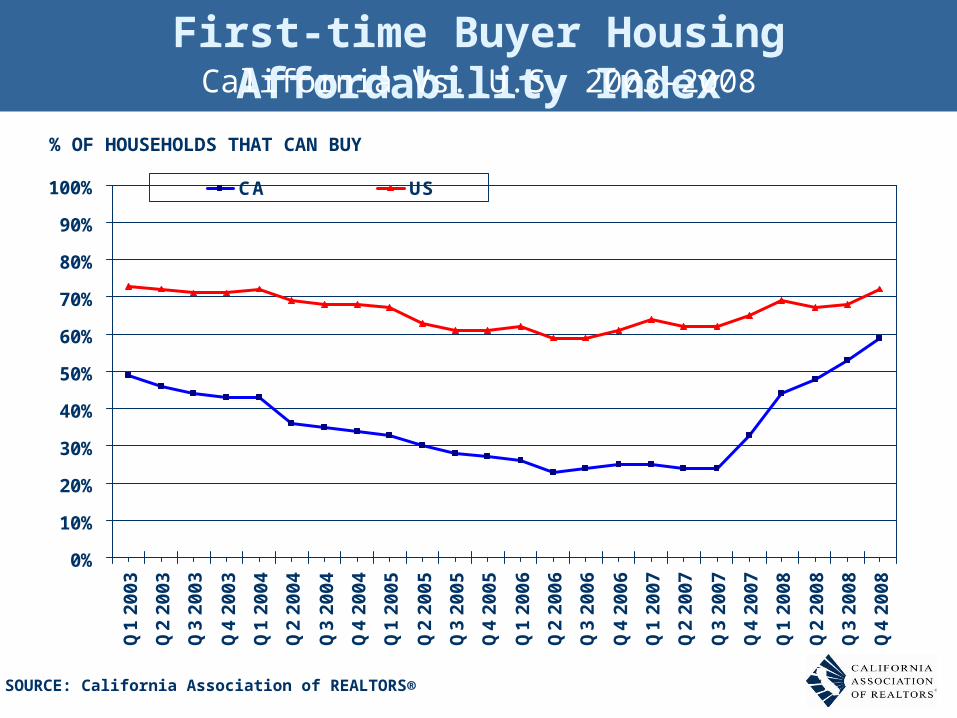
First-time Buyer Housing Affordability IndexCalifornia Vs. U.S. 2003-2008
0%
10%
20%
30%
40%
50%
60%
70%
80%
90%
100%
Q1
20
03
Q2
20
03
Q3
20
03
Q4
20
03
Q1
20
04
Q2
20
04
Q3
20
04
Q4
20
04
Q1
20
05
Q2
20
05
Q3
20
05
Q4
20
05
Q1
20
06
Q2
20
06
Q3
20
06
Q4
20
06
Q1
20
07
Q2
20
07
Q3
20
07
Q4
20
07
Q1
20
08
Q2
20
08
Q3
20
08
Q4
20
08
CA US
% OF HOUSEHOLDS THAT CAN BUY
SOURCE: California Association of REALTORS®

Buyers See Opportunities in This Market…
10%
9%
67%
22%
39%
Price decreases motivated us
Low interest rates helped us move to abetter location, neighborhood
Likelihood that interest rates will move upmotivated us
Low interest rates helped us buy a largerhome
Moved to an area where it was moreaffordable
The Role Of Market ConditionsIn The Decision To Buy

Southern California Region
Economic Profile

Home Sales in Southern California Regions
0
500
1000
1500
2000
2500
3000
3500
High Desert Los Angeles Orange PalmSprings
Riverside/SB San Diego Sta. BarbaraArea
Ventura
Feb-08
Feb-09
SOURCE: California Association of REALTORS®
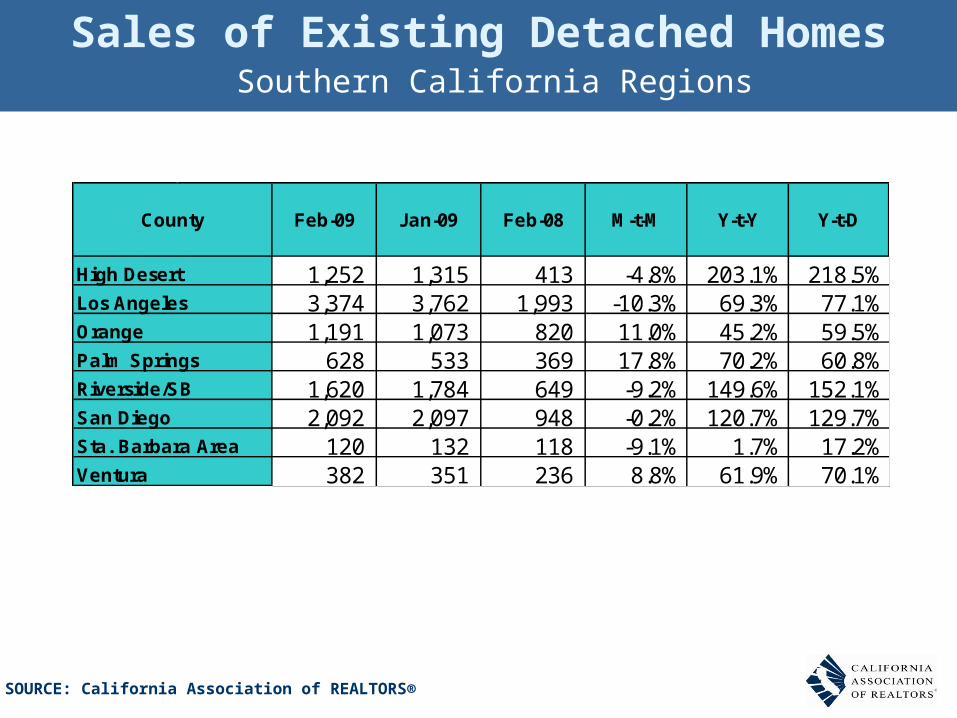
High Desert 1,252 1,315 413 -4.8% 203.1% 218.5%Los Angeles 3,374 3,762 1,993 -10.3% 69.3% 77.1%Orange 1,191 1,073 820 11.0% 45.2% 59.5%Palm Springs 628 533 369 17.8% 70.2% 60.8%Riverside/SB 1,620 1,784 649 -9.2% 149.6% 152.1%San Diego 2,092 2,097 948 -0.2% 120.7% 129.7%Sta. Barbara Area 120 132 118 -9.1% 1.7% 17.2%Ventura 382 351 236 8.8% 61.9% 70.1%
Y-t-DY-t-YCounty Feb-09 Jan-09 Feb-08 M-t-M
Sales of Existing Detached Homes
SOURCE: California Association of REALTORS®
Southern California Regions
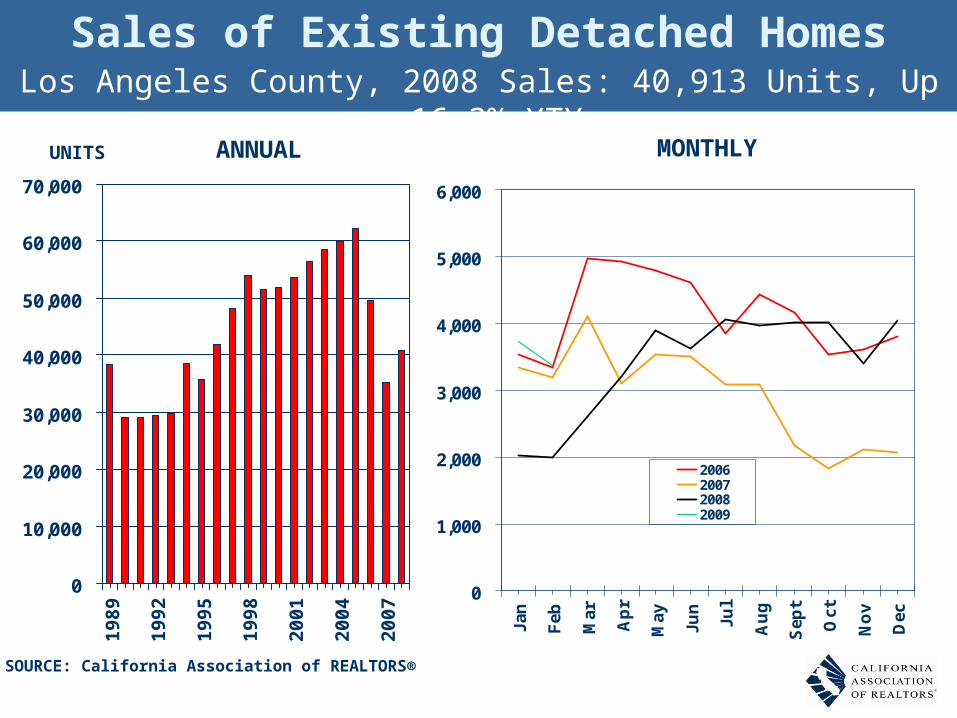
Sales of Existing Detached HomesLos Angeles County, 2008 Sales: 40,913 Units, Up 16.3% YTY
SOURCE: California Association of REALTORS®
UNITS
0
10,000
20,000
30,000
40,000
50,000
60,000
70,000
19
89
19
92
19
95
19
98
20
01
20
04
20
07
0
1,000
2,000
3,000
4,000
5,000
6,000
Jan
Feb
Mar
Ap
r
May
Jun
Jul
Au
g
Sep
t
Oct
No
v
Dec
2006200720082009
ANNUAL MONTHLY

County Feb-09 Jan-09 Feb-08
Los Angeles 7.7 7.6 18.5Orange 9.1 9.9 16.2Riverside/SB 5.6 5.5 19.3San Diego 3.9 4.0 14.5Santa Barbara 8.9 7.2 7.5Ventura 4.7 6.0 NASouthern California 6.4 6.5 17.2
Unsold Inventory Index (Months)
SOURCE: California Association of REALTORS®
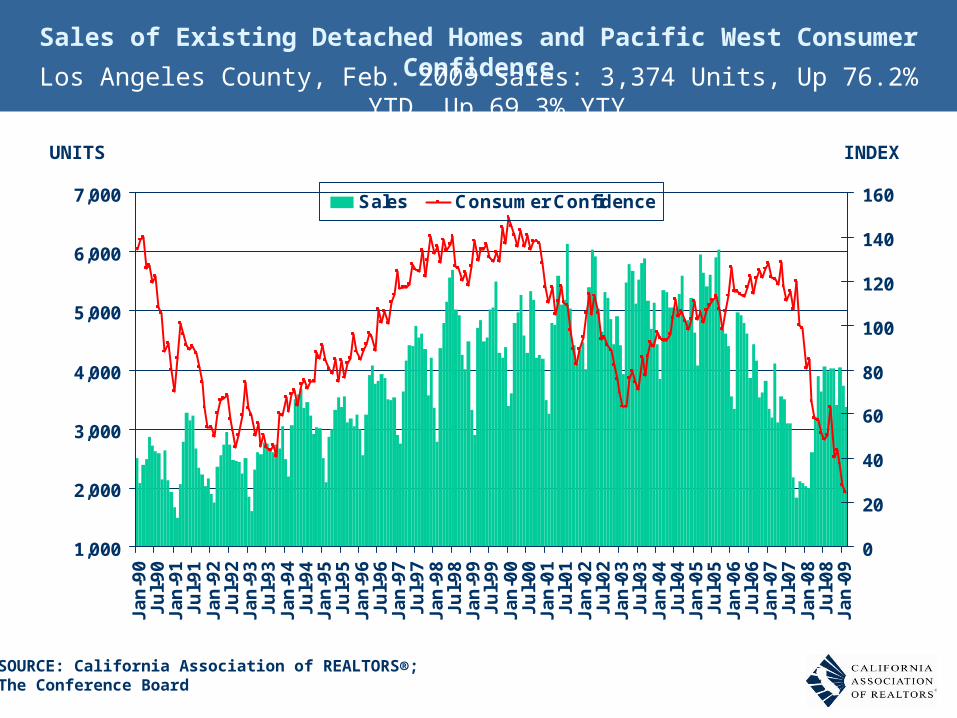
Sales of Existing Detached Homes and Pacific West Consumer Confidence
Los Angeles County, Feb. 2009 Sales: 3,374 Units, Up 76.2% YTD, Up 69.3% YTY
1,000
2,000
3,000
4,000
5,000
6,000
7,000
Ja
n-9
0J
ul-
90
Ja
n-9
1J
ul-
91
Ja
n-9
2J
ul-
92
Ja
n-9
3J
ul-
93
Ja
n-9
4J
ul-
94
Ja
n-9
5J
ul-
95
Ja
n-9
6J
ul-
96
Ja
n-9
7J
ul-
97
Ja
n-9
8J
ul-
98
Ja
n-9
9J
ul-
99
Ja
n-0
0J
ul-
00
Ja
n-0
1J
ul-
01
Ja
n-0
2J
ul-
02
Ja
n-0
3J
ul-
03
Ja
n-0
4J
ul-
04
Ja
n-0
5J
ul-
05
Ja
n-0
6J
ul-
06
Ja
n-0
7J
ul-
07
Ja
n-0
8J
ul-
08
Ja
n-0
9
0
20
40
60
80
100
120
140
160Sales Consumer Confidence
SOURCE: California Association of REALTORS®; The Conference Board
INDEXUNITS
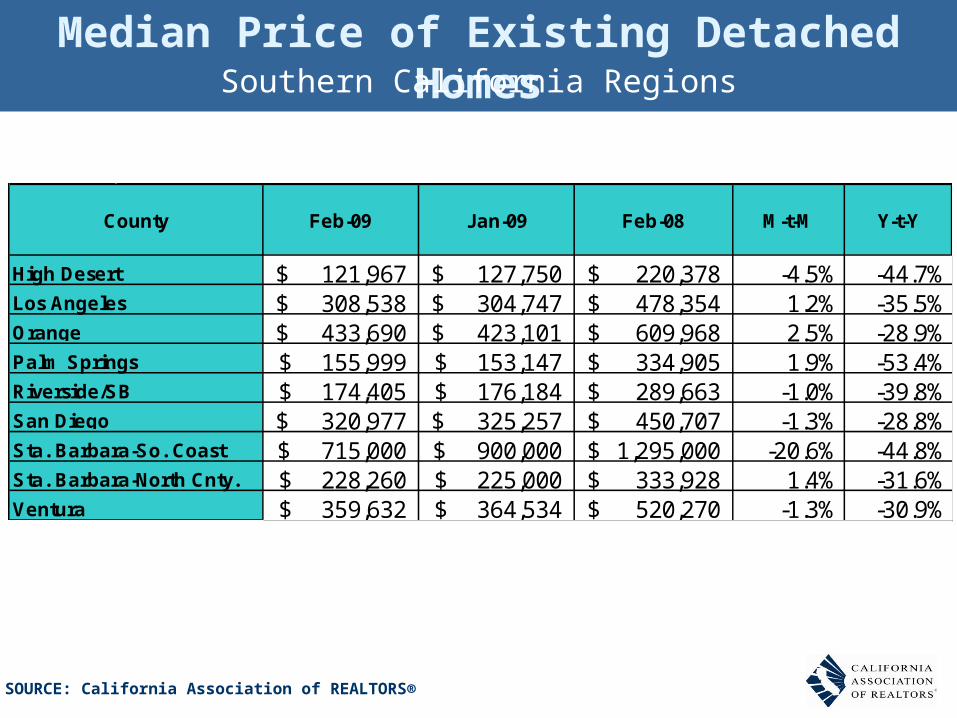
High Desert 121,967$ 127,750$ 220,378$ -4.5% -44.7%Los Angeles 308,538$ 304,747$ 478,354$ 1.2% -35.5%
433,690$ 423,101$ 609,968$ 2.5% -28.9%Palm Springs 155,999$ 153,147$ 334,905$ 1.9% -53.4%
174,405$ 176,184$ 289,663$ -1.0% -39.8%320,977$ 325,257$ 450,707$ -1.3% -28.8%715,000$ 900,000$ 1,295,000$ -20.6% -44.8%
Sta. Barbara-North Cnty. 228,260$ 225,000$ 333,928$ 1.4% -31.6%359,632$ 364,534$ 520,270$ -1.3% -30.9%
Y-t-Y
San Diego
County Feb-09 Jan-09 Feb-08 M-t-M
Orange
Riverside/SB
Ventura
Sta. Barbara-So. Coast
Median Price of Existing Detached HomesSouthern California Regions
SOURCE: California Association of REALTORS®

Median Price of Existing Detached HomesSouthern California, Feb. 2009: $261,810 Down 39.6% YTY
$0
$100,000
$200,000
$300,000
$400,000
$500,000
$600,000
$700,000J
an
-00
Ma
y-0
0
Se
p-0
0
Ja
n-0
1
Ma
y-0
1
Se
p-0
1
Ja
n-0
2
Ma
y-0
2
Se
p-0
2
Ja
n-0
3
Ma
y-0
3
Se
p-0
3
Ja
n-0
4
Ma
y-0
4
Se
p-0
4
Ja
n-0
5
Ma
y-0
5
Se
p-0
5
Ja
n-0
6
Ma
y-0
6
Se
p-0
6
Ja
n-0
7
Ma
y-0
7
Se
p-0
7
Ja
n-0
8
Ma
y-0
8
Se
p-0
8
Ja
n-0
9
SOURCE: California Association of REALTORS®

Median Price Annual ComparisonLos Angeles County, 2008: $402,110, Down 32.3% YTY
SOURCE: California Association of REALTORS®
$-
$100,000
$200,000
$300,000
$400,000
$500,000
$600,000
$700,000
1989
1991
1993
1995
1997
1999
2001
2003
2005
2007
$-
$100,000
$200,000
$300,000
$400,000
$500,000
$600,000
$700,000
Jan
Feb Mar
Ap
r
May
Jun
Jul
Au
g
Sep
t
Oct
No
v
Dec
2006200720082009
MONTHLYANNUAL

Unsold Inventory IndexLos Angeles County, February 2009: 7.7 Months
0
5
10
15
20
25
30
Jan
-88
Jul-
88Ja
n-8
9Ju
l-89
Jan
-90
Jul-
90Ja
n-9
1Ju
l-91
Jan
-92
Jul-
92Ja
n-9
3Ju
l-93
Jan
-94
Jul-
94Ja
n-9
5Ju
l-95
Jan
-96
Jul-
96Ja
n-9
7Ju
l-97
Jan
-98
Jul-
98Ja
n-9
9Ju
l-99
Jan
-00
Jul-
00Ja
n-0
1Ju
l-01
Jan
-02
Jul-
02Ja
n-0
3Ju
l-03
Jan
-04
Jul-
04Ja
n-0
5Ju
l-05
Jan
-06
Jul-
06Ja
n-0
7Ju
l-07
Jan
-08
Jul-
08Ja
n-0
9
MONTHS
SOURCE: California Association of REALTORS®

Foreclosures
SOURCE: Real Estate Research Council
0
2
4
6
8
10
12
14
Q1
/90
Q3
/90
Q1
/91
Q3
/91
Q1
/92
Q3
/92
Q1
/93
Q3
/93
Q1
/94
Q3
/94
Q1
/95
Q3
/95
Q1
/96
Q3
/96
Q1
/97
Q3
/97
Q1
/98
Q3
/98
Q1
/99
Q3
/99
Q1
/00
Q3
/00
Q1
/01
Q3
/01
Q1
/02
Q3
/02
Q1
/03
Q3
/03
Q1
/04
Q3
/04
Q1
/05
Q3
/05
Q1
/06
Q3
/06
Q1
/07
Q3
/07
Q1
/08
Q3
/08
THOUSANDS
Los Angeles County

2009 Forecast

California Housing Market Summary
2003 2004 2005 2006 2007 2008 2009F
SFH Resales (000s)
601.8 624.7 625.0 477.5 346.9 439.8 550.0
% Change 5.1% 3.8% 0.03% -23.6% -27.3% 26.8% 25.0%
Median Price ($000s)
$371.5 $450.8 $522.7 $556.4 $560.3 $346.4 $248.0
% Change 17.5% 21.3% 16.0% 6.5% 0.7% -38.2% -28.4%
30-Yr FRM 5.8% 5.8% 5.9% 6.4% 6.3% 6.1% 5.1%
1-Yr ARM 3.8% 3.9% 4.5% 5.5% 5.5% 5.2% 4.8%
SOURCE: California Association of REALTORS®
April 2009
First-Time Buyer Housing Affordability Index

First-Time Buyer Housing Affordability
• Median Price: The First-time Buyer (FTB) purchases a home at the entry-level price, which is 85 percent of the median home price for the area.
• Down payment: The FTB is assumed to make a 10 percent downpayment. The Monthly Payment Including Taxes and Insurance (PITI) is calculated according to the above underlying assumptions:– 10 percent down payment– Effective Composite ARM mortgage rate– 1.038 percent assumed insurance costs and property
taxes.• 40% Qualifying Ratio: It is then assumed that the monthly
PITI can be no more than 40 percent of a household's income.
Methodology/Assumptions
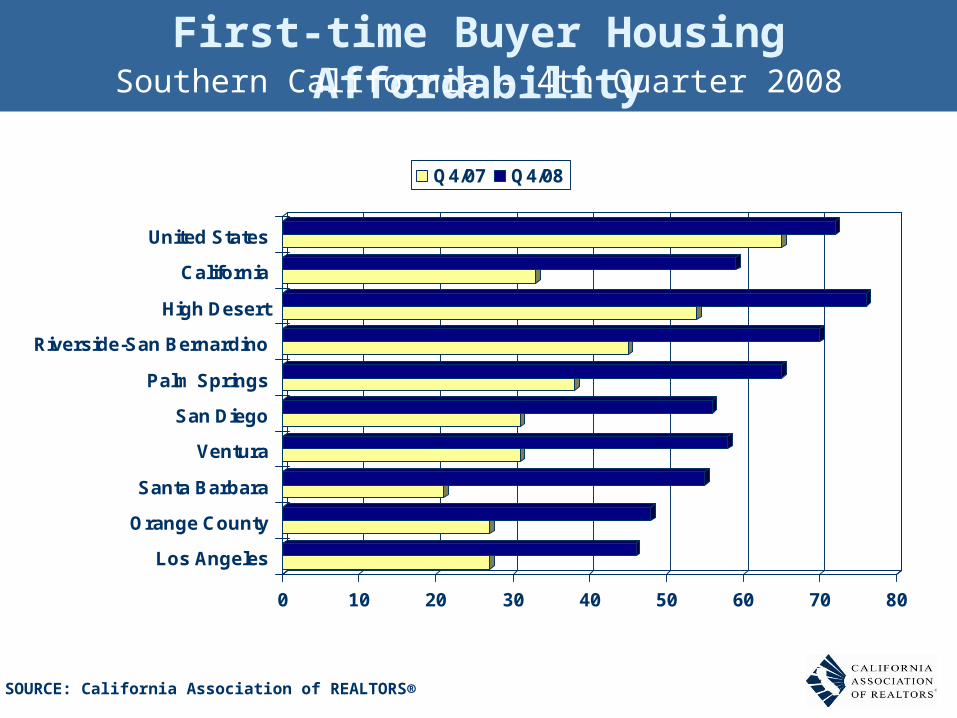
First-time Buyer Housing AffordabilitySouthern California - 4th Quarter 2008
0 10 20 30 40 50 60 70 80
United States
California
High Desert
Riverside-San Bernardino
Palm Springs
San Diego
Ventura
Santa Barbara
Orange County
Los Angeles
Q4/07 Q4/08
SOURCE: California Association of REALTORS®

To Rent or Buy in 2009

To Rent or Buy in 2009
• Household renting a 3bedroom 2 bath apartment at the prevailing rent of $1,855 per month and purchases rental insurance for $20 per month.
• The household considers the purchase of anentry-level home: priced at $248,000, or 85 percent of the prevailing median-priced home of $291,800.
• The monthly payment including taxes and insurance (PITI) is $1,630, assuming:– 10 percent down payment– 40 percent qualifying ratio– Prevailing one-year ARM mortgage rate, – 1.038 percent for insurance costs and property taxes– $8,000 First-time buyer tax credit
Assumptions

Renting Versus Buying in 2009
Renters
Year 1 Year 2 Year 3 Year 4 Year 5 Year 1 - Year 5Household Income $48,900 $48,900 $48,900 $48,900 $48,900 $48,900Standard IRS Deduction Married Filing Jointly n/a n/a n/a n/a n/a $10,900Mortgage Interest Deduction $13,364 $13,195 $13,015 $12,825 $12,622 n/aProperty Tax Deduction $2,480 $2,480 $2,480 $2,480 $2,480 n/a Total Deduction $15,844 $15,675 $15,495 $15,305 $15,102 $10,900Total Taxable Income $33,056 $33,225 $33,405 $33,595 $33,798 $38,000Total Taxes Owed ($4,958) ($4,984) ($5,011) ($5,039) ($5,070) ($5,700)
Homebuyer Tax Credit $8,000 n/a
Annual Tax Liability $3,042 ($4,984) ($5,011) ($5,039) ($5,070) ($5,700)x 5 Years 5
5 Year Total Tax Liability ($28,500)
First-time Buyer 2009 5-Year Tax Savings
First-Time Buyers
n/a
($17,062)
$11,438
5 Year Tax Savings Outlook
SOURCE: C.A.R.
First-time Buyer Purchasing in 2009 saves over $11k in 5 Years under these assumptions
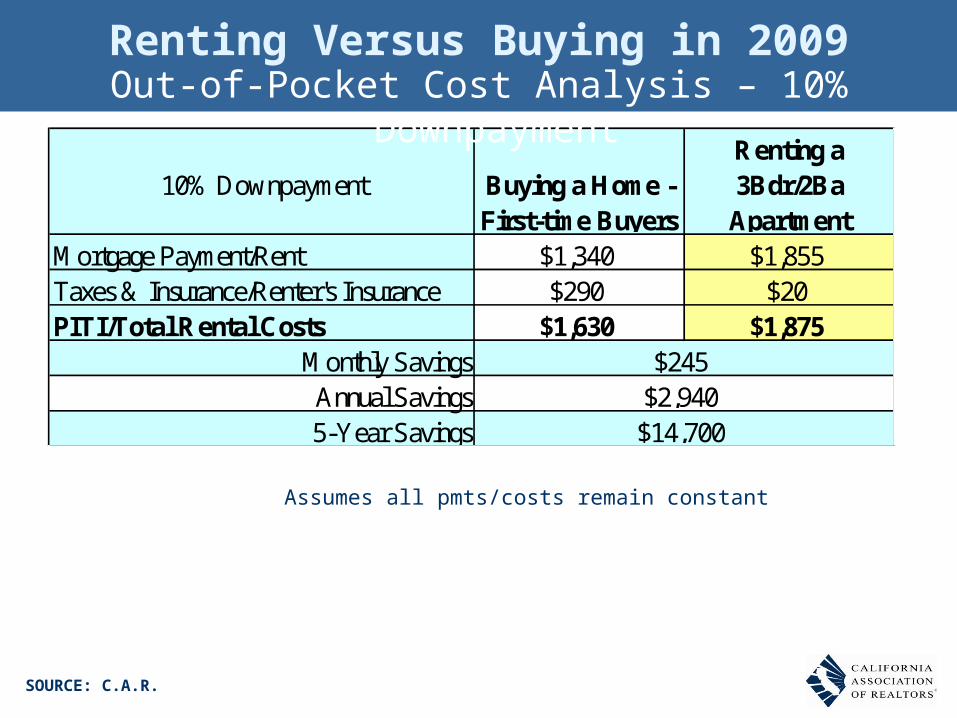
Renting Versus Buying in 2009
10% Downpayment Buying a Home - First-time Buyers
Renting a 3Bdr/2Ba Apartment
Mortgage Payment/Rent $1,340 $1,855Taxes & Insurance/Renter's Insurance $290 $20PITI/Total Rental Costs $1,630 $1,875
Monthly SavingsAnnual Savings5-Year Savings $14,700
$245$2,940
Out-of-Pocket Cost Analysis – 10% Downpayment
SOURCE: C.A.R.
Assumes all pmts/costs remain constant

Renting Versus Buying in 2009
20% Downpayment Buying a Home - First-time Buyers
Renting a 3Bdr/2Ba Apartment
Mortgage Payment/Rent $1,190 $1,855Taxes & Insurance/Renter's Insurance $290 $20PITI/Total Rental Costs $1,480 $1,875
Monthly SavingsAnnual Savings5-Year Savings $23,700
$395$4,740
Out-of-Pocket Cost Analysis – 20% Downpayment
SOURCE: C.A.R.
Using the same assumptions, EXCEPT:
Increasing the Down Payment to 20%(instead of 10%): Monthly Savings Increase by $150 Annual Savings Increase by $1,8005-Year Savings Increase by $9,000
Note: 5-Yr Tax Savings goes down to $10,355, a $1,038 drop due to lower interest payments.

Renting Versus Buying in 2009
Entry-Level Condo @ 10% Down Buying a Home - First-time Buyers
Renting a 3Bdr/2Ba Apartment
Mortgage Payment/Rent $1,140 $1,855Taxes & Insurance/Renter's Insurance $240 $20PITI/Total Rental Costs $1,380 $1,875
Monthly SavingsAnnual Savings5-Year Savings $29,700
$495$5,940
Out-of-Pocket Cost Analysis –Entry-level Condo
SOURCE: C.A.R.
Using the same assumptions, EXCEPT:
Using Entry-Level Median Priced Condo at $210,830 with 10% Downpayment:
Note: 5-Yr Tax Savings goes down to $9,700, a $1,741 drop due to lower interest payments.

Loan AvailabilityFHA
Borrower Eligibility Requirements

Market Share by Loan Type
YearConforming Loan Limit
Down-payment %*
Median Price
Conforming Share of Sales
Jumbo Share of
Sales2003 322,700$ 20% 371,520$ 75% 25%2004 333,700$ 20% 450,770$ 63% 37%2005 359,650$ 16% 524,020$ 37% 63%2006 417,000$ 12% 556,640$ 40% 60%2007 417,000$ 15% 560,270$ 43% 57%2008 729,750$ 20% 281,180$ 82% 18%
Jumbo Vs Conforming
SOURCE: C.A.R.
CA Existing Single-Family Home Sales
*Down Payment Source: C.A.R.’s Annual Housing Market Survey

Source: C.A.R. 2008-2009 State of the California Housing Market Report
18.8%
2.7%
0%
5%
10%
15%
20%
25%
30%
2001 2002 2003 2004 2005 2006 2007 2008
FHA VA
FHA and VA Mortgages(First Mortgage)

FHA Eligibility Requirements
• Must occupy home as primary residence • Must be legal resident:
– US Citizen– Lawful permanent resident aliens– Non-permanent resident aliens
• Must have valid SSN. (T.I.N. unacceptable)• Only allowed 1 FHA loan• Borrowers can hold title in Living Trust• Can be/have co-borrowers/co-signers
For more info contact your REALTOR®www.fha.gov
1-800-Call-FHA (1-800-225-5342)
Borrower Eligibility

FHA Eligibility Requirements
• 1 – 4 Unit Dwellings • SFR, PUD, Condo
– (Attached, Detached, High/Low rise)• Manufactured Homes• Existing or New Construction• Must Meet HUD Minimum Property Requirements • Owner Occupancy Required
For more info contact your REALTOR®
www.fha.gov
1-800-Call-FHA (1-800-225-5342)
Property Eligibility

Condos vs Single-Family Detached

Median Price of Existing HomesCondos vs. Single-Family Detached
($36,470)
-$150,000
-$100,000
-$50,000
$0
$50,000
$100,000
$150,000
$200,000
$250,000
$300,000
$350,000
$400,000
$450,000
$500,000
$550,000
$600,0001
98
0
19
82
19
84
19
86
19
88
19
90
19
92
19
94
19
96
19
98
20
00
20
02
20
04
20
06
20
08
$ Differential Condos SF Detached
Price Difference - L/R Avg: ($48,510)
SOURCE: California Association of REALTORS®

First-Time Buyer Housing AffordabilityCondos vs. Single-Family Detached
0%
1000%
2000%
3000%
4000%
5000%
6000%
7000%
20
00
Q1
20
00
Q3
20
01
Q1
20
01
Q3
20
02
Q1
20
02
Q3
20
03
Q1
20
03
Q3
20
04
Q1
20
04
Q3
20
05
Q1
20
05
Q3
20
06
Q1
20
06
Q3
20
07
Q1
20
07
Q3
20
08
Q1
20
08
Q3
Year
Condos SF Detached
SOURCE: California Association of REALTORS®

2008 First Time Home Buyer Study
California Association of REALTORS

Methodology
500 telephone surveys with California consumers who had purchased a home in 2008.
Surveys results are projectable at two standard deviations (a 95%) confidence level which yields a maximum sampling error of +/-4.5%.

Home Purchased
49%
35%
15%
Existing resalehome
Brand new/newlyconstructed home
Condominiumconversion

Type Of Home Purchased
51%
35%
14%
Condominium
Town home
Single-familydetached home

Share of Distressed Sales
13%
22%
1%
19%
All Homes
Single FamilyDetached Homes
Condominiums
Townhomes
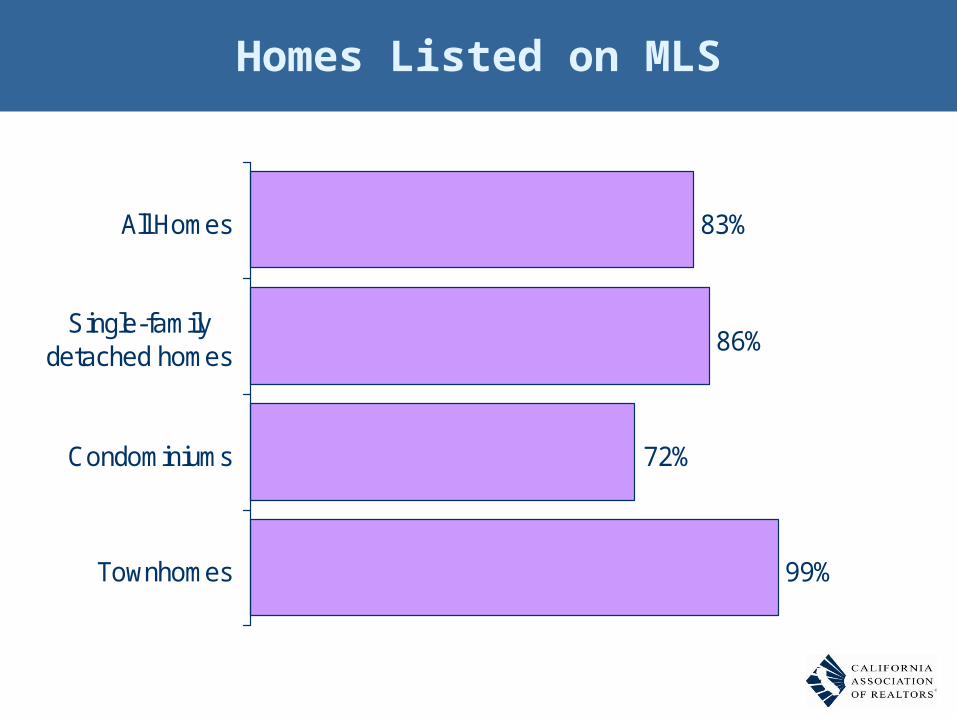
Homes Listed on MLS
83%
86%
99%
72%
All Homes
Single-familydetached homes
Condominiums
Townhomes

Square Footage Of The Home Purchased
7%
28%
26%
39%
1,000 and under 1,001-1,500 1,501-2,000 2,000+
Mean = 1,678; Median = 1,700

21%
32%
25%
14%
8%
0%
5%
10%
15%
20%
25%
30%
35%
3 months orless
4-6 months 7-9 months 10-12 months Over 12 months
Mean = 6.9; Median = 6.0
Months Spent Looking for a Home Prior to Finding The Home You Bought

6.9
8.6
7.9
6.4
7.4
7.6
5.3
All Homes
Existing Resale Home
Brand New Home
Condo Conversion
Single-Family Detached Home
Condominium
Townhome
Months Spent Looking for a Home Prior to Finding The Home You Bought

“The” Primary Reason For Buying Your Home
22%
16%
12%
11%
9%
7%
23%Price decreases allowed us to buy
Tired of renting
Desired better/other location
Obtained favorable price/ financing
Job promotion, pay raise
Change in family status
Investment/Tax advantages

Role Market Conditions Played InYour Decision To Buy Your Home
39%
23%
20%
1%
67%Price decreases motivated us
Low interest rates helped us move to abetter location, neighborhood
Likelihood that interest rates will move upmotivated us
Concern that interest rates are going togo up motivated us to buy
Unsure
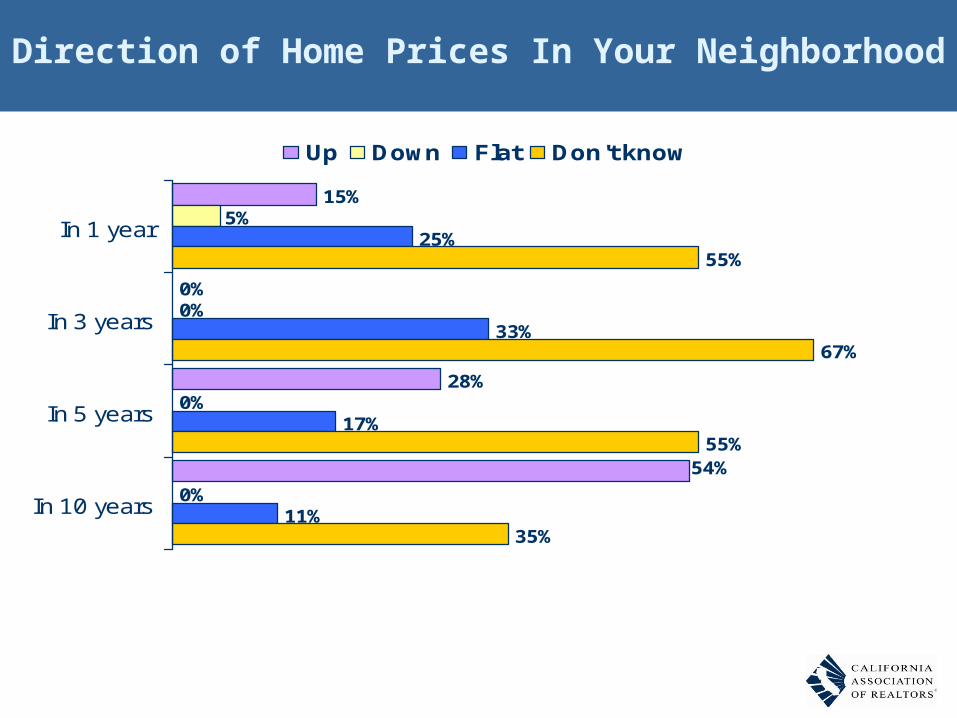
Direction of Home Prices In Your Neighborhood
15%
0%
28%
0%
0%
0%
25%
33%
17%
11%
55%
67%
55%
35%
54%
5%In 1 year
In 3 years
In 5 years
In 10 years
Up Down Flat Don't know

0%
4%
45%
30%
21%
0%
5%
10%
15%
20%
25%
30%
35%
40%
45%
50%
1 year or less 1-2 years 2-3 years 3-4 years 4+ year
Mean = 43.6 months; Median = 42 months
Length of Time Planned to Stay at Current Home Before Selling It

Mean = 15%, Median = 15%
8%
39%
9%
25%
18%
0%
10%
20%
30%
40%
50%
5% or less 6-10% 11-15% 16-20% 21-25%
Down Payment As a Percent of Home Price

8%
3%
6%7%
23%
9%
25%
18%
0%
5%
10%
15%
20%
25%
30%
5% 7% 8% 9% 10% 15% 20% 25%
Down Payment As a Percent of Home Price
Mean = 15%, Median = 15%

Type Of Mortgage Loan
63%
72%
54%
77%
75%
28%
85%
37%
28%
46%
23%
25%
72%
15%
0% 20% 40% 60% 80% 100%
All Homes
Town Home
Condominium
Single-Family Detached Home
Condominium Conversion
Brand New Home
Existing Resale Home
Adjustable Rate Mortgage (ARM) Fixed Rate Mortgage (FRM)
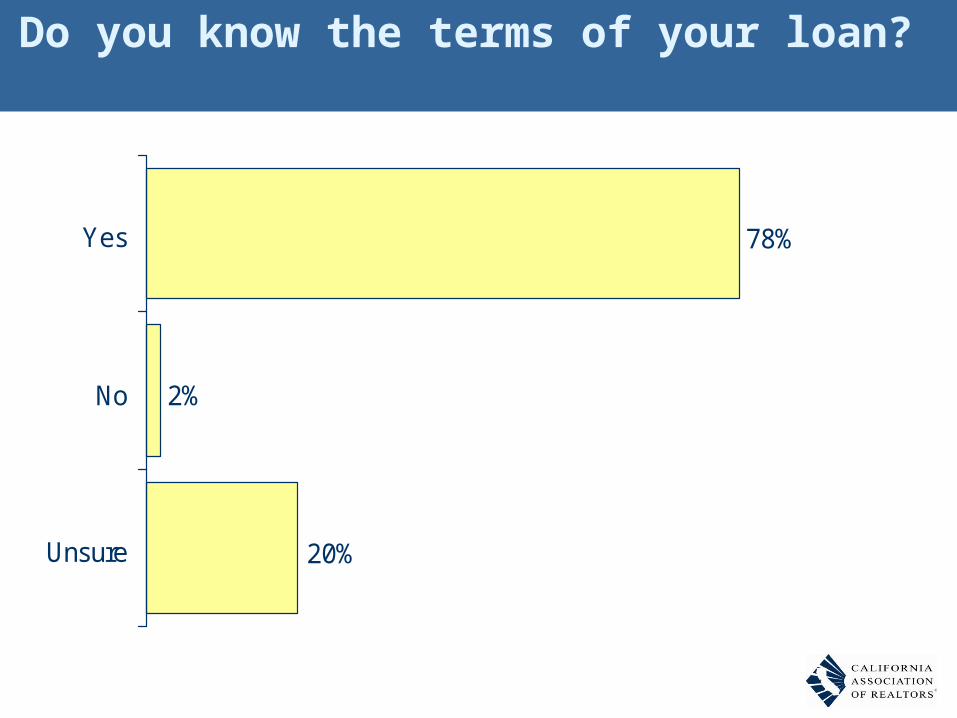
Do you know the terms of your loan?
78%
2%
20%
Yes
No
Unsure

Source of Housing Finance Assistance
13%
7%
3%
2%
0%
75%No assistance
Friends and/or relatives
A local government funded program
A federal government funded program
A state government funded program
A private funding program

0% 0% 0%
6%5%
11%10%
12%
28% 28%
0%
5%
10%
15%
20%
25%
30%
1 2 3 4 5 6 7 8 9 10
Mean = 8.15 Median = 9
Scale: “1” = very easy, “10” = very difficult
Level of Difficulty to Obtain Financing

Had you made an offer on other homes before finding and buying this one?
70%
30%
Yes
No
# of Offers Before This Purchase
Mean = 3.11
Median = 3

Reasons Offers Made Prior To Current Purchase Not Successful
34%
9%
7%
4%
47%Seller would not accept price offered
Could not get an acceptable mortgage
Dropped out because prices were stillgoing down
Lender withdrew, did not fund
Buyer's remorse (just didn't feel rightabout the obligation, deal)

Use a Real Estate Agent
89%
11%
Yes
No

Single Most Important Reason For Selecting Agent
23%
12%
10%
9%
5%
39%Seemed like he/she would be the most
aggressive on my behalf
Seemed the agent would get me thelowest price
Best prepared
Referral from relatives/ friends/co-workers
Most knowledgeable
Rebated part of commission back

Areas Needed The Most Help From Agent
43%
36%
20%
2%
34%
33%
32%
1%
56%
43%
0%
1%
40%
30%
27%
3%
Price negotiation
Determine whatcomparable homes
were selling for
Find the right home topurchase
Negotiate the terms ofsale
All Homes Existing Resale Home Brand New Home Condo Conversion

Reasons for Overall Satisfaction with Your Agent
56%
55%
50%
42%
34%
25%
58%Worked hard on my behalf
Always quick to respond
Listened to what we needed
Helped find the best home for me
Negotiated good deal on my behalf
Kept me up to date on transaction
Made sure changes, repairs were taken care of

One Thing You Would Like To Change About Your Home Buying Experience
26%
21%
13%
11%
1%
1%
45%Better understanding on where the market is
going (up/down/etc.)
Have agent negotiate better on my behalf
Escrow close on time
Faster response from my agent
Better response from selling agent
Less paperwork
Better understanding of where interest rates aregoing
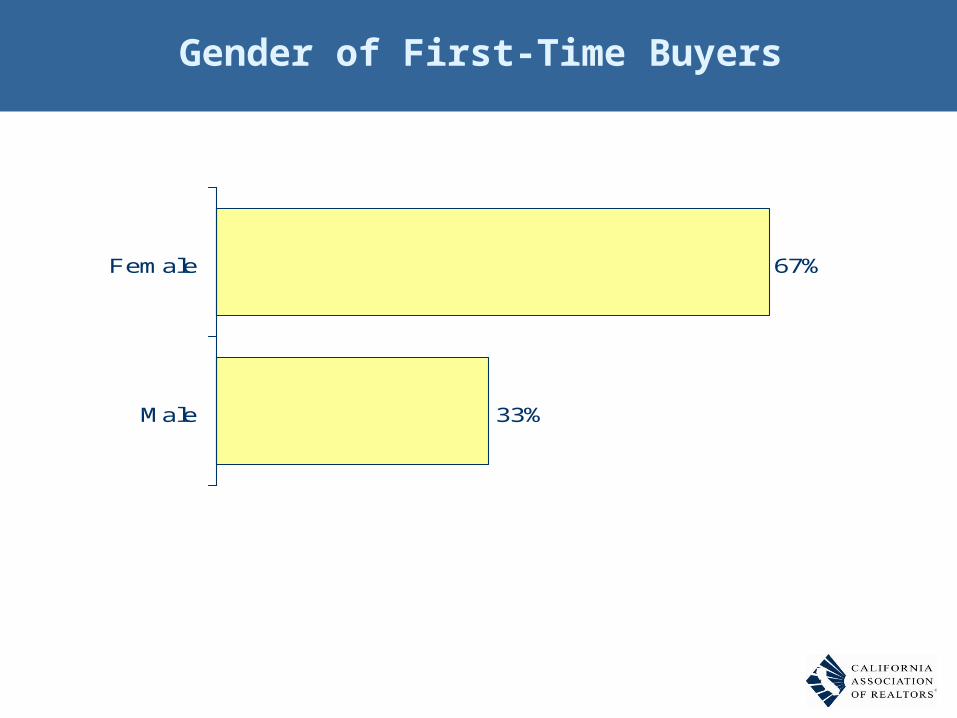
Gender of First-Time Buyers
33%
67%Female
Male

Age of First-Time Buyers
45%
41%
11%
0%
0%
2%Under 25 years
25 to 34 years
35 to 44 years
45 to 54 years
55 to 64 years
65 years and older Mean = 35.7
Median = 35

Marital Status
47%
53%Married
Single

Income Category
7%
38%
37%
15%
0%
3%$35,000 to $49,999
$50,000 to $74,999
$75,000 to $99,999
$100,000 to $149,000
$150,000 to $199,000
$200,000 or more