april 1, 2013 ms. peggy lewis, director
TRANSCRIPT

Via Hand Delivery
April 1, 2013
Ms. Peggy Lewis, Director Clerk of Council Room 1E09, City Hall 1300 Perdido Street New Orleans, LA 70112
RE: Resolution R-13-17 Regarding Proposed Rulemaking to Establish Integrated Resource Planning Components and Reporting Requirements for Entergy New Orleans, Inc. (Docket No. UD-08-02)
Dear Ms. Lewis: Enclosed are an original and three copies of Entergy New Orleans, Inc.’s (“ENO”) Supplemental Implementation and Cost Recovery Filing pursuant to Resolution R-13-17 in Docket No. UD-08-02. Please file the original and two copies into the record in the above mentioned matter, and return a date stamped copy to ENO. Thanking you for your attention and courtesies in this matter, I am Sincerely,
Gary E. Huntley cc: w/attachments
Official Service List (UD-08-02)
Entergy New Orleans, Inc. 1600 Perdido Street, Bldg #505 New Orleans, LA 70112 Tel 504 670 3680 Fax 504 670 3615 Gary E. Huntley Vice President, Regulatory and Governmental Affairs [email protected]

BEFORE THE
COUNCIL OF THE CITY OF NEW ORLEANS
IN RE: RESOLUTION REGARDING PROPOSED RULEMAKING TO ESTABLISH INTEGRATED RESOURCE PLANNING COMPONENTS AND REPORTING REQUIREMENTS FOR ENTERGY NEW ORLEANS, INC.
) ) ) ) ) ) )
DOCKET NO. UD-08-02
JOINT APPLICATION OF ENTERGY NEW ORLEANS, INC. AND ENTERGY LOUISIANA, LLC FOR APPROVAL OF SUPPLEMENTAL
IMPLEMENTATION AND COST RECOVERY FILING FOR ENERGY SMART PLAN
NOW BEFORE THIS COUNCIL, through its undersigned counsel, comes Entergy
New Orleans, Inc. (“Entergy New Orleans” or “ENO”) and Entergy Louisiana, LLC (“Entergy
Louisiana” or “ELL”) for this, their Joint Application (the “Application”) for approval, as
required by Council Resolution R-13-17, of the Supplemental Implementation and Cost
Recovery filing for the Energy Smart New Orleans Plan (“Energy Smart Plan”), and, in support
of this Application, the Company respectfully shows as follows:
I.
Entergy New Orleans is an electric and gas utility organized and operating under the laws
of the State of Louisiana, with its general office and principal place of business at 1600 Perdido
Street, Building 505, New Orleans, Louisiana 70112. The Company is engaged in the
manufacture, production, transmission, distribution, and sale of electricity to residential,
commercial, industrial, and governmental consumers throughout the City of New Orleans, with
the exception of the Fifteenth Ward of the City of New Orleans, Algiers. Entergy New Orleans
furnishes electric service to approximately 141,000 customers in Orleans Parish. Entergy New

2
Orleans also is engaged in the provision of natural gas service throughout the City of New
Orleans, serving approximately 86,000 retail gas customers.
II.
ELL is a limited liability company duly authorized and qualified to do and doing business
in the State of Louisiana, created and organized for the purposes, among others, of generating,
transmitting, distributing, and selling electricity for power, lighting, heating, and other such uses;
and ELL is engaged in the business thereof in forty-six (46) of the sixty-four (64) parishes of the
State of Louisiana. As of December 31, 2012, ELL provides retail electric service to
approximately 584,000 residential customers, 76,500 commercial customers, 6,900 industrial
customers, 4,200 governmental and municipal customers, and 1,600 lighting customers; a total of
approximately 673,200 customers. All of ELL’s retail sales of electricity and service are subject
to the jurisdiction of the Louisiana Public Service Commission (“LPSC” or the “Louisiana
Commission”) except in the Fifteenth Ward of the City of New Orleans (Algiers), where retail
sales and service are subject to the jurisdiction of the Council.
III.
In Algiers, as of December 31, 2012, ELL provides retail electric service to
approximately 20,501 residential customers, 1,433 commercial customers, 86 governmental
customers, 93 industrial customers, and 22 lighting customers, a total of approximately 22,135
customers.
IV.
In July 2009, ENO submitted a filing in which it detailed the specifics of the design and
funding levels for programs to be included in the Energy Smart Plan programs (e.g., selection of
a third party administrator, verification of deemed savings calculations, proposed goals and

3
targets). On September 17, 2009, Council Resolution R-09-483 approved the Energy Smart Plan
programs as designed and found ENO’s programs to be just, reasonable and in the public
interest; including funding levels and allocations, and goals and targets recommended by the
ENO.
V.
In April 2011, ENO and the third party administrator, CLEAResult, implemented the
Energy Smart Plan programs and began offering programs to ENO electric customers. ENO
filed bi-monthly status reports as outlined and required by Council Resolution R-11-52.
Representatives of ENO and CLEAResult made a presentation on the first year results and
progress of the Energy Smart programs to the Council Utility Committee (“CUC”) at a meeting
held on April 12, 2012. Additionally, on June 1, 2012, ENO submitted a written report
summarizing the first year results of the programs.
VI.
ELL filed with the Council its plan for offering Energy Smart programs to ELL’s Algiers
electric customers on July 27, 2012. On October 18, 2012, the Council approved ELL’s request
to implement Energy Smart programs in Algiers and effective October 22, 2012, programs
became available to Algiers customers; approximately $939,000 was allocated for Algiers
Energy Smart Plan programs for a period of 18 months through March 31, 2014, ending
concurrently with the Energy Smart programs offered by ENO to New Orleans East Bank
residents.
VII.
Council Resolution R-12-393 stated that in order to assure the continuity of the Energy
Smart Plan, it would be beneficial for both ENO and ELL to file with the Council

4
implementation and cost recovery plans for future energy efficiency and demand side
management programs to based on optimal levels contained in their Integrated Resource Plan
(“IRP”) filings or other such programs as determined by the Council.
VIII.
Council Resolution R-13-17 stated that the Council was desirous of considering ENO and
ELL’s Supplemental Implementation and Cost Recovery filings in concert with the public
process established in the IRP docket (UD-08-02) and such other recommendations as may be
provided by intevenors in the docket and the Council’s Advisors in a timely fashion, and directed
ENO and ELL to make their Supplemental Implementation and Cost Recovery filings on April 1,
2013.
IX.
In accordance with Council Resolution R-13-17, ENO and ELL request that the Council
approve the design, selection, and implementation of the DSM programs listed in the following
tables, find that such programs to be cost effective, approve the level of funding allocated to each
program, and concur that the expected energy savings (expressed in kilowatt-hours, or “kWh”)
satisfy the applicable Council requirements.

5
X.
3-Year Proposal for Energy Smart – ENO:
XI.
3-Year Proposal for Energy Smart – ELL (Algiers):


7
CERTIFICATE OF SERVICE Docket No. UD-08-02
I hereby certify that I have this 1st day of April 2013, served the required number of copies of the foregoing report upon all other known parties of this proceeding, by:
electronic mail, facsimile, overnight mail, hand delivery, and/or United States Postal Service, postage prepaid.
Peggy C. Lewis Clerk of Council Council of the City of New Orleans City Hall, Room 1E09 1300 Perdido Street New Orleans, LA 70112
W. Thomas Stratton, Jr., Director City Council Utilities Regulatory Office City of New Orleans City Hall, Room 6E07 1300 Perdido Street New Orleans, LA 70112
Evelyn F. Pugh, Esq. Council Chief of Staff New Orleans City Council City Hall, Room 1E06 1300 Perdido Street New Orleans, LA 70112
Richard F. Cortizas, Esq. City Attorney Office City Hall, Room 5E03 1300 Perdido Street New Orleans, LA 70112
Norman S. Foster Department of Finance City Hall, Room 3W06 1300 Perdido Street New Orleans, LA 70112
Clinton A. Vince, Esq. Presley R. Reed, Jr., Esq. Emma F. Hand, Esq. SNR Denton US LLP 1301 K Street, N.W. Suite 600, East Tower Washington, DC 20005-3364
Royce Duplessis, Esq. Basile J. Uddo, Esq. J.A. “Jay” Beatmann, Jr. SNR Denton US LLP The Poydras Center, Suite 2850 650 Poydras Street New Orleans, LA 70130-6132
Walter J. Wilkerson, Esq. Kelley Bazile Wilkerson and Associates, PLC The Poydras Center, Suite 1913 650 Poydras Street New Orleans, LA 70130
Joseph A. Vumbaco, P.E. Legend Consulting Group Limited 8055 East Tufts Avenue Suite 1250 Denver, CO 80237-2835
Errol Smith, CPA Bruno and Tervalon 4298 Elysian Fields Avenue New Orleans, LA 70122

8
Kenneth C. Pailet, CPA Pailet, Meunier and LeBlanc, L.L.P. 3421 N. Causeway Boulevard Suite 701 Metairie, LA 70002
Charles Rice, Jr. Entergy New Orleans, Inc. Mail Unit L-MAG-505A 1600 Perdido Street New Orleans, LA 70112
Gary Huntley Entergy New Orleans, Inc. Mail Unit L-MAG-505B 1600 Perdido Street New Orleans, LA 70112
Seth Cureington Polly S. Rosemond Al D. Eiffert Entergy New Orleans, Inc. Mail Unit L-MAG-505B 1600 Perdido Street New Orleans, LA 70112
Joseph J. Romano, III Suzanne Fontan Entergy Services, Inc. Mail Unit L-ENT-4C 639 Loyola Avenue New Orleans, LA 70113
Kathryn J. Lichtenberg, Esq. Timothy S. Cragin, Esq. Chris Neel, Esq. Courtney R. Nicholson, Esq. Matthew Brady, Esq. Entergy Services, Inc. Mail Unit L-ENT-26E 639 Loyola Avenue New Orleans, LA 70113
Jody Montelaro Entergy Services, Inc. 446 North Boulevard Mail Unit L-NORT-4E Baton Rouge, LA 70802
Kimberly A. Fontan Entergy Services, Inc. 4809 Jefferson Highway Mail Unit L-JEF-357 Jefferson, LA 70121
Michael L. Winberry Jacobs Technology Inc. 13800 Old Gentilly Rd., Bldg. 320 New Orleans, LA 70129
Christopher P. Todaro The Folger Coffee Company 14601 Old Gentilly Road New Orleans, LA 70129
Ernest L. Edwards, Jr. Beirne, Maynard & Parsons, L.L.P. 601 Poydras Street Suite 2200 New Orleans, LA 70130-6097
Fred M. Mazurski, CEM, CDSM Energy USG Corporation 550 West Adams Street Chicago, IL 60661-3676


1
Report on Supplemental Implementation and
Cost Recovery Filing of Entergy New Orleans, Inc. and
Entergy Louisiana, LLC Pursuant to
Council Resolution R-13-17

2
I. Introduction The purpose of this Report on Supplemental Implementation and Cost Recovery
filing is to provide a summary description of the proposed energy efficiency programs and associated costs and energy savings of the Energy Smart Plan of Entergy New Orleans, Inc. (“ENO”) and Entergy Louisiana, LLC (“ELL”)(collectively ,the “Companies”) for the three year period from April 2014 to March 2017, and to describe the cost recovery mechanisms that the Companies seek in order to provide these programs. Council of the City of New Orleans (“Council”) Resolution R-13-17 requires the Companies to submit a Supplemental Implementation and Cost Recover filing in order to seek approval for the continuation of the existing Energy Smart programs, and to seek modifications to those programs. Accordingly, attached to this report is detailed information on the proposed Energy Smart programs from the third party administrator (“TPA”) of the Energy Smart Plan, CLEAResult. As detailed further below and in CLEAResult’s plan, the Companies propose the following programs and associated costs and energy savings for the next three years of Energy Smart:
3-Year Proposal for Energy Smart – ENO:
Program Name3-year Budget
3-Year Savings
(gross kWh)
3-year Participation
Home Performance with Energy Star 1,907,722 3,561,286 2,400
Consumer Products 1,471,700 5,434,460 10,000
Multi Family Weatherization 1,134,577 1,661,840 4,488
Low Income Audit & Weatherization 1,180,099 1,077,255 300
School Kits & Education 590,840 3,934,980 1,550
Res Heating & Cooling 1,118,376 3,124,648 3,945
Total Residential $7,403,314 18,794,469 32,683 Small Commercial Solutions 2,231,417 9,638,184 294
Large Commercial Solutions 5,124,284 27,853,606 64
Total Non-Residential $7,355,701 37,491,790 358 Sub -Total Portfolio $14,759,015 56,286,259 33,041 EM&V $240,000 Behavioral Program $1,125,000 Total Program Spending $16,124,015

3
3-Year Proposal for Energy Smart – ELL (Algiers):
II. Overview of the Energy Smart Plan
A. Background
Since at least 2007, through a series of Council resolutions and public
participation, the Council has recognized energy efficiency as a high-priority resource and has expressed its desire to, among other things: (a) identify cost-effective energy efficiency potential; (b) develop processes to align incentives equally for demand-side management (“DSM”) and supply resources; (c) set energy savings goals consistent with cost-effective potential; (d) establish appropriate evaluation, measurement and verification mechanisms; (e) establish effective DSM measures by residences and businesses in New Orleans; (f) align customer pricing and incentives to encourage investment in energy efficiency; and (g) provide sufficient, timely and stable program funding to deliver energy efficiency programs where cost effective.1
In 2009, Council Resolution R-09-136 established the criteria for ENO to implement the Energy Smart Plan. The programs to be established through this framework were initially intended to be for the benefit of ENO’s electric customers located on the Eastbank of the Mississippi River in Orleans Parish. No provisions were
1 Council Resolution R-07-600 approved December 6, 2007.

4
adopted at the time to implement such programs for Algiers electric customers located on the Westbank of the Mississippi River in Orleans Parish and served by ELL.
In July 2009, ENO submitted a filing in which it detailed the specifics of the design and funding levels for programs to be included in the Energy Smart Plan programs (e.g., selection of TPA CLEAResult, verification of deemed savings calculations, proposed goals and targets). In September 2009, the Council approved the Energy Smart Plan programs as designed and found ENO’s programs to be just, reasonable and in the public interest; including funding levels and allocations, and goals and targets recommended by the Company.2
In April 2011, ENO and CLEAResult implemented the Energy Smart Plan
programs and began offering programs to ENO electric customers. ENO filed bi-monthly status reports as outlined and required by Council Resolution R-11-52. Representatives of ENO and CLEAResult made a presentation on the first year results and progress of the Energy Smart programs to the Council Utility Committee (“CUC”) at a meeting held on April 12, 2012. Additionally, on June 1, 2012, ENO submitted a written report summarizing the first year results of the programs.
B. Addition of Energy Smart for Algiers
Based on public comment, the direction of the Council, and the success of the Energy Smart Plan programs implemented by ENO, ELL filed with the Council its plan for offering Energy Smart programs to ELL’s Algiers electric customers on July 27, 2012. ELL leveraged the extensive work already undertaken by community stakeholders, including ENO, under the leadership and direction of the Council and its Advisors by replicating the Energy Smart Plan programs offered by ENO for delivery to its customers in Algiers. On October 18, 2012, the Council approved ELL’s request to implement Energy Smart programs in Algiers and effective October 22, 2012, programs became available to Algiers customers. Using funds from a federally-mandated production cost equalization calculation, approximately $939,000 was allocated for Algiers Energy Smart Plan programs, The Council approved Algiers Energy Smart programs for a period of 18 months through March 31, 2014, ending concurrently with the Energy Smart programs offered by ENO to New Orleans East Bank residents.
C. Summary of programs results from first 2 years of programs
To date, the Energy Smart Plan programs continue to show success in both participation rates and in energy savings. The initial phase of the Energy Smart programs will end on March 31, 2014. Twenty-three months into program implementation, Energy Smart has attained cumulative energy savings of 33,736,610kilowatt-hours (“kWh”). 2 Council Resolution R-09-483 approved September 17, 2009.

5
D. Integrated Resource Plan
In order to adequately address the effects of energy efficiency measures in the resource planning process, the Council directed the Companies to consider these measures in their Integrated Resource Plan(“IRP”) filing, to review the benefits of demand side management (“DSM”) within the IRP framework, and to forecast the projected levels and funding for DSM in comparison with supply side resources. This resulted in a preferred portfolio of cost effective energy efficiency programs, including a general level of spending and associated savings.
On October 30, 2012, the Companies filed the Entergy New Orleans IRP and Entergy System IRP for a 20 year time horizon ranging from 2012-2031. In settling upon an optimal portfolio, the IRP considered a wide range of scenarios and energy efficiency measures. The preferred portfolio identified in the IRP is shown in the table below.
Sector Type Program Name Energy Smart?
Level of Spending on Incentives
C&I EE Large Commercial Energy solutions Yes Low C&I EE Small Commercial Energy Solutions Yes Low Res. EE Energy Smart New Homes Yes Low Res. EE ENERGY STAR Air Conditioning Yes Low Res. EE Residential Lighting and Appliances Yes Low C&I EE Commercial Building Energy Management No Low C&I EE Commercial New Construction No Low C&I EE Industrial No Low C&I DR Interruptible Rate No High Res. DR Direct Load Control No High

6
The preferred portfolio has the potential to reduce peak load by 203 megawatts (“MW”) at the end of 2031at a cost of $5 to $6 million per year. Based on the IRP’s analysis, the range of $5-6 million annually for energy efficiency programs resulted in an appropriate level of energy savings in relation to the relative costs of implementation; under current circumstances, the IRP analysis demonstrates that higher levels of energy efficiency expenses do not result in corresponding energy savings.
III. Summary of Implementation Plan A. Summary of Programs
Because the IRP represents a high level point of view regarding the City’s projected electricity needs over a long term time horizon, the Companies have undertaken a more detailed analysis when considering specific supply-side or DSM investments.
Council Resolution No. R-13-17, approved on January 24, 2013, established the procedural schedule for the Council’s IRP docket (UD-08-02). The resolution also required that the Companies file a more detailed Implementation and Cost Recovery filing outlining their plans for investment over the new term. Entergy New Orleans worked with CLEAResult to develop a proposed, detailed DSM plan for the next three years of the Energy Smart program.
The Council has provided numerous opportunities for public input into the development of the IRP and Implementation and Cost recovery plans. Public input to date has included:
• Stakeholder involvement in quarterly IRP meetings; • Stakeholder involvement in DSM sub-group meetings; • A technical conference for presentation of the IRP held on February 23,
2013; and • A 15 day question period in which the public was allowed to post
questions to the Entergy New Orleans website.
The Companies considered this public input in the design of the energy efficiency portfolio presented in this filing.
A summary description of each proposed program for the next three years of the Energy Smart Plan is described below. In addition, the CLEAResult Report provides a more detailed review of each program plan, costs, EMV methods and expected outreach plan.
1. Home Performance with ENERGY STAR: Formerly, Residential Solutions, this officially sponsored HPwES program aligns with the ongoing DOE’s requirements changes and offers a whole home approach for single family unit customers.

7
2. Consumer Products: This retail channel program initiative includes lighting and room A/C measures for this plan cycle. The program will lay the foundation for developing retailer and manufacturer partnerships supporting the integration of additional measures during the next program cycle.
3. Multi-Family Weatherization: The Multi-Family Weatherization program initiative provides direct installation of instant savings measures and weatherization to buildings with individually metered units through a streamlined assessment and customer process focused on the property manager.
4. Low Income Audit & Weatherization: This program targets a hard to reach income qualified segment of the market with significant weatherization of single family and multi-family units up to a maximum of $2,500 incentives per unit.
5. School Kits & Energy Education: Local partner organizations will deliver energy education and energy conservation kits to fifth to seventh grade class rooms Orleans Parish schools. Savings will be claimed as instant savings measures are installed and self-reported by those students’ families via an online system via the EnergySmart web site.
6. Residential Heating & Cooling: Implemented with the Small Commercial A/C tune-up measure, this program initiative will use DSM industry best practices for delivery of tune-ups using an M&V approach to generate more precise energy savings as well as incentives for AC replacements.
7. Small Commercial Solutions Program – the Small Commercial Solutions program will continue to offer facility audits and a suite of common energy efficiency measures with savings assigned per the New Orleans TRM, allowing for simple approaches to QAQC and savings verification. In addition, the program will offer two specific initiatives targeted at enhancing participation in key market segments and improving measure diversity achieved through the program by increasing the adoption of HVAC efficiency measures. The Small Commercial Solutions initiatives focus on a direct install model that engages contractors to deliver measures into customer facilities through the use of field tools that greatly streamline and simplify program participation while also improving data collection and data accuracy. This will also improve program retention rates, helping contractors close and complete more projects.
Hospitality Initiative – targeting small hotels, bed and breakfasts, and restaurants with applicability to grocery and convenience stores as well. This initiative will be delivered through a network of Participating Contractors equipped with advanced field tools; these tools are an added feature for the new program that will enable them to quickly deliver program applications and project financials to customers, and streamline their program activity
Commercial Heating and Cooling Initiative– targeting small HVAC units under 15 tons for tune-ups and upgrades, run in conjunction with the Residential Heating and Cooling Program. This initiative will be delivered through a network of Participating Contractors equipped with a field tool that

8
will enable them to quickly deliver program applications and project financials to customers, and the program will cover 100% of costs of tune-ups for eligible systems and customers.
8. Large Commercial Solutions Program - the Large Commercial Solutions program will continue to offer facility audits and incentives for a suite of common energy efficiency measures with savings assigned per the New Orleans TRM, allowing for simple approaches to QAQC and savings verification. In addition, the program will offer two new initiatives targeted at enhancing participation with school and city accounts through additional service offerings, and enhancing the existing custom program offering through the provision of M&V services for projects that achieve a minimum of 100,000 kWh. This is an expanded service offering compared to the existing program that required third party verified savings for custom projects.
School and City Initiative – this initiative will offer benchmarking and Energy Master Planning services to school and city accounts that are motivated to reduce energy use at their facilities. These services will facilitate the prioritization and planning of energy improvements in schools and city government facilities, and provide these customers with an Energy Master Plan for achieving energy management goals.
Custom Initiative – this initiative will target efficiency improvements affecting systems that cannot be captured under prescriptive measure offerings by offering expanded M&V services for large projects that are pre-approved by the program and are expected to achieve a minimum of 100,000 kWh annual savings. These projects may include retro-commissioning, process improvements, and other system level custom projects or projects involving unique equipment not part of the prescriptive offerings. Program staff will pre-approve projects for customer and measure eligibility, and provide M&V services or review as needed to verify measures savings. The program will provide technical support to identify custom project opportunities in customer facilities.
B. Rationale for Choice of Energy Smart Plan programs.
In analyzing measures for the next steps of the Companies’ Energy Smart Plan, the overall approach was to retain the aspects of the existing program that have generated or are likely to generate cost effective savings while achieving their strategic objectives within the portfolio, and then to modify the remainder of the program to best achieve Energy Smart goals and objectives. Some of the Residential program initiatives have been re-organized to better leverage economies of scale and better suit their respective market channels. For example, the Residential Heating & Cooling program initiative has combined A/C tune-ups with unit replacements and will work in conjunction with the A/C tune-up component of the Small Commercial program. This allows for the same program implementation staff and the same program delivery mechanisms to be used across these two initiatives. Room A/C units and lighting products were combined into a program initiative focused on the retail channel. Multi-family weatherization was

9
broken out into its own program initiative to better focus light weatherization directed at property managers. The new School Kits & Energy Education program initiative will deliver education and generate savings in a unique way through local schools which impacts residential energy consumption in the local communities. The Residential Portfolio as a whole represents a comprehensive DSM portfolio that utilizes multiple market channels, addresses multiple market segments and optimizes a cost effective approach to energy and demand savings.
The Energy Efficient New Homes program initiative has been eliminated due to its very low participation and a very low projected TRC result. In order for this plan to offer a number of separate program initiatives, the budget from the Energy Efficient New Homes program was reallocated within the Plan to allow builders to still participate in other program initiatives such the Home Performance with Energy Star and Residential Heating & Cooling programs.
Regarding residential program pilots, an initiative to show that savings can be generated through residential new construction code compliance will be implemented within the first two years of the plan cycle. In certain states, studies of compliance of actual construction practices to local active building, mechanical and energy codes have shown gaps. These compliance gaps offer real opportunity for energy and demand savings for DSM programs. A code compliance pilot should consider energy code training, a circuit rider technical assistance offering and development of documentation tools to support compliance with the energy code. The pilot will involve working closely with the utility staff, local engineering code department and building inspectors, and external stakeholders consisting of the building community (owners, developers, architects, engineers, contractor, etc).
Additionally, a study on new “learning” thermostats will be determined in program year one, and run in either program year one or two. A pilot may result from this study. The market offers a Nest brand learning thermostat which makes savings claims that should be verified prior to including the measure in programs. This study will provide industry ground breaking understanding as to the savings potential of such learning thermostats.
Regarding commercial and industrial (“C&I”) program pilots, a suggested pilot is to use contractor cash “spiffs” to encourage the removal of tubular T12 lighting prior to the shift in baseline for these retrofits. To date, the program has had great success with installing highly efficient LED and CFL lamps in small commercial facilities, with lower participation for removing highly inefficient T12 lighting. The purpose of this pilot would be to ensure that customers take maximum advantage of program incentives available to replace highly inefficient T12 lighting while sufficient incentives are still available for these retrofits. While these spiffs are typically small in amount (on the order of $25), they could have a substantial impact on program activity. The pilot would measure the improvement in activity and realized T12 retrofit savings achieved by offering contractor spiffs for T12 retrofits. This pilot would apply to both Small and Large C&I Solutions programs.
For Small Commercial Solutions, a pilot initiative is to enhance activity in the small commercial solutions program by offering offer contractors spiffs for each correct

10
and complete application that is submitted to the program using the program tool. This pilot is suggested if the program finds that contractors need an additional incentive to take advantage of the program tool, and would measure the effectiveness of using spiffs to engage contractors in using new technology that streamlines program participation.
For Large Commercial Solutions, Resource Conservation Manager (RCM) services could be offered as a pilot to a limited number of schools that take advantage of benchmarking and Energy Master Planning services. Benchmarking and EMP services frequently suggest the incorporation of an energy awareness program and RCM is an effective way of following through with that. RCM employs an energy accounting tool to track energy usage and covers the cost of training and maintaining an energy manager to use the energy accounting tool to improve energy awareness for building occupants and achieve substantial energy savings through behavior modification and operations adjustments. These initiatives are found to reduce electric and gas energy use in schools by 10-30%. Another large C&I pilot is the extension of benchmarking and EMP services to large C&I customers outside of schools. The purpose of this pilot would be to measure enhanced program activity that is driven by providing data on facility energy use through benchmarking, bringing together facility stakeholders through Energy Master Planning activities, and providing the facility with an Energy Master Plan.
C. Proposed Behavioral Program
In addition to the programs designed by CLEAResult, the Companies recommend the inclusion of a behavior-based energy efficiency pilot program. Behavior based programs are a relatively new addition to the energy efficiency arena. As such, the Companies have had limited experience with behavioral programs or administrators of such programs. It is the Companies’ intention to issue an RFP for these services. The Companies expect the cost of the pilot program to be between $250,000 and $500,000 annually over the 3 year period. The pilot is expected to be cost effective and to add to the energy savings, peak demand savings, and program awareness of the other Energy Smart programs. The pilot is envisioned to include home energy reports to compare a customer’s electricity usage to the usage of other similar homes in the New Orleans area. The program is expected to encourage energy conservation behavior and increased awareness of the Energy Smart Plan to customers at the household level.
Should there be support for such a behavioral pilot, an RFP for a small pilot with a limited scope can be issued in May 2013 with selection of an administrator by August 2013. This will allow the administrator approximately six months for program design and start up activities.
IV. Comparison of Energy Smart Plan to IRP
The chart below compares the results of the IRP preferred portfolio to the portfolio of programs developed through the detailed implementation plan developed by

11
CLEAResult. As can be seen from the chart, most of the programs developed through the IRP process, are included in the implementation plan. Exceptions include the Interruptible rate and Direct Load Control programs outlined in the IRP. ENO and ELL have an Interruptible Rate for commercial customers; however, the Companies did not include these in the portfolio of energy efficiency programs. A residential Direct Load Control programs is not directly included in the portfolio at this time, pending the review of the programs related to the recently completed DOE AMI pilot. There are also several programs included in the DSM Implementation plan which were not included in the preferred portfolio of programs developed through the IRP process. These include a Low Income Weatherization program and a program targeting savings through K-12 education and energy efficiency kits distributed to students in New Orleans schools. These programs were selected because of their market relevance and concurrent likelihood for cost-effective, successful, long-term energy savings within the territory.
2012 IRP Programs and Comparable 2014-2017 Program
V. Cost Effectiveness Testing
CLEAResult performed program cost effectiveness tests on the potential measures and programs being considered. They performed the Total Resource Cost Test (TRC), the Program Administrator Cost test (PACT) and the Participant Test. As
2012 IRP Program Recommendation DSM Plan Program Equivalent
Industrial Program
Large Commercial Energy Solutions
Commercial Building Energy Management
Commercial New Construction Large Commercial & Industrial
Small Commercial Energy Solutions
Commercial New Construction Small Commercial & Industrial
ENERGY STAR Air Conditioning Residential Heating & Cooling (includes an AC Tune-up Component)
Residential Lighting and Appliances Consumer Products
Residential Energy Solutions
Energy Smart New Homes Home Performance with Energy Star
NA Low Income Audit & Weatherization
NA School Kits & Education
NA Multi-Family Weatherization

12
shown in the table below, all programs past all three of the cost effectiveness tests, including the Low Income Weatherization program. A benefit/cost ratio that exceeds a 1.0 indicates that it is passing that particular test.
All tests are based upon the cost-effectiveness analysis established by the California Standard Practice Manual. The Total Resource Cost Test (also known as the All Rate Payers Test, or “ART”) is the primary cost-effectiveness test most generally relied upon for demand side management program design. The Total Resource Cost Test compares the total cost of the program (including the costs to both the participants and the Company) to the total benefits derived from the program. The Program Administrator Cost Test compares program administrator costs, including program incentive and non-incentive costs, to the avoided costs resulting from electric energy and peak demand savings. The Participant Test compares the benefits and costs for program participants and serves as a guide for program design. It should be noted that many customers choose to participate in a demand side program for reasons that cannot be quantified; therefore an unfavorable benefit/cost ratio does not necessarily prevent customers from participating in a program.
VI. Cost Recovery, Lost Revenue and Incentives
The Companies request approval to recover contemporaneously all prudently incurred direct costs and lost revenues associated with the Supplemental Programs. Further, the Companies request approval to recover incentives based on achievement of the Supplemental Program energy savings goals. The Companies propose to work with the Council and its Advisors to determine the most appropriate mechanism(s) for recovering these costs and incentives within the proper rate proceedings, and the Companies believe that a contemporaneous cost recovery mechanism for program expenses, as well as energy savings incentives and the recovery of any lost contribution to fixed costs, should be in place when the next phase of Energy Smart is implemented.
Program TRC PACTParticipant
TestHome Performance with Energy Star 1.18 1.63 2.71 Consumer Product Program 1.58 1.74 3.95 MultiFamily Weatherization 1.31 1.27 3.93 Low Income Audit and Weatherization 1.15 1.09 3.37 School Energy Education 1.45 1.00 13.48 Residential Heating and Cooling 1.12 1.45 3.31 Small Commercial Program 2.19 2.65 6.20 Large Commercial Program 1.30 1.83 3.42
Cost Effectiveness Testing

13
A. Proposed Cost Recovery
One alternative for a contemporaneous cost recovery mechanism for Energy Efficiency programs in New Orleans and Algiers would be through a volumetric based Energy Efficiency Rider (“EER”) . The rider would be trued up annually based on actual program costs to ensure that there is no over or under collection of customer funding.
B. Lost Revenue Recovery and Calculation
ENO and ELL propose continuing the current method of lost revenue recovery currently in use. The lost revenue recovery schedule utilizes the total energy saving projected for the upcoming 12 month period multiplied by the adjusted gross margin. This amount is then trued up for actual performance at the end of each year. The current lost revenue calculation are set forth in Attachment G to the 2012 ENO FRP. The Companies believe this is a simple, fair and equitable means to recovery lost revenue in a timely manner until such time as rates are re-adjusted.
C. Incentive Mechanism
ENO and ELL propose continuing the current method for calculating a return on equity (“ROE”) incentive. The incentive mechanism is calculated on a sliding scale based on the percentage of energy savings achieved annually; if savings are between 75 and 125% of the goal in a given year, a sliding ROE percentage is multiplied by the equity portion of rate base and a tax factor. ENO’s current incentive calculation is set forth in Attachment to the 2012 ENO FRP. The Companies believe this is a simple, fair and equitable means to provide an incentive to invest in energy efficiency measures in relation to other supply side options.
VII. Customer Impact
For a residential ENO customer with 1,000 kWh of monthly energy use, the proposed level of Energy Smart program expenses of $5.5 million would increase the customer’s bill by approximately 1.9%; an illustrative calculation of this “typical bill” is attached to this report. Example bills are also provided to demonstrate the effects of Energy Smart program expenses on various demand and energy levels for ENO commercial customers.
VIII. Conclusion
On April 19, 2013, the Council is expected to hold a public hearing to review the energy efficiency programs as presented by ENO, ELL and CLEAResult. Following that hearing, ENO, ELL and CLEAResult will take into consideration all comments received and if warranted, the Companies will make revisions to the programs presented. The

14
Companies will then file for Council approval their final recommendations for the next phase of energy efficiency programs for the City of New Orleans.

1 | P a g e
SUBMITTED TO:
Derek Mills Entergy New Orleans 1600 Perdido St. New Orleans, LA 70112 [email protected] SUBMITTED BY:
CLEAResult 4301 Westbank Drive Building A – Suite 250 Austin, TX 78746 Contact: Jonathan Kleinman [email protected]
3/20/2013
Entergy New Orleans DSM Plan

2 | P a g e
Table of Contents
Executive Summary ................................................................................................................................................ 4
2014 – 2017 DSM Plan Portfolio Summary .......................................................................................................... 6
Background.......................................................................................................................................................... 6
Council DSM Rules ............................................................................................................................................. 6
IRP DSM Recommendations ............................................................................................................................. 7
2014 – 2017 DSM Plan Development Methodology ......................................................................................... 8
Data Collection & Review ............................................................................................................................... 8
Measure Selection, Characterization & Screening ........................................................................................ 9
Program Forecasting & Portfolio Design ...................................................................................................... 11
Market Profile Summary ................................................................................................................................... 11
Best Practices Summary .................................................................................................................................... 12
DSM Portfolio .....................................................................................................................................................14
Portfolio Budgets & Savings ..........................................................................................................................14
EM&V Budget ................................................................................................................................................. 15
DSM Portfolio Net Benefits and Cost Effectiveness Analysis .....................................................................16
Residential Program Portfolio ....................................................................................................................... 17
Commercial and Industrial Programs ..........................................................................................................19
Summary............................................................................................................................................................ 22
APPENDICES .................................................................................................................................................... 23

3 | P a g e
Tables & Figures
Table 1: 2012 IRP Programs and Comparable 2014-2017 Program .................................................................... 7 Table 2: Energy Smart New Orleans - Incremental Recommended Portfolio Savings...................................... 8 Table 3: Energy Smart Algiers - Incremental Recommended Portfolio Savings ............................................... 8 Table 4: Primary Baseline Changes Affecting the 2014 - 2017 Portfolio ............................................................ 9 Table 5: Residential Benchmarks $/kWh ............................................................................................................ 13 Table 6: Commercial Benchmarks $/kWh ........................................................................................................... 13 Table 7: Matrix of Program Offerings of Benchmarked Utilities........................................................................14 Table 8: Energy Smart New Orleans DSM Portfolio Budget Table ....................................................................14 Table 9: Energy Smart New Orleans DSM Portfolio Savings Table ................................................................... 15 Table 10: Energy Smart Algiers DSM Portfolio Budgets Table .......................................................................... 15 Table 11: Energy Smart Algiers DSM Portfolio Savings Table ............................................................................ 15 Table 12: Energy Smart New Orleans DSM Portfolio Costs and Benefits..........................................................16 Table 13: Energy Smart New Orleans Residential Portfolio Savings ................................................................ 18 Table 14: Energy Smart New Orleans Residential Portfolio Budgets ............................................................... 18 Table 15: Energy Smart Algiers Residential Portfolio 3-Year Budgets and Savings .........................................19 Table 16: Energy Smart New Orleans C&I Portfolio Savings.............................................................................. 21 Table 17: Energy Smart New Orleans C&I Portfolio Budgets ............................................................................. 21 Table 18: Energy Smart Algiers C&I Portfolio 3-Year Budgets and Savings ..................................................... 21

4 | P a g e
Executive Summary Entergy New Orleans (“ENO”) Entergy Louisiana-Algiers (ELL) , have developed a three-year plan for the implementation of electric Demand Side Management (DSM) programs for the program years 2014-20171 based on the output of the IRP process and public input received to date.. Through this process, the CLEAResult worked with the intent of delivering a plan that satisfies the DSM goals identified in the 2012 Integrated Resource Plan (IRP) and is representative of public input, while working within the framework for DSM program delivery established in the previously developed Council rules for DSM planning. The following report describes in detail the planned ENO and ELL-Algiers portfolio of Residential and Non-Residential energy efficiency programs.
The 2014-2017 portfolio includes six (6) Residential and two (2) Commercial & Industrial programs targeting a total estimated annual gross savings of 18,984,923 kWh in the first year at a cost of $5,089,742. Cumulative annual portfolio savings are 56,286,258 gross kWh with an overall three year cost of $14,988,220.
Residential Programs
Home Performance with ENERGY STAR: Formerly, Residential Solutions, this officially sponsored HPwES program aligns with the ongoing DOE’s requirements changes and offers a whole home approach for single family unit customers. The program model acquires savings from both the shallow measures such as those which are directly installed, as well as deeper savings measures with longer measures lives yielding a more enduring energy savings within the territory.
Consumer Products: This retail channel program initiative includes lighting and room A/C measures for this plan cycle. The program will lay the foundation for developing retailer and manufacturer partnerships supporting the integration of additional measures during the next program cycle.
Multi-Family Weatherization: The Multi-Family Weatherization program initiative provides direct installation of instant savings measures and weatherization to buildings with individually metered units through a streamlined assessment and customer process focused on the property manager. In this more comprehensive offering, the property manager is targeted through an aggressive incentive design that encourages investment in all program measures. The measures included in this program target shallow savings as well as the deeper savings achieved through insulation measures.
Low Income Audit & Weatherization: This program targets a hard to reach income qualified segment of the market with significant weatherization of single family and multi-family units up to a maximum of $2,500 incentives per unit. Unlike low income programs implemented in other jurisdictions, the Energy Smart Low Income Audit & Weatherization program directly manages the installation contractor and inspects nearly 100% of installed measures assuring a high quality and customer satisfaction.
School Kits & Energy Education: Energy Smart will partner with local p organizations to deliver energy education and energy conservation kits to fifth through seventh grade class rooms in Orleans Parish schools. Savings will be claimed as measures are installed and self-reported by those students’ families via an online system via the Energy Smart web site.
Residential Heating & Cooling: Implemented with the Small Commercial A/C tune-up measure, this program initiative will use DSM industry best practices for delivery of tune-ups using an M&V approach to generate measured savings. This program also combines the Tune Up programs with incentives to purchase high efficiency air conditioner.
Commercial & Industrial Programs
Large Commercial & Industrial: the Large Commercial & Industrial program maintains some of the existing program design with facility audits and incentives for a suite of common energy efficiency measures, but is evolved into a more sophisticated offering with the addition of energy master planning
1 The Energy Smart Program year begins on April 1st and ends on March 31st of the subsequent year; thus program year 1 will run from 2014-2015, year 2 will run from 2015-2016 and finally year 3 will run from 2016-2017.

5 | P a g e
and benchmarking, which helps to build the program infrastructure required for emerging behavioral modification strategies, and will also add custom incentives for large custom projects that do not participate through the traditional prescriptive path.
Small Commercial & Industrial: the Small Commercial Solutions program will continue to offer facility audits and a suite of common energy efficiency measures, but adds two initiatives targeted at enhancing participation in key market segments and improving measure diversity achieved through the program by increasing the adoption of HVAC efficiency measures. In addition, this more comprehensive program streamlines contractor participation through the use of field tools, and follows a more targeted market segmentation approach.
Energy Smart New Orleans
Energy Smart Algiers
Implementation Incentives EM&V Total Implementation Incentives EM&V Total Implementation Incentives EM&V Total
Residential 1.04$ 1.38$ 0.03$ 2.45$ 1.00$ 1.47$ 0.03$ 2.50$ 1.02$ 1.49$ 0.03$ 2.54$
C&I 1.25$ 1.34$ 0.05$ 2.64$ 1.18$ 1.23$ 0.05$ 2.46$ 1.14$ 1.21$ 0.05$ 2.40$
Total 2.29$ 2.72$ 0.08$ 5.09$ 2.18$ 2.70$ 0.08$ 4.96$ 2.17$ 2.70$ 0.08$ 4.95$
DSM Portfolio Budget Table ($ Million)
Sector Totals
Year 1 Year 2 Year 3
Implementation Incentives EM&V Total Implementation Incentives EM&V Total Implementation Incentives EM&V TotalResidential $0.14 $0.18 $0.00 $0.33 $0.13 $0.19 $0.00 $0.33 $0.13 $0.19 $0.00 $0.33Commercial & Industrial $0.10 $0.11 $0.00 $0.22 $0.10 $0.11 $0.00 $0.22 $0.10 $0.11 $0.00 $0.22Total $0.24 $0.29 $0.01 $0.55 $0.23 $0.30 $0.01 $0.55 $0.23 $0.30 $0.01 $0.55
DSM Portfolio Budget Table ($ Million)Yr. 1 Yr. 2 Yr. 3
Sector Totals
DSM Portfolio Savings Table
Totals by Sector 3-year
Participation
3-Year Gross Annual Energy Savings
(MWh)
3-Year Peak Demand
Savings(MW)
Residential 32,683 18,794 5.20
Commercial & Industrial 358 37,491 6.93
Total Portfolio 33,041 56,286 12.13
DSM Portfolio Savings Table
Totals by Sector 3-year
Participation
3-Year Gross Annual Energy Savings (MWh)
3-Year Peak Demand
Savings(MW)
Residential 6,962 2,481 0.687
Commercial & Industrial 32 3,312 0.545
Total Portfolio 6,994 5,793 1.232

6 | P a g e
2014 – 2017 DSM Plan Portfolio Summary
Background
On July 9th, 2009, Entergy New Orleans (“ENO”) filed an application with the New Orleans City Council (“The Council”) requesting approval of Demand Side Management (“DSM”) programs to be included in the Energy Smart New Orleans Plan “Energy Smart Plan.” In July of 2009, the Council approved the initial portfolio of programs, and these have been successfully implemented in the ENO and ELL-Algiers service territories. On October 30, 2012, pursuant to Council Resolution R-10-142, ENO filed its 2012 Integrated Resource Plan (“IRP”) to cover resource planning over the 2012-2031 planning horizon. Among other analyses, the IRP included an assessment of the market achievable-potential for DSM programs across the planning horizon. The following DSM Plan is derived from the content of the 2012 IRP and represents the preferred DSM portfolio for the program years 2014 – 2017. The programs developed here are expected to be implemented in both the ENO and ELL-Algiers territories. For purposes of this report, the Energy Smart programs to be implemented in New Orleans are broken out in more detail than the descriptions for Algiers. The programs themselves are identical as will be the incentive and non-incentive splits. To most economically utilize available resources, Algiers data is not presented in the same detail as ENO program detail, however, once public input is received, and any necessary program changes are made, detail for both programs will be submitted in an identical format.
Council DSM Rules
The 2009 Entergy New Orleans DSM Plan summarized the Guiding Principles established by the Council as necessary for the implementation of any DSM program; to reiterate as part of the 2014-2017 Plan, these are:
Energy Smart Programs should be developed for, available to, and benefit residential, commercial, industrial and governmental customer classes.
All programs should be cost-effective as defined by the Total Resource Cost (TRC) and the Program Administrator Cost (PAC) tests as defined in the California Standard Practices Manual: Economic Analysis of Demand Side Programs and Projects, October 2001 except for those programs listed in the 2009 Agreement in Principle that are not subject to the cost effectiveness tests.
Inputs to program design and cost effectiveness measurement should reflect reliable New Orleans data to the maximum extent practicable, while giving express recognition to allowable budget, time and technology constraints.
Each program should be of sufficient scale to provide a meaningful contribution to kW or kWh reductions over the period of years in which the program is applied.
Programs should reflect “best practices” as appropriate for New Orleans with consideration of the City’s unique economic, social and demographic environment and, to the extent relevant, should be consistent with successful models implemented in other jurisdictions.
With the exception of pilot programs, technologies should be commercially available and the necessary infrastructure should be present.
Programs should be economically significant within the budgetary realities of the Energy Smart Plan.
Assist in Demand Side Management market development and related job creation.
The programs should create measurable benefits to ratepayers and to the city.
The costs of program design, implementation, delivery, measurement of the benefits, and the costs of administration associated with the Energy Smart plan, including the costs of the Independent

7 | P a g e
Monitor and the Third Party Administrator, shall not exceed those funds so established to be collected in rates as authorized by the Council.
Additional DSM and energy conservation funding may be obtained from other sources and will be evaluated on its merits for inclusion in the Energy Smart program.
Program implementation should give priority to the use of local vendors wherever possible and shall be consistent with the criteria of Entergy’s Supplier Diversity Program which promotes the utilization of diverse suppliers (i.e., minority, women, veterans, disable veterans, historically underutilized business (“HUB”) Zone).
All programs shall contain a measurement and verification component for prospective evaluation, modification and improvement within standard industry practice.
IRP DSM Recommendations
The 2012 IRP outlines the reference case and preferred portfolio of DSM Programs for the entire planning horizon. These recommendations, along with the detailed recommendations provided in the Technical Supplement- Appendix B serve as the foundation for the recommended 2014-2017 Energy Smart portfolio of programs.
All programs included in the preferred portfolio are integrated into the 2014-2017 Energy Smart Portfolio with two exceptions: ENO and ELL have an Interruptible Rate for commercial customers, however, the Companies not include these in the portfolio of energy efficiency programs. A residential Direct Load Control programs is not directly included in the portfolio at this time, pending the review of the programs related to the recently completed DOE AMI pilot. There are also several programs included in the DSM Implementation plan which were not included in the preferred portfolio of programs developed through the IRP process. These include a Low Income Weatherization program and a program targeting savings through K-12 education and energy efficiency kits distributed to students in New Orleans schools. These programs were selected because of their market relevance and concurrent likelihood for cost-effective, successful, long-term energy savings within the territory.
Table 1: 2012 IRP Programs and Comparable 2014-2017 Program
2012 IRP Program Recommendation DSM Plan Program Equivalent
Industrial Program
Large Commercial Energy Solutions
Commercial Building Energy Management
Commercial New Construction Large Commercial & Industrial
Small Commercial Energy Solutions
Commercial New Construction Small Commercial & Industrial
ENERGY STAR Air Conditioning Residential Heating & Cooling (includes an AC Tune-up Component)
Residential Lighting and Appliances Consumer Products
Residential Energy Solutions
Energy Smart New Homes Home Performance with Energy Star
NA Low Income Audit & Weatherization
NA School Kits & Education

8 | P a g e
For the 3-year planning cycle considered in this plan, the recommended portfolio incremental savings per year are outlined in the table below, along with the estimated incremental annual savings from the portfolio recommended in this DSM Plan. While the savings provided in this portfolio are less than those targeted in the 2012 IRP, our analysis of existing program performance and local market and economic conditions suggest this is a realistic and achievable portfolio, while also pushing the market with more sophisticated program services and incentive designs.
Table 2: Energy Smart New Orleans - Incremental Recommended Portfolio Savings
*Gross annual MWh
Table 3: Energy Smart Algiers - Incremental Recommended Portfolio Savings
2014 – 2017 DSM Plan Development Methodology
CLEAResult undertook a comprehensive approach to develop this DSM Plan. This included three primary stages of analysis, which are outlined in the chart below and described in detail in the sections following.
Data Collection & Review
To identify programs and measures for inclusion in the 2014-2017 portfolio of programs, all available data on the service territory demographics, as well as industry best practices for DSM programs were considered. These were developed into a Market Profile (Appendix D) and Best Practices Review (Appendix E).
The Market Profile reviewed the data sources listed below to characterize the Residential and Commercial & Industrial market sectors and to better understand the current overarching economic trends within the Entergy New Orleans and Algiers territories. The assessment reviewed the prominent end-uses, consumption levels, and customer counts and used these to support the overall program savings potential:
Data Sources used in the Market Profile were:
The 2012 IRP recommendations
The 2010 – 2013 Energy Smart program history
Data Collection & Review
Measure Selection,
Characterization & Screening
Program Forecasting &
Portfolio Design
NA Multi-Family Weatherization
Category Yr. 1 Yr. 2 Yr. 3
Proposed Gross Annual Energy Savings (MWh)* 18,984 18,742 18,558
Proposed Gross Annual Demand Savings (MW) 3.96 4.07 4.09
Category Yr. 1 Yr. 2 Yr. 3
Proposed Gross Annual Energy Savings (MWh)* 1,884 1,952 1,957
Proposed Gross Annual Demand Savings (MW) 0.41 0.37 0.44

9 | P a g e
Customer sales data
Public data mining including:
Federal Reserve Bank data
CBECS and RECS
Energy Information Administration (EIA)
The US Census Bureau
In the Best Practices Review, CLEAResult collected data on program portfolio performance and spending for a sample of 12 utilities. The analysis reviewed utilities of comparable size, as well as regional utilities operating in comparable markets. In addition, the assessment included utilities located in developed energy efficiency markets. The 2014 – 2017 DSM portfolio was compared against these utilities in terms of its economic efficiency ($/kW, $/kWh), equitability ($/customer), and sophistication (program types offered).
Data sources in the Best Practices Review were:
Investor-Owned Utility DSM program plans and annual reports
The Energy Information Administration (EIA)
E Source
Measure Selection, Characterization & Screening
CLEAResult developed a preliminary measure list based on the three year Energy Smart program history, the best practices assessment and our understanding of the local market derived from the Market Profile and the 2012 IRP appendices. These measures were then screened by the project team engineers and analysts, using a comprehensive measure screening process that considers each measure’s engineering characteristics
Savings Potential: Using the Energy Smart Deemed Savings, Installation and Efficiency Standards, we developed measure savings assumptions that account for all engineering characteristics (e.g. hours of use, applicable building types etc.).
Local Market Applicability: Given the local program implementation history, we considered the participation likelihood based on the building types and end-uses located within the ENO and ELL-Algiers territory, and for existing measures, the performance of the measure over the initial three year Energy Smart implementation cycle. For both new and existing measures we reviewed measure performance in comparable markets relying on CLEAResult’s national implementation expertise and internal proprietary datasets.
Cost-effectiveness: We evaluated the incentives and measure costs to develop measure level cost effectiveness results, which were used to screen-out underperforming measures.
With numerous code changes going into effect in 2014, our analysis also considered the baseline changes affecting measures included in the portfolio; primary baseline changes are outlined in the table below.
Table 4: Primary Baseline Changes Affecting the 2014 - 2017 Portfolio
Measure Current Baseline as of March 2013
Change Date
Baseline Change
Res
iden
tia
l
Water heater 40 gal
0.92 EF 4/16/2015 0.95 EF
Water heater 50 gal
0.90 EF 4/16/2015 0.95 EF

10 | P a g e
Water heater 80 gal
0.86 EF 4/16/2015 1.97 EF
Lighting: General Use Lamps
EISA has rolling baseline changes:
100 W incandescent (already adjusted)
1/1/2012 72 W halogen
75 W incandescent (already adjusted)
1/1/2013 53 W halogen
60 W incandescent 1/1/2014 43 W halogen
40 W incandescent 1/1/2014 29 W halogen
Room Air Conditioners
Varies by type - 9.8 EER for most common type
4/21/2014 10.9 CEER for most common type
Linear Lighting (Existing only)
T12 baseline 1/1/2015 T12 with electronic ballast
Central Air Conditioning (5 tons and under)
Efficiency Requirement: SEER 13
1/1/2015 SEER 14
Air Source Heat Pump (5 tons and under)
Efficiency requirement: SEER 13, 7.7 HSPF
1/1/2015 SEER 14, 8.2 HSPF
Ductless Heat Pump
Efficiency requirement: SEER 13, 7.7 HSPF
1/1/2015 SEER 14, 8.2 HSPF
Com
mer
cial
Lighting: General Use Lamps Screw-in & Hard Wired CFL and LED Lamps
EISA has rolling baseline changes:
100 W incandescent (already adjusted)
1/1/2012 72 W halogen
75 W incandescent (already adjusted)
1/1/2013 53 W halogen
60 W incandescent 1/1/2014 43 W halogen
40 W incandescent 1/1/2014 29 W halogen
Linear Lighting: Higher Performance T8s (Existing only)
T12 baseline 1/1/2015 T12 with electronic ballast
Central Air Conditioning (5 tons and under)
Efficiency Requirement: SEER 13
1/1/2015 SEER 14
Air Source Heat Pump (5 tons and under)
Efficiency requirement: SEER 13, 7.7 HSPF
1/1/2015 SEER 14, 8.2 HSPF

11 | P a g e
This process culminated with a final measure list, which served as the primary input for the program forecasting process.
Program Forecasting & Portfolio Design
Using the final measure list developed, the CLEAResult team then considered the overall program forecasts and design. This process takes into consideration both the goals established in the 2012 IRP, the results of the three year Energy Smart portfolio implementation, the 2014 – 2017 program designs, and the national implementation experience of the project team to establish participation estimates by measure. These estimates were considered against the incentive levels required to achieve significant and cost-effective program savings. The project team also evaluated under-represented market sectors to target in the new portfolio, and new service offerings that will continue to advance market development. The analysis concluded with program, sector and portfolio level cost-effectiveness, savings estimates and spending requirements for the 2014 – 2017 DSM Portfolio.
Market Profile Summary
Entergy New Orleans reviewed the existing market potential study included in the 2012 IRP, publicly available datasets from the US Census, the Federal Reserve and other sources, and internal data on customer sales by meter type. We compared these findings with results from the Energy Smart Program implementation to develop a market profile for use in this DSM Plan.
The analysis found that although there is an overall upward trend in economic growth, the city labor force is still below the pre-Katrina levels, suggesting hardships experienced in the economy remain a factor within New Orleans. The analysis also looked at customer sales by market segments and primary technology end-uses within the territory. Overall, the findings are consistent with those reported previously; however, the residential new homes market findings suggest the current opportunity is more minimal than the 2012 IRP.
The chart below was developed using data from the regional Federal Reserve Bank serving the New Orleans area. Despite a modest gain in new housing starts, the overall decline and the historical performance of the Energy Smart New Homes program suggests the market is not appropriate for a residential new construction program at this time.
The Market Profile reviewed the 2012 IRP characterization of residential end-uses, as described in the pie chart below. The analysis showed significant overall consumption in HVAC (over 50%) with the majority of this focused in space cooling, and the remaining consumption distributed somewhat evenly between appliances and lighting.

12 | P a g e
As indicated in the pie charts below, the majority of energy use in commercial buildings is accounted for by lighting; however cooling and appliance, and plug loads are also significant end-uses. Roughly half of the industrial energy use is accounted for by process (e.g. compressed air, fans and pumps), with the remaining energy consumption in drives account for the majority of end use energy.
The complete assessment is included in Appendix D of this report.
Best Practices Summary
To better understand how the Energy Smart DSM Plan compares with other utility DSM portfolios, as well as the industry as a whole, CLEAResult collected data on program portfolio performance and spending for a sample of 12 utilities. The analysis reviewed utilities with comparable customer counts and sales, neighboring utilities for a regional comparison, and additional utilities located in developed energy efficiency markets. Details of this analysis are presented in Appendix E of this report. Overall findings confirm the recommendations in this portfolio are appropriately aggressive given the market maturity and past program performance.

13 | P a g e
Table 5: Residential Benchmarks $/kWh
Table 6: Commercial Benchmarks $/kWh
$-$0.10 $0.20 $0.30 $0.40 $0.50 $0.60 $0.70 $0.80
Residential Forecasted $/kWh
Yr 1 Yr 2 Yr 3
$-$0.10 $0.20 $0.30 $0.40 $0.50 $0.60 $0.70 $0.80 $0.90 $1.00
Commercial Forecasted $/kWh
Yr 1 Yr 2 Yr 3

14 | P a g e
Table 7: Matrix of Program Offerings of Benchmarked Utilities
ENO Program Portfolio PG
&E
SDG
&E
NY
SER
DA
Onc
or
AEP
- T
CC
CL&
P
Uni
ted
Illum
inat
ing
CN
P
Con
Ed
Duq
uesn
e Li
ght
NY
SEG
Residential Consumer Products Residential Heating & Cooling Multi-Family Weatherization Low Income Audit & Weatherization Home Performance With ENERGY STAR Energy Efficient New Homes Small Commercial Solutions Large Commercial solutions
DSM Portfolio
Portfolio Budgets & Savings
The CLEAResult Project Team developed the 2012 – 2014 recommended portfolio of programs through a rigorous analytical process that considered among other things, the current market in New Orleans, the performance of the existing portfolio of programs, the performance of comparable utility portfolios as well as more aggressive portfolios offered in developed markets such as California and New York. While the portfolio does not develop all recommendations of the 2012 IRP, the programs included in this portfolio are more sophisticated than those currently offered and represent an appropriately aggressive portfolio that targets a diverse set of customer end-uses and markets while also pushing the Orleans Parish residents toward installation of emerging technologies. The following sections provide an overview of the portfolio metrics as a whole and within each sector, as well as the overarching sector strategies. In addition to summaries of the recommended program, each sector summary outlines pilot programs for implementation during this period; funding for one or two pilot programs would come from the existing program allocations, although specific pilot program funding has not yet been assigned.
Table 8: Energy Smart New Orleans DSM Portfolio Budget Table
Implementation Incentives EM&V Total Implementation Incentives EM&V Total Implementation Incentives EM&V Total
Residential 1.04$ 1.38$ 0.03$ 2.45$ 1.00$ 1.47$ 0.03$ 2.50$ 1.02$ 1.49$ 0.03$ 2.54$
C&I 1.25$ 1.34$ 0.05$ 2.64$ 1.18$ 1.23$ 0.05$ 2.46$ 1.14$ 1.21$ 0.05$ 2.40$
Total 2.29$ 2.72$ 0.08$ 5.09$ 2.18$ 2.70$ 0.08$ 4.96$ 2.17$ 2.70$ 0.08$ 4.95$
DSM Portfolio Budget Table ($ Million)
Sector Totals
Year 1 Year 2 Year 3

15 | P a g e
Table 9: Energy Smart New Orleans DSM Portfolio Savings Table
Table 10: Energy Smart Algiers DSM Portfolio Budgets Table
Table 11: Energy Smart Algiers DSM Portfolio Savings Table
EM&V Budget
The budgets outlined above include an allocation toward EM&V, which totals roughly 3% of the annual portfolio budget. This amount is comparable to the EM&V spending in the first cycle of programs and is consistent with the average percentage of utility DSM annual spending on EM&V as described by a recent E Source research brief on budget breakdowns in utility DSM programs.2
2 Drexler, Kate. DSM Budget Breakdown: Benchmarking DSM Budgets. E Source Research Brief, published June 20, 2012. www.esource.com.
DSM Portfolio Savings Table
Totals by Sector 3-year
Participation
3-Year Gross Annual Energy Savings (MWh)
3-Year Peak Demand
Savings(MW)
Residential 32,683 18,794 5.20
Commercial & Industrial 358 37,491 6.93
Total Portfolio 33,041 56,286 12.13
DSM Portfolio Savings Table
Totals by Sector 3-year
Participation
3-Year Gross Annual Energy Savings (MWh)
3-Year Peak Demand
Savings(MW)
Residential 6,962 2,481 0.687
Commercial & Industrial 32 3,312 0.545
Total Portfolio 6,994 5,793 1.232

16 | P a g e
DSM Portfolio Net Benefits and Cost Effectiveness Analysis
The program designs were loaded into portfolio screening model, and screened for cost-effectiveness. The portfolio screening model takes into consideration savings and costs over the lifetime of each measure, the costs associated with delivering the programs, as well as economic factors, and avoided costs of energy and demand. The table below summarizes the cost effectiveness results for both the Total Resource Cost test (TRC) and the Utility Cost test (UCT), sometimes referred to as the Program Administrator Cost test (PACT).
Table 12: Energy Smart New Orleans DSM Portfolio Costs and Benefits
The total benefits derived from the programs over the three year implementation are approximately $28.8 million. The table shows that the programs are cost effective, with a portfolio level TRC benefit-cost ratio of 1.30 and a UCT benefit-cost ratio of 2.02. That means that every dollar invested in energy efficiency returns $1.92 in total benefits to ratepayers and $1.87 in total benefits to the utility.
The benefit categories in the TRC test include the value of energy savings, electric system benefits, and other measurable benefits (for example, participant resource benefits, participant non-resource benefits, and benefits due to measurable market effects). The screening tool relies on the avoided costs provided by Entergy New Orleans in the 2012 IRP. Costs included in the TRC test include all Program Administrator costs and program participant costs. Program Administrator costs include program implementation expenses, evaluation costs, any proposed performance incentives, and the tax liability for performance incentives. The tool calculates a present value of the sum total of all costs and benefits.
Bill Impacts
CLEAResult considered the portfolio impacts on customer rates in its analysis. It is important to note that the actual rate and bill impact that will be realized by a customer will depend on several variables, including the cost of service in a particular Program Administrator‘s service territory, the customer's actual individual usage, the level and quality of measure installation, and the availability of public or private funds other than those collected through the SBC for application towards energy efficiency expenditures.
In calculating rate and bill impacts, CLEAResult used the following methodology:
Rate and average bill impact analysis should be performed on a portfolio basis, as opposed to a program-by-program basis, because it is the entire portfolio of programs that will affect customer rates and bills.
Rate and average bill impact estimates should account for the impacts over the long term (e.g., for the average life of efficiency measures), in order to capture the full effect of energy efficiency savings and costs.
DSM Portfolio Costs and Benefits ($ Million)
Totals by Sector TRC Total
Benefits TRC Benefit-Cost Ratio
UCT Benefit-Cost Ratio
Residential $10.7 1.29 1.43
Commercial & Industrial $18.1 1.30 2.61
Total Portfolio $28.8 1.30 2.02

17 | P a g e
Rate and average bill impact analyses should compare the estimated rates and bills with the energy efficiency programs in place to the estimated rates and bills that would be in place in the absence of the energy efficiency programs.
Rate and average bill impact estimates should be conducted for each customer class, as well as for all customers on average.
Rate and average bill impact estimates should present not only the absolute dollar increase in distribution rates and bills but also the percentage increase in distribution rates and bills.
Rate and average bill impact estimates should present the percentage impact on total rates and bills, as well as the percentage impact on distribution rates and bills.
Residential Program Portfolio
The overall approach driving this DSM plan was to retain the aspects of the existing program that have or are likely to generate cost effective savings while achieving their strategic objectives within the portfolio, and then to modify the remainder of the program to best achieve Energy Smart goals and objectives. Some of the Residential program initiatives have been re-organized to better leverage economies of scale and better suit their respective market channels. For example, the Residential Heating & Cooling program initiative has combined A/C tune-ups with unit replacements and will work in conjunction with the A/C tune-up component of the Small Commercial program. This allows for the same program implementation staff and the same program delivery mechanisms to be used across these two initiatives. Room A/C units and lighting products were combined into a program initiative focused on the retail channel. Multi-family weatherization was broken out into its own program initiative to better focus light weatherization directed at property managers. The new School Kits & Energy Education program initiative will deliver education and generate savings in a unique way through local schools which impacts residential energy consumption in the local communities. The Residential Portfolio as a whole represents a comprehensive DSM portfolio that utilizes multiple market channels, addresses multiple market segments and optimizes a cost effective approach to energy and demand savings.
Home Performance with ENERGY STAR: Formerly, Residential Solutions, this officially sponsored HPwES program aligns with the ongoing DOE’s requirements changes and offers a whole home approach for single family unit customers.
Consumer Products: This retail channel program initiative includes lighting and room A/C measures for this plan cycle. The program will lay the foundation for developing retailer and manufacturer partnerships supporting the integration of additional measures during the next program cycle.
Multi-Family Weatherization: The Multi-Family Weatherization program initiative provides direct installation of instant savings measures and weatherization to buildings with individually metered units through a streamlined assessment and customer process focused on the property manager.
Low Income Audit & Weatherization: This program targets a hard to reach income qualified segment of the market with significant weatherization of single family and multi-family units up to a maximum of $2,500 incentives per unit.
School Kits & Energy Education: Local partner organizations will deliver energy education and energy conservation kits to fifth to seventh grade class rooms Orleans Parish schools. Savings will be claimed as instant savings measures are installed and self-reported by those students’ families via an online system via the EnergySmart web site.
Residential Heating & Cooling: Implemented with the Small Commercial A/C tune-up measure, this program initiative will use DSM industry best practices for delivery of tune-ups using an M&V approach to generate more preciseenergy savings as well as incentives for AC replacements.
Energy Efficient New Homes: This program initiative has been eliminated due to its very low participation and a very low projected TRC result. In order for this plan to offer a number of separate program initiatives, the budget from Energy Efficient New Homes program was reallocated within the

18 | P a g e
Plan to allow builders to still prescriptively participate in other program initiatives such the Home Performance with Energy Star and Residential Heating & Cooling programs.
Regarding residential program pilots, an initiative to show that savings can be generated through residential new construction code compliance will be implemented within the first two years of the plan cycle. In certain states, studies of compliance of actual construction practices to local active building, mechanical and energy codes have shown gaps. These compliance gaps offer real opportunity for energy and demand savings for DSM programs. A code compliance pilot should consider energy code trainings, a circuit rider technical assistance offering and development of documentation tools to support compliance with the energy code. The pilot will involve working closely with the utility staff, local engineering code department and building inspectors, and external stakeholders consisting of the building community (owners, developers, architects, engineers, contractor, etc).
Additionally, a study on new learning thermostats will be determined in program year one, and run in either program year one or two. A pilot may result from this study. The market offers a Nest brand learning thermostat which makes savings claims that should be verified prior to including the measure in programs. This study will provide industry ground breaking understanding as to the savings potential of such learning thermostats.
Table 13: Energy Smart New Orleans Residential Portfolio Savings
Residential Portfolio Savings Table
Program Name 3-year
Participation 3-Year Savings (gross kWh)
3-Year Demand (gross kW)
Home Performance with Energy Star
2,400
3,561,286
1,418
Consumer Products POS
10,000
5,434,460
966
MF Wx
4,488
1,661,840
791
Low Income Audit & Wx
300
1,077,255
507
School Kits & Education
11,550
3,934,980
301
Res Heating & Cooling
3,945
3,124,648
1,216
Total
32,683
18,794,468
5,200
Table 14: Energy Smart New Orleans Residential Portfolio Budgets

19 | P a g e
While the Algiers Energy Smart programs will have their own budget and separate reporting, the programs offered in Algiers will mirror those offered in ENO’s territory.
Table 15: Energy Smart Algiers Residential Portfolio 3-Year Budgets and Savings
Program Budget Savings
(Gross kWh) Savings
(Gross kW) Cumulative Participation
Home Performance with Energy Star $ 254,452 470,295 187 317
Consumer Products $ 197,466 716,924 127 3,964 Multi-Family Weatherization $ 151,921 219,622 105 593
Low Income Audit & Weatherization $ 157,141 142,356 67 40
School Kits & Education $ 78,893 519,995 40 1,526 Res Heating & Cooling $ 150,127 412,436 160 521 Total $990,000 2,481,628 687 6,962
Commercial and Industrial Programs
The overall approach driving this DSM plan was to retain the aspects of the existing program that generate cost effective savings while achieving their strategic objectives within the portfolio, and apply industry best practices to best achieve Energy Smart goals and objectives including improved measure diversity, achieving higher savings goals, and enhanced participation in the large C&I sector. The commercial and industrial program portfolio will employ a comprehensive approach to program delivery by providing a suite of program offerings with targeted services and measures to address different aspects of a customer’s energy requirements. The 2014-2017 program portfolio and initiatives were designed to stimulate activity in markets that are currently underserved by existing programs or represent sectors of vital interest to the New Orleans culture and economy, including schools, small hospitality, and industrial sectors, and to improve measure diversity achieved by the programs. Other program strategy and improvements over existing programs include: streamlining program participation through the use of field tools; larger incentives for non-lighting measures in order to increase measure diversity; enhanced program services for Large C&I customers to identify and achieve savings; and targeted program services for specific market sectors.
For the 2014 – 2017 program years, the C&I sector will be served through two umbrella programs; Small Commercial Solutions for customers under 100 kW, and Large Commercial Solutions for customers 100 kW and over. The umbrella programs offer simplified program participation and consistent processes for participation while also offering market segmented collateral that provides marketing messages that speak to each customer segment. This approach reduces confusion in the market while still offering relevant messaging to each market segment. Contractors and customers will have a single point of contact throughout their participation. This will ease their entry into the program and facilitate relationship building between the program and its participants. Using consolidated marketing materials helps generate economies of scale which can increase the outreach capability of the program without incurring added cost.
Incentive Non-Incentive Total Incentive Non-Incentive Total Incentive Non-Incentive TotalHPwES $ 384,381 $ 247,000 $ 631,381 $ 419,639 $ 233,000 $ 652,639 $ 413,702 $ 228,000 $ 641,702 Consumer Products POS $ 218,750 $ 234,000 $ 452,750 $ 284,350 $ 229,000 $ 513,350 $ 293,600 $ 236,000 $ 529,600 MF Wx $ 219,032 $ 169,010 $ 388,042 $ 216,543 $ 160,100 $ 376,643 $ 216,543 $ 168,350 $ 384,893 Low Income Audit & Wx $ 251,033 $ 151,000 $ 402,033 $ 251,033 $ 136,000 $ 387,033 $ 251,033 $ 149,000 $ 400,033 School Kits & Education $ 98,280 $ 107,000 $ 205,280 $ 98,280 $ 97,000 $ 195,280 $ 98,280 $ 98,000 $ 196,280 Res Heating & Cooling $ 208,538 $ 163,950 $ 372,488 $ 197,513 $ 176,300 $ 373,813 $ 215,075 $ 175,000 $ 390,075 New Homes $ - $ - $ - $ - $ - $ - $ - $ - $ - Total $ 1,380,013 $ 1,071,960 $ 2,451,973 $ 1,467,357 $ 1,031,400 $ 2,498,757 $ 1,488,232 $ 1,054,350 $ 2,542,582
Year 1 Year 2 Year 3Program

20 | P a g e
In addition, establishing the programs as overarching umbrellas, under which the individual initiatives are implemented, helps keep the programs flexible and able to target specific customer segments as the program learns more about the needs of specific market segments. This allows the programs to remain relevant and actively evolve over time.
Under each umbrella program there will be targeted initiatives that bundle services, measures and delivery together to enhance participation in key customer segments.
The proposed programs are as follows:
Small Commercial Solutions Program – the Small Commercial Solutions program will continue to offer facility audits and a suite of common energy efficiency measures with savings assigned per the New Orleans TRM, allowing for simple approaches to QAQC and savings verification. In addition, the program will offer two specific initiatives targeted at enhancing participation in key market segments and improving measure diversity achieved through the program by increasing the adoption of HVAC efficiency measures. The Small Commercial Solutions initiatives focus on a direct install model that engages contractors to deliver measures into customer facilities through the use of field tools that greatly streamline and simplify program participation while also improving data collection and data accuracy. This will also improve program retention rates, helping contractors close and complete more projects.
Hospitality Initiative – targeting small hotels, bed and breakfasts, and restaurants with applicability to grocery and convenience stores as well. This initiative will be delivered through a network of Participating Contractors equipped with advanced field tools; these tools are an added feature for the new program that will enable them to quickly deliver program applications and project financials to customers, and streamline their program activity
Commercial Heating and Cooling Initiative– targeting small HVAC units under 15 tons for tune-ups and upgrades, run in conjunction with the Residential Heating and Cooling Program. This initiative will be delivered through a network of Participating Contractors equipped with a field tool that will enable them to quickly deliver program applications and project financials to customers, and the program will cover 100% of costs of tune-ups for eligible systems and customers.
Large Commercial Solutions Program - the Large Commercial Solutions program will continue to offer facility audits and incentives for a suite of common energy efficiency measures with savings assigned per the New Orleans TRM, allowing for simple approaches to QAQC and savings verification. In addition, the program will offer two new initiatives targeted at enhancing participation with school and city accounts through additional service offerings, and enhancing the existing custom program offering through the provision of M&V services for projects that achieve a minimum of 100,000 kWh. This is an expanded service offering compared to the existing program that required third party verified savings for custom projects.
School and City Initiative – this initiative will offer benchmarking and Energy Master Planning services to school and city accounts that are motivated to reduce energy use at their facilities. These services will facilitate the prioritization and planning of energy improvements in schools and city government facilities, and provide these customers with an Energy Master Plan for achieving energy management goals.
Custom Initiative – this initiative will target efficiency improvements affecting systems that cannot be captured under prescriptive measure offerings by offering expanded M&V services for large projects that are pre-approved by the program and are expected to achieve a minimum of 100,000 kWh annual savings. These projects may include retro-commissioning, process improvements, and other system level custom projects or projects involving unique equipment not part of the prescriptive offerings. Program staff will pre-approve projects for customer and measure eligibility, and provide M&V services or review as needed to verify measures savings. The program will provide technical support to identify custom project opportunities in customer facilities.
Regarding C&I program pilots, a suggested pilot is to use contractor cash “spiffs” to encourage the removal of tubular T12 lighting prior to the shift in baseline for these retrofits. To date, the program has had great success with installing highly efficient LED and CFL lamps in small commercial facilities, with lower participation for removing highly inefficient T12 lighting. The purpose of this pilot would be to ensure that

21 | P a g e
customers take maximum advantage of program incentives available to replace highly inefficient T12 lighting while sufficient incentives are still available for these retrofits. While these spiffs are typically small in amount (on the order of $25), they could have a substantial impact on program activity. The pilot would measure the improvement in activity and realized T12 retrofit savings achieved by offering contractor spiffs for T12 retrofits. This pilot would apply to both Small and Large C&I Solutions programs.
For Small Commercial Solutions, a pilot initiative is to enhance activity in the small commercial solutions program by offering offer contractors spiffs for each correct and complete application that is submitted to the program using the program tool. This pilot is suggested if the program finds that contractors need an additional incentive to take advantage of the program tool, and would measure the effectiveness of using spiffs to engage contractors in using new technology that streamlines program participation.
For Large Commercial Solutions, Resource Conservation Manager (RCM) services could be offered as a pilot to a limited number of schools that take advantage of benchmarking and Energy Master Planning services. Benchmarking and EMP services frequently suggest the incorporation of an energy awareness program and RCM is an effective way of following through with that. RCM employs an energy accounting tool to track energy usage and covers the cost of training and maintaining an energy manager to use the energy accounting tool to improve energy awareness for building occupants and achieve substantial energy savings through behavior modification and operations adjustments. These initiatives are found to reduce electric and gas energy use in schools by 10-30%. Another large C&I pilot is the extension of benchmarking and EMP services to large C&I customers outside of schools. The purpose of this pilot would be to measure enhanced program activity that is driven by providing data on facility energy use through benchmarking, bringing together facility stakeholders through Energy Master Planning activities, and providing the facility with an Energy Master Plan.
Table 16: Energy Smart New Orleans C&I Portfolio Savings
Table 17: Energy Smart New Orleans C&I Portfolio Budgets
Table 18: Energy Smart Algiers C&I Portfolio 3-Year Budgets and Savings
Program Budget Savings
(Gross Annual kWh) Savings
(Gross kW) Cumulative Participation
Small Commercial Solutions $201,877 855,917 225 26
Large Commercial Solutions $458,123 2,456,189 321 6
Total $660,000 3,312,106 546 32
Incentive Non-Incentive Total Incentive Non-Incentive Total Incentive Non-Incentive TotalSmall C&I $ 357,721 $ 316,822 $ 674,542 $ 399,333 $ 375,893 $ 775,225 $ 429,515 $ 394,836 $ 824,351 Large C&I $ 984,547 $ 968,017 $ 1,952,564 $ 834,195 $ 841,565 $ 1,675,759 $ 781,440 $ 786,612 $ 1,568,052 Total $ 1,342,268 $ 1,284,838 $ 2,627,106 $ 1,233,528 $ 1,217,457 $ 2,450,985 $ 1,210,955 $ 1,181,449 $ 2,392,403
Year 1 Year 2 Year 3Program
C&I Portfolio Savings Table
Program Name 3-year
Participation 3-Year Savings (kWh) 3-Year Demand
(kW)
Small Commercial Solutions 294 9,638,184 2,852
Large Commercial Solutions 64 27,853,606 4,073
Total 358 37,491,790 6.925

22 | P a g e
Summary
The 2014-2017 DSM Portfolio of programs was developed through a rigorous analytical process that included sophisticated measure screening and program modeling techniques, a review of market and proprietary datasets, and an analysis of comparable utility portfolios to benchmark the sophistication and cost-effectiveness of the Energy Smart portfolio. As a whole, the portfolio represents a more sophisticated set of programs that cost-effectively target the highest end-uses while adding new program services, such as Energy Master Planning and Benchmarking, and new incentive designs to motivate participation in the deeper and more long-lasting energy efficiency measures. The following sections include additional background materials and analysis conducted during this analysis; these are outlined in the list below.
Appendix A: Program Overviews
Appendix B: Detailed Measure List
Appendix C: Market Profile
Appendix D: Best Practices Review

23 | P a g e
APPENDICES
Appendix A: Program Overviews Residential Program Overviews
Program Home Performance with ENERGY STAR (formerly Residential Solutions) Program Objective
The objective of the Home Performance with ENERGY STAR program is to create a platform that produces electric energy savings from bundled, phased and associated retrofits.
Program Description
This program was formerly known as Residential Solutions. As a DOE Home Performance with ENERGY STAR sponsor, Energy Smart provides an energy savings program using a whole house approach. This includes online or other customer-input screening tools, three levels of in-home assessments, including walk-through and comprehensive assessments with diagnostic testing, energy savings modeling before and after retrofits and connections to other program offerings.
The Program will align with changes at the USDOE Home Performance with ENERGY STAR Program, an evolving process that is anticipated to provide a step-wise approach to garner savings and participation, with a potential minimum savings threshold for homes to be certified. It is a market driven program, whereby marketing and referrals drive customers to participating energy auditors and home performance contractors.
Auditors and qualified contractors perform an in-home energy assessment, create a scope of work for recommended retrofits and educate customers toward choosing cost-effective energy efficiency improvements. Savings estimates are calibrated to homeowner’s energy history using industry standard software. Participating projects will have a target annual energy savings goal, with incentives tailored to encourage bundled measures and increased savings. Over the three-year program cycle, participation from new and re-engaged projects is expected to increase.
A staged participation process allows homeowners to make improvements as their budget and priorities allow, re-engaging with the program for subsequent retrofits toward long-range persistent savings. Associated retrofits activities ties Home Performance participants to related program offers, including HVAC and products.
The program emphasizes developing an energy efficiency plan for the customer to act upon installing multiple recommended program measures through participating contractors. This requires focus on a strong home energy assessment conversion rate to drive energy efficiency measures. Measure bundling is desirable to increase the average savings per house. Quality control field inspection sample rates should remain high to keep participating trade allies closely aligned with program expectations. Quality control results should form the basis for a feedback loop back to the trade allies for their continuous improvement. Included in Quality Control is a rigorous contractor mentorship model to assure technical and programmatic compliance and provide appropriate contractor support for a variety of workforce skillsets.
This program serves as the comprehensive energy efficiency element within the DSM portfolio directed at market rate customers owning single family structures of up to four units. Its rich customer contact presents multiple opportunities for utility branding.

24 | P a g e
Target Market(s)
All homes in Orleans Parish are eligible for the program, with an emphasis on homes built in 1990 and prior. GIS data lists 125,610 single-family detached homes in this range of years.
Eligible Measures & Incentives
Attic Insulation Up to $0.35 per sq. ft. Wall Insulation $0.25 per sq. ft. Floor Insulation (Electric Heat) Up to $0.20 per sq. ft. Pool Pump Up to $400 Air Infiltration Sealing $0.20 per CFM Reduced Duct Sealing $0.24 per sq. ft. Solar Screens / Window Film $1 per sq. ft. Radiant Barrier $1.20 per sq. ft. Heat Pump Water Heater $600 Solar Screens (E or W 15 sf window) $15.00 CFL/LED Direct Install Pipe Insulation Direct Install Faucet Aerator (<= 1.5 GPM) Direct Install Low Flow Showerhead (<=2.0 GPM) Direct Install Advanced Power Strip, 12 plug Direct Install
Note: Final incentive levels are subject to change pending completion of final program design. Participating home energy assessment contractors will perform both walk-through and comprehensive assessments. Energy Smart will offer a customer rebate for the portion of the assessment if the customer installs one or more energy efficiency upgrades recommended by the auditor. Both assessments will include the direct installation of electricity saving measures including CFL or LEDs, a low-flow showerheads, faucet aerators, hot water pipe insulation and reduced hot-water set point.

25 | P a g e
Implementation & Delivery
Key elements of Energy Smart Home Performance with Energy Star program include: Contractor Recruitment and Training Energy Smart will recruit HVAC, remodeling, insulation and weatherization contractors as well as home energy rating system (HERS),Building Performance Institute (BPI) and other trade allies interested in offering home energy performance services to their customers.. Contractors will be required to sign a participation agreement and abide by all program protocols and reporting requirements. Intake Customers contacting the customer service center should first get a brief pre-qualification of their house to determine their house’s savings potential. Then they are to be scheduled for one of the three assessments below: Program Implementation Level 1 Assessment “Silver”: This is a walkthrough/visual inspection quick home energy assessment. Contractors will directly install low-cost measures, such as CFLs, aerators, showerheads and pipe insulation for customers with electric water heaters, where needed and allowed by participating customers. These low cost/direct install measures will be available at no additional charge to the customer. Some homeowners may follow-up with more comprehensive energy efficiency improvements, including air and duct sealing or appliance retrofits, or request a more comprehensive energy assessment. Level 2 Assessment “Gold”: Participating contractors will provide comprehensive home assessments for interested customers for a fee. In addition to walk-through and direct install of low-cost measures, this assessment will be designed to estimate potential energy savings due to infiltration and heat loss through walls and attics. Diagnostic evaluations conducted during the Assessment may include duct and air seal testing and combustion safety testing. An assessment report will be presented to the customer with recommendations for upgrades and information about available financing or cash incentives. Level 3 Assessment “Platinum”: Walk-through assessment with blower door and duct leakage test plus computer modeling conducted to make home eligible to participate in state-funded programs, as applicable. Incentive application Contractors will submit applications for services performed. The program will conduct a QA/QC review of all applications to ensure that all required information and documentation has been provided. Incentive payment Contractors will receive incentives for approved applications. Project verification Energy Smart reserves the right to site-verify installations prior to project approval and incentive payment. The program will perform site verification on a statistically significant number of installations to verify the performance of work completed.

26 | P a g e
Marketing
Marketing to auditors and home improvement contractors will involve a variety of strategies and tactics, including, but not limited to:
• A program website • Online advertising • Advertisements in local trade publications • Attending trade shows occurring in the New Orleans area • Purchasing contact lists of contractors in New Orleans, using sources such as
USADATA
Marketing to homeowners may include: A program website, connection to current online screening tools where homeowners can
input information about their home and see immediate recommendations Online advertising Brochures for direct mail, contractors, and customer outreach at community events in New
Orleans Program materials available through Energt Smart’s “One Stop Energy Shop”
Program Administrator sponsored call center To ensure that customers perceive Energy Smart’s energy efficiency programs as a seamless set of offerings, cross-referrals from other programs will also be provided where appropriate.
The final program marketing plan will be developed by the selected program implementation
EM & V
EM&V of the Residential Solutions program should consist of a measurement of the existing baseline conditions of a sample of homes, the nature of the energy efficiency improvements installed, usage characteristics of the homes pre and post retrofit and assessing whether or not the homeowners would have undertaken the efficient actions in the absence of the program. Data gathering to expedite EM&V will be coordinated with the Implementation Contactor and the EM&V implementer in the final implementation design.
Year 1 Year 2 Year 3
Program Costs $631,381 $652,639 $641,701
Incentive Costs $384,381 $419,639 $413,702
Non-Incentive Costs $247,000 $233,000 $228,000
Gross Annual kWh Savings 1,103,541 1,223,492 1,234,252
Gross Annual kW Savings 445 494 479
TRC Test 1.18
PAC Test 1.63
Participant Test 2.71

27 | P a g e
Net to Gross Ratio 0.8
Utility Levelized Cost $ / kWh $ 0.03 Utility Levelized Cost $ / kW $ 66.97
No. of cust. in target group 125,610 125,610 125,610 Cumulative Participants 800 1,600 2,400 New Participants 800 800 800 Program Cost per Participant $ 789.23 $ 815.80 $ 802.13 NPV of Avg. Participant Savings $ 1,251
Avg. Part. Simple Payback (Yrs) 5.6
Lifetime Avoided CO2 (Tons) 10,032 11,123 11,221

28 | P a g e
Program Name Consumer Products Program
Program Objective
The objective of the Consumer Products Program is to generate significant energy and demand savings through the sales and installation of energy-efficient compact florescent light bulbs, LED (light omitting diode) lighting and room air conditioners sold in retail stores. The program will lay the foundation for developing retailer and manufacturer partnerships supporting the integration of additional measures during the next program filing cycle.
Program Description
The Consumer Products Program will achieve energy savings by motivating and incenting customer purchases. The program addresses multiple products delivered by retailers, streamlining communication and increasing the value proposition to retailers and manufacturers.
Customers will receive point-of-purchase discounts lighting. Customers may receive a point-of purchase-discount on room air conditioners or downstream direct to customer utility rebate on qualified, pre-selected energy-efficient products. The incentive delivery approach for room air conditioners will be determined by the retailer’s ability to meet program data requirements. Promotional materials in retail locations, online and other mass marketing channels will drive consumer awareness and generate consumer demand.
The program is designed to overcome market barriers to the stocking, sale, and purchase of efficient products. Current market barriers include:
Limited consumer awareness about the availability, benefits and features of efficient products, proper selections and proper installation.
Higher first cost of efficient products for consumers which can drive consumer choice to inefficient alternatives.
Consumer and retailer sales associates lack knowledge on the benefits and features of efficient products.
The consumer products program will engage consumers, retailers and manufacturers to overcome these barriers by:
Educating national, regional and local retailer sales associates on products and promotions.
Delivering consumer incentives and rebates.
Driving marketing strategies and tactics that educate customers on energy-efficient products and support them in making informed purchasing decisions.
Target Market(s)
The Consumer Products Program will target residential customers and savings will be allocated to the residential portfolio.

29 | P a g e
Eligible Measures & Incentives
Compact fluorescent light bulbs, light omitting diode (LED) lighting, and room air conditioners.
Note: Program incentive costs provided are not to exceed values. Incentives may be adjusted by the Program Administrator to reflect program design market conditions. Incentive budget can be used for cash and non-cash incentives. Measures may be added to this program during the DSM plan term.
Eligibility:
CFLs, LEDs and room air conditioners must be ENERGY STAR qualified and installed in a residential setting.
Measure2014 2015 2016
CFLs 15W (14W-18W) ENERGY STAR RATED $1.25 $1.25 $1.15CFLs 20W (19W-21W) ENERGY STAR RATED $1.25 $1.25 $1.15CFL 23W (22W-25W) ENERGY STAR RATED $1.25 $1.25 $1.15LEDs 8W ENERGY STAR RATED Downlights $10.00 $9.00 $8.00LEDs 13W ENERGY STAR RATED Downlights $10.00 $9.00 $8.00LEDs 15W ENERGY STAR RATED Downlights $10.00 $9.00 $8.00LEDs 20W ENERGY STAR RATED Downlights $10.00 $9.00 $8.00LEDs 9W ENERGY STAR RATED A-lamp $8.00 $7.00 $6.00LEDs 13W ENERGY STAR RATED A-lamp $8.00 $7.00 $6.00LEDs 15W ENERGY STAR RATED A-lamp $8.00 $7.00 $6.00LEDs 20W ENERGY STAR RATED A-lamp $8.00 $7.00 $6.00Room Air Conditioners < 6,000 BTUs ENERGY STAR RATED $35.00 $30.00 $30.00Room Air Conditioners 6,000- 7,999 BTUs ENERGY STAR RATED$35.00 $30.00 $30.00Room Air Conditioners 8,000 - 13,999 BTUs ENERGY STAR RATED$35.00 $30.00 $30.00Room Air Conditioners 14,000 - 19,999 BTUs ENERGY STAR RATED$50.00 $45.00 $45.00Room Air Conditioners > 20,000 BTUs ENERGY STAR RATED $50.00 $45.00 $45.00
Incentive

30 | P a g e
Implementation & Delivery
Program implementation will need to include final program design, start-up of operations, marketing and outreach, retailer relationship management, incentive/rebate processing, customer service center and program management and reporting.
Specific tasks include:
Market analysis of industry trends, procedures and partnerships. Retailer and manufacturer recruitment and selection. Recruitment should include RFP
development and distribution and MOUs. Continued retailer and manufacturer outreach and support to tailor special promotions, and
exchange information for enhanced in-store delivery. Consumer marketing through the Energy Smart website and in-store collateral. Field Services to verify products, promotional messaging, train retailers, staff events and
ensure efforts are following proper protocols. Incentive and rebate processing which includes data collection and reporting to track and
verify retailer point of sale data, and participant data to approve and generate incentive and rebate fulfillment to partners and/or customers.
Employ quality control process for data collection, invoicing, incentive/rebate fulfillment and field visit efforts.
Delivery of report monthly, quarterly and annually on progress to data for all planning and implementation activities.
Marketing
The Consumer Products Program’s consumer marketing efforts will include developing and implementing. Marketing efforts will highlight the Company and product benefits and features to increase consumer awareness and acceptance of energy-efficient products.
Marketing efforts may include:
Providing point-of-purchase advertising and marketing materials in retail stores
Facilitating in store consumer and retail sales associate events to educate on the consumer products program.
Communicating and providing access to program information and participating retailers on the Energy Smart website.
Advertising special promotions using online, other mass media channels and in-store advertising.
Branding marketing material with the ENERGY STAR® and ENTERGY logos.
Developing, publishing and distributing a program brochure(s).
In general, program marketing delivery strategies and tactics are subject to change pending the final implementation plan, which will be developed by the Company in conjunction with the selected implementation contractor.

31 | P a g e
EM & V
The EM & V of the consumer products program should be conducted by a third party evaluation contractor and include a multipronged approach to distinctly evaluate upstream and mid-stream efforts and a different approach for downstream end consumer efforts.
The upstream and midstream efforts can be conducted by one or both of the following approaches:
General population surveys of residential customers using screening methodologies to determine if they purchased any of the consumer product programs eligible products within the past year.
In-store intercepts can be conducted in participating retail stores near eligible consumer products in the program. Evaluators approach customers who are shopping in the aisle of eligible products and motivate customers to participate in phone or web surveys in exchange for a reward.
The downstream consumer rebates evaluation efforts can be conducted by the following approaches:
Engineering review of program savings, baseline while analyzing free ridership and spillover by interviewing program participants and non-participants questions regarding the programs influence on their purchasing decision and what their decision would have been in the absence of the program.
The final evaluation plan will be developed by a third party evaluation contractor with the Company following the development of the final program implementation plan.
Year 1 Year 2 Year 3
Program Costs $452,750 $513,350 $529,600
Incentive Costs $218,750 $284,350 $293,600
Non-Incentive Costs $234,000 $229,000 $236,000
Gross Annual kWh Savings 1,515,500 1,898,160 2,020,800
Gross Annual kW Savings 267 346 353
TRC Test 1.58
PAC Test 1.74
Participant Test 3.95
Net to Gross Ratio 0.65
Utility Levelized Cost $ / kWh $ 0.02
Utility Levelized Cost $ / kW $ 111.34
No. of cust. in target group 144,000 144,000 144,000
Cumulative Participants 10,000 20,000 30,000
New Participants 10,000 10,000 10,000
Program Cost per Participant $45.28 $51.34 $52.96
NPV of Avg. Participant Savings $ 98.81
Lifetime Avoided CO2 (Tons) 13,777 17,256 18,371

32 | P a g e
Program Multi-Family Weatherization
Program Objective
The objective of the Multi-Family Weatherization Program is to generate energy and demand savings from weatherization and direct install measures at individually metered multifamily housing units.
Program Description
This market rate program integrates multi-family measures into a targeted program. Doing so will create a better recruitment and outreach approach, capturing both residential- and commercial-type measures under one umbrella.
This program will recruit property managers of individually metered multi-family buildings as the building owner representatives. Targeting and prequalifying the buildings prior to engagement are important aspects of the program’s cost effectiveness.
The program approach includes a walk-through on-site energy assessment of each unit and the common areas of a participating building. Where applicable, assessors will install “instant savings” measures during the walk-throughs. The program then provides an assessment report and recommendations to the property manager and building owner, as appropriate. This report includes prescriptive and performance measures. The light weatherization energy efficiency measures include ceiling insulation, air sealing and duct sealing, in addition to the direct install measures such as shower heads, faucet aerators, CFL’s. Replacement HVAC equipment or HVAC tune-up opportunities will be referred to either the Residential or the commercial heating and cooling initiative within the Small Commercial Program, depending on the type of meter impacted. The “common area” measures for lighting, plug load, hot water, and others will be referred to the Small Commercial Program. Any referrals to other programs will be performed seamlessly – the property manager will be supported by a single point of contact based upon a single assessment and recommendation report.
Target Market(s)
This program specifically targets multi-family buildings that have individually metered units. There are an estimated 17,300 multi-family total housing units, out of which nearly all are individually metered. Program penetration is expected to address approximately 20% to 30% of this market potential each year over three years of this DSM plan. Saturation rates should be monitored over the course of the program implementation since this is a targeted and finite market.

33 | P a g e
Eligible Measures & Incentives
Measure Incentive
Ceiling Insulation $0.40/sq.ft.
Air Sealing $0.10/sq.ft.
Duct Sealing $300/unit
CFL 13W, in unit Direct Install
Faucet Aerator, in unit Direct Install
Low Flow Shower Head, in unit Direct Install
HVAC Equipment & Tune-Ups (cross-program) Note 1
Common Area Lighting, Plug Load, Hot Water, etc. (cross-program)
Note 1
Measure eligibility must be satisfied both on a measure level and on a building level. Units must be individually metered and the building or complex must contain five or more units. The incentives for in-unit measures and envelope measures impacting tenant energy consumption paid directly to the building owner. The incentives for directly installed instant savings measure cover the full measure cost, with no charge to the building owner or tenant.
Note 1: Incentives will be specified by the program initiative to which the customer is being cross referred.
Note 2: Incentives may be adjusted by the Program Administrator to reflect the program design market conditions. Incentive budget can be used for cash and non-cash incentives.”

34 | P a g e
Implementation & Delivery
Program implementation will need to include final program design, start-up of operations, marketing and outreach, retailer relationship management, incentive/rebate processing, customer service center, and program management and reporting.
The Implementation contractor will perform the walk-through energy assessments and manage the building or property owner relationship. The Implementation contractor will also be responsible for direct installation of instant savings measures. It is desirable that the installation of the remaining measures may be sub-contracted to local contractors as sub-contracted to the implementer. The multi-family property owner and building owner should work with one project manager as a point of contact. Part of the total value proposition to the customer is the project management of measure installation. Low income qualified buildings will be cross referred to the Low Income Weatherization program.
The project energy assessment will collect relevant data regarding opportunities and program staff will discuss any recommendations with property manager or building owner. The property manager should be presented with a report containing recommendations, financial considerations, other tax credits or rebates the may be available, and relevant third party financing. In the delivery of the assessment report, program staff will also provide a modest level of energy education. The program will also develop and provide “leave-behind” materials for tenants following direct installation of instant savings measures to enhance measure persistence.
Contractor training should be offered to ensure the selected sub-contractors can repeatedly and satisfactorily install measures per measures standards. It is expected that the installing sub-contractor for air infiltration and duct sealing conduct any performance tests as required by the savings protocol. The Implementer should determine a policy and standard for combustion safety testing to be conducted post-installation of measures, as appropriate.
The Implementer will complete the incentive application on behalf of the building owner or property manager for review and approval. Rebate checks will be sent to either the building owner or property manager, as appropriate.
Quality control will consist of field inspections during and after installations on a sample basis adequate to ensure satisfactory quality levels and measure installation compliance to measure standards.
In general, program implementation and delivery strategies and tactics are subject to change pending the final implementation plan, which will be developed by the Company in conjunction with the selected implementation contractor.
Marketing
Since this program is targeted to individually metered multi-family buildings, the primary marketing mechanism is direct outreach to the property managers of qualifying buildings. The implementation program staff should reach out to these property managers to engage them on performing building improvements within the context of this program, as outlined above. There are no specific requirements for the customer engagement method. Advertising via direct mail, program website and local media may be used.
EM & V
Program evaluation activities should include on or offsite (via phone) verification of a statistically significant sample of participants based on number of tenant units. The final evaluation plan will be developed by the third party evaluation contractor in conjunction with the Company following the development of the final program implementation plan.

35 | P a g e
Year 1 Year 2 Year 3
Program Costs $388,042 $376,643 $384,893
Incentive Costs $219,032 $216,543 $216,543
Non-Incentive Costs $169,090 $160,100 $168,350
Gross Annual kWh Savings 558,175 551,832 551,832
Gross Annual kW Savings 266 262 262
TRC Test 1.31
PAC Test 1.27
Participant Test 3.93
Net to Gross Ratio 0.80
Utility Levelized Cost $ / kWh $0.04
Utility Levelized Cost $ / kW $84.19
No. of cust. in target group 117,400 117,400 117,400
Cumulative Participants 1,496 2,992 4,488
New Participants 1,496 1,496 1,496
Program Cost per Participant $259.39 $251.77 $257.28
NPV of Avg. Participant Savings $294
Avg. Part. Simple Payback (Yrs) 8.5
Lifetime Avoided CO2 (Tons) 5,074 5,017 5,017

36 | P a g e
Program Low Income Audit & Weatherization
Program Objective The objective of the Low Income Audit & Weatherization Program is to target and significantly weatherize qualified low income single family homes and low-rise multi-family dwellings.
Program Description
This program targets a hard to reach income qualified segment of the market. The implementation contractor will work with Entergy to set criteria to identify and qualify targeted homes for participation in the program. The approach is to conduct the program with audit and installation practices similar to national public weatherization grant programs. The audit will use software to assess the building state, collect data and generate an energy efficiency improvement report.
Incentives cover full cost of measure installation and total incentive amount is limited to a maximum amount of $2,500 per house project. Direct installation of instant savings measures will occur during the audit. Quality control and combustion safety testing, as appropriate, are conducted to help ensure occupant safety. The measures include those related to building thermal envelope, HVAC, water heating and the instant savings measures.
Target Market(s) Target market is 33,793 units based on low income census estimates of single family dwellings, attached and detached. Of that, this program will target 100 homes for weatherization and target participants for a DIY workshop.
Eligible Measures & Incentives
Measure Incentive $2,500 maximum per home Air Sealing $0 .66 per sq. ft cond. space Duct Sealing $0 .50 per sq. ft cond. space Ceiling Insulation Up to $0.90 per sq. ft Wall Insulation $0.25 per sq. ft. Floor Insulation Up to $0.20 per sq. ft. Room A/C $400 A/C Tune-up $50 CFL Direct Install Low Flow Showerhead Direct Install Aerators Direct Install Pipe Insulation Direct Install Program incentive costs provided are not to exceed values. Incentives may be adjusted by the Program Administrator to reflect program design market conditions. Incentive budget can be used for cash and non-cash incentives. Audits will include the direct installation of electricity saving measures including up to 6 CFLs, a low-flow showerhead, faucet aerators, hot water pipe insulation and reduced hot-water set point.

37 | P a g e
Implementation & Delivery
Program implementation includes final program design, start-up of operations, marketing and outreach, retailer relationship management, incentive/rebate processing, customer service center and program management and reporting. Key elements of Low Income program implementation include: 1. Residential home improvement contractor recruitment and training: Energy Smart will recruit and train qualified contractors for weatherization projects. Contractors will be required to sign a participation agreement, and abide by all program protocols and reporting requirements. 2. HVAC contractor recruitment and training: In conjunction with the Residential Efficient HVAC program, Energy Smart will recruit and train contractors to perform the HVAC measures. Contractors will be required to sign a participation agreement, and abide by all program protocols and reporting requirements. 3. Proper WAC recycling and disposal: Energy Smart will work with a certified appliance recycling business to ensure that WACs removed through the program are treated with appropriate recycling and disposal processes. 4. Coordination and implementation of “DIY” workshops: Energy Smart will coordinate with local organizations currently engaged in energy efficiency workshops for residential customers in order to maximize the benefit of these events. 5. Incentive application: Low income customers will submit applications consistent with both WAP and Energy Smart s Low Income program guidelines. Contractors will submit applications for services performed. The program will conduct a QA/QC review of all applications to ensure that all required information and documentation has been provided. 6. Incentive payment: Contractors will receive incentives for approved applications. 7. Project verification: Energy Smart reserves the right to site-verify weatherization measures prior to project approval and incentive payment
Marketing
Marketing to residential home improvement and AC contractors will involve a variety of strategies and tactics, including, but not limited to: • A program website • Online advertising • Advertisements in local AC and construction trade publications • Leveraging of WAP marketing activities Marketing to low income homeowners may include: • Brochures for direct mail, contractors and customer outreach at events in New Orleans • A program website • Online advertising • Materials available through ENO’s “One Stop Energy Shop” • Leveraging of WAP marketing activities To ensure that customers perceive Energy Smart energy efficiency programs as a seamless set of offerings, cross-referrals from other programs will also be provided where appropriate. The final program marketing plan will be developed by the selected program implementation contractor in conjunction with ENO and ELL.

38 | P a g e
EM & V
Program evaluation activities should include on or offsite (via phone) verification of a statistically significant sample of participants who had their WACs replaced, interviews with AC, construction, appliance recycling contractors and verification through the WAP program that weatherization services were provided to homeowners Energy Smart made weatherization ready. The final evaluation plan will be developed by the third party evaluation contractor in conjunction with the Company following the development of the final program implementation plan..
Year 1 Year 2 Year 3
Program Costs $ 402,032 $ 387,032 $ 400,032
Incentive Costs $ 251,033 $ 251,033 $ 251,033
Non-Incentive Costs $ 151,000 $ 136,000 $ 149,000
Gross Annual kWh Savings 359,085 359,085 359,085
Gross Annual kW Savings 169 169 169
TRC Test 1.15
PAC Test 1.09
Participant Test 3.37
Net to Gross Ratio 1.00
Utility Levelized Cost $ / kWh $ 0.05
Utility Levelized Cost $ / kW $ 106.31
No. of cust. in target group 33,793 33,793 33,793
Cumulative Participants 100 200 300
New Participants 100 100 100
Program Cost per Participant $4,020.33 $3,870.33 $4,000.33
NPV of Avg. Participant Savings $ 4,144
Avg. Part. Simple Payback (Yrs) 1.9
Lifetime Avoided CO2 (Tons) 3,264 3,264 3,264

39 | P a g e
Program School Kits & Energy Education Program
Program Objective
The objective of the School Kits & Energy Education Program is to promote electric energy conservation education within the local primary school student population and to generate energy savings at those students’ homes.
Program Description
This program primarily serves fifth to seventh grade students within the local schools by providing them with educational materials and energy conservation kits. Other school grades may be targeted in addition to the fifth to seventh grade. The in-school educational and kit delivery will be delivered by local non-profit groups as a grass roots approach to increase the credibility and community nature of the program’s message. Students will take the kit home to install the individual measures with their parents or guardians. Conservation educational materials are also included within the kits. Participants are asked to self-report measure installations on an online system from which total savings and other results are reported to the Company. The ability of this program to have flexible launch dates and to throttle the rate at which schools are canvassed provides additional value to the entire EnergySmart portfolio. Moreover, the program is designed to fulfill a unique segment in the market not currently being addressed by existing programs.
Target Market(s)
This program directly targets public and private primary schools within the New Orleans city territory. It indirectly targets single family and multi-family homes where the kitted measures will be installed by the students or their parents.
Eligible Measures & Incentives
Measures Incentive
13W CFL Kit
Faucet Aerator Kit
Low Flow Shower Head Kit
LED Night Light Kit
Educational Conservation Guide Kit
Installation Instructions Kit
For simplicity, one kit is typically offered since most students do not know the home’s domestic hot water fuel type and since gas thermal savings benefits may be considered. Appropriate net to gross ratios should be applied during program planning. Incentives and measures within the kit may be adjusted by the Program Administrator to reflect market conditions. Incentive budget can be used for cash and non-cash incentives.

40 | P a g e
Implementation & Delivery
The implementation role of the Implementation Contractor includes program planning and design, kit supply, printed materials, program management, web page development and data reporting. Working with the Company, the Implementer will determine an outreach strategy in conjunction with the selected non-profit entities delivering the in-school component of the implementation. This resulting outreach strategy should gain approval from local authorities, as necessary. The in-school delivery component consists of a brief energy conservation tutorial to each class room and distribution of kits to students. In class room follow-up will continue to drive measure installation uptake in the home and to increase the Energy Smart presence in the schools in general. The kit should contain educational materials which teach both the student and the parent or adult guardian the importance of energy efficiency and conservation. The kit should also contain simple instructions at the student’s level on how to install the measures. Appropriate safety warnings should advise the student to install measures with the help of a supervising adult. Installations are self-reported by the student or parent primarily online on an Energy Smart web page which displays updated energy and water savings totals in a way that children and adults can relate to. A paper reporting system may be offered as a secondary reporting vehicle. The program implementation should allow for competition between schools to occur. A Quality Assurance plan should emphasize preventing program issues using frequent reviews with the local non-profit delivery entities and with the school officials. Phone surveys should also be conducted by the Implementer to establish a sufficient characterization of participant satisfaction and simple correlation of measure installations reported online versus reported during the survey.
Marketing There is no formal marketing necessary since the program relies on direct outreach to the school system officials. Albeit, the nature of the program’s collateral offers branding opportunities for Energy Smart and the Company via kit labeling, educational materials, shirt logos of delivery personnel, and the web page.
EM & V Program evaluation activities will most likely include verification of a statistically significant sample of participants based on number of tenant units via phone surveys. The final evaluation plan will be developed by the third party evaluation contractor in conjunction with the Company following the development of the final program implementation plan.

41 | P a g e
Year 1 Year 2 Year 3
Program Costs $ 205,280 $ 195,280 $ 196,280
Incentive Costs $ 98,280 $ 98,280 $ 98,280
Non-Incentive Costs $ 107,000 $ 97,000 $ 98,000
Gross Annual kWh Savings 1,311,660 1,311,660 1,311,660
Gross Annual kW Savings 101 100 100
TRC Test 1.45
PAC Test 1.0
Participant Test 13.48
Net to Gross Ratio 0.27
Utility Levelized Cost $ / kWh $ 0.01
Utility Levelized Cost $ / kW $ 178.07
No. of cust. in target group 4,200 4,200 4,200
Cumulative Participants 3,850 7,700 11,550
New Participants 3,850 3,850 3,850
Program Cost per Participant $53.32 $50.72 $50.98
NPV of Avg. Participant Savings $ 56
Avg. Part. Simple Payback (Yrs) 0.1
Lifetime Avoided CO2 (Tons) 11,924 11,924 11,924

42 | P a g e
Program Residential Heating & Cooling Program
Program Objective
The objective of the Residential Heating & Cooling Program is to generate energy and demand savings through both HVAC equipment replacements and tune-ups. This is accomplished by either improving the operating efficiency of the HVAC unit or replacing it with a higher rated efficiency unit. The program will work primarily through HVAC contractors and distributors.
Design Summary
The market barriers to achieving savings through high efficiency equipment and operational maintenance of residential units require a comprehensive program design to overcome. Barriers include:
Limited experience on the part of contractors with digital, diagnostic tune-ups based on refrigerant and air-side measurements.
Limited customer awareness on the availability and benefits of higher efficiency equipment.
Limited customer awareness of high efficiency tune-ups and that there are differences in rigor and benefits of high efficiency tune-ups.
Limited customer awareness on the comfort and humidity control benefits of properly-sized and maintained A/C units.
This program will move the market to overcome these barriers through multiple means. First, cash incentives paid to contractors and customers will promote the purchase of high efficiency equipment and high efficiency tune-ups. Secondly, training delivered to contractors raises the local HVAC market’s ability to perform proper tune-ups and installations. Thirdly, the program sets verifiable performance standards to ensure that contractors perform tune-ups that comply with industry best practices. This will help to ensure the realization of energy savings. Fourthly, education on energy savings provided to customers will inform their purchase decisions.
The marketing collateral, outreach support, training, field data collection, and rebate application process should combine the equipment replacement and tune-up components such that contractors and customers experience one integrated HVAC program. Program measures include air-conditioning and heat pump DX units for both the replacements and the tune-ups. Tune-ups in this program require an M&V savings approach to capture significantly more savings than standard deemed savings listed in the TRM. This achieves a more cost effective approach that also increases the skill set of the local HVAC contractor market.
This program is the residential counterpart to the Small Commercial Program heating and cooling initiative. The two program initiatives combine efforts to train contractors, conduct quality control efforts, and process rebates to achieve economies of scale for program implementation and delivery. Combining HVAC equipment replacement measures and maintenance tune-ups across both sectors offers participating HVAC contractors a strong value proposition.
Target market All single family, multi-family (individually metered) and mobile housing units in New Orleans with central air-conditioners or heat pumps. This constitutes a total unit population of 144,000.
Eligible Measures & Incentives
Measure Incentive PY1
Incentive PY2-PY3

43 | P a g e
Tune-Up, Residential $175 $175
Tune-Up, Multi-family $100 $100
A/C, 15 SEER $350 $200
A/C, 16 SEER $425 $225
A/C, 17 SEER $575 $275
A/C, 18 SEER $625 $300
Air Source Heat Pump, 15 SEER $400 $300
Air Source Heat Pump, 16 SEER $475 $325
Air Source Heat Pump, 17 SEER $625 $375
Air Source Heat Pump, 18+SEER $675 $400
Ductless Heat Pump
Ductless Heat Pump
Note: Incentives may be adjusted by the Program Administrator to reflect program design market conditions. Incentive budgets can be used for cash and non-cash incentives.
Tune-Up: Those with units more than one year old which are verifiably operable are eligible for the
tune-up and have not had a tune-up in the last five years that adjusted charge and airflow according to industry best practices. At a minimum, the tune-up sub-measures should include provisions for the following:
Filter replacement/cleaning Condenser coil cleaning Evaporator coil cleaning Blower cleaning Airflow measurement and adjustment Refrigeration charge measurement and adjustment
Equipment Replacement: Units rated less than 13 SEER are eligible for equipment replacement until January 1, 2015,
then less than 14 SEER beyond that date are eligible for replacement. All replacements are determined to be Replace On Burnout since Early Retirement HVAC replacement measures are not cost effective in this plan. Market unit potential:
It is estimated there are between 5,000 and 6,500 units replaced each year in the territory. It is estimated there are 100,000 residential central A/C or heat pump units which qualify for a
rigorous tune-up as specified above.

44 | P a g e
Implementation & Delivery
Program implementation will need to include final program design, start-up of operations, marketing and outreach, retailer relationship management, incentive/rebate processing, customer service center, and program management and reporting.
This program includes a process to recruit, train and manage participating contractors. Recruiting includes leveraging local HVAC supply distributors and ACCA chapters through free program training sessions and printed collateral. Contractors must be certified in the standardized program tune-up procedure. A contractor performance standard and a dispute resolution process between implementer and contractor must be established that satisfactorily administers solutions to safeguard the program’s integrity.
The program requires a tune-up approach that supports an M&V savings protocol. The tune-up M&V method must be IPMVP compliant using any option available in the standard. The tune-up should be more rigorous than the typical market tune-up and emphasize performance diagnostics relying on measured operational parameters of the unit. It should follow HVAC industry best practices. Contractors must provide their customer with a report stating tune-up results. Contractors must provide a “test-out” to verify the results of the tune-up’s corrective actions.
Contractors may bring their own customers into the program or may provide services to customers that enter the program through the central call center. The program implementer will provide a customer intake mechanism whereby customers calling into a central call center get scheduled for a tune-up with a participating contractor. The implementer will manage this customer process through to completion of tune-up.
Regarding unit replacement measures, customers can only participate through a participating contractor. The Customer Call Center will answer customer questions and direct a customer to the list of participating contractors.
In general, program implementation and delivery strategies and tactics are subject to change pending the final implementation plan, which will be developed by the Company in conjunction with the selected implementation contractor.
Cash incentives are provided to the customer for those customers that come in through the central customer intake process, and provided to the contractor for those customers the contractor brings into the program.
The program design needs to take into account changing U.S. DOE standards starting on January 1, 2015 for A/C and heat pumps.. The program design will rely upon the tune-up measure to continue to drive a cost-effective program.

45 | P a g e
Marketing
Marketing to HVAC contractors will involve a variety of strategies and tactics which may include but is not limited to:
Direct outreach and recruitment by program staff Outreach through local ACCA chapter and distributors Direct mail to contractors local offices Program staff attending local trade shows in New Orleans
Marketing collateral to contractors to support their sale of high efficiency equipment and in-program tune-ups may include but is not limited to:
Leave behind collateral Approved logos and links for use on contractor websites Yard signs Door hangers
Marketing to homeowners to drive participation into the Customer Call Center may include but is not limited to:
Bill stuffers Social media Local event booths and media signage in New Orleans Company website videos Online search engine advertising
EM&V
The independent evaluation approach will analyze tune-up M&V data to identify meaningful statistical outcomes, and will check the application of deemed savings for equipment replacement installations. Interviews may also be conducted with contractors and customers in a process evaluation to establish the net-to-gross ratio.
Year 1 Year 2 Year 3
Program Costs $ 372,487 $ 373,812 $ 390,075
Incentive Costs $ 208,538 $ 197,513 $ 215,075
Non-Incentive Costs $ 163,950 $ 176,300 $ 175,000
Gross Annual kWh Savings 943,704 1,038,509 1,142,436
Gross Annual kW Savings 354 408 453
TRC Test 1.12
PAC Test 1.45
Participant Test 3.31
Net to Gross Ratio 0.87
Utility Levelized Cost $ / kWh $ 0.03
Utility Levelized Cost $ / kW $ 71.02
No. of cust. in target group 106,500 106,500 106,500
Cumulative Participants 1,315 2,630 3,945
New Participants 1,315 1,315 1,315
Program Cost per Participant $283.26 $284.27 $296.63

46 | P a g e
NPV of Avg. Participant Savings $ 453
Avg. Part. Simple Payback (Yrs) 8.2
Lifetime Avoided CO2 (Tons) 8,854 9,441 10,386

47 | P a g e
Commercial & Industrial Program Descriptions
Program Small Commercial Solutions
Program Objective
The Small C&I Solutions program is designed to support small commercial customers with peak demand less than 100 kW in identifying and implementing cost-effective investments in energy efficiency.

48 | P a g e
Design Summary
Energy Smart will continue to run a program that offers incentives for measures that result in a verifiable electric usage reduction, focusing on prescriptive measures for which deemed savings area available through the New Orleans Deemed Savings, Installation and Efficiency Standards. This program will continue to offer the high levels of technical assistance that are provided with the current Energy Smart Small C&I program and have been effective in removing market barriers for small C&I customers. This includes providing facility assessments and customer education on the value of energy efficiency and form and function of energy efficient products. Incentives for program year 2013 will continue to be paid on a $/kWh saved basis using program caps as warranted to ensure that program dollars are allocated across a large number of participants. The program will consider adopting prescriptive incentives ($/lamp, $/hp, or other $/unit incentives) for common measures in order to simplify assignment of incentives in 2014 and 2105 program years. The program will continue to offer technical support and also develop and maintain a contractor network to provide additional outreach and customer participation.
The program is designed to minimize market barriers to energy efficiency implementation for small nonresidential customers. These include:
Lack of energy efficiency information and awareness of energy and non-energy benefits The perception that energy efficient technologies have high “first costs” Lack of awareness of energy efficient technologies Lack of contractor interest in working with small customers Lack of tools and capacity to quantify savings Lack of access to capital Split incentives between owners and tenants in leased spaces
The following new initiatives will be added to the Small Commercial Solutions umbrella:
Hospitality Initiative: This initiative will target market segments within the hospitality industry, however all small businesses meeting Small Commercial Solutions eligibility of 100 kW or less can participate. This initiative will focus on cost-effective technologies that will move small business customers to adopt non-lighting measures. This will require a market segmented approach, including market segmented collateral and options for direct installation of measures by program staff or contractors. The program will target hospitality and tourism markets such as hotels, motels, and restaurants; however the initiative will also be applicable to grocery and convenience stores.
Commercial Heating and Cooling Initiative: This initiative will be implemented in conjunction with the Residential Heating & Cooling Program and will be applicable to DX systems 15 tons or less. This initiative will deliver significant energy and demand savings through both HVAC equipment replacements and tune-ups. This is accomplished by either improving the operating efficiency of the HVAC units or replacing them with higher rated efficiency units. The program will work primarily through HVAC contractors and distributors. See the Residential Heating and Cooling Program Summary for more details on this initiative.
At a high level, consistent messaging and participation processes across small business program initiatives will be of the utmost importance, as it is this consistency that will drive general awareness and ease of entry for the program. At the initiative level, the programs will focus on targeted messaging for specific market segments.

49 | P a g e
Target Market(s)
The target market for the program will be all Commercial, Industrial, and Municipal customers in Entergy New Orleans territory that fall under 100 kW peak demand threshold.
One sub-sector identified for the segmented approach is the hospitality sector which is vitally important to the New Orleans economy. Restaurants, grocery and convenience stores will also be good targets for this initiative.
The Small Commercial Heating and Cooling Initiative will be targeted to owners of buildings that have DX systems 15 tons or less.
NOTE: Eligible Measures and Incentive included in the table below offer representative measures and incentive rates that may be adjusted by the program implementer according to the final program design and objectives. Incentives shown are calculated based on $/kWh incentives and savings per the New Orleans Deemed Savings, Installation and Efficiency Standards.

50 | P a g e
Eligible Measures & Incentives
Dual-Sided LED Exit Signs $ 20 Sign
Lighting Controls $ 615 10,000 sq. ft.
CFLs $ 20 Per bulb
LED Screw-In $ 32 Per bulb
Exterior Lighting $ 766 Per 10,000 sq. ft.
interior
Duct Sealing $ 170 Per tune-up
Coil Efficiency $ 160 Per tune-up
HE HVAC Equipment $ 4,600 Per ton
Packaged Heat Pump/AC $ 285 Per unit
ECM Motor (Refrigeration) $ 80 Per motor
Door Gaskets $ 60 Per door
Auto-closers for Walk-ins $ 120 Per door
Evaporator Fan Controller $ 240 Per unit
Anti-Sweat Heater Controls $ 95 Per unit
Guest Room Occupancy Sensors $ 110 Per unit
Aerators $ 12 Per unit
Pre-Rinse Spray Valves $ 150 Per unit
Energy Star Ice Machine $ 25 Per unit
Commercial Kitchen Equipment $ 1,500 Per unit
PC Power Management $ 12 Per PC and Monitor

51 | P a g e
Implementation & Delivery
As part of the program roll-out, the implementer will investigate the feasibility of offering direct install of free low-cost energy efficiency measures into customer facilities. Measures that will be reviewed as potential direct install measures include CFL and other low-cost lighting measures as well as low flow devices, vending misers, and low-cost refrigeration measures.
Hospitality Initiative
The hospitality initiative will include the following program design elements.
Target marketing of a combination of lighting measures and cost effective, non-lighting measures that are relevant to the hospitality and tourism sectors.
Program measures include refrigeration measures and HVAC tune-ups that are prevalent in the hospitality, restaurant, grocery and convenience sub-sectors.
Incentive bonuses may be used to encourage contractors to offer and customers to install non-lighting measures.
A program tool (on-site contractor channel) will be provided to participating contractors in order to provide on the spot opportunity assessments and project applications to customers, and streamline program participation by participating contractors.
Incentives will be paid directly to contractors in order to reduce first cost to customer.
Commercial Heating and Cooling Initiative
This initiative will include the following program design elements. See the Residential Heating and Cooling Program summary for more details on program implementation and delivery.
Deliver significant energy and demand savings for both HVAC equipment replacements and tune-ups together in one program cohesive with the Residential Heating and Cooling Program
Deliver through the qualified contractor market channel. The approach of combining HVAC equipment replacement measures and maintenance tune-ups into one program offers local participating HVAC contractors a strong value proposition.
Marketing collateral, outreach support, training, field data collection, and rebate application will be integrated for both the equipment replacements and the tune-ups in order to simplify participation and streamline program delivery.
Program measures include air-conditioning and heat pump DX units replacements and tune-ups. As the A/C Tune-up program and market matures, the program needs to grow accordingly. The implementer will use an M&V savings approach for tune-up measures in order to capture significantly more savings than deemed savings allocated per the TRM.
Incentives will be paid directly to contractors in order to reduce first cost to customer.

52 | P a g e
Marketing
The Implementer will market this program to customers primarily through a qualified contractor network. Contractors will identify opportunities, communicate program participation requirements to customers, provide customers with project applications, and help customers enroll in the program to receive rebates, and ensure project completion. The program will reach out to additional upstream market actors and relevant trade associations to market the program. The program will recruit qualified contractors through information workshops, training seminars, participation in trade shows, and engagement with trade and business organizations. ENO’s customer service staff will also be trained and available to assist with contractor recruitment and customer outreach. A program website will be used to promote the program as well and will include information for both contractors and customers. In order to promote a seamless set of program offerings, this program will support cross-referrals from other programs where appropriate.
Marketing to contractors will involve a variety of strategies and tactics which may include but is not limited to:
Direct outreach and recruitment by program staff Outreach through local trade ally associations Program staff attending local trade shows, events, and association meetings
Marketing collateral to contractors to support their sale of high efficiency equipment and in-program tune-ups may include but is not limited to:
Program marketing collateral Attractive project applications produced through the program tool (Hospitality Initiative) Approved logos and links for use on contractor websites
Marketing to small business customers to drive participation into the Customer Call Center may include but is not limited to:
Bill stuffers Social media Outreach through local business associations, meetings and events Program website
EM & V
The evaluation, measurement, and verification approach for this program should reflect the types of projects completed. To ensure that projects provide the expected savings, the evaluation approach should employ on and off-site verification assessments to confirm the measures are installed and used under conditions specified by the TRM, or any other agreed upon methodology.
Evaluation activities should also assess assumed baseline conditions through contractor site assessments. Market and Program assessments should be conducted to establish the program element’s efficacy.

53 | P a g e
Small Commercial Solutions
Year 1 Year 2 Year 3
Program Costs $674,542 $775,225 $824,351
Incentive Costs $357,721 $399,333 $429,515
Non-Incentive Costs $316,822 $375,893 $394,836
Gross Annual kWh Savings 2,807,765 3,331,267 3,499,152
Gross Annual kW Savings 857 971 1,023
TRC Test 2.19
PAC Test 2.65
Participant Test 6.20
Net to Gross Ratio 0.80
Utility Levelized Cost $ / $0.079 $0.067 $0.069
Utility Levelized Cost $ / kW $2,829.67 $2,464.62 $2,618.78
No. of cust. in target group
Cumulative Participants 193 386 579
New Participants 193 193 193
Program Cost per Participant $1022 $1022 $1022
NPV of Avg. Participant $16,549 $21,089 $24,502
Avg. Part. Simple Payback 2.39 2.22 2.21
Program Avoided CO2 (Tons)
998 1,158 1,269
Program Large Commercial Solutions
Program Objective
The Large C&I Solutions program is designed to support larger commercial customers with peak demand greater than 100 kW in identifying and implementing cost-effective investments in energy efficiency. The program will promote both custom measures and measures that have savings deemed per the New Orleans Deemed Savings, Installation and Efficiency Standards.

54 | P a g e
Program Description
The program will continue and expand upon the current Large C&I Solutions program. The program will offer incentives for measures that result in a verifiable electric usage reduction as well as technical assistance in identifying and qualifying energy efficiency measures. Incentives will be paid on a $/kWh saved basis using existing program caps. Incentives may be assigned from the customer to the contractor in order to reduce first cost to the customer. As an additional feature for eligible school and city accounts, the program will offer benchmarking and Energy Master Planning (EMP) services to encourage participation within these sectors. The program will consider expanding benchmarking and EMP services to other C&I customers for program years 2014 and 2015.
The program is designed to minimize market barriers to energy efficiency implementation for large nonresidential customers. These include:
Lack of energy efficiency information and awareness of energy and non-energy benefits The perception that energy efficient technologies have high “first costs” Lack of awareness of energy efficient technologies Lack of easy access to qualified vendors and installers Absence of tools to quantify savings Lack of access to capital Split incentives between owners and tenants in leased spaces
The Large C&I Solutions program will offer all eligible customers comprehensive audits or studies to assist customers in identifying efficiency opportunities and analyzing associated costs and savings, and offer incentives to install custom measures and measures that are included in the New Orleans Deemed Savings, Installation and Efficiency Standards. The Large C&I program will also include technical assistance components to help customers in comprehensively evaluating energy efficiency opportunities, including retro-commissioning and M&V projects for large commercial and industrial facilities
Schools and Cities Initiative
The program implementer will provide benchmarking and Energy Master Planning (EMP) services for school and city accounts. These services will support school and city accounts in identifying and prioritizing energy improvements and creating a plan to achieve them.
The Schools and Cities Initiative will include technical assistance components to help customers in comprehensively evaluating energy efficiency opportunities, including:
Benchmarking services and reports that include the collection of building characteristics, EPA Portfolio Manager score, ranking of buildings in portfolio in terms of energy usage and other metrics
Energy Master Planning Services will be provided to school districts and city government in order to prioritize energy efficiency improvements and create a Energy Master Plan for improved energy management
Custom Initiative
The program implementer will provide pre-approval of measure and customer eligibility, and provide review and approval of claimed savings. Custom projects must be able to show specific and verifiable energy savings and costs and must be cost-effective to obtain program approval. Customer savings claims may be developed by a third-party engineering firm and will be subject to program measurement and verification activities.

55 | P a g e
Target Market(s)
This program will be available to all commercial, industrial and government customers with a peak demand of 100 kW or greater.
Eligible Measures & Incentives
The program will offer the same stipulated measures as the small commercial program but with lower incentive rates. The program will also offer a Custom Initiative for Large C&I customers interested in pursuing custom projects such as retrocommissioning, process efficiency improvements, and other customer measure installations that produce at least 100,000 kWh in savings.
NOTE: Eligible Measures and Incentives included in the table below offer representative measures and incentive rates that may be adjusted by the program implementer according to the final program design and objectives.
Implementation & Delivery
The key elements of the implementation strategy include trade ally recruitment and management, customer recruitment, technical assistance, QA/QC review and training, project verification, and M&V services.
Program offerings will be promoted to key trade allies (e.g., engineering firms, energy service providers, contractors) so they can promote participation to their customers. Participating contractors will be required to participate in training sessions regarding program incentives, participation processes and requirements, and eligible measures.
Customers will be recruited primarily through direct outreach activities to trade allies, program marketing and outreach activities, and referrals by ENO managed account representatives.
The program will provide both cost-sharing for facility assessment and engineering support to identify and assess the cost-effectiveness of energy savings opportunities not covered by Energy Smart prescriptive (deemed) incentives. In addition, program staff will guide customers and trade allies through the participation process to minimize confusion and barriers to participation. Incentive applications will be subject to a quality assurance review by program technical staff to ensure accuracy of gross savings and incentive calculations.
ENO reserves the right to site-verify installations prior to project approval and incentive payment. The program will also continue to proactively pursue innovative delivery strategies and new technologies and incentive structures to help keep the program relevant over time.
Schools and Cities Initiative
Program implementer will work with Entergy customer account managers to solicit school and city accounts motivated to improve the efficiency of their facilities to receive benchmarking and EMP services. Schools accounts will need to participate at the district level. This will provide school and city accounts customers with valuable information and insight into how their facilities are currently performing. These services will ensure that institutional customers understand their results and will work with these accounts to develop a plan that identifies the management practices and specific projects that will help them save money by using energy more efficiently among the portfolio of facilities they own and operate.
Custom Initiative
The program will encourage Large C&I customers to consider performing custom projects that result in substantial energy savings (minimum 100,000 kWh annual savings). These projects may include retro-commissioning, process improvements, and other system level custom projects or projects involving unique equipment not part of the prescriptive offerings. Program staff will pre-approve projects for customer and measure eligibility, and provide M&V services or review as needed to verify measures savings. The program will provide technical support for large C&I customers to identify energy waste and prioritize energy improvements, and further provide energy assessments, educational resources, and incentives for the installation of energy efficiency measures.

56 | P a g e
Marketing
Customers will be recruited primarily through program marketing and outreach activities, direct outreach activities to trade allies, and referrals by Entergy managed account representatives.
The program will be promoted to key trade allies (e.g., engineering firms, energy service providers, contractors) so they can promote participation to their customers. Participating contractors will be required to participate in training sessions regarding program incentives, participation processes and requirements, and eligible measures.
Contractors will identify opportunities, communicate program participation requirements to customers, and help customers enroll in the program to receive rebates after projects are completed. In addition, other upstream market actors will be utilized to market the program (eg. trade and business groups, vendor organizations). Information workshops training seminars, participation in trade shows, and engagement with trade and business organizations will also be utilized to continue to recruit qualified contractors.
The program will work directly with customers to provide facility assessments and education to help customers understand the benefits of program participation, identify opportunities, and enroll in the program. A clear web presence will be required to promote the program as well and will include information for both contractors and customers.
Program marketing to Large C&I customers to drive participation will include:
Direct program outreach Outreach and presentations through professional associations, meetings and events Program website Social media
Marketing to contractors will involve a variety of strategies and tactics will include:
Direct outreach and recruitment by program staff Outreach through local trade ally associations Program staff attending local trade shows, events, and association meetings Providing Participating Contractors with Program Toolkits that include marketing collateral, tools,
approved logos and links for use on contractor websites, and other resources for program participation
Marketing to Large C&I customers through Entergy Account Managers will include:
Working with Entergy Account Managers to identify good program candidates Conference calls with customers to introduce them to the program Onsite customer meetings and presentations

57 | P a g e
EM & V
Evaluation should focus on custom projects, in particular, large projects with relatively high savings or greater uncertainty in calculated estimates. A rigorous evaluation protocol that includes pre and post inspection should be used. The use of International Performance Measurement & Verification Protocol (IPMVP) will be applied to selected samples that make up key portions of the program’s gross energy savings projections. If IPMVP options are determined to be beyond the budget available or do not make sense given their cost for most projects, a statistically valid sample of projects can be evaluated, or thorough engineering reviews of project documentation and project information will be performed.
Feedback from participants, trade allies, program managers and Entergy Account Representatives should be coordinated to evaluate program efficacy and identify recommendations for program improvements.
Large Commercial Solutions
Year 1 Year 2 Year 3
Program Costs $1,952,564 $1,675,759 $1,568,052
Incentive Costs $984,547 $834,195 $781,440
Non-Incentive Costs $968,017 $841,565 $786,612
Gross Annual kWh Savings 10,385,494 9,028,838 8,439,274
Gross Annual kW Savings 1,502 1,320 1,250
TRC Test 1.11
PAC Test 2.6
Participant Test 3.0
Net to Gross Ratio 0.8
Utility Levelized Cost $ / $0.052
Utility Levelized Cost $ / kW $4,003.62
No. of cust. in target group
Cumulative Participants 59 118 177
New Participants 59 59 59
Program Cost per Participant $10,844 $10,844 $10,844
NPV of Avg. Participant $50,158 $48,789 $47,079
Avg. Part. Simple Payback 4.62 4.35 4.72
Program Avoided CO2 (Tons)
3,801 3,408 3,216

58 | P a g e
Appendix B: Detailed Measure List
Program Measure Name #
Savings Character Cost Character
EUL (yr.)
Energy Savings on peak (kWh)
Demand Savings (kW)
Incentive ($/unit)
Equipment Cost ($/unit)
Small C&I Dual-Sided LED Exit Signs
490 16 157 0.019 $ 19.63 $ 20.00
Small C&I Lighting Controls 28 8 4,905 1.168 $ 613.10 $ 1,760.00 Small C&I CFLs 1,550 4 150 0.045 $ 10.00 $ 10.00 Small C&I LED Screw-In 1,950 13 255 0.048 $ 31.88 $ 45.00 Small C&I Exterior Lighting 6 8 6,131 0.000 $ 766.37 $ 1,580.55 Small C&I Duct Sealing 65 15 990 0.901 $ 168.30 $ 500.00 Small C&I Coil Efficiency 65 5 949 0.600 $ 161.36 $ 180.00
Small C&I HE HVAC Equipment
12 15 26,994 7.820 $ 4,588.98 $ 5,398.80
Small C&I Packaged Heat Pump/AC
14 10 1,665 0.975 $ 283.05 $ 1,200.00
Small C&I ECM Motor (Refrigeration)
350 15 474 0.054 $ 80.58 $ 154.00
Small C&I Door Gaskets 290 4 345 0.018 $ 58.65 $ 144.15
Small C&I Auto-closers for Walk-ins
100 8 1,017 0.143 $ 121.00 $ 121.00
Small C&I Evaporator Fan Controller
80 10 1,400 0.152 $ 238.00 $ 400.00
Small C&I Anti Sweat Heater Controls
12 10 1,200 0.020 $ 95.00 $ 95.00
Small C&I
Guest Room Occupancy Sensors
6 15 650 0.136 $ 110.50 $ 237.00
Small C&I Aerators 740 10 180 0.039 $ 12.00 $ 12.00 Small C&I PRSVs 150 5 4,932 2.117 $ 150.00 $ 150.00
Small C&I Energy Star Ice Machine
36 8 318 0.000 $ 25.00 $ -
Small C&I Connectionless Steamer
8 12 38,081 6.497 $ 1,500.00 $ 1,500.00
Small C&I PC Power Management
9 4 145 0.000 $ 12.00 $ 12.00
Small C&I Dual-Sided LED Exit Signs
600 16 157 0.016 $ 19.63 $ 20.00
Small C&I Lighting Controls 55 8 4,905 1.024 $ 613.10 $ 1,760.00 Small C&I CFLs 1,950 4 150 0.040 $ 10.00 $ 10.00 Small C&I LED Screw-In 2,295 13 255 0.042 $ 31.88 $ 45.00 Small C&I Exterior Lighting 13 8 6,540 0.000 $ 817.46 $ 1,685.92 Small C&I Duct Sealing 90 15 990 0.890 $ 168.30 $ 500.00 Small C&I Coil Efficiency 90 5 949 0.593 $ 161.36 $ 180.00
Small C&I HE HVAC Equipment
48 15 26,994 7.728 $ 4,588.98 $ 5,398.80
Small C&I Packaged Heat Pump/AC
195 10 1,665 0.963 $ 283.05 $ 1,200.00
Small C&I ECM Motor (Refrigeration)
0 15 474 0.054 $ 80.58 $ 154.00
Small C&I Door Gaskets 3 4 345 0.018 $ 58.65 $ 144.15
Small C&I Auto-closers for Walk-ins
0 8 1,017 0.143 $ 121.00 $ 121.00

59 | P a g e
Small C&I Evaporator Fan Controller
0 10 1,400 0.152 $ 238.00 $ 400.00
Small C&I Anti Sweat Heater Controls
0 10 1,200 0.020 $ 95.00 $ 95.00
Small C&I
Guest Room Occupancy Sensors
195 15 650 0.134 $ 110.50 $ 237.00
Small C&I Aerators 1,100 10 180 0.034 $ 12.00 $ 12.00 Small C&I PRSVs 3 5 4,932 1.855 $ 150.00 $ 150.00
Small C&I Energy Star Ice Machine
6 8 318 0.000 $ 25.00 $ -
Small C&I Connectionless Steamer
0 12 38,081 5.694 $ 1,500.00 $ 1,500.00
Small C&I PC Power Management
150 4 145 0.000 $ 12.00 $ 12.00
Small C&I Dual-Sided LED Exit Signs
510 16 157 0.020 $ 19.63 $ 20.00
Small C&I Lighting Controls 20 8 4,905 1.234 $ 613.10 $ 1,760.00 Small C&I CFLs 1,650 4 150 0.048 $ 10.00 $ 10.00 Small C&I LED Screw-In 2,025 13 255 0.051 $ 31.88 $ 45.00 Small C&I Exterior Lighting 9 8 6,131 0.000 $ 766.37 $ 1,580.55 Small C&I Duct Sealing 135 15 990 0.933 $ 168.30 $ 500.00 Small C&I Coil Efficiency 135 5 949 0.621 $ 161.36 $ 180.00
Small C&I HE HVAC Equipment
24 15 26,994 8.096 $ 4,588.98 $ 5,398.80
Small C&I Packaged Heat Pump/AC
195 10 1,665 1.009 $ 283.05 $ 1,200.00
Small C&I ECM Motor (Refrigeration)
15 15 474 0.054 $ 80.58 $ 154.00
Small C&I Door Gaskets 64 4 345 0.018 $ 58.65 $ 144.15
Small C&I Auto-closers for Walk-ins
40 8 1,017 0.143 $ 121.00 $ 121.00
Small C&I Evaporator Fan Controller
15 10 1,400 0.152 $ 238.00 $ 400.00
Small C&I Anti Sweat Heater Controls
15 10 1,200 0.020 $ 95.00 $ 95.00
Small C&I
Guest Room Occupancy Sensors
195 15 650 0.141 $ 110.50 $ 237.00
Small C&I Aerators 1,200 10 180 0.041 $ 12.00 $ 12.00 Small C&I PRSVs 20 5 4,932 2.236 $ 150.00 $ 150.00
Small C&I Energy Star Ice Machine
12 8 318 0.000 $ 25.00 $ -
Small C&I Connectionless Steamer
6 12 38,081 6.862 $ 1,500.00 $ 1,500.00
Small C&I PC Power Management
58 4 145 0.000 $ 12.00 $ 12.00
Large C&I Dual-Sided LED Exit Signs
180 16 157 0.0176 $ 15.70 $ 20.00
Large C&I Lighting Controls 34 8 4,905 1.1025 $ 490.48 $ 1,760.00
Large C&I CFL Hardwired (Modular 36 W)
1,290 16 298 0.0428 $ 29.78 $ 100.00
Large C&I HP T8s 3,429 15 67 0.0212 $ 6.65 $ 20.00 Large C&I LED Traffic Lights 0 10 535 0.1520 $ 53.50 $ 60.00 Large C&I Exterior Lighting 12 8 81,746 0.0000 $ 8,174.64 $ 21,073.94 Large C&I Custom Lighting 4 10 168,916 29.9787 $ 16,891.60 $ 100,000.00
Large C&I HE HVAC Equipment
0 15 21,199 4.7880 $ 3,391.84 $ 4,239.80

60 | P a g e
Large C&I
Centrifugal Chiller (0.51 kW/ton, 500 tons)
9 23 51,680 12.6000 $ 8,268.80 $ 87,500.00
Large C&I Packaged Heat Pump/AC
150 10 1,665 0.9633 $ 266.40 $ 1,200.00
Large C&I Process Improvements
0 9 147,000 17.6400 $ 2,205.00 $ 17,640.00
Large C&I RCx 2 9 147,000 17.6400 $ 2,205.00 $ 17,640.00
Large C&I Server Virtualization
0 4 20,781 2.3700 $ 3,324.96 $ 18,750.00
Large C&I PC Power Management
450 4 145 0.0000 $ 10.80 $ 12.00
Large C&I Evaporator Fan Controller
13 10 1,400 0.1520 $ 224.00 $ 400.00
Large C&I Anti Sweat Heater Controls
13 10 1,200 0.0200 $ 85.50 $ 95.00
Large C&I Dual-Sided LED Exit Signs
185 16 157 0.0164 $ 15.70 $ 20.00
Large C&I Lighting Controls 54 8 4,905 1.0238 $ 490.48 $ 1,760.00
Large C&I CFL Hardwired (Modular 36 W)
1,290 16 298 0.0398 $ 29.78 $ 100.00
Large C&I HP T8s 4,500 15 113 0.0240 $ 11.32 $ 20.00 Large C&I LED Traffic Lights 0 10 535 0.1412 $ 53.50 $ 60.00 Large C&I Exterior Lighting 9 8 81,746 0.0000 $ 8,174.64 $ 21,073.94 Large C&I Custom Lighting 7 10 168,916 27.8373 $ 16,891.60 $ 100,000.00
Large C&I HE HVAC Equipment
6 15 21,199 4.7880 $ 3,391.84 $ 4,239.80
Large C&I
Centrifugal Chiller (0.51 kW/ton, 500 tons)
4 23 51,680 12.6000 $ 8,268.80 $ 87,500.00
Large C&I Packaged Heat Pump/AC
90 10 1,665 0.9633 $ 266.40 $ 1,200.00
Large C&I Process Improvements
0 9 147,000 16.3800 $ 2,205.00 $ 17,640.00
Large C&I RCx 2 9 147,000 16.3800 $ 2,205.00 $ 17,640.00
Large C&I Server Virtualization
0 4 20,781 2.3700 $ 3,324.96 $ 18,750.00
Large C&I PC Power Management
900 4 145 0.0000 $ 10.80 $ 12.00
Large C&I Evaporator Fan Controller
13 10 1,400 0.1520 $ 224.00 $ 400.00
Large C&I Anti Sweat Heater Controls
13 10 1,200 0.0200 $ 85.50 $ 95.00
Large C&I Dual-Sided LED Exit Signs
180 16 157 0.0107 $ 15.70 $ 20.00
Large C&I Lighting Controls 34 8 4,905 0.6694 $ 490.48 $ 1,760.00
Large C&I CFL Hardwired (Modular 36 W)
1,500 16 298 0.0260 $ 29.78 $ 100.00
Large C&I HP T8s 4,500 15 110 0.0157 $ 10.98 $ 20.00 Large C&I LED Traffic Lights 0 10 535 0.0923 $ 53.50 $ 60.00 Large C&I Exterior Lighting 11 8 81,746 0.0000 $ 8,174.64 $ 21,073.94 Large C&I Custom Lighting 1 10 168,916 18.2013 $ 16,891.60 $ 100,000.00
Large C&I HE HVAC Equipment
0 15 21,199 4.3890 $ 3,391.84 $ 4,239.80
Large C&I
Centrifugal Chiller (0.51 kW/ton, 500 tons)
4 23 51,680 11.5500 $ 8,268.80 $ 87,500.00

61 | P a g e
Large C&I Packaged Heat Pump/AC
240 10 1,665 0.8830 $ 266.40 $ 1,200.00
Large C&I Process Improvements
0 9 147,000 10.7100 $ 2,205.00 $ 17,640.00
Large C&I RCx 6 9 147,000 10.7100 $ 2,205.00 $ 17,640.00
Large C&I Server Virtualization
0 4 20,781 2.3700 $ 3,324.96 $ 18,750.00
Large C&I PC Power Management
45 4 145 0.0000 $ 10.80 $ 12.00
Large C&I Evaporator Fan Controller
13 10 1,400 0.1520 $ 224.00 $ 400.00
Large C&I Anti Sweat Heater Controls
13 10 1,200 0.0200 $ 85.50 $ 95.00
Large C&I Dual-Sided LED Exit Signs
60 16 157 0.0197 $ 15.70 $ 20.00
Large C&I Lighting Controls 34 8 4,905 1.2338 $ 490.48 $ 1,760.00
Large C&I CFL Hardwired (Modular 36 W)
1,257 16 298 0.0479 $ 29.78 $ 100.00
Large C&I HP T8s 4,500 15 152 0.0290 $ 15.19 $ 20.00 Large C&I LED Traffic Lights 0 10 535 0.1701 $ 53.50 $ 60.00 Large C&I Exterior Lighting 6 8 49,048 0.0000 $ 4,904.78 $ 12,644.37 Large C&I Custom Lighting 6 10 101,350 20.1285 $ 10,134.96 $ 60,000.00
Large C&I HE HVAC Equipment
0 15 21,199 5.1300 $ 3,391.84 $ 4,239.80
Large C&I
Centrifugal Chiller (0.51 kW/ton, 500 tons)
10 23 51,680 13.5000 $ 8,268.80 $ 87,500.00
Large C&I Packaged Heat Pump/AC
34 10 1,665 1.0321 $ 266.40 $ 1,200.00
Large C&I Process Improvements
0 9 147,000 19.7400 $ 2,205.00 $ 17,640.00
Large C&I RCx 6 9 147,000 19.7400 $ 2,205.00 $ 17,640.00
Large C&I Server Virtualization
0 4 20,781 2.3700 $ 3,324.96 $ 18,750.00
Large C&I PC Power Management
30 4 145 0.0000 $ 10.80 $ 12.00
Large C&I Evaporator Fan Controller
35 10 1,400 0.1520 $ 224.00 $ 400.00
Large C&I Anti Sweat Heater Controls
30 10 1,200 0.0200 $ 85.50 $ 95.00
Large C&I Dual-Sided LED Exit Signs
126 16 157 0.0153 $ 15.70 $ 20.00
Large C&I Lighting Controls 34 8 4,905 0.9581 $ 490.48 $ 1,760.00
Large C&I CFL Hardwired (Modular 36 W)
1,257 16 298 0.0372 $ 29.78 $ 100.00
Large C&I HP T8s 4,500 15 66 0.0225 $ 6.60 $ 20.00 Large C&I LED Traffic Lights 0 10 535 0.1321 $ 53.50 $ 60.00 Large C&I Exterior Lighting 6 8 61,310 0.0000 $ 6,130.98 $ 15,805.46 Large C&I Custom Lighting 3 10 126,687 19.5397 $ 12,668.70 $ 75,000.00
Large C&I HE HVAC Equipment
0 15 21,199 4.0470 $ 3,391.84 $ 4,239.80
Large C&I
Centrifugal Chiller (0.51 kW/ton, 500 tons)
9 23 51,680 10.6500 $ 8,268.80 $ 87,500.00
Large C&I Packaged Heat Pump/AC
12 10 1,665 0.8142 $ 266.40 $ 1,200.00
Large C&I Process Improvements
0 9 147,000 15.3300 $ 2,205.00 $ 17,640.00

62 | P a g e
Large C&I RCx 0 9 147,000 15.3300 $ 2,205.00 $ 17,640.00
Large C&I Server Virtualization
0 4 20,781 2.3700 $ 3,324.96 $ 18,750.00
Large C&I PC Power Management
2,400 4 145 0.0000 $ 10.80 $ 12.00
Large C&I Evaporator Fan Controller
13 10 1,400 0.1520 $ 224.00 $ 400.00
Large C&I Anti Sweat Heater Controls
0 10 1,200 0.0200 $ 85.50 $ 95.00
Large C&I Dual-Sided LED Exit Signs
30 16 157 0.0202 $ 15.70 $ 20.00
Large C&I Lighting Controls 34 8 4,905 1.2600 $ 490.48 $ 1,760.00
Large C&I CFL Hardwired (Modular 36 W)
957 16 298 0.0490 $ 29.78 $ 100.00
Large C&I HP T8s 4,500 15 166 0.0296 $ 16.56 $ 20.00 Large C&I LED Traffic Lights 0 10 535 0.1738 $ 53.50 $ 60.00 Large C&I Exterior Lighting 7 8 81,746 0.0000 $ 8,174.64 $ 21,073.94 Large C&I Custom Lighting 10 10 168,916 34.2613 $ 16,891.60 $ 100,000.00
Large C&I HE HVAC Equipment
0 15 21,199 4.0470 $ 3,391.84 $ 4,239.80
Large C&I
Centrifugal Chiller (0.51 kW/ton, 500 tons)
3 23 51,680 10.6500 $ 8,268.80 $ 87,500.00
Large C&I Packaged Heat Pump/AC
15 10 1,665 0.8142 $ 266.40 $ 1,200.00
Large C&I Process Improvements
2 9 147,000 20.1600 $ 2,205.00 $ 17,640.00
Large C&I RCx 2 9 147,000 20.1600 $ 2,205.00 $ 17,640.00
Large C&I Server Virtualization
0 4 20,781 2.3700 $ 3,324.96 $ 18,750.00
Large C&I PC Power Management
30 4 145 0.0000 $ 10.80 $ 12.00
Large C&I Evaporator Fan Controller
0 10 1,400 0.1520 $ 224.00 $ 400.00
Large C&I Anti Sweat Heater Controls
0 10 1,200 0.0200 $ 85.50 $ 95.00
Large C&I Dual-Sided LED Exit Signs
30 16 157 0.0202 $ 15.70 $ 20.00
Large C&I Lighting Controls 34 8 4,905 1.2600 $ 490.48 $ 1,760.00
Large C&I CFL Hardwired (Modular 36 W)
1,057 16 298 0.0490 $ 29.78 $ 100.00
Large C&I HP T8s 4,500 15 166 0.0296 $ 16.56 $ 20.00 Large C&I LED Traffic Lights 0 10 535 0.1738 $ 53.50 $ 60.00 Large C&I Exterior Lighting 4 8 102,183 0.0000 $ 10,218.30 $ 26,342.43 Large C&I Custom Lighting 5 10 211,145 42.8267 $ 21,114.50 $ 125,000.00
Large C&I HE HVAC Equipment
0 15 21,199 4.0470 $ 3,391.84 $ 4,239.80
Large C&I
Centrifugal Chiller (0.51 kW/ton, 500 tons)
4 23 51,680 10.6500 $ 8,268.80 $ 87,500.00
Large C&I Packaged Heat Pump/AC
0 10 1,665 0.8142 $ 266.40 $ 1,200.00
Large C&I Process Improvements
6 9 147,000 20.1600 $ 2,205.00 $ 17,640.00
Large C&I RCx 5 9 147,000 20.1600 $ 2,205.00 $ 17,640.00
Large C&I Server Virtualization
0 4 20,781 2.3700 $ 3,324.96 $ 18,750.00

63 | P a g e
Large C&I PC Power Management
0 4 145 0.0000 $ 10.80 $ 12.00
Large C&I Evaporator Fan Controller
0 10 1,400 0.1520 $ 224.00 $ 400.00
Large C&I Anti Sweat Heater Controls
0 10 1,200 0.0200 $ 85.50 $ 95.00
Large C&I Exterior Lighting 15 8 122,620 0.0000 $ 12,261.96 $ 31,610.92 Large C&I LED Traffic Lights 550 10 535 0.1285 $ 53.50 $ 60.00
HPwES Air Sealing (900 CFM50 reduction)
1,019 10 455 0.441 $ 300.00 $ 350.00
HPwES Duct Sealing 364 18 1,487 0.981 $ 400.00 $ 500.00
HPwES Celing Insulation R0 to R30
218 20 3,470 0.826 $ 350.00 $ 1,370.00
HPwES Celing Insulation R1-4 to R30
218 20 1,470 0.516 $ 300.00 $ 1,187.00
HPwES Celing Insulation R5-8 to R30
218 20 770 0.252 $ 200.00 $ 1,110.00
HPwES Celing Insulation R9-14 to R30
146 20 420 0.130 $ 200.00 $ 860.00
HPwES Celing Insulation R15-22 to R30
146 20 200 0.063 $ 175.00 $ 620.00
HPwES Wall Insulation to R11
146 20 770 0.571 $ 250.00 $ 2,000.00
HPwES Floor Insulation to R19
146 20 120 0.184 $ 200.00 $ 1,480.00
HPwES Pool Pump, variable speed
29 10 1,637 0.420 $ 400.00 $ 885.00
HPwES Heat Pump Water Heater (2.0 EF)
291 13 1,132 0.130 $ 600.00 $ 910.00
HPwES Solar Screens (E or W 15 sf window)
291 10 74 0.020 $ 15.00 $ 50.00
HPwES Radiant Barrier 3 22 320 - $ 200.00 $ 1,200.00
HPwES
CFL 13W (UNDER EISA 2007- 60 watts reduce in 2014)
18,624 6 27 0.003 $ 3.00 $ 3.00
HPwES
Water Heater Insulation (R-6.7 or higher)
0 13 55 0.010 $ 70.00 $ 70.00
HPwES Pipe Insulation 655 13 40 0.004 $ 15.00 $ 15.00
HPwES Faucet Aerator (<= 1.5 GPM)
1,164 10 50 0.004 $ 6.75 $ 6.75
HPwES
Low Flow Showerhead (<=2.0 GPM)
146 10 131 0.007 $ 16.00 $ 16.00
HPwES Advanced Power Strip, 12 plug
703 3 121 0.017 $ 20.00 $ 20.00
HPwES Audit 1,200 $ 150.00 $ -
Consumer Products
CFLs 15W (14W-18W) ENERGY STAR RATED
30,000 6 16 0.002 $ 1.25 $ 2.30
Consumer Products
CFLs 20W (19W-21W) ENERGY STAR RATED
12,000 6 26 0.003 $ 1.25 $ 2.30
Consumer Products
CFL 23W (22W-25W) ENERGY STAR RATED
7,000 6 30 0.003 $ 1.25 $ 3.30

64 | P a g e
Consumer Products
CFL 27W (26W-28W) ENERGY STAR RATED
0 6 43 0.004 $ 3.30
Consumer Products
LEDs ENERGY STAR RATED Downlights
12,000 22 34 0.003 $ 10.00 $ 25.00
Consumer Products
LEDs ENERGY STAR RATED Downlights
16,000 22 48 0.004 $ 10.00 $ 26.00
Consumer Products
LEDs ENERGY STAR RATED Downlights
14,500 22 55 0.006 $ 10.00 $ 32.00
Consumer Products
LEDs ENERGY STAR RATED Downlights
7,400 22 64 0.006 $ 10.00 $ 37.00
Consumer Products
LEDs ENERGY STAR RATED A-lamp
6,000 22 18 0.002 $ 8.00 $ 18.50
Consumer Products
LEDs ENERGY STAR RATED A-lamp
5,000 22 27 0.002 $ 8.00 $ 23.50
Consumer Products
LEDs ENERGY STAR RATED A-lamp
5,000 22 35 0.003 $ 8.00 $ 28.50
Consumer Products
LEDs ENERGY STAR RATED A-lamp
5,000 22 48 0.004 $ 8.00 $ 38.50
Consumer Products
Room Air Conditioners < 6,000 BTUs ENERGY STAR RATED
0 9 135 0.054 $ 35.00 $ 50.00
Consumer Products
Room Air Conditioners 6,000- 7,999 BTUs ENERGY STAR RATED
975 9 158 0.058 $ 35.00 $ 50.00
Consumer Products
Room Air Conditioners 8,000 - 13,999 BTUs ENERGY STAR RATED
975 9 248 0.111 $ 35.00 $ 50.00
Consumer Products
Room Air Conditioners 14,000 - 19,999 BTUs ENERGY STAR RATED
1,025 9 384 0.150 $ 50.00 $ 50.00
Consumer Products
Room Air Conditioners > 20,000 BTUs ENERGY STAR RATED
1,025 9 538 0.257 $ 50.00 $ 50.00
Consumer Products
Advanced Power Strips 4 Plug
0 3 49 0.007 $ 15.00 $ 15.00
Consumer Products
Advanced Power Strips 7 Plug
0 3 87 0.012 $ 15.00 $ 20.00
Consumer Products
Advanced Power Strips 8 Plug
0 3 87 0.012 $ 15.00 $ 20.00

65 | P a g e
Consumer Products
Advanced Power Strips 10 Plug
0 3 87 0.012 $ 15.00 $ 20.00
Consumer Products
Advanced Power Strips 12 Plug
0 3 121 0.017 $ 15.00 $ 20.00
MF Wx Air Sealing (500 CFM50 reduction)
1,782 10 253 0.245 $ 200.00 $ 200.00
MF Wx Duct Sealing 445 18 804 0.530 $ 300.00 $ 300.00
MF Wx Celing Insulation R0 to R30
45 20 3,470 0.826 $ 400.00 $ 1,370.00
MF Wx Celing Insulation R1-4 to R30
45 20 1,470 0.516 $ 400.00 $ 1,187.00
MF Wx Celing Insulation R5-8 to R30
45 20 770 0.252 $ 400.00 $ 1,110.00
MF Wx Celing Insulation R9-14 to R30
0 20 420 0.130 $ 860.00
MF Wx Celing Insulation R15-22 to R30
0 20 200 0.063 $ 620.00
MF Wx
CFL 13W (UNDER EISA 2007- 60 watts reduce in 2014)
7,860 6 27 0.003 $ 5.00 $ 5.00
MF Wx Faucet Aerator, 1.0GPM, in unit
2,620 10 60 0.005 $ 12.00 $ 12.00
MF Wx
Low Flow Showerhead, 1.75 GPM, in unit
1,310 10 175 0.010 $ 29.00 $ 29.00
MF Wx Advanced Power Strip, 7 plug
0 3 87 0.012 $ 20.00 $ 20.00
MF Wx
t12 4' 2 Lamp retrofit to t8 4' 2 lamp with ballast
0 15 70 0.013 $ 60.00
MF Wx
t12 4' 4 Lamp retrofit to t8 4' 3 lamp with ballast
0 15 295 0.057 $ 65.00
MF Wx
Occupancy Sensors under 500 W
0 $ -
MF Wx
Daylight Sensor Controls ($0.09 per sq ft)
0 $ -
MF Wx
exterior lighting (70HPS down to 26W LED)
0 22 276 0.000 $ 220.00
MF Wx LED Exit Sign 0 15 353 $ 105.00 $ -
MF Wx Beverage Machine Controls
0 5 1,432 $ 218.00 $ -
MF Wx Beverage Machine Controls
0 5 1,801 $ 225.00 $ -
MF Wx Beverage Machine Controls
0 5 1,633 $ 233.00 $ -
MF Wx Beverage Machine Controls
0 5 1,931 $ 240.00 $ -
MF Wx Beverage Machine Controls
0 5 1,526 $ 248.00 $ -
LI Audit & Wx
Air Sealing (900 CFM50 reduction)
300 10 455 0.441 $ 200.00 $ 200.00
LI Audit & Wx
Duct Sealing 300 18 804 1 $ 300.00 $ 300.00

66 | P a g e
LI Audit & Wx
Ceiling Insulation R0 baseline
75 20 3,470 0.826 $ 1,370.00 $ 1,370.00
LI Audit & Wx
Ceiling Insulation R1-4 baseline
75 20 1,470 1 $ 1,187.00 $ 1,187.00
LI Audit & Wx
Ceiling Insulation R5-8 baseline
75 20 770 0.252 $ 1,110.00 $ 1,110.00
LI Audit & Wx
Ceiling Insulation R914 baseline
30 20 420 0.130 $ 860.00 $ 860.00
LI Audit & Wx
Ceiling Insulation R15-22 baseline
30 20 200 0.063 $ 620.00 $ 620.00
LI Audit & Wx
Wall Insulation 45 20 770 0.571 $ 2,000.00 $ 2,000.00
LI Audit & Wx
Floor Insulation 45 20 120 0.184 $ 1,480.00 $ 1,480.00
LI Audit & Wx
Room A/C 60 9 248 0.111 $ 50.00 $ 50.00
LI Audit & Wx
CFL 13W (UNDER EISA 2007- 60 watts reduce in 2014)
1,800 6 27 0.003 $ 3.00 $ 3.00
LI Audit & Wx
Faucet Aerator 210 10 50 0.004 $ 6.75 $ 6.75
LI Audit & Wx
Low Flow Showerhead
105 10 131 0.007 $ 16.00 $ 16.00
LI Audit & Wx
Pipe Insulation 105 13 40 0.004 $ 15.00 $ 15.00
LI Audit & Wx
Radiant Barrier 0 $ -
LI Audit & Wx
AC Tune-up, deemed
240 5 503 0.180 $ 100.00 $ 100.00
LI Audit & Wx
Audit 300 $ 300.00 $ 300.00
School Kits & Education
CFL 13W (UNDER EISA 2007- 60 watts reduce in 2014)
45,360 6 27 0.003 $ 3.00 $ 3.00
School Kits & Education
Faucet Aerator 22,680 10 50 0.004 $ 2.00 $ 2.00
School Kits & Education
Low Flow Showerhead
11,340 10 131 0.007 $ 6.00 $ 6.00
School Kits & Education
Advanced Power Strip, 7 plug
0 3 87 0.012 $ 18.00 $ 18.00
School Kits & Education
LED Night Light 22,680 10 4 0.000 $ 2.00 $ 2.00
Res Heating & Cooling
CoolSaver modeled tune-up, Res bldg
1,880 5 1,085 0.483 $ 175.00 $ 175.00
Res Heating & Cooling
CoolSaver modeled tune-up, small comm bldg
0 5 708 0.350 $ 175.00 $ 175.00
Res Heating & Cooling
CoolSaver modeled tune-up, MF
150 5 368 0.200 $ 100.00 $ 175.00

67 | P a g e
Res Heating & Cooling
EC Motor Retrofit Kit w/ Coolsaver tune-up
1 15 480 0.114 $ 225.00 $ 300.00
Res Heating & Cooling
Coolsaver modeled tune-up, school???
0 5 458 0.371 $ - $ 160.00
Res Heating & Cooling
AC 15 SEER, ROB 2014
375 15 1,259 0.355 $ 350.00 $ 729.00
Res Heating & Cooling
AC 16 SEER, ROB 2014
510 15 1,501 0.475 $ 425.00 $ 1,146.00
Res Heating & Cooling
AC 17 SEER, ROB 2014
30 15 2,136 0.645 $ 575.00 $ 1,562.00
Res Heating & Cooling
AC 18 SEER, ROB 2014
15 15 2,291 0.665 $ 625.00 $ 1,981.00
Res Heating & Cooling
HP 15 SEER, ROB 2014
15 15 1,411 0.398 $ 400.00 $ 839.00
Res Heating & Cooling
HP 16 SEER, ROB 2014
15 15 2,046 0.408 $ 475.00 $ 1,319.00
Res Heating & Cooling
HP 17 SEER, ROB 2014
6 15 2,246 0.488 $ 625.00 $ 1,798.00
Res Heating & Cooling
HP 18 SEER, ROB 2014
6 15 2,610 0.688 $ 675.00 $ 2,278.00
Res Heating & Cooling
DHP (18 SEER, 9 HSPF) in 800 sf Addition
9 15 1,213 0.254 $ 300.00 $ 800.00
Res Heating & Cooling
DHP (18 SEER, 9 HSPF) in 800 sf Existing space
0 15 1,244 0.276 $ 300.00 $ 1,600.00
Res Heating & Cooling
DHP (18 SEER, 9 HSPF) in 800 sf Existing space
0 15 1,614 0.747 $ 400.00 $ 3,500.00

68 | P a g e

APPENDIX 1 | P a g e
0.00%
5.00%
10.00%
15.00%
20.00%
25.00%
30.00%
35.00%
0
50
100
150
200
250
2000 2005 2006 2007 2008 2009 2010 2011
Tho
usa
nd
s
Chart 1 - New Orleans Employment Trend 2000 - 2011
In Labor Force
Employed
Unemployed
Unemployment
Rate
Appendix C: Task 2: Market Profile
Entergy New Orleans Market Profile Introduction
The market profiles below provide contextual information on Entergy New Orleans service territory for
the development of electric efficiency programs. Beginning with an overview of the market as a whole,
each sector is then examined individually, concentrating on pre and post-Katrina current customer
count and usage data, electric end-use characterization, and regional employment and energy rate
trends that may impact program design.
Regional Employment Trends
Economic data that includes the Entergy New Orleans service territory indicate that the employment
trends seem to be improving since Katrina, which is seen below in Chart 1. The chart displays census
employment data from 2000 – 2011. Current levels of total labor force, and total employed individuals
are still below pre-Katrina levels. New Orleans was experiencing steady growth in labor force from 2006
– 2009. Since 2009 total labor force has remained stagnant but 2011 experienced a significant decline
in unemployment rate and therefore a positive growth in total employed.
While these general economic metrics indicate the substantial impact of the recent economic downturn on the metro area, the recent improvements are encouraging. With a stable or gradually improving economy, the current economic climate is not expected to impede the implementation of new efficiency programs.

APPENDIX 2 | P a g e
Agriculture, Forestry, Fishing and Hunting
0%
Mining, Quarrying, and
Oil and Gas 1%
Utilities 1%
Construction 7%
Manufacturing 8%
Wholesale Trade 5%
Retail Trade
13%
Transportation and
Warehousing 5%
Information 2%
Finance and Insurance 4%
Real Estate and Rental and
Leasing 2%
Professional, Scientific,
and Technical
6% Management of
Companies and Enterprises
2%
Administrative, Support, Waste
Management, and Remediation
6%
Educational Services 6%
Health Care and Social
Assistance 13%
Arts, Entertainment,
and Recreation
3%
Accommodation and Food
Services 12%
Other Services
3%
Public Administration 3%
Chart 2 - Total Jobs by NAICS Category
In Chart 2 below, which was taken from Greater New Orleans Community Data Center (GNOCDC) provides a characterization of the Entergy New Orleans service territory job market by NAICS category. It indicates that the strongest categories are retail trade, health care and food service industries.

APPENDIX 3 | P a g e
0
50
100
150
200
250
300
350
400
450
500
2000 2001 2002 2003 2004 2005 2006 2007 2008 2009 2010 2011
Tho
usa
nd
s
Chart 3 - Entergy New Orleans Customer Count by Sector & New Orleans Population 2000 - 2011
NewOrleansPopulation
TotalCustomers
Residential
Customers
CommercialCustomers
IndustrialCustomers
0
1
2
3
4
$-
$75
$150
$225
$300
2000 2001 2002 2003 2004 2005 2006 2007 2008 2009 2010 2011
Mill
ion
s
Tho
usa
nd
s
Chart 4 - Entergy New Orleans Revenue & MWH Sales by Sector 2000 - 2011
Commercial
Revenue
Residential
Revenue
IndustrialRevenue
Commercial
MWH Sales
ResidentialMWH Sales
Industrial
MWH Sales
Entergy New Orleans Customer Count & Sales
The following tables show the numbers of customers and annual sales and revenues across the sectors for the span of 2000 to 2011 for the service territory.
Chart 3 compares customer count data from EIA form 861 and census population levels and indicates that New Orleans population is still well below pre-Katrina levels, however total customer count has recovered 49.9% of the customers lost directly after Katrina, most of which are residential customers.
EIA form 861 revenue and MWH sales data has shown positive trends despite an incomplete recovery in customer base. Chart 4 shows that the residential sector in particular has surpassed pre-Katrina levels in revenue, nearly met the 2000 level and almost recovered completely in MWH sales. The commercial revenue and commercial MWH sales have both increased from 2000 levels as well.

APPENDIX 4 | P a g e
Chart 5 displays 2011 customer accounts by sector, the majority of which are made up of residential customers. The table below indicates that residential customers are 89% of Entergy New Orleans customer base.
Electric Trends
The following charts show the trend in electric sales. Chart 6 below shows roughly two thirds of sales
are in the Commercial & Industrial sectors (including municipal accounts), with the remaining third is
in Residential. The sales forecast also shows relatively consistent, but shallow overall growth during the
next five years, until 2018.
141,628
13,798
2,282 371 1,352 -
20,000
40,000
60,000
80,000
100,000
120,000
140,000
160,000
Chart 5 - 2011 Customer Accounts by Sector
Residential
Commercial
Industrial
Street & HighwayLighting
Public Accounts
Customer Distribution by Meter Type % of Customers
Residential 89% Commercial 9%
Industrial 1% Public Lighting 0%
Other Sales 1%

APPENDIX 5 | P a g e
0
500,000
1,000,000
1,500,000
2,000,000
2007 2008 2009 2010 2011
Chart 7- Residential Electricity Usage (mWh)
Customer Counts
While residential accounts make up the overwhelming majority of total accounts, the residential sector
accounts for roughly one third of total sales in Entergy New Orleans territory.
Cus tomer Accounts by Sector
Residential 141,628
Commercial 13,798
Industrial 2,282
Street & Highway Lighting 371
Municipal 1,352
Residential Market Profile
Energy Consumption & Market Segmentation
-
1,000
2,000
3,000
4,000
5,000
6,000
2014 2015 2016 2017 2018
GW
h
Chart 6 - Total Retail Sales by Sector
Other Sales to PublicAuthorities
Public Street &Highway Lighting
Industrial
Commercial
Residential

APPENDIX 6 | P a g e
Space Cooling
46%
Space Heating
5%
Water Heating
13%
Appliances & Plug Load
24%
Lighting 12%
Chart 8 - Residential Electric End-Use Characterization
The residential sector showed steady growth in electricity usage prior to 2010 but grew very little
between 2010 and 2011, as shown in chart 7 above. The table to the right shows that the majority of
residential meters are standard residential service.
Chart 8 displays residential electric end-
use data for the Entergy New Orleans
service territory. Appliances and HVAC
represent 75% of total energy, with lighting
and water heating making up the
remaining 15%. Space cooling represents
the largest end-use demand with 46% of
total energy use.
Chart 9 provides greater detail for residential space cooling end-use. 19% of the residential sector does
not have AC and relies on gas for heating, in addition to another 35% of residents who do have AC and
also use gas to heat their homes. The remaining 46% use electric as their heating/cooling fuel type.
Res identia l Cus tomers by Meter Type
Residential Meter Type Avg # of Customers
RES- Res Service 141,540
ODSL- Outdoor Direct Sec Light 69
ONW- Outdoor Night watchman 8
HPSV NW - Hi Press Sod Light 6
Miscellaneous 5
TOTAL 141,628
Res identia l Cens us Da ta
Home Types (2011) # of
Cus tomer
Single Family & Duplex 125,747
Multifamily 17,344
Mobile Home 1,445
Total 144,537
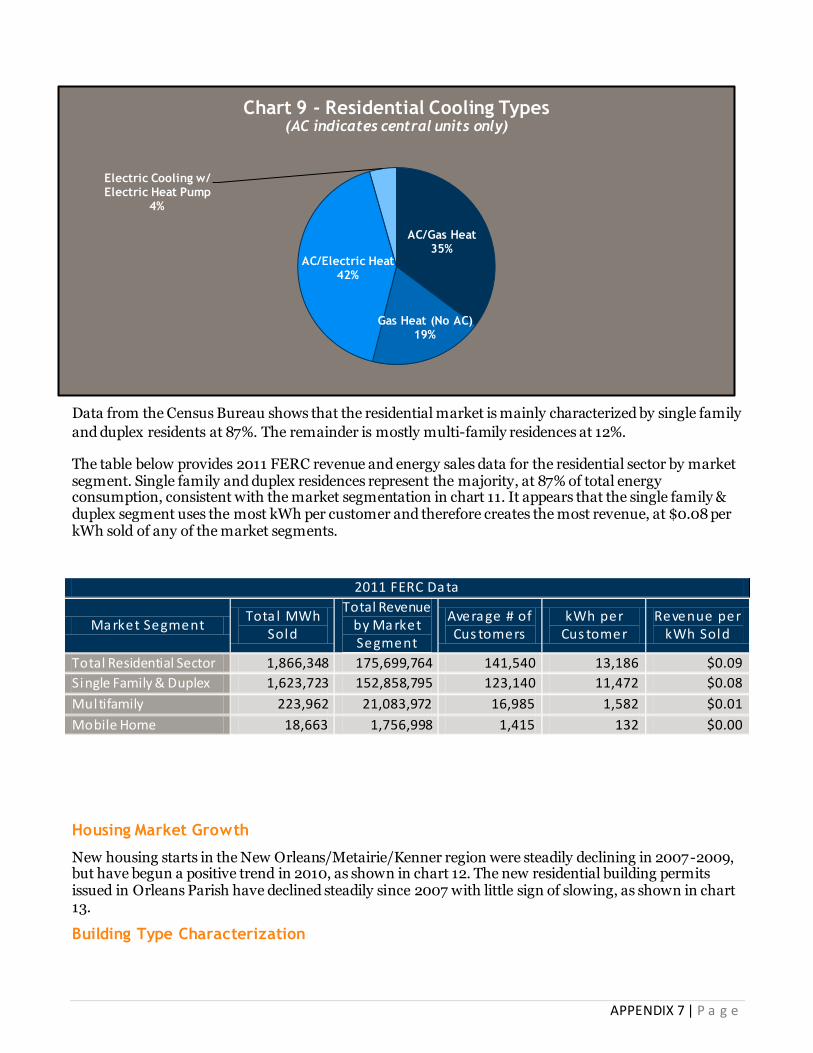
APPENDIX 7 | P a g e
AC/Gas Heat 35%
Gas Heat (No AC) 19%
AC/Electric Heat 42%
Electric Cooling w/ Electric Heat Pump
4%
Chart 9 - Residential Cooling Types (AC indicates central units only)
Data from the Census Bureau shows that the residential market is mainly characterized by single family
and duplex residents at 87%. The remainder is mostly multi-family residences at 12%.
The table below provides 2011 FERC revenue and energy sales data for the residential sector by market segment. Single family and duplex residences represent the majority, at 87% of total energy consumption, consistent with the market segmentation in chart 11. It appears that the single family & duplex segment uses the most kWh per customer and therefore creates the most revenue, at $0.08 per kWh sold of any of the market segments.
Housing Market Growth
New housing starts in the New Orleans/Metairie/Kenner region were steadily declining in 2007-2009, but have begun a positive trend in 2010, as shown in chart 12. The new residential building permits issued in Orleans Parish have declined steadily since 2007 with little sign of slowing, as shown in chart 13.
Building Type Characterization
2011 FERC Da ta
Ma rket Segment Tota l MWh
Sold
Total Revenue by Ma rket Segment
Avera ge # of Cus tomers
kWh per Cus tomer
Revenue per kWh Sold
Total Residential Sector 1,866,348 175,699,764 141,540 13,186 $0.09
Single Family & Duplex 1,623,723 152,858,795 123,140 11,472 $0.08
Multifamily 223,962 21,083,972 16,985 1,582 $0.01
Mobile Home 18,663 1,756,998 1,415 132 $0.00

APPENDIX 8 | P a g e
0
100
200
300
400
500
600
700
2007 2008 2009 2010 2011
Chart 11- New Housing Starts for New Orleans-Metairie-Kenner, LA
0
200
400
600
800
1,000
1,200
1,400
2007 2008 2009 2010 2011
Chart 10 - Residential Building Permits in Orleans Parish
The two charts below show the heating fuel type and housing age distribution in New Orleans, by zip
code. The data appears to show that in zip codes where there are a majority of buildings built before
1940, gas is the primary fuel type, whereas zip codes with many houses built after 1970, there is more
electric fuel being used.

APPENDIX 9 | P a g e
0%
10%
20%
30%
40%
50%
60%
70%
80%
90%
100%
70115 70119 70118 70116 70130 70117 70125 70113 70114 70112 70131 70127 70129
Chart 12 - New Orleans Housing Age Distribution by Zip Code
Built 1939 or Earlier Built 1940 to 1950 Built 1950 to 1960 Built 1960 to 1970 Built 1970 to 1980
Built 1980 to 1990 Built 1990 to 2000 Built 2000 to 2004 Built 2005 or Later
0%
10%
20%
30%
40%
50%
60%
70%
80%
90%
100%
70115 70119 70118 70116 70130 70117 70125 70113 70114 70112 70131 70127 70129
Chart 13 - New Orleans Heating Fuel Type Distribution by Zip Code
Utility Gas Electric Bottled, Tank or LP Gas Fuel oil, kerosene etc. Coal or Coke
Wood Solar Energy Other Fuel No Fuel Used
In Chart 12 and 13, CLEAResult pulled Census Bureau data to determine the housing age distribution
by zip code. Although it is a fairly comprehensive data set, it is important to note that not all zip codes
provided data, and in some cases were null.

APPENDIX 10 | P a g e
Appliance Saturation Rates
In 2009, GCR Associates was contracted by Entergy New Orleans to complete a Residential Appliance
Saturation Survey (RASS)1 as a part of a larger baseline assessment for the residential sector. While the
results of this are nearly five years old, it is the most recent published data set for the region.
The study found that in the post Katrina period, average household energy use has declined by about
9% when compared to pre-Katrina patterns. The greatest reductions in energy use are recorded in
neighborhoods that were heavily flooded. New building codes and the replacement of older appliances
with newer more efficient models have resulted in lower levels of energy consumption in the post
Katrina era. This implies that the flood spurred a large onset of appliance replacements.
Commercial and Industrial Market Profile
The following tables show electric sales and customer account data for a five year period beginning in
2014. The C&I Section also include municipal accounts. Accounts are ordered by rate class, the two
main categories being small and large, which are separated by those under and over a 100 kW threshold
respectively. The remaining rate classes are for high-usage customers, various end-use specific rate
classes (e.g. security lighting), master metered spaces, and other miscellaneous categories.
Forecasted C&I Customer Sales
In all three sectors, large customers account for the majority of sales, and the majority of growth in
sales. These forecasts are made absent the effects of DSM. [Source: 2012 ENO IRP and ENO FERC
Form 1]
1 GCR & Associates, Energy Baseline for Entergy New Orleans, Inc.’s Residential Customers, Appendix 1
-
300
600
900
1,200
1,500
1,800
2,100
2,400
2014 2015 2016 2017 2018
GW
h
Chart 14 - Total Forecasted Commercial Sales Miscellaneous
Outdoor Direct Security
Lighting
Master Metered - Res
Master Metered - Non-Res
Large Customers - HighLoad Factor
Large Customers
Small Customers

APPENDIX 11 | P a g e
Building and Account Types
While the majority of sales are accounted for by large customers, the majority of building space is
occupied by small customers. Schools and warehouse space are the two largest customer types among
the large accounts, while restaurants, office and retail account for the overwhelming majority of small
accounts.
-
100
200
300
400
500
600
2014 2015 2016 2017 2018
GW
h
Chart 15 - Total Forecasted Industrial Sales Outdoor Direct Security
Lighting
High Voltage Service
Experimental
Interruptible Service
Large Interruptible
Service
Large Customers - HighLoad factor
Large Customers
Small Customers
-
100
200
300
400
500
600
700
800
900
1,000
2014 2015 2016 2017 2018
GW
h
Chart 16 - Total Forecasted Municipal Sales
Miscellaneous
Outdoor Direct SecurityLighting
Municipal BuildingsLight & Power
Master Metered - Res
High Voltage Service
Large Customers - High
Load Factor
Large Customers
Small Customers
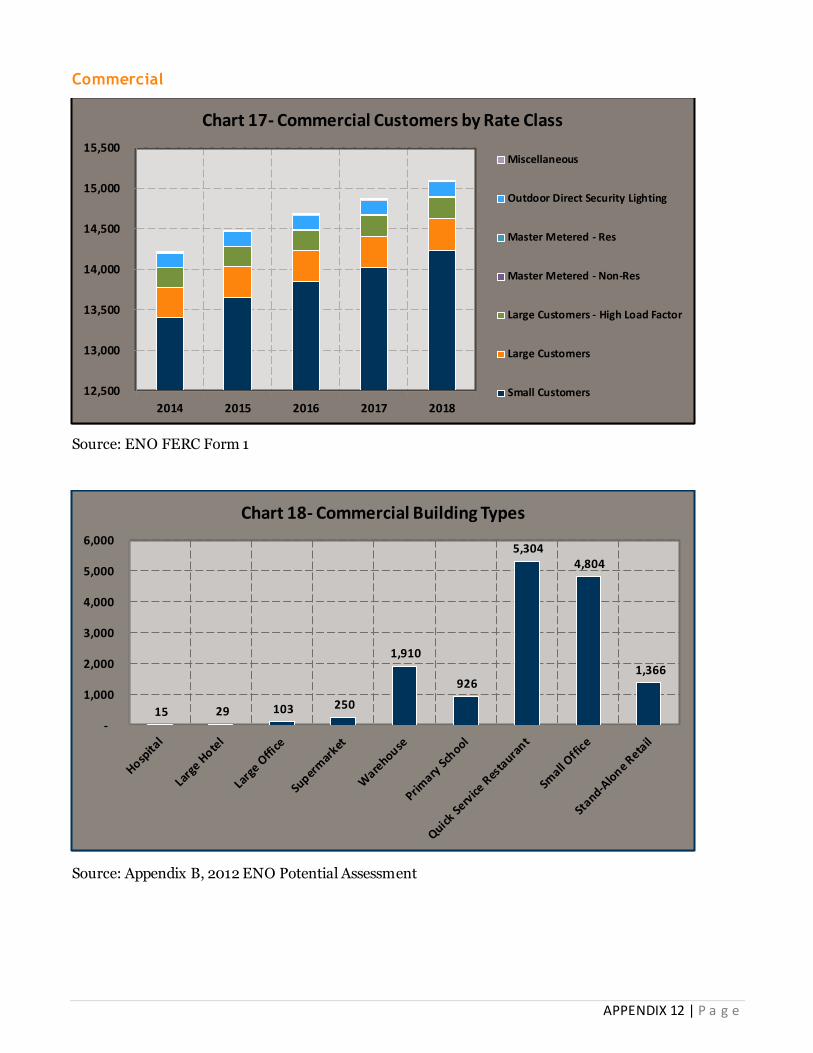
APPENDIX 12 | P a g e
Commercial
Source: ENO FERC Form 1
Source: Appendix B, 2012 ENO Potential Assessment
12,500
13,000
13,500
14,000
14,500
15,000
15,500
2014 2015 2016 2017 2018
Chart 17- Commercial Customers by Rate Class
Miscellaneous
Outdoor Direct Security Lighting
Master Metered - Res
Master Metered - Non-Res
Large Customers - High Load Factor
Large Customers
Small Customers
15 29 103 250
1,910
926
5,304 4,804
1,366
-
1,000
2,000
3,000
4,000
5,000
6,000
Chart 18- Commercial Building Types

APPENDIX 13 | P a g e
Industrial
Source: Both charts above were derived from ENO FERC Form 1
End-Use Characterizations
The following tables show the breakdown of energy sales by end-use energy type. While the majority of
energy use in commercial buildings is accounted for by lighting, cooling and appliance & plug load are
also significant end-uses. In industrial space, the majority of end-use energy is accounted for by
process, and the following chart breaks down process into specific process power types. Drives account
2,100
2,150
2,200
2,250
2,300
2,350
2,400
2,450
2,500
2014 2015 2016 2017 2018
Chart 19 - Industrial Customers by Rate Class
Outdoor Direct Security
Lighting
High Voltage Service
Experimental
Interruptible Service
Large InterruptibleService
Large Customers - High
Load factor
Large Customers
Small Customers
-
200
400
600
800
1,000
1,200
1,400
1,600
2014 2015 2016 2017 2018
Chart 20 - Municipal Customers by Rate Class
Miscellaneous
Outdoor Direct Security Lighting
Municipal Buildings Light & Power
Master Metered - Res
High Voltage Service
Large Customers - High Load Factor
Large Customers
Small Customers

APPENDIX 14 | P a g e
Space Cooling 29%
Space Heating 1%
Appliances & Plug Load
26%
Lighting 39%
Water Heating
0%
Refrigeration
5%
Chart 21- Commercial Electric End-Use Characterization
for the majority of end use energy, while fans, pumps, and compressed are also significant end-uses.
[Source: Both charts below were derived from the 2012 IRP, Appendix B Potential Study]
Compressed Air
16%
Drives 33%
Fans 21%
HVAC 5%
Lighting 2%
Pumps
17%
Other 6%
Chart 22 - Industrial End-Uses
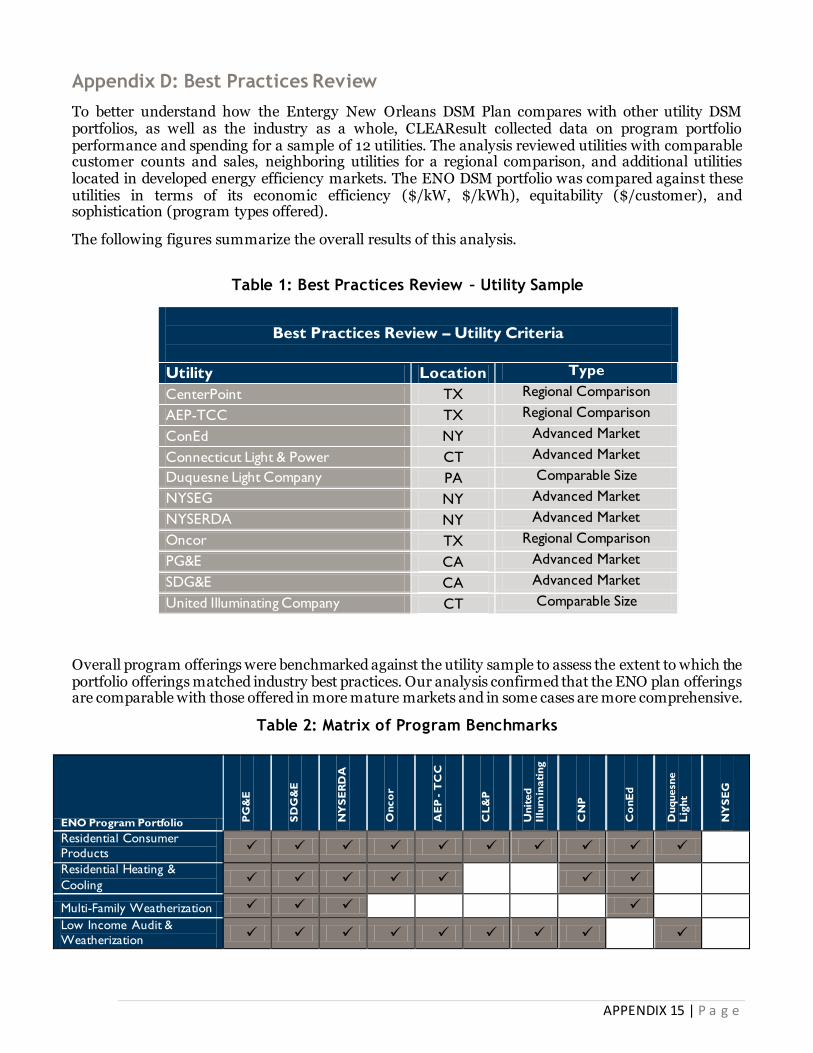
APPENDIX 15 | P a g e
Appendix D: Best Practices Review
To better understand how the Entergy New Orleans DSM Plan compares with other utility DSM portfolios, as well as the industry as a whole, CLEAResult collected data on program portfolio performance and spending for a sample of 12 utilities. The analysis reviewed utilities with comparable customer counts and sales, neighboring utilities for a regional comparison, and additional utilities located in developed energy efficiency markets. The ENO DSM portfolio was compared against these utilities in terms of its economic efficiency ($/kW, $/kWh), equitability ($/customer), and sophistication (program types offered).
The following figures summarize the overall results of this analysis.
Table 1: Best Practices Review – Utility Sample
Overall program offerings were benchmarked against the utility sample to assess the extent to which the portfolio offerings matched industry best practices. Our analysis confirmed that the ENO plan offerings are comparable with those offered in more mature markets and in some cases are more comprehensive.
Table 2: Matrix of Program Benchmarks
ENO Program Portfolio PG
&E
SD
G&
E
NY
SE
RD
A
Onco
r
AE
P - T
CC
CL
&P
Unit
ed
Illu
min
ati
ng
CN
P
Co
nE
d
Duquesn
e
Lig
ht
NY
SE
G
Residential Consumer
Products
Residential Heating &
Cooling
Multi-Family Weatherization
Low Income Audit &
Weatherization
Best Practices Review – Utility Criteria
Utility Location Type
CenterPoint TX Regional Comparison
AEP-TCC TX Regional Comparison
ConEd NY Advanced Market
Connecticut Light & Power CT Advanced Market
Duquesne Light Company PA Comparable Size
NYSEG NY Advanced Market
NYSERDA NY Advanced Market
Oncor TX Regional Comparison
PG&E CA Advanced Market
SDG&E CA Advanced Market
United Illuminating Company CT Comparable Size

APPENDIX 16 | P a g e
Home Performance With
ENERGY STAR
Energy Efficient New Homes
Small Commercial Solutions
Large Commercial solutions
Data on planned spending and savings for the comparable set of planning years (2014 – 2017) is challenging to find as many utilities are currently in the process of developing or refining their DSM plans. For those utilities for which data was available, the following tables outline the overall comparison of the ENO portfolio. The data included in this analysis represents future intended investments for comparable planning period (2014-2017); due to the ENO program year cycle, the charts have represented this data as Yr. 1 (ENO 2014 – 2015), Yr. 1 (ENO 2015 – 2016) and Yr. 3 (ENO 2016-2017)
Chart 1: Residential Forecasted $/kWh
$- $0.10 $0.20 $0.30 $0.40 $0.50 $0.60 $0.70 $0.80
Residential Forecasted $/kWh
Yr 1 Yr 2 Yr 3

APPENDIX 17 | P a g e
Chart 2: Commercial Forecasted $/kWh
Chart 3: Residential Forecasted $/kW
$-
$0.10
$0.20
$0.30
$0.40
$0.50
$0.60
$0.70
$0.80
$0.90
$1.00Commercial Forecasted $/kWh
Yr 1 Yr 2 Yr 3
$- $500.00
$1,000.00 $1,500.00 $2,000.00 $2,500.00 $3,000.00 $3,500.00 $4,000.00
Residential Forecasted $/kW
Yr 1 Yr 2 Yr 3

APPENDIX 18 | P a g e
Chart 4: Commercial Forecasted $/kW
Chart 5: Residential Forecasted $/Customer
$-
$500.00
$1,000.00
$1,500.00
$2,000.00
$2,500.00
$3,000.00
$3,500.00
Commercial Forecasted $/kW
Yr 1 Yr 2 Yr 3
$- $10.00 $20.00 $30.00 $40.00 $50.00 $60.00 $70.00 $80.00 $90.00
$100.00
Residential Forecasted $/Customer
Yr 1 Yr 2 Yr 3

APPENDIX 19 | P a g e
Chart 6: Commercial Forecasted $/Customer
$-
$100.00
$200.00
$300.00
$400.00
$500.00
$600.00
$700.00
$800.00
Commercial Forecasted $/Customer
Yr 1 Yr 2 Yr 3