apr 82 l w anderson, c c lin f19628-78-c-0092 …
TRANSCRIPT

AD-AL16 937 WISCONSIN UNIV-MADISON DEPT OF PHYSICS F/6 20/6PULSED EXCITATION AND COLLISIONAL PROCESSES. U)APR 82 L W ANDERSON, C C LIN F19628-78-C-0092
UNCLASSIFIED AFGL-TR-82-0139 ML
El EIIIIIIIIIIlMii

-"M4
't".~.4 A' m "
iA1A-4 ,__ T ;
-, F . N-
1
-
SA . -
:. ~ 44.
-AKC
4m . .. ,

UnclassifiedSECURITY CLASSIFICATION OF THIS PAGE Man, bato _Eateed__
i i REPORT DOCUMENTATION PAGE REDISTRUCTIONS• • BEFORE COMPLETING FORM
: I. Re[po"? NUMBER TZ. GOVT ACCESSION NO. 3. RECIPIENT'S CATALOG NUMBER
AFGL-TR-82-0139
4. TITLE (an le) s. TYPE OF REPORT tPERlO) COVNEDPulsed Excitation and Collisional Processes Final
I January 1978 -31 March 198
S. PERFORMING o4G. REPORT NUMBER
7. AUTHOR(s) s. CONTRACT ON GRANT NUMOER(s)L. W. Anderson F19628-78-C-0042C. C. Lin
9. PERFORMING ORGANIZATION NAME AND ADDRESS . 10. PROGRAM ELEMENT. PROJECT. TASK
Department of Physics AREA & WORK UNIT NUMBERS
University of Wisconsin-Madison 61102FMadison, Wisconsin 53706 2310G4AH
It. CONTROLLING OFFICE NAME AND ADDRESS 12. REPORT DATE
Air Force Geophysics Laboratory 29 April 1982Hanscom AFB, Massachusetts 01731 I. NUMBER OF PAGESMonitor/Edward T. P. Lee /OPR 4414, MONITORING AGENCY NAME S ADDRESS(II different Irn Controlling Office) IS. SECURITY CLASS. (of thl report)
Unclassified
IS. ASSIFICATION/OWNGRAoING
SCHEDULE
I. DISTRIBUTION STATEMENT (of this Report)
Approved for public release; distribution unlimited
17. DISTRIBUTION STATEMENT (of the abstract entered In Block 20. it different hem Report)
IS. SUPPLEMENTARY NOTES
19. KEY WORDS (Cmnthwe an reveres aide It necesary and Identify by block number)
collisional quenching, laser-induced fluorescence, the a3E+ and d 3E+ levelsu u
of the He2 molecule, the a 3Eu level of the N2 molecule.
W.ABSTRACT (Con~tinuae en reverse old. if necessary end identify by block niaber)
The method of pulsed excitation is used to study the rates of population andde-population of energy levels of molecules. Optical measurements are madewith the aid of laser-spectroscopic techniques. Application to a heliumdischarge yields collisional quenching rates. Preliminary studies on nitrogenmolecules are reported.
DO ,, 1473 EDITION OF I NOV 6 IS OBSOLETE Unclassified
SECItjRITV C_ ASSIFICATION O' THIS PAu@ fN on foe &Oh.ee)

Chapter I.
Introduction

2
In this project we utilize the method of pulse excitation to study atomic
and molecular processes. The primary excitation is produced by a pulsed gas
discharge. After the cessation of the pulse, the populations of the
various excited levels are monitored. From the time-dependence of these
populations, it is possible to determine rate constants for production and
decay of different excited species through collisional transfer. The pulse
method has an advantage over measurements in the steady state in that we can
study transfer processes without the influence of the primary excitation.
For probing the populations of the excited levels we use the technique of
laser spectroscopy to isolate the individual levels.
To develop and perfect the necessary techniques for experimental
measurement and data analysis appropriate to the conditions or our work, we
perform the pulse excitation experiment for a heliumz discharge. Since a
great deal is known about the transfer processes in a helium discharge, we
can comipare our results with those of other researchers. In Chapters II
and III we describe our study on helium discharge. Where our results overlap
with those of earlier works, we generally find good agreement. However, our
experiments also provide rate constants that have not been measured
previously. Furtheimore our work on helium shows that the use of pulse
excitation along with laser spectroscopy is an effective way to
study excitation transfer processes. In Chapter IV we report our efforts
to adopt this scheme to study excitation processes for nitrogen molecules.

Chapter II.
He (d3Z +) decay rate in a high-pressure helium afterglow
2 u
NTIS GRA&I
Distributionl/_________
Availability Codes
Avci an,-/or
Dist Special
INSPEcTFD
3

4
The development of atmospheric pressure lasers has illuminated the
continuing need for the study of collisional processes in high pressure
afterglows. In this paper we report the first measurement of the pressure
dependent He2 (d3 Z) decay in the afterglow of a helium discharge at pressures
from 50 to 700 Torr. The measured total collisional quenching rate for the
(v = 0) He2(d 3Z) molecule by He(l S) is(2.5 t 0.2) x 10- 1 2 an3 sec-I at
293*K. This corresponds to a thermally averaged cross section of 0.16 x 10- 16
2 1cm2 . This work complements an earlier paper which reported a total
collisional quenching rate for He(3 S) level atoms by ground state He atoms
of (6.4 ± 0.3) x 1012 cm3 sec - at 292-K.
The experimental technique is based upon dye-laser induced fluorescence.
3 +Metastable H e2 (a Eu) molecules created in the afterglow of the discharge are
excited to the e3 J level by a dye-laser pulse. Collisions rapidly transferg
sawm of the e311 molecules to the d3E+ level. The temporal dependence of the3 3+ 93
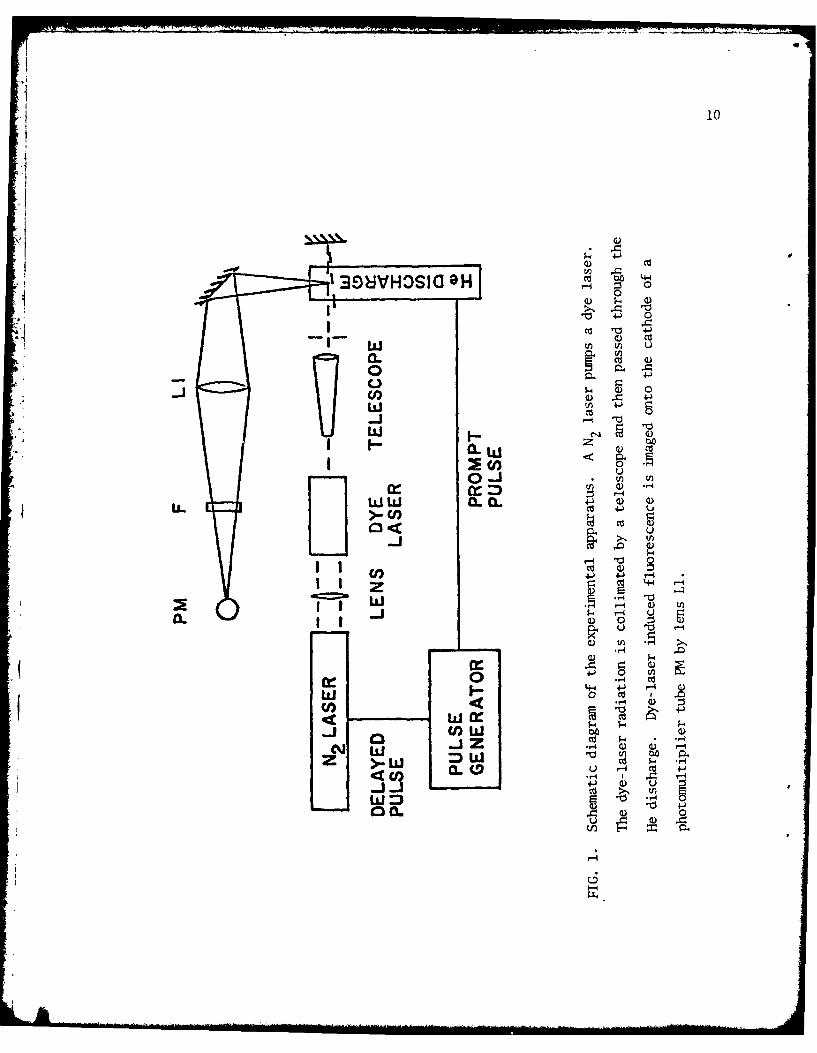
resulting d E - b 1I fluorescence is then measured. A schematic drawing
of the apparatus is shown in Fig. 1. A Tektronics 115 pulse generator supplies
a pair of timing pulses. The first pulse triggers the thyratron-switched He
discharge; the second pulse, after a variable delay of 50 to 100 Psec, triggers
a thyratron-switched nitrogen laser that pumps a dye laser. The 0.05 nm band-
width, 3 nsec duration dye laser pulse2 is tuned to the QS line of the (0-0)
band of the He2 e31I - a3 Z+ transition at 465.2 m. After collimation to a2 g ubeam diameter of 3.5 nm, the 5 1J dye laser pulse is passed twice through the
afterglow. The laser induced fluorescence from the (0-0) band of the
d3E+ -0 b3fg transition at 640 nm is imaged with 1:1 magnification using an f/4
lens onto an EI 9785B photomultiplier. The photomultiplier signal is large
enough to be clearly displayed on a Tektronics 475 oscilloscope. Individual
i . . .. . .. . . . .. . . . .. . .. ... . . . .... . . .. ... .. .. . . .. . .. . .

oscilloscope traces are photographed, digitized, and analyzed to determine
the temporal characteristic of the fluorescence.
At each pressure the time delay between the He discharge pulse and
the dye laser excitation pulse is increased tmtil the observed d3 u decay
rate is independent of the delay time. This ensures that remenant plasma
ionization and recombination does not effect the measured decay rate. Further
3 +increases in the delay time resulting in decreases of the He2 (a Eu) and
He(2 3S) level populations by factors of up to 20 produce no change in the
observed decay rate. This indicates metastable He atoms and molecules do
4 not effect the measurement. Typical He2 (a EU ) densities for a time delay
10 11 -3of 100 Usec are 10 to 10 n - . At the pressures used in this experiment,
the population of the He2 (e3 TIg) level produced by the dye laser pulse is
collisionally quenched in a time comparable to or shorter than the duration of
the dye laser pulse.3 The observed rise time of the 640 nm fluorescence is
essentially the same as the convolted rise times of the photomultiplier and
the dye laser pulse. The transfer rate of d3 + level molecules back to theEu
e311 level is negligible at thermal energies because the d3E+ level lies 0.15 eV
below the II level. We have measured the rotational temperature of theg3 +
He2 (a EU) molecules as a function of the time. These molecules are created
rotationally hot, but they cool to near room temperature within 100 to 150 psec.
For this reason we take the neutral gas temperature to be room temperature.
The possible influence of impurities upon the measured pressure dependent
decay rate must be considered. This is hampered by the lack of theoretical
or experimental knowledge of the reaction kinetics of nonmetastable He2
molecules. The strong Rydberg nature of He2 molecules 4 ' 5 results in similar
reaction rates, normally within a factor of 3, for the quenching of He2 (a ;
2 -u
!" ' "-AF l ll

6
3 6-83and of He(2 S) by impurities. Present rate data indicate the 33S atoms are
only a few times more reactive than the 2 S metastable atoms when chemioniza-
9 103+tion is an open reaction channel. ' 10 By analogy we expect the d Z reaction
3+rates with impurities to be only slightly larger than the a3 u reaction rates.
The a 3E decay rate measured in our system is always at least a factor of 400
slower than the measured d 3 E decay rate. For this reason we feel the impurities
do not make a significant contribution to the observed d 3Z quenching rates.
The He2(d 3u) decay rate as a function of the pressure is shown in Fig. 2.
Each datum point for the He2(d3-+) decay curve is obtained by averaging the
decay rates obtained from seven to 15 oscilloscope trace photographs of
the 640 nm fluorescence signal. The error bars represent one standard
deviation in the data. Using a least-squares fit to the expression R = a + bP,
7 -1 4 -we obtain a = (1.98 ± 0.14) x 10 sec I and b = (8.2 ± 0.6) x 10 Torr-
sec . The slope represents a total collisional quenching rate for the
d3 Z+molecule of (2.5 ± 0.2) x 10 on3 sec - 1 at 2930K and the intercept
gives the radiative decay rate of the d3E+ level. There is no previous mea-U
3 +surement of the d Z u collisional quenching rate. The measurements of Delpech,
Gauthier, and Devos taken between 8 and 34 Torr indicated a pressure independent
decay rate of (2.15 ± 0.15) x 10 7 sec 1 for the isotopically rare 3He2 (d3E+)
electronic state. 11 The radiative decay rate of an electronic level should
be the same for 3He2 and 4He 2 and collisional quenching rates of the d3u
level molecules of 3He2 and 4He2 by ground state He atoms should be similar.
Within the uncertainty of their experiment, decay rates predicted by our
experiments and analysis agree with the results of Delpech et al. when our
experiments are extrapolated to the pressures used by Delpech et al.

7
The lack of three body potential surfaces for He3 prevents a definite
theoretical prediction of the reaction pathways in the collisional quenching
of He2 (d3 I) molecules by thermal He(I S) atoms. The probable reaction
products may be conjectured by using as guidelines conservation of spin,
access to only energetically allowed levels, and magnitude of energy defect
between initial and final states. Possible products would then be two
He(1 1 S) atoms plus a He(2 3S) atom or one He(IS) atom plus either a
He2 a3 Eu, b 11g or c 3 g molecule. The energy defect between the (v = 0)
3 + 3 +d Eu level and the highest vibrational level of the c E molecule is more
3 gthan 0.5 eV. The 2 S + 1 S dissociation limit of the a3Eu level molecule
is about 0.8 eV below the (v = 0) d level. For these channels kinetic
energy of the products must take up rather large amounts of energy. However,
the (v = 0) d3 + level, which lies about 0.25 eV below the 23P + 11s
dissociation limit of the b3 g molecule, is nested among the high lying
b31g vibrational levels. Atom exchange collisions between He(I S) atoms and93 +He2 (d Eu) molecules could be effective in producing these vibrationally
excited b3Hg molecules. Of course, it may be possible to produce He2 in
the c3E+ state or in the low vibrational levels of the b3 H state viag g
crossings of the appropriate potential surfaces of the He3 system. In the
absence of any detailed information on such potential surfaces, we are not
able to comment on the likelihood of these mechanisms. Nevertheless, it is
interesting to note that the valence electron of He2 (d3Eu) is largely 3s-I3 12 3 -1 1like and that the quenching rate for the He(3 S) atom (6.4 x 10 cm sec-)
is indeed rather close to that of the He2 (d 3 ) molecule. Based on theoretical2 u
calculations it is believed that a major quenching mechanism for the
3 33He(3 S) atom is the nonresonant 33S - 23P excitation transfer due to the
LA ...

8
curve crossing of the f3Ei and d 3E+ potentials. 4Thus, me may speculateu U
analogous kinds of potential surface crossings for the He. system which
d3+ 3+ 3+may result in nonresonant d - c E and d3 Z b n 9 collisional transfer.

9References
1. J. E. Lawler, J. W. Parker, L. W. Anderson, and W. A. Fitzsinmons,
Phys. Rev. A 19, 156 (1979).
2. J. E. Lawler, W. A. Fitzsimmons, and L. W. Anderson, Appl. Opt. 15,
1083 (1976).
3. J.-C. Gauthier, J.-P. Geindre, J.-P. Moy, and J.-F. Delpech, Phys. Rev.
A 13, 1781 (1976).
4. W. S. Steets and N. F. Lane, Phys. Rev. A 11, 1994 (1975).
S. J. S. Cohen, Phys. Rev. A 13, 86 (1976).
6. F. W. Lee and C. B. Collins, J. Chem. Phys. 65, 5189 (1976).
7. F. W. Lee and C. B. Collins, J. Chem. Phys. 67, 2798 (1977).
8. F. W. Lee, C. B. Collins, L. C. Pitchford, and R. Deloch, J. Chem.
Phys. 68, 3025 (1978).
9. S. Kubota, C. Davies, and T. A. King, J. Phys. B 8, 1220 (1975).
10. A. L. Schmeltekopf and F. C. Fehsenfeld, J. Chem. Phys. 53, 3173 (1970).
11. J.-F. Delpech, J.-C. Gauthier, and F. Devos, J. Chem. Phys. 67, 5934
(1977).
--T2-
10
)
1398VHOSI(3 H0
0O ** 4-)
U) 4 -
w C, 'CO
0~ 1
LLco 4-) uU)U
-) 4 0) 4
O 4- 4
a. U) z0
-4 ro U) ~0) H
Ld 0 0o
4% H Q) 4
w ir % "Co

1l
Cr./! +
w4 "
wWW
0-JILl
0 I !0 200 400 600
PRESSURE OF He (TORR)3+
FIG. 2. Decay rates of the He (d 3E) level as a function of discharge cell pressure.
A least-squares fit of the He2(d 3 ) decay rate to the equation a + bP
7 -1 4- 1 1gives a--(1.98+O.14) x 10 sec and b=(8.20±0.55)xl0 4Torr 1 sec at 293"K.
Also shown are the decay rates of the He(33S) level from Ref. 1. A fit
to the He(33S) decay rate gives a=(2.63±0.20)xlO7 sec-1 and b=(2.12±0.11) x
10 Torr-Isec "1 . The error bars represent one standard deviation in the data.

Chapter III.Collisional quenching of He2 molecules in the
U level by impurity gases
"I.1
11

13
I. Introduction
This chapter reports measurements of the rate constants (at room temperature)
for the collisional quenching of He2 molecules in the a3Eu level by Ar, N2 ,
0 2' H2 , and CO2 . The diatomic He2 molecule has a strong Rydberg character, ,2
and there is a close correspondence between the a 3Z level of the He2
molecule and the 2 S level of the He atom. Hence, the measurements reported
in this paper parallel the measurements of the rate constants for the
collisional quenching of the He(2 S) level by various atoms and molecules.' 4 '5 '6
Our measurements are performed in the afterglow of a pulsed He discharge
3 +at pressures of 200 and 300 Tort. Metastable He2 (a EU) molecules are created
in the afterglow of the pulsed discharge predominantly through the recombination
of molecular He2 ions and through the conversion of metastable He(23S) atoms
into He(a Eu) molecules by the reaction He(2 3S) + 2He - He(a 3z ) + He.U)
3 + 3Some of the He2 (a Eu) molecules are excited to the e 7rg level by a pulse of
light from a N2 lasar-ptmped dye laser tuned to 465 nm, the wavelength of the
Q5 line of the (0-0) band of the e 3ng * a transition. Collisions with9 u3 3 +ground state He atoms rapidly transfer some of the e ng molecules to the d u
level. The resulting fast fluorescence on the d3Eu + b3 v transition atu g640 nm is monitored. The optical absorption, collisional transfer, and
optical emission are shown in Fig. 1. The change in the fluorescence yield
as the delay between pulsing the He discharge and pulsing the N2 pumped dye
laser increases is used to monitor the change of the population of the a3 Eu
3 +molecules. The collisional quenching rate of the He2 (a zu) molecules is
measured at different concentrations of foreign gas yielding Stern-Volmer
7 3 +plots7 of the a 3E u quenching rate as a function of the foreign gas
concentration.

14
There are two previous measurements of the collisional quenching rate3+8
of the He2 (a 3z) level by a foreign gas. Lee and Collins 8 have measured3+
the rate constants for the quenching of He2 (a zE) molecules by Ne,
Ar, N2, CO, CO2, and (114 in the afterglow of an electron-beam generated
discharge at He pressures from 1,500 to 2,500 Torr. They present their
measurements as effective rate constants since at the high pressures of their
experiment three body collisions among He2 (a 3zu) molecules, foreign gas
12molecules, and He(l S) atoms account for 30 to 50% of the quenching collisions.
Pitchford and Deloche 9 have measured the rate constant for quenching of3 +
He2(a Zu) molecules by Ar at He pressures below 60 Torr.
In the present work, we combine our data for Ar, N2, and CO2 taken in the
afterglow of a He discharge at pressures of 200 and 300 Torr with the data of
Lee and Collins to extract both bimolecular and termolecular rate constants.
A similar analysis has been used by Lee, Collins, Pitchford, and Deloche10
to obtain bimolecular and termolecular rate constants for the quenching of
He2 (a 3E) molecules by Ar.
II. Experimental Apparatus and Method
A schematic drawing of our experimental apparatus is shown in Fig. 2.
The Tektronic 115 pulse generator supplies a pair of +2V, 10 nsec duration,
timing pulses at a 10 Hz repetition rate. The first pulse triggers the
thyratron-switched He discharge; the second pulse triggers the thyratron-
switched N2 laser that pumps the dye laser. The 0.05 nm bandwidth, 3 nsec
pulse duration dye laser is tuned to the 465.2nm Q5 line of the (0-0) band of
the He2 e 3g 4- a3 u transition. After collimation to a beam diameter of 3.5 mm,
the 5 pJ dye laer pulse passes through the center of the discharge region and
then reflects off a mirror back through the discharge at a small angle to its

I.. 15
original path. A lens stopped to f/4 images the laser-induced fluorescence
3. +of the (0-0) band of the d E bu-Og transition at 640 n onto an EMI 9684B
photomultiplier with 1:1 magnification. The dye laser pulse strongly saturates
the e 37 - aSEu+ transition. The amount of laser induced fluorescence ist uproportional to the concentration of a Eu (v-0, J=5) molecules. The
fluorescence signal is displayed on a Tektronix 475 oscilloscope.
The a Zu decay rate is measured as follows: A neutral density filter
of 5 or 10% transmission is located between the discharge and photomultiplier.
The delay between the He discharge and the N2 laser discharge is adjusted so
that the fluorescence signal is near the upper end of the photcmultiplier's
linear region. As the delay increases, neutral density filters of higher
transmission are substituted so that the peak signal currents remain between
0.15 and 0.4 mA. The scan ends when the delay becomes so long that the peak
current drops below 0.15 mA with no neutral density filter present. The
increment in delay is chosen so that the fluorescence signal is measured
8 to 12 times during a scan. The delay is measured with an accuracy of ±0.5%.
The time dependence of the fluorescence signal is exponential and the
time constant does not change as the delay increases. The amount of laser-
induced fluorescence is proportional to the peak height of the photomultiplier
signal observed on the Tektrnic 475 oscilloscope. At each delay the peak
heights, which vary by 10 - 15% from pulse to pulse, are averaged by eye.
The peak heights are normalized by dividing the measured peak height by the
transmission of the neutral density filter at 640 m. The normalized data
are then graphed on semi-log paper resulting in a plot like that shown in Fig. 3.
For each scan a least-squares fit of the normalized data to an expression of the
form aexp(-bt) is performed where t is the time in seconds.

16
For each foreign gas, four samples of foreign gas-He mixture of varying
concentration are prepared. The preparation of the gas mixture is done over
a six day period. We start with a full size 1A cylinder of 99.995% purity
He gas (43.8 liter internal volume pressurized to about 2,400 psi). On the
first day, the decay rates of the a 3 E level in a 200 and in a 300 Torr Heu
discharge are measured for the source cylinder. Each of the four succeeding
days a sample is prepared by filling a cylinder evacuated to a pressure of a
few m Torr to a pressure of several Torr of the foreign gas and then to a
total pressure of 316 psi with He from the source tank. The foreign gas
pressure in the second, third, and fourth mix cylinders are nominally 2, 3,
and 4 times that of the first. Oni the sixth day, the a 3 Zu decay rates in
a 200 and in a 300 Torr He discharge are again measured for the source
cylinder. The source cylinder decay rate increases from values of
0.5-1.0 x 10 5sec- initially on day 1 to 1.0-2.0 x 10 5sec-1 on day 6 after
the filling of the 4 mix cylinders. Wie do not know why the background decay
rate increases with time, but we speculate that the He tank imy have a
containent with a constant vapor pressure so that the contaminant fraction
increases as He is withdrawn from the tank. We assume in the data analysis
that the background rate of the source tank increases linearly with time as
the tanks are filled. We estimate that this assumption contributes only
about a 5% uncertainty to the rate constants measured.

17
3 +II. Rate Constants for Collisional Quenching of He2 (a Zu, v = 0)
Molecules by Ar, N2, 02, H2 , and C02
The rate equation describing the evolution of the a3Eu population
during the afterglow is given by:
T -ld = K2 [X + K[X] [He],
or
-1 d MI v + K[X] (2)
3 +where [M], [X], and [He] are, respectively, the concentrations of He2 (a u
v = 0) molecules, the added foreign gas, and the He (11S) atoms, K2 is the
bimolecular rate constant, K3 is the termolecular rate constant for the3+
destruction of a E molecules by foreign gas X, and K = K2 + K [He] is the
effective rate constant. The rate v represents loss and source terms due
to other processes that affect the a Eu population. Loss terms include
diffusion of a3 E molecules out of the discharge region and collisions betweenu
the a 3Zu molecules and impurities in the helium, other a 3u molecules,
He(2 S) metastable atoms, and electrons. Source terms include recombination
of He+ ions and collisions of He(23S) atoms with two He(l S) atoms. The data
analysis assumes that the rates encompassed under v are either constant during
the afterglow or of such small size compared to the total a3 E+ decay rate thatu
they are negligible. This assumption is justified in Ref. 11.
18
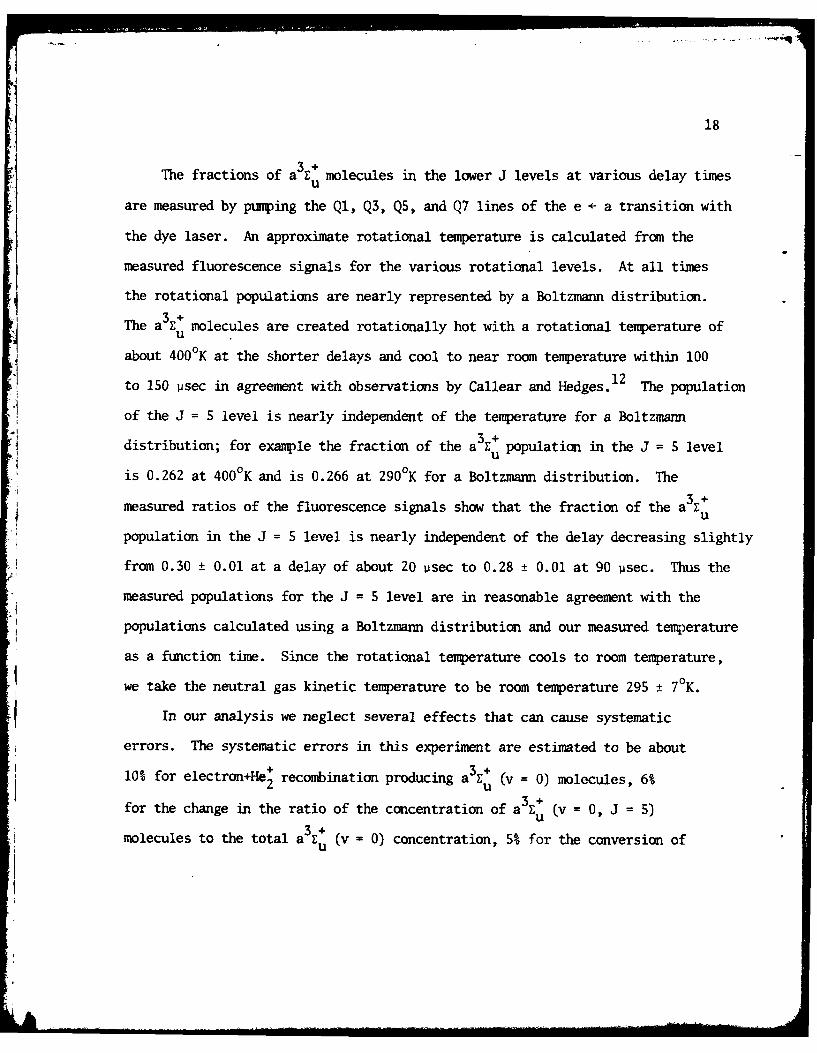
The fractions of a 3Z+ molecules in the lower J levels at various delay times
are measured by pumping the Ql, Q3, Q5, and Q7 lines of the e - a transition with
the dye laser. An approximate rotational temperature is calculated fromn the
measured fluorescence signals for the various rotational levels. At all times
the rotational populations are nearly represented by a Boltzmann distribution.
The a 3E+ molecules are created rotationally hot with a rotational temperature ofu
about 400 0 K at the shorter delays and cool to near room temperature within 100
to 150 iisec in agreement with observations by Callear and Hedges. 12The population
of the J = 5 level is nearly independent of the temperature for a Boltzmann
distribution; for example the fraction of the a 3 E population in the J = 5 level-Su
is 0.262 at 4000K and is 0.266 at 2900K for a Boltzmann distribution. The
measured ratios of the fluorescence signals show that the fraction of the a 3
population in the J = 5 level is nearly independent of the delay decreasing slightly
from 0.30 ± 0.01 at a delay of about 20 psec to 0.28 ± 0.01 at 90 i'sec. Thus the
measured populations for the J = 5 level are in reasonable agreement with the
populations calculated using a Boltzmann distribution and our measured temperature
as a function time. Since the rotational temperature cools to room temperature,
we take the neutral gas kinetic temperature to be room temperature 295 ± 7 0K.
In our analysis we neglect several effects that can cause systematic
errors. The systematic errors in this experiment are estimated to be about
33+
for the change in the ratio of the concentration of a E u (v = 0, J = 5)3 +molecules to the total a Eu (v =0) concentration, 5% for the conversion of
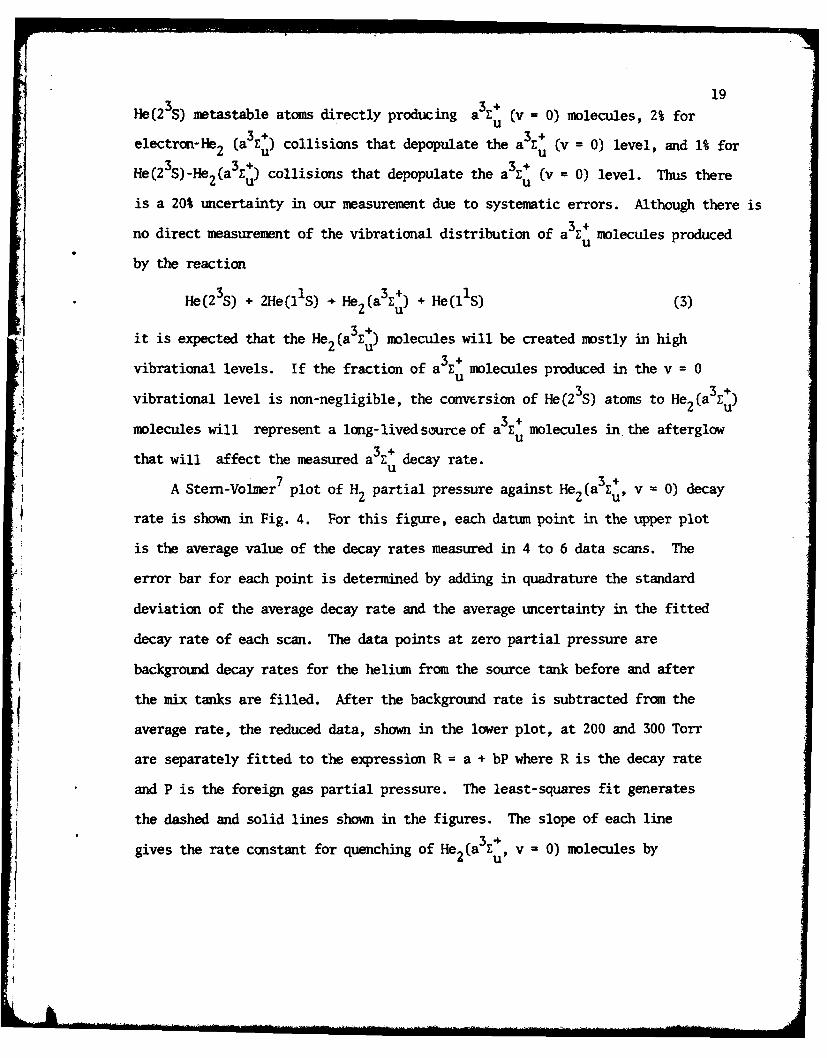
19
He(23S) metastable atoms directly producing a 3E+ (v = 0) molecules, 2% forU
electron-He2 (a3 Z+) collisions that depopulate the a3 Zu (v = 0) level, and 1% for2 U) U
3 3+ 3 +He(2 S)-He2 (a 1u ) collisions that depopulate the a £u (v - 0) level. Thus there
is a 20% umcertainty in our measurement due to systematic errors. Although there is
no direct measurement of the vibrational distribution of a3 molecules produced
by the reactionHe(23S) + 2He(llS) - He2(a3 zu ) + He(llS) (3)
3 +it is expected that the He2 (a Lu) molecules will be created mostly in high
vibrational levels. If the fraction of a 3 E molecules produced in the v = 0
vibrational level is non-negligible, the conversion of He(2 3S) atoms to u3
molecules will represent a long-lived source of a3E molecules in. the afterglowu
that will affect the measured a 3z + decay rate.
A Stem-Volmer7 plot of H2 partial pressure against He (a Z , v - 0) decay
rate is shown in Fig. 4. For this figure, each datum point in the upper plot
is the average value of the decay rates measured in 4 to 6 data scans. The
error bar for each point is determined by adding in quadrature the standard
deviation of the average decay rate and the average uncertainty in the fitted
decay rate of each scan. The data points at zero partial pressure are
background decay rates for the helium from the source tank before and after
the mix tanks are filled. After the background rate is subtracted from the
average rate, the reduced data, shown in the lower plot, at 200 and 300 Torr
are separately fitted to the expression R = a + bP where R is the decay rate
* and P is the foreign gas partial pressure. The least-squares fit generates
the dashed and solid lines shown in the figures. The slope of each line
gives the rate constant for quenching of He2(a3E+, v = 0) molecules by2

20
collisions with the foreign gas. The effective rate constant K, listed
in Table 1 for each foreign gas, is the average of the rate constants for
the 200 Torr data and for the 300 Torr data. The uncertainty in K results
from the 20% systematic uncertainty, the statistical uncertainty in the
rate constants determined by the least-squares fit, and the 5% uncertainty
in subtracting out the background decay rate.3 +Referring to equations 1 and 2, the quenching of a He 2 (a E U) molecules
by X results from either the bimolecular reaction
He (a3E) X + Products (rate constant K(4)2 u) K2)
or from the termolecular reaction
3 +He 2 (a Eu) + X + He -~ products (rate constant K 3) (5)
In the collision between the a 3Eu+ molecule and X, the long range radial potential
is the sum of the Van der Waal attraction and the centrifugal potential. If
the reactants do not have enough center of mass kinetic energy to surmount the
centrifugal barrier, a glancing collision occurs. If the reactants can surmount*1 the centrifugal barrier, the reactants come close together, spiralling about
one another, with the activation energy determining the probability of a
reaction. During the collision a third body, a He 2 (lS) atom for this
experiment, may change the trajectory and the kinetic energy of the reactants
enhancing the likelihood of spiralling collisions.
3In describing the collisions of foreign gas molecules with He(2 S) atomsr
and with H+ions, Collins and Lee 6 ,1 1 calculate classical three-body capture
* 2

21
rates that agree fairly well with their measurements of termolecular rate
constants for the respective collisions. Since the polarization potentials
3 +are not known for interactions between He2 (a Er) molecules and othermolecules, similar calculations for collisions with a3E+ molecules have not
U
been done.
From previous work on collisional quenching of He(2 3S) atoms 4 , and
3 + 8He2 (a Eu) molecules and consistent with our results, the changing of the
He pressure in the discharge from 200 Torr to 300 Torr while holding the
partial pressure of the foreign gas constant results in about a 5% increase
in the effective rate constant. The pressure range used in this experiment
is too small to permit an accurate determination of both the bimolecular
and the termolecular rate constants from the measured effective rate constants.3 +
Data points from measurements of a Z decay rates at He pressures betweenu
1,S00 and 2,500 Torr are given for N2 partial pressure of 14, 50, and 75 mTorr
by Lee and Collins8 and for Ar partial pressures of 1S and 50 mTorr by Lee10
et al. We combine our data and their data in our analysis.
Figure 5, which is a plot of a3E + decay rate as a function of the Heu
pressure after the background decay rate has been subtracted out, shows the
data points given by Lee and Collins for 14, 50, and 75 mTorr partial pressures
of N2. The low helium pressure data points are generated by multiplying the
rate constants obtained from our measurements at 200 and 300 Torr by the
partial pressure of N2. The termolecular rate constant K3 is determined by a
least squares fit of the higher helium pressure data points to the expressionRR- = K + K ([He] - [He]o) (6)
where R is the a3 E decay rate, [N2] is the N2 concentration, K is the effectiveu 2 -10 3 -1rate constant determined from our low pressure data, 1.6 x 10 cm sec , and
[He] M 8.25 x 1018 cm-5 is the concentration of He atoms in a room temperature0
22
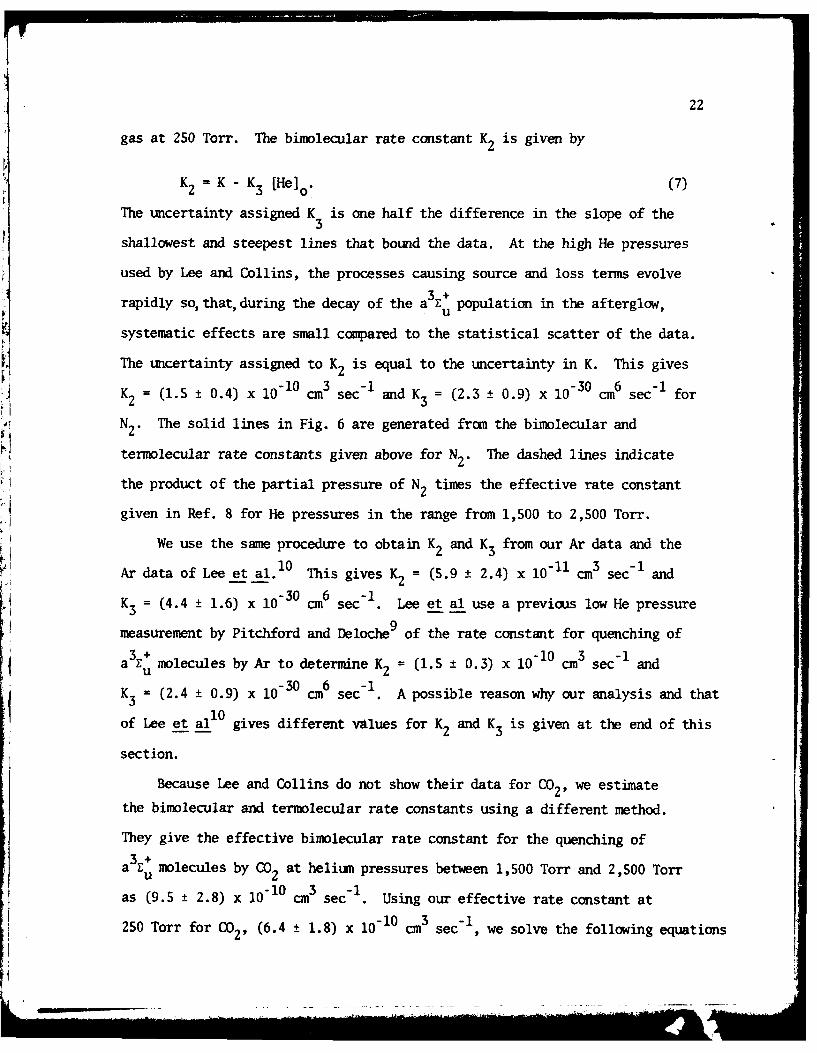
gas at 250 Torr. The bimolecular rate constant K2 is given by
K2 = K - K3 [He].o (7)
The uncertainty assigned K is one half the difference in the slope of the3- -
shallowest and steepest lines that bound the data. At the high He pressures
used by Lee and Collins, the processes causing source and loss terms evolve
3 +rapidly so, that, during the decay of the a Eu population in the afterglow,
systematic effects are small compared to the statistical scatter of the data.
The uncertainty assigned to K2 is equal to the uncertainty in K. This gives
K = (1.5 ± 0.4) x 1 0 cm3 sec - and K3 = (2.3 ± 0.9) x 10 cm6 sec 1 forK2 101
N2 . The solid lines in Fig. 6 are generated from the bimolecular and
termolecular rate constants given above for N2. The dashed lines indicate
the product of the partial pressure of N2 times the effective rate constant
given in Ref. 8 for He pressures in the range from 1,500 to 2,500 Torr.
We use the same procedure to obtain K2 and K from our Ar data and the
Ar data of Lee et al.10 This gives K2 = (5.9 ± 2.4) x l0-11 cm3 sec -1 and
K5 = (4.4 ± 1.6) x 10-30 cm6 sec -1 . Lee et al use a previous low He pressure
measurement by Pitchford and Deloche9 of the rate constant for quenching of
a 3u molecules by Ar to determine K2 (1.5 ± 0.3) x 10-10 cm3 sec-1 and(2.4 ± 0.9) x 1 0 cm sec 1 . A possible reason why our analysis and that
10of Lee et al gives different values for K2 and K3 is given at the end of this
section.
Because Lee and Collins do not show their data for CO2, we estimate
the bimolecular and termolecular rate constants using a different method.
They give the effective bimolecular rate constant for the quenching of
a u +molecules by CO2 at helium pressures between 1,500 Torr and 2,500 Torr
as (9.5 ± 2.8) x 10"I0 cm3 sec "1 . Using our effective rate constant at
250 Torr for CO2 , (6.4 + 1.8) x 10- 1 cm3 sec-I, we solve the following equations

23
6.4 x 10⁻¹⁰ cm3 sec - 1 - K2 + K3 (250)(3.3 x 1016 cm 3) (8)
and-. x110 3 -1 =-3
9.5 x 0- cm sec = K2 + K 3 (2000) (3.3 x 1016 cm). (9)
This gives K2 = (5.9 ± 1.8) x 10-10 cm3 sec - I and K3 = (5.4 - 2.1) x I0- 30
cm6 sec "1 where the uncertainty in K2 is set equal to the uncertainty in K
and the relative uncertainty in K 3 is set equal to the relative uncertainty
in K3 for N2, about 40%. These results for N2, Ar, and CO2 are summarized
in Table I.
Direct comparison with other experiments is not possible except in
the case of Ar. For N2, 02, and H the rate constants for the quenching
of a3E+ molecules seem reasonable, being 1.5 to 3 times larger than theucorresponding rate constants for the destruction of 23S atoms. The
bimolecular and termolecular rate constants calculated from the data of
this experiment combined with the data of Lee and Collins for quenching of
a 3u molecules by N2 are quite similar to the rate constants measured by
Lee et al10 for quenching of a 3 + molecules by Ar. This similarity in valueU
3is also seen in the rate constants for the quenching of He(2 S) atoms by
Ar and by N2 . The bimolecular rate constant that we calculate for the
quenching of a3 .u molecules by 00 is slightly smaller than the correspondingu 2
rate constant for quenching of 23S atoms. However, when one considers the
uncertainties given for the CO2 measurements, the small difference is not
significant.
Lindinger et al3 observe that the collisional quenching rate constants
for He(23S) atoms by various gases yield reasonably straight lines for Arrhenius
plots. They calculate activation energies for the quenching of 23S atoms
by H2 , N2, Ar, 02, and 002 of 72, 59, 59, 36, and 19 mV, respectively. If

24
the activation energies for the quenching of a3zu molecules by these fiveU
gases all scale downward by the same factor from their respective values
for the quenching of 23S atoms, the relative increase in the rate constant
would be greatest for H2 and progressively less for N2 , Ar, 02, and 002
with the relative change in Ar and N2 being the same. This behavior is
consistent with our measurements if one uses the value of Lee et a11 0 for Ar
instead of the one determined in this work. Testing this speculation that
all the activation energies scale downward by approximately the same factor
would require measuring the rate constants over a range of temperatures, an
experiment not possible with our apparatus.
As a final point, there is a large disagreement between this work and
that of Lee et al in the rate constant measured for Ar. The recombination
coefficient at room temperature for Ar+ ions is quite small, 14 6 x 10⁻¹⁰ cm3-15
sec Since the second ionization potential15 of Ar is larger than the energy
stored in either the He(23S) or the (a ) metastables, Ar+ ions do not
readily react with He metastables. Measurements in this work are performed
later in the afterglow than those of Lee et al. Conversion of Ar atoms to
Ar+ ions by collisions with He metastables could reduce the concentration of
Ar atoms in the later afterglow enough to reduce the measured rate constants
for the quenching of a3zu molecules. This possible problem does not arise
U
for the other molecules used in our experiments. For example, the re-
combination coefficients for N2 and 02 are 2.0 x 10- 7 and 2.2 x 10- 7 cm3 sec 1
respectively.16

25
References
1. W. S. Steets and N. F. Lane, Phys. Rev. All, (1975).
2. J. S. Cohen, Phys. Rev. A 13, 86 (1976).
3. W. Lindinger, A. L. Schmeltekopf, and F. C. Fehsenfeld, J. Chem. Phys.
61, 2890 (1974).
4. F. W. Lee and C. B. Collins, J. Chem. Phys. 65, 5189 (1976).
S. C. B. Collins and F. W. Lee, J. Chem. Phys. 70, 1275 (1976).
6. J. E. Lawler, J. W. Parker, L. W. Anderson and W. A. Fitzsimmons, IEEE
J. of Quantum Electronics QE-1S, 609 (1979).
7. A. C. G. Mitchell and M. W. Zemansky, Resonance Radiation and Excited
Atoms, (Cambridge Univ. Press, N.Y., 1961), p. 192.
8. F. W. Lee and C. B. Collins, J. Chem. Phys. 67, 2798 (1977).
9. L. C. Pitchford and R. Deloche, J. Chem. Phys. 68, 1185 (1978).
10. F. W. Lee, C. B. Collins, L. C. Pitchford, and R. Deloche, J. Chem.
Phys. 68, 3025 (1978).
11. J. W. Parker, Ph.D. thesis, University of Wisconsin, unpublished (1980).
12. A. B. Callear and R. E. M. Hedges, Trans. Faraday Soc. 66, 2921 (1970).
13. C. B. Collins and F. W. Lee, J. Chem. Phys. 68, 1391 (1978).
14. M. A. Biondi, Phys. Rev. 129, 1171 (1963).
15. G. Herzberg, Atomic Spectra and Atomic Structure, New York, New York:
Dover Publications, Inc., 1937, p. 200.
16. J. Dutton, J. Phys. Chem. Ref. Data 4, 577 (1974).

26
Table I.
Rate constants afrquenching of He 2(a3E+) metastable molecules and He(23S) metastableatoms at room temperature.
jHe 2(a zi)xKb 2( d Ke K e
2 K3 K2 3Ar 9.1±2.8 31±9 5.9±2.8 4.4±1.6 15±3 2.4±0.8N 16 ±4.7 30±9 15 ±4.7 2.3±0.92
02 27 ±9.3
H 11 ±3.5
GO 2 64 ±21 95±28 59 ±21 5.4±2.1
lie(2 3S)
x K fK92 2 3Ar 7.1±2.1 7.5±2.0 2.2±0.7
N2 7.1±2.1 6.9±2.1 2.9±0.7
02 24.5±7.4 19 ±6 3.1±1.2
H2
CO65 ±20 70 ±21 8.3±1.0G2
a K a n K 2 a e n n i t o 1 -1 c 3 s e c - a n d K 3 i s i n u n i t s o f 1 0 3 0 C 6 e -1 .
bi. work.
c From Ref. 8.
dThis work combined with Ref. 8.
eFrom Ref. 10.
fFrom Refs. 3-6.
g~a Refs. 4 and 5.

27
3+ - e3flgd3u + 9
-[.1
6400 A 4652 A
3b 1g
3 +__ 0 U
FIG. 1. Simplified energy level diagram for He2 molecules showing the
energy separation of the v - 0 vibrational levels of the electronic
configuration relevent to this paper.

28
13 8 HO* GH
0- coMU tAC u
+J
C/) Cd
Li- -
0 -14 W a
$ 0 0
II ~ CU M
It$- r -4q u
o C o
0 c0
cl: 0

29
itO0
C u C
0~ C)
coo r- C
0
ODCu
0 40
CDn
LO~ Cu
tn ci
LO 0
4.4
I0
44 00II a I t
C;O* I I00 En
afDaollnl Xi p 111 ~
o L

30
I 'I ''' I T
6- He 200 Torr o
He 300 Torr o
-4
3-
In 00
01 0
.i4
00
5 He 200 Torr o
S4- He 300 Torr )
CM 3
2-A
00
0 50 100H2 Partial Pressure (mTorr)
FIG. 4. Upper plot: measured a 3 r decay rate versus partial pressuresu~ 3 +
of H2 . Lower plot: Stern-Volmer plot of a zu decay rate after
background is subtracted out.
- I . . . ... II I III " .-

31
4J ;.4
01 .1: I i )0U co 4 "0+
(D. J (f.-- -4
$a +Se . )h*c 0 *o4~
* S0 4 0 0C0 -4- (L) U.
E o: CVA4 * 4 )0 Z V4-40f0 4-
'0 0 0
r4 +js ) 01 =.40U $44-q 4J~ CU-
ZIL) ) 4)
ID 40
0- 4 4 C
t 4
t ) 0 d.)
L2 I.CA n $

Chapter IV.
The electron excitation of N 2 molecules
32

33
Measurements of the absorption and emission intensities of various
electronic transitions and their time-dependence in a pulsed electron-excited
N2 experiment furnish an effective means of probing collisional energy transfer
processes. In order to extract the rate constants for the transfer processes
it is important to know the direct electron excitation cross sections of the
low excited electronic states, especially the triplet series. Measurements
of the excitation cross sections for the B311 and C311 levels by the opticalg u
method have been reported from several laboratories, but much less is lown
about the A level. This level is metastable and play an important role
in many atmospheric and laboratory processes. The first step of our effort
4 in this phase of the work is to measure the electron excitation cross section
of the A32: level of N2.
The electron excitation of many N2 levels can be studied by measuring
the emission intensity from these excited levels. The A Z level of N2 is,
however, metastable so that emission studies are very difficult. Thus a different
method is desirable to study the electron excitation of the A3 E level of N2.
We have used the laser induced fluorescence method for attempting to study the
excitation of the A .level.
Our apparatus is shown schematically in Fig. 1. The laser induced
fluorescence method works as follows. A vacuum chamber contains a low density
of N2 gas (1 - 30 mTorr). An electron beam passes through the low density
N2 gas. The electron beam is formed from an indirectly heated cathode and
is extracted and focussed into a parallel beam with a diameter of about 2 nm
using a number of electrodes. The energy of the electron beam is variable
from a few eV to about 300 eV. The voltage that determines the energy of
the electron beam is used to drive the x input of an x-y recorder. The electron
beam collisionally excites same of the N2 molecules to various excited energy

34
levels including the A3 level. Some of the A3E molecules formed result
fram the direct electron excitation process and others result from the
excitation of high levels that produce A level molecules by cascading.
A dye laser beam is normally incident on the electron beam. The dye laser
beam is tuned so that the wavelength corresponds to a particular A3Z - B3 I
vibration rotation transition. The B3H level molecules thus formed radiate.
The B31 laser induced fluorescence is observed along an axis that is
perpendicular to both the electron bean and the laser beam. The electron
excitation cross section of the A3E level can be obtained fram measurements
of the laser-induced fluorescence frm the OI level.
We initially used a Spectra Physics broad band cw dye laser pumped by
a Spectra Physics 9W Argon ion laser for our experiments. The laser induced
fluorescence was analyzed using a Jobin-Yvon 1-m spectrometer and detected
using a photomultiplier. The laser beam is chopped at about 720 Hz. A
signal from the chopper serves as the reference for a lock-in amplifier. The
output of the photamultiplier serves as the input signal for the lock-in
amplifier. It can be shown that the lock-in amplifier signal is directly
proportional to the apparent cross section for the electron excitation of the
particular A vibration rotation level under study. The output of the lock-in
amplifier is used to drive the y-input of the x-y recorder. Thus the
apparent cross section for the electron excitation of the particular A3Z
vibration-rotation level under study is plotted as a function of the energy
on the x-y plotter. After passing through the vacmu chamber the dye laser
beam is incident on a N2 discharge. The N2 discharge was obtained using
an old He-Ne laser tube attached to a vacuum system. The He-Ne laser tube
is evacuated and then filled to a pressure of about 100 mTorr with N2. A
dc discharge is ignited using the electrodes of the He-Ne tube. hen the

3 35
dye laser wavelength corresponds to the wavelength for the absorption of one
of the A3 Z - B3 H transition then the i-v characteristic of the N2 discharge
is altered by the optogalvanic effect. An oscilloscope monitors the voltage
across the N2 discharge. Using the optogalvanic effect in this manner it is
possible to set the laser wavelength so that it corresponds to the wavelength
of the particular A + B transition under study. We have found that itis possible to observe hundreds of A - B3IT transitions using the optogalvanic
effect.
It was stated that it can be shown that the output of the lock-in
amplifier is directly prcportional to the apparent cross section for the
production of the particular A vibration-rotation level under study. In
order to show this important result it is necessary to carry out a rate
equation analysis. We denote the A vibration level under study by a.
The A , B3], absorption induced by the dye laser leads to a B3 [ vibration-
rotation level we denote by "b". The rate equations for levels "a" and "b"
are given by
Ina )Qa aa nI-!) Q - + nbba >a ab nA~a B abna + Bbapn ' lj>a j b'b 1
j b
and
- -eQ - bb n A BPna oap%.(2j>b - jD
where n is the ground level N2 density, J is the electron current density,
Qi is the direct electron excitation cross section for level i, Aa is the
reciprocal of the beam crossing time for the metastable A3Z level, Ab is
the reciprocal of the lifetime of the B31 level, Aij is the radiative decay
rate of level "i" into level "j", Bab is the Einstein coefficient for induced

36
absorption, Bba is the Einstein coefficient for induced emission, and is
the energy density in the laser beam. It is well known that the Einstein B
coefficients are related by B ah = Bba~gb/ga) where ga and gb are the
statistical weights of the levels "a" and I"" respectively. Note that Aa << Ab
since level 'W' is metastable whereas level 'b" can radiate. The steady state
solution to equations (1) and (2) is
2~QA
where a and are called the apparent cross sections and are given by
j>a ja j>b . The quantities Qja and Qjb arecalled optical cross section and are given by Qja - (g)njAja and
QJb (=%)n Ajb. The apparent cross section is the sum of the direct cross section
plus the sum of the optical cross sections so that e. includes direct production plus
cascading. The quantity y is given by y = BabP/ (Aa + BbaP). The subscript
"on!' indicates that the laser is on. When the laser is off then p - 0. The
(nJ) ( jk.value of nb when the laser is off is given by n = P Our
initial experiments employ a broadband cw dye laser with a bandwidth of
1.5 - 4 x 10¹⁰ Hz. The longitudinal mode separation is 4.20 x 10⁸Hz. Thus
there are 30-100 modes in the laser bandwidth. Not *41 the modes lase
simultaneously and in fact at a given time only one or a few modes may be
lasing. The modes that are lasing change in time so that a given mode
lases only part of the time. The Doppler width of a N2 A3E - B 3H transition
is about 1.0 x 10⁹ Hz which is much less than the bandwidth of the laser.
Even when the laser is timed so that a Doppler broadened A3E -, B 3n transition
is covered by the laser bandwidth the laser modes that interact with the
transition may not be lasing. When a laser mode that interacts with the

37
transition is lasing the intensity of the mode is high enough to saturate the
transition i.e. BabP >>Aa. Thus when a laser mode that interacts with the
transition is lasing then
where we have used the result Ab>> Aa.
The fluorescence signal when the laser is off or when the laser is lasing
but none of the lasing modes interacts with the transition is proportional
to nb-off. The fluorescence signal when a lasing mode interacts with the
transition is proportional to nbon. Thus the fluorescence signal when the laser
is on is
Son - 8n1%-on + (I - 8)nb-off
where 8 is a constant determined by the time average of the laser intensity,
and the fluorescence signal when the laser is off is
Soff •-off
The difference between Son and Soff is
on off' 6(b-on - A-off) e -Aa)
.1 AThus we have shown that as stated Son- So ff is directly proportional to Qa"
A measurement of S - S will yield the energy dependence of Q AOn en rg dep nd nc of An
absolute calibration of e_ must be made. For our previous measurements on
Ne we have calibrated the pure triplet cross sections by use of the fact
that the direct cross section for a triplet excitation falls to near zero
above about 6S eV and hence is equal to the cascade contribution at
higher energies. Thus by measuring the cascades absolutely the absolute

38
value of QAcan be obtained above 65 eV. For our measurements on N2 thisa 2will probably not be possible so we hope to use a laser intense enough to
3excite all the A E molecules and to calibrate the absolute cross section in
terms of the absolute value of the laser induced fluorescence.
- IWe have attempted to measure the value of apparent cross section of
3many different vibration rotation levels of the A E level. We have been
unable to detect any laser induced fluorescence no matter what the initial
* vibration rotation level of the A Z levels using a multimode laser. Because
the modes of a multimode laser do not necessarily lase all the time the
laser does not fully interact with the level under study. In order to
rectify this problem we have set up a single mode ring dye laser and have
attempted to measure the laser induced fluorescence using it. Again the
results were negative. Since we have previously observed very strong signals
from the laser induced fluorescence when studying the Ne metastable levels we
must ask "Why is no signal detected?" We believe that the reason we do
not detect a signal for N 2 is that there are so many vibration-rotation
3levels in the A Z level that the population due to any individual level is
too small to produce an observable laser-induced fluorescence signal.
One possible way to resolve this difficulty is to use a light source with
a bandwidth wide enough to pump all the rotational levels associated with
a given vibrational level of the A3E+ electronic level. A pulsed dye laseru
does not have well defined modes so all the rotation levels may interact
with the laser. A N 2 laser pumped dye laser can easily have enough power
to saturate all the N 2 molecules in all the rotational levels associated
with a given vibration level. Although we have not yet been successful in
measuring the electron excitation cross sections for the metastableA3E

139
level of the N2 molecule, we suggest that the scheme outlined above is
a premising method for molecular metastable levels. Once the fumdamental
cross sections are determined, it is possible to study the reactions that
occur in a pulsed N2 system. The processes include the production of the
A3h, B 3H, and C35 levels and the various quenching and excitation transfer
reactions that follow their production.

40
References
j 1. M. H. Phillips, L. W. Anderson, and C. C. Lini, Phys. Rev. A 23, 2751
(1981); M. H. Phillips, L. W. Anderson, C. C. Lini, and R. E. Mfiers, Phys.
Lett. 82A, 404 (1981).

41
DYE A O AE
LASER A O AE
X-Y RECORDERi I l,,, CHOPPR-- WER
CHOPER -vg *SUPPLY I
-' e-BFAM ]LOCK-IN" ", ;INAL AMPLIFIER
AmM "rE R HLOW
SOSCILLO- OOHOAO
SCOPE OO RO TO
JSUPPLYj
~FIG. 1. A schematic diagram of our apparatus.
42
Publications
The works reported in the following papers were partially supported by this
contract:
3 +"He2(d Eu) Decay Rate in a High-Pressure Helium Afterglow', Journal of
Chemical Physics 73, 6179 (1980).
"Collisional Quenching of He2 Molecules in the a E Level by Impurity Gases",
Journal of Chemical Physics 75, 1804 (1981).
°V