approval sheet - dtic.mil · approval sheet title of thesis: “development of the seasonal beliefs...
TRANSCRIPT
APPROVAL SHEET
Title of Thesis: “Development of the Seasonal Beliefs Questionnaire: A Measure
of Cognitions Specific to Seasonal Affective Disorder” Name of Candidate: Robert D. Lippy Master of Science Degree 2005
Thesis and Abstract Approved:
___________________________ ________________________ Kelly J. Rohan, Ph.D. Date Committee Member ___________________________ ________________________ Martha M. Faraday, Ph.D. Date Committee Member ___________________________ ________________________ Michael Feuerstein, Ph.D. Date Committee Member
i

Report Documentation Page Form ApprovedOMB No. 0704-0188
Public reporting burden for the collection of information is estimated to average 1 hour per response, including the time for reviewing instructions, searching existing data sources, gathering andmaintaining the data needed, and completing and reviewing the collection of information. Send comments regarding this burden estimate or any other aspect of this collection of information,including suggestions for reducing this burden, to Washington Headquarters Services, Directorate for Information Operations and Reports, 1215 Jefferson Davis Highway, Suite 1204, ArlingtonVA 22202-4302. Respondents should be aware that notwithstanding any other provision of law, no person shall be subject to a penalty for failing to comply with a collection of information if itdoes not display a currently valid OMB control number.
1. REPORT DATE 2005 2. REPORT TYPE
3. DATES COVERED 00-00-2005 to 00-00-2005
4. TITLE AND SUBTITLE Development of the Seasonal Beliefs Questionnaire: A Measure ofCognitions Specific to Seasonal Affective Disorder
5a. CONTRACT NUMBER
5b. GRANT NUMBER
5c. PROGRAM ELEMENT NUMBER
6. AUTHOR(S) 5d. PROJECT NUMBER
5e. TASK NUMBER
5f. WORK UNIT NUMBER
7. PERFORMING ORGANIZATION NAME(S) AND ADDRESS(ES) Uniformed Services University of the Health Sciences,F. Edward HebertSchool of Medicine,4301 Jones Bridge Road,Bethesda,MD,20814-4799
8. PERFORMING ORGANIZATIONREPORT NUMBER
9. SPONSORING/MONITORING AGENCY NAME(S) AND ADDRESS(ES) 10. SPONSOR/MONITOR’S ACRONYM(S)
11. SPONSOR/MONITOR’S REPORT NUMBER(S)
12. DISTRIBUTION/AVAILABILITY STATEMENT Approved for public release; distribution unlimited
13. SUPPLEMENTARY NOTES The original document contains color images.
14. ABSTRACT see report
15. SUBJECT TERMS
16. SECURITY CLASSIFICATION OF: 17. LIMITATION OF ABSTRACT
18. NUMBEROF PAGES
116
19a. NAME OFRESPONSIBLE PERSON
a. REPORT unclassified
b. ABSTRACT unclassified
c. THIS PAGE unclassified
Standard Form 298 (Rev. 8-98) Prescribed by ANSI Std Z39-18

COPYRIGHT STATEMENT
The author hereby certifies that the use of any copyrighted material in this thesis manuscript entitled:
“Development of the Seasonal Beliefs Questionnaire: A Measure of Cognitions Specific to Seasonal Affective Disorder”
beyond brief excerpts is with permission of the copyright owner, and will save and hold harmless the Uniformed Services University of the Health Sciences from any damage which may arise from such copyright violations. Robert D. Lippy Department of Medical and Clinical Psychology
Uniformed Services University of the Health Sciences
ii

ABSTRACT
Title of Thesis: Development of the Seasonal Beliefs Questionnaire: A Measure of
Cognitions Specific to Seasonal Affective Disorder
Robert D. Lippy, Master of Science, 2005
Thesis directed by: Kelly J. Rohan, Ph.D.
Assistant Professor
Department of Medical and Clinical Psychology
Rohan’s (2002) integrative, cognitive-behavioral model proposes that individuals with
seasonal affective disorder (SAD) experience frequent thoughts related to light
availability and the seasons. To-date, no measure exists to determine the existence and
extent of these hypothesized SAD-specific cognitions. This study developed a
preliminary 94-item self-report measure, the Seasonal Beliefs Questionnaire (SBQ),
which was administered with several depression, seasonality, and cognitive measures via
a secure website to 104 college students from two universities. Volunteers returned
approximately 2 weeks later and completed the SBQ again. The SBQ demonstrated high
internal consistency (Cronbach’s alpha = .98), high test-retest reliability (r = .93), good
convergent validity with other cognitive measures for SAD (rs = .57 - .84) and good
divergent validity (r = .27). Based on these promising preliminary psychometrics,
continued validation of the SBQ is warranted. Future studies with larger samples will
reduce the number of items and perform a confirmatory factor analysis.
iii

TITLE PAGE
DEVELOPMENT OF THE SEASONAL BELIEFS QUESTIONNAIRE:
A MEASURE OF COGNITIONS SPECIFIC TO SEASONAL AFFECTIVE
DISORDER
by
Robert D. Lippy
Thesis submitted to the Faculty of the
Medical and Clinical Psychology Graduate Program
Uniformed Services University of the Health Sciences
In partial fulfillment of the requirements for the degree of
Master of Science, 2005
iv

ACKNOWLEDGMENTS
A debt of gratitude and heartfelt thanks goes to Kelly Rohan, my advisor and
mentor. Thank you for your patience and steadfast guidance as I learned how to
successfully navigate the ever-complicated process of being a graduate student. I also am
indebted to those helpful and insightful people with whom I share a laboratory and who
have graciously given suggestions from a different perspective, helped me with analyses,
and provided lasting friendship: Kathryn Tierney Lindsey, Kathryn Roecklein, Leigh
Johnson, Crescent Seibert, Amy Nguyen, and Aisha Massac.
A sincere thank you to both my readers, Drs. Martha Faraday and Michael
Feuerstein who provided sound advice and wise counsel that contributed to the success of
my finished product. I would also like to thank my faculty sponsors, Dr. David Haaga at
American University and Dr. Laura Klein at Penn State University, for their assistance in
gaining access to student volunteers. I also could not have completed this project without
the patient instruction and feedback on the software program I used from Dr. Leon Moore
and Anthony Chen in the USUHS Department of Biomedical Informatics. And most of
all, a well-deserved thank you to my loving wife Angela, whose enduring support and
encouragement were with me every step of the way, and without whom I could not have
accomplished this writing.
v

TABLE OF CONTENTS
APPROVAL SHEET…………………………..……….……………………………………………………. i
COPYRIGHT STATEMENT……………………………………….………………………………………. ii
ABSTRACT……………….…………………………………………..……………………………………… iii
TITLE PAGE…..……………………..……………………………………………………………………… iv
ACKNOWLEDGEMENTS.……………………………..………………………………………………….. v
TABLE OF CONTENTS………………………………..…………..……………………………………… vi
LIST OF TABLES…………………………………………………………………………………………… ix
LIST OF FIGURES………………………………………………………………………………………….. x
INTRODUCTION…………………………………………………………………………………………… 1
SEASONAL AFFECTIVE DISORDER (SAD): CLINICAL FEATURES AND EPIDEMIOLOGY…. 2
SAD ETIOLOGY…………………………….………………….………………………………………. 3
BIOLOGICAL MECHANISMS…………………………………………………………………..…. 3
PSYCHOLOGICAL MECHANISMS……………………………………………………………….. 4
DUAL VULNERABILITY……………………………………………………………………….. 4
INTEGRATIVE, COGNITIVE-BEHAVIORAL MODEL……………………………………….. 6
BECK’S COGNITIVE MODEL………………………………..……………………………………….. 8
RESPONSE STYLES THEORY………………………………………………………………………… 9
EVIDENCE FOR A COGNITIVE CONTRIBUTION TO SAD……………………..…………………. 11
TREATMENTS FOR SAD………………………………………………………………………..….…. 13
LIGHT THERAPY……………………………………………………………………………………. 13
COGNITIVE-BEHAVIORAL THERAPY (CBT)…………………………………………………… 15
COGNTIVE MEASURES FOR DEPRESSION…………………………………………………..…….. 20
DYSFUNCTIONAL ATTITUDES SCALE (DAS)………………………………………………….. 20
AUTOMATIC THOUGHTS QUESTIONNAIRE (ATQ)…………………………………………… 21
YOUNG SCHEMA QUESTIONNAIRE (YSQ)……………………………………………………... 23
MEASUREMENT OF SAD-SPECIFIC COGNITIONS………………………………………..………. 24
SEASONAL ATTITUDES SCALE (SAS)…………………………………………………………… 25
vi

SEASONAL AUTOMATIC THOUGHTS SURVEY (SATS)………………………………………. 26
STUDY PURPOSE …………………………………………………………………………………..……… 27
HYPOTHESES…………………..…………………………………………………………………..……… 29
HYPOTHESIS ONE: VALIDITY………………………………………………………………………. 29
HYPOTHESIS TWO: RELIABILITY…………………………………………………………………… 30
METHOD……………………………………………………………………………………………..……... 31
PHASE ONE: ITEM DEVELOPMENT………………………………………………………………… 31
PHASE TWO: DESCRIPTIVE FEEDBACK FROM SAD PARTICIPANTS…………………………. 32
PHASE THREE: ADMINISTRATION TO A LARGE SAMPLE………………………………..…… 34
PROCEDURE………………………………………………………………………………………… 34
MEASURES…………………………………………………………………………………………... 36
CENTER FOR EPIDEMIOLOGICAL STUDIES – DEPRESSION SCALE (CES-D)………….. 36
STRUCTURED INTERVIEW GUIDE FOR THE HAMILTON RATING SCALE FOR
DEPRESSION - SEASONAL AFFECTIVE DISORDER VERSION – SELF REPORT (SIGH-
SAD-SR)…………………………………………………………………………………………. 37
SEASONAL PATTERN ASSESSMENT QUESTIONNAIRE (SPAQ)………………………….. 37
CURRENT BEHAVIORS SCALE (CBS)………………………………………………………… 38
PARTICIPANT SAFEGUARDS…………………………………………………………………….. 38
RESULTS…………………………..………………………………………………………………..……….. 41
PARTICIPANT DEMOGRAPHICS, DEPRESSION SEVERITY, AND SEASONALITY…………… 41
HYPOTHESIS ONE: VALIDITY………………………………………………………………………. 43
HYPOTHESIS TWO: RELIABILITY…………………………………………………………………. 44
DISCUSSION………………………………………………………………………………………..……… 45
LIST OF APPENDICES…………………………………………………………………………….……… 62
APPENDIX A. SPECTRUM OF DISEASE MODEL FOR SAD……….……………..….…………… 63
APPENDIX B. INTEGRATIVE, COGNITIVE-BEHAVIORAL MODEL………………………….… 64
APPENDIX C. DYSFUNCTIONAL ATTITUDES SCALE (DAS)……………….……..………….… 65
APPENDIX D. AUTOMATIC THOUGHTS QUESTIONNAIRE (ATQ)……………………..……… 68
vii

APPENDIX E. YOUNG SCHEMA QUESTIONNAIRE (YSQ)………………….……….………….. 70
APPENDIX F. SEASONAL ATTITUDES SCALE (SAS)…..………………………………….….…. 73
APPENDIX G. SEASONAL AUTOMATIC THOUGHTS SURVEY (SATS)……………….…….… 75
APPENDIX H. SEASONAL BELIEFS QUESTIONNAIRE (SBQ)………………………………….. 77
APPENDIX I. SBQ FEEDBACK FORM……………………………………………..……….………. 81
APPENDIX J. CENTER FOR EPIDEMIOLOGICAL STUDIES – DEPRESSION SCALE (CES-D)... 82
APPENDIX K. STUCTURED INTERVIEW GUIDE FOR THE HAMILTON RATING SCALE FOR
DEPRESSION – SEASONAL AFFECTIVE DISORDER VERSION – SELF
REPORT (SIGH-SAD-SR)…………………………………………………………. 83
APPENDIX L. SEASONAL PATTERN ASSESSMENT QUESTIONNAIRE (SPAQ)………………. 91
APPENDIX M. CURRENT BEHAVIORS SCALE (CBS)……………………………..……..…..…… 94
REFERENCES…………………………………………………..…………………..……………………… 95
viii

LIST OF TABLES TABLE 1 PARTICIPANT DEMOGRAPHICS, DEPRESSION SEVERITY, AND SEASONALITY …… 58
TABLE 2 PEARSON’S CORRELATIONS BETWEEN SBQ AND SEASONAL MEASURES…..……… 59
TABLE 3 PEARSON’S CORRELATIONS BETWEEN SBQ AND NON-SEASONAL MEASURES…… 60
ix

LIST OF FIGURES
FIGURE 1 SBQ SCORE DISTRIBUTIONS………………..…………..……………..…………… 61
x
Introduction
Over the last decade, increasing evidence suggests a cognitive component in
seasonal affective disorder (SAD). Specifically, cognitive constructs associated with
nonseasonal major depressive disorder (MDD) also are operative in SAD, including
negative automatic thoughts (Hodges & Marks, 1998, Rohan, Sigmon, & Dorhofer,
2003), dysfunctional attitudes (Hodges & Marks, 1998), negative attributional style
(Levitan et al., 1998), and rumination (Rohan et al., 2003, Young & Azam, 2003).
Rohan’s (2002) integrative cognitive-behavioral model further proposes a role for SAD-
specific cognitions related to light availability and the seasons. The purpose of the
present study was to develop an instrument to measure SAD-specific cognitions: the
Seasonal Beliefs Questionnaire (SBQ).
The remainder of the Introduction provides background material on seasonal
affective disorder (SAD). This review includes the clinical features and epidemiology of
SAD and a review of current biological and psychological etiological hypotheses.
Information on two important cognitive theories of depression, Beck’s cognitive model
and Nolen-Hoeksema’s response styles theory also is reviewed. Biological (e.g., light
therapy) and psychological (e.g., cognitive-behavioral therapy) treatments for SAD are
then discussed. Cognitive measures that were developed for nonseasonal MDD and
preliminary cognitive measures for SAD are summarized. Overall, this review makes
clear the need to develop SAD-specific cognitive measures that target thoughts related to
light availability and the seasons.
1

Seasonal Affective Disorder (SAD): Clinical Features and Epidemiology
During the past two decades research focusing on seasonal affective disorder
(SAD), a pattern of Major Depressive Episodes (MDEs) that recur in the fall and winter
and remit in the spring (Rosenthal et al., 1984) has increased substantially. In the
Diagnostic and Statistical Manual of Mental Disorders (4th ed., DSM-IV; American
Psychiatric Association, 1994), SAD is classified as a Seasonal Pattern Specifier for
recurrent Major Depressive Episodes in Major Depressive Disorder, Bipolar I, or Bipolar
II. This specifier is warranted when the MDEs characteristically begin at a certain time
of year and completely remit (or change to mania or hypomania) at a specific time of the
year over at least the past 2 years (APA, 1994). The most common seasonal pattern is
fall/winter onset and spring/summer remission of depression, although a summer-type
SAD also has been reported (Wehr, Sack, & Rosenthal, 1987). Symptoms common in
both SAD and nonseasonal depression include depressed mood and difficulty
concentrating. In contrast to the melancholic or typical symptoms more commonly
associated with nonseasonal depression, SAD is often accompanied by reverse vegetative
or atypical depressive symptoms such as anergia, hypersomnia, weight gain, and
carbohydrate craving (Kasper et al., 1989a; Rosenthal et al., 1984).
Major Depressive Disorder (MDD) has long been a significant public health issue
affecting a substantial portion of the U.S. general population (Kessler, 2002). The World
Health Organization ranked depression as the world’s most burdensome disease in
middle-adulthood because of its substantial prevalence, chronicity, and associated
disability (Murray & Lopez, 1996). Lifetime prevalence rates for MDD range from 10 to
25% for women and from 5 to 12% for men (APA, 1994). Within the recurrent
2

depressed population, 10-20% of all cases follow a seasonal onset pattern (Magnusson,
2000). Studies have estimated that 4-9% of the U.S. population has SAD (Booker &
Hellekson, 1992; Kasper, Wehr, Bartko, Gaist, & Rosenthal, 1989b; Rosen et al., 1990).
In Europe, studies generally have found lower rates, ranging from 1 to 2.5% (Magnusson,
2000; Mersh, Middendorp, Bouhuys, Beersma, & Van den Hoofdakker, 1999).
Atypical depressive symptoms (i.e., low energy, overeating, weight gain, and
hypersomnia) that co-occur with the fall and winter seasons are normally distributed in
the general population. Thus, it appears that seasonal fluctuations in mood, energy, and
behavior -- or “seasonality” -- is a continuum, with individuals with full-blown SAD at
one end and individuals with no seasonal variations at the other end. In between these
extremes are individuals who experience mild to moderate seasonal symptoms that are
less severe than in SAD. This condition has been defined as subsyndromal SAD (S-
SAD; Kasper et al., 1989a). Similar to the relationship between Minor Depression and
Major Depression, S-SAD is characterized by mild to moderate atypical depressive
symptoms (i.e., anergia, hypersomnia, and hyperphagia), coinciding with fall and/or
winter (Kasper et al., 1989a). S-SAD has a higher prevalence rate (approximately
13.5%) than full-blown SAD (approximately 7%; Kasper et al., 1989b), indicating that
SAD and S-SAD together affect a substantial number of people.
SAD Etiology
Biological Mechanisms
Etiological models of SAD have focused almost exclusively on biological factors.
Early studies indicated that SAD symptoms improved with exposure to bright light (i.e.,
light therapy; Lewy, Kern, Rosenthal, & Wehr, 1982; Rosenthal et al., 1984). Numerous
3

biological mechanisms have been proposed to link low light availability in winter to SAD
onset, including phase-delayed circadian rhythms, insufficient light entering the retina, an
abnormal response to increased melatonin production, and reduction of serotonergic
activity (Lee, Blashko, Janzen, Paterson, & Chan, 1997; Magnusson & Boivin, 2003).
However, as a whole, support for these biological mechanisms in SAD has been mixed
(Dalgleish et al., 1996; Magnusson & Boivin, 2003; Rosenthal & Wehr, 1992; Tam, Lam,
& Levitt, 1995).
Psychological Mechanisms
Dual Vulnerability. Although the majority of research has focused on the
biological etiology of SAD, recent work has proposed a role for psychological factors,
which may maintain or exacerbate SAD symptoms (e.g., Azam and Young, 1998;
Hodges and Marks, 1998; Rohan et al., 2003). Young’s dual vulnerability hypothesis
(1991, 1999) represented the first attempt at a theoretical integration of physiological and
psychological mechanisms underlying SAD. Young’s model proposes two separate
vulnerabilities among individuals who experience SAD symptoms: (1) a physiological
vulnerability to experience the “core” SAD symptoms (i.e., fatigue, hypersomnia, and
increased weight/appetite) during fall and winter, and (2) a psychological vulnerability to
develop the “secondary” cognitive, affective, and behavioral symptoms of depression
(e.g., difficulty concentrating, loss of interest, depressed mood, social withdrawal) in
reaction to the core vegetative symptoms. Young based his hypothesis on a retrospective
study in which SAD participants reported onset of fatigue, hypersomnia, and increased
appetite prior to developing the cognitive and affective symptoms (Young et al., 1991).
Young et al. (1991) hypothesized that the temporal difference in symptom onset
4

suggested different underlying mechanisms for these symptom clusters. According to
Young et al. (1991), the clinical manifestation of SAD occurs when individuals prone to
substantial physiological seasonal changes also develop the cognitive and affective
symptoms, which are similar to symptoms of nonseasonal depression, in reaction to the
“primary” physiological symptoms. Based on this formulation, Young et al. (1991) were
some of the first to suggest psychotherapy as a possible treatment for the cognitive and
affective symptoms of SAD.
Despite the promise of Young’s dual vulnerability hypothesis, very little research
has been conducted to test or to expand upon the model. Lam, Tam, Yatham, Shiah, and
Zis (2001) used Young’s concept of a dual vulnerability in SAD to develop a spectrum of
disease model (Appendix A). The model was designed to explain the heterogeneity of
symptoms in winter depression and illustrates a need to go beyond the DSM-IV
categorical diagnosis of SAD to include qualitatively different types of winter depression.
Lam et al. (2001) proposed that different loadings on a “depression vulnerability factor”
and a “seasonality vulnerability factor” lead to SAD, S-SAD, SAD with incomplete
summer remission (ISR), or nonseasonal depression. Lam and colleagues’ (2001)
model proposes that S-SAD results from a primary loading on the seasonality factor and a
minimal loading on the depression factor. “Pure” nonseasonal depression is at the other
extreme with a primary loading on the depression factor and a minimal seasonality
loading. In between these two extremes, individuals with intermediate loadings on
seasonality and depression factors fall (i.e., SAD if seasonality > depression and SAD
with ISR if depression > seasonality). Lam et al.’s (2001) model conceptualized a
spectrum of disease between SAD and depression with the “dual” vulnerabilities being a
5

vulnerability to seasonality and a vulnerability to depression. Therefore, this model did
not maintain a dual focus on physiological and psychological factors as in Young’s
model.
Integrative, Cognitive-Behavioral Model. Although Young’s dual vulnerability
model (1991, 1999) proposed a possible psychological vulnerability in the etiology of
SAD, Rohan (2002) added depth and breadth to the model by proposing a specific
content for the psychological vulnerability. In particular, the integrative, cognitive-
behavioral model (Appendix B) proposes that the psychological vulnerability
incorporates components of Beck’s (1967, 1976) cognitive model of depression
(maladaptive schemas, attitudes, and automatic thoughts), rumination (Nolen-Hoeksema,
1987), and behavioral withdrawal from positive reinforcement (Lewinsohn, 1974).
Regarding the cognitive component, Rohan’s (2002) model assumes that individuals with
SAD experience some of the same negative, self-defeating thoughts characteristic of
nonseasonal depression, but also have SAD-specific cognitions related to light
availability and the winter season.
Based on clinical experience with SAD participants, Rohan and colleagues
hypothesized that SAD is characterized not only by negative cognitions common in
depression, but also by automatic negative thoughts and core beliefs about the winter
season, light availability, and the changing environment. For example, in the fall,
individuals with SAD may focus attention on leaves changing color or daylength getting
shorter, which could lead to negative automatic thoughts such as “My mood falls with the
leaves” and “I dread the days getting shorter.”
6

Similar to Young’s dual vulnerability hypothesis, Rohan’s (2002) integrative,
cognitive-behavioral model encompasses both a physiological and a psychological
vulnerability to SAD. Contrary to Young’s (1991, 1999) model, Rohan’s (2002) model
posits that SAD episode onset may begin through activation of either vulnerability, which
may subsequently activate the other vulnerability in an interactive, reverberating circuit.
Rohan’s model suggests that a negative appraisal of environmental cues (e.g., leaves
changing color, daylength growing shorter) or perhaps an expectation for the onset of
SAD symptoms with the arrival of winter triggers activation of the psychological
vulnerability and the onset of SAD symptoms. Alternatively, SAD symptoms may
initially occur when environmental changes (e.g., reduced photoperiod) activate the
physiological vulnerability, which, in turn, activates the psychological vulnerability. The
integrative, cognitive-behavioral model, unlike the dual vulnerability model, does not
associate specific SAD symptoms with either the psychological or the biological
vulnerability.
Thus, newer models of SAD etiology have extended traditional biological models
by integrating a role for psychological factors in SAD. Such models have expanded from
Young’s dual vulnerability model to Rohan’s more content-specific integrative,
cognitive-behavioral model. Evidence for a psychological component in SAD is
reviewed below. However, a review of the psychological theories of nonseasonal
depression on which these studies are based is necessary first. Two cognitive models are
particularly relevant, Beck’s model (1967, 1976) and Nolen-Hoeksema’s response styles
theory (1991).
7

Beck’s Cognitive Model
According to Beck’s (1967, 1976), cognitive model, there are various levels of
cognitive processes. The highest level (i.e., farthest from consciousness) is comprised of
schemas -- relatively enduring, internal structures of stored features of stimuli, ideas, or
experience -- that are used to organize new information in a meaningful way, thereby
determining how phenomena are perceived and conceptualized (Beck, 1967). Schemas
are learned during early childhood and represent the predominant “core” beliefs an
individual holds about the self, world, and future (Beck, 1967; Beck, Rush, Shaw &
Emery, 1979). Individuals tend to interpret events through the “lens” of the broadest type
of schemas, called core beliefs. Core beliefs are both global and stable and can be either
positive or negative, depending on current mood. In depression, the negatively-oriented
core beliefs that tend to be more rigid, absolute, and impermeable are operative (Beck,
1967). The cognitive triad, negative core beliefs about self, world, and future, is apparent
in the schematic content of individuals with depression (Beck et al., 1979). Common
core beliefs for depression-prone individuals include: “I am a failure,” “I am worthless,”
and “I am unlovable” (J. Beck, 1995).
Core beliefs influence expression of a second, intermediate level of cognition,
which consists of attitudes, rules, and assumptions (J. Beck, 1995). Attitudes and rules
are often unarticulated. However, similar to core beliefs, over time they can be identified
through inference, with effort, and with the assistance of a cognitive therapist (J. Beck,
1995). These intermediate beliefs also influence how an individual thinks, feels, and
behaves by acting like a filter through which information about the self, the world, and
the future is processed. Examples of attitudes and beliefs that are common in depression
8

(i.e., dysfunctional attitudes) include: “If I do not do as well as other people, it means I
am an inferior person,” “If I fail partly, it is as bad as being a complete failure,” and
“Being isolated from others is bound to lead to unhappiness” (Weissman & Beck, 1978).
A third level of cognitive processing involves automatic thoughts, which are the
most accessible, conscious cognitions according to Beck’s model (1967, 1976).
Automatic thoughts are spontaneous, mental reactions to specific events and, if negative,
can drive a negative emotional state (Beck, 1967, 1976). Automatic thoughts can be
qualified as: (a) effortless, involuntary, or unintentional; (b) generally outside conscious
awareness, but may become accessible to consciousness; (c) relatively quick to reach
consciousness and difficult to stop or regulate; (d) consuming minimal attentional or
processing capacity; (e) relying on a parallel-type processing; (f) stereotypic, involving
familiar and highly practiced tasks; and (g) utilizing low levels of cognitive processing
with minimal analysis (Beck, 1976). The content of automatic thoughts is a product of
the specific underlying schemas that are activated at the time. Similar to schemas,
automatic thoughts can be either negative or positive; however, according to Beck’s
cognitive model, a preponderance of negative automatic thoughts is associated with
depression.
Response Styles Theory
The basis of Nolen-Hoeksema’s response styles theory of depression (1991) is
that individuals have a consistent style of responding to a depressed mood, either with
rumination or distraction, and that these responses affect the subsequent course and
severity of the depressed mood. Ruminative responses refer to activities that repetitively
focus an individual’s attention on his/her depressed mood and its implications (Nolen-
9

Hoeksema, 1991). In contrast, distractive responses involve generally pleasant or neutral
activities aimed at diverting attention away from depressed mood.
Rumination contributes to exacerbation and/or increased duration of depressed
mood in a laboratory setting following a negative mood induction (Nolen-Hoeksema,
Morrow, & Frederickson, 1993). A ruminative response style represents a “trait-like”
pattern, which has been found to increase an individual’s likelihood of developing a
subsequent full-blown Major Depressive Episode (Just & Alloy, 1997). Rumination
among dysphoric individuals can also contribute to negatively-biased self-referent
information processing (i.e., negative automatic thoughts and dysfunctional attitudes) as
hypothesized in Beck’s cognitive model of depression (Lyubomirsky, Caldwell, &
Nolen-Hoeksema, 1998).
Nolen-Hoeksema and colleagues (1993) outlined three possible mechanisms by
which rumination may contribute to increased intensity, duration, and range of depressive
symptoms: (1) through the biasing effect of mood state on information-processing (e.g.,
causing recall of negative memories and pessimistic inferences; Blaney, 1986; Bower,
1981), (2) by interfering with attention, concentration, and the maintenance of simple
instrumental behaviors (e.g., Musson & Alloy, 1988; Strack, Blaney, Ganellen, & Coyne,
1985), or (3) by interfering with more complex, effective problem-solving (e.g., Morrow,
1990). Alternatively, individuals with a predominantly distractive response style may
actually derive some degree of protection from intensified, prolonged depressed mood
(Nolen-Hoeksema et al., 1993).
10

Evidence for a Cognitive Contribution to SAD
With the emergence of combined physiological/psychological models of SAD,
support for cognitive factors in SAD is burgeoning. Hodges and Marks (1998) were
some of the first researchers to explore possible cognitive factors in SAD. In an
application of Beck’s model, they compared individuals with SAD, individuals with
nonseasonal depression, and nondepressed controls on automatic thoughts and
dysfunctional attitudes. Relative to the nondepressed control group, the SAD and
nonseasonal depression groups reported more frequent negative automatic thoughts and
dysfunctional attitudes; however, SAD and nonseasonal depression participants did not
differ from each other on these cognitive measures.
Ironically, additional support for cognitive factors in SAD was provided by a
study conducted with the intent to show that cognitions play a much lesser role than
biological changes in the pathophsyiology of SAD (Levitan, Rector, & Bagby, 1998).
Contrary to Levitan and colleagues’ (1998) expectations, individuals with SAD
evidenced a similar negative attributional style (i.e., a tendency to attribute negative
events to global and stable factors) as compared to individuals with nonseasonal
depression. These two studies provided preliminary evidence that, when depressed,
individuals with SAD experience some of the same negative cognitions (i.e., automatic
thoughts, dysfunctional attitudes, and attributional styles) that individuals with
nonseasonal depression experience (Hodges & Marks, 1998; Levitan et al., 1998). Thus,
there appears to be overlap in the negative cognitive styles that characterize SAD and
nonseasonal depression.
11

Because these studies were cross-sectional in nature, longitudinal studies were
needed to assess the pattern of negative thinking across the seasons in SAD. Rohan,
Sigmon, and Dorhofer (2003) conducted a prospective, longitudinal comparison of
women with a history of SAD and nondepressed female controls to determine how
cognitive-behavioral factors associated with nonseasonal depression (e.g., negative
automatic thoughts and dysfunctional attitudes) change across fall, winter, and summer in
SAD. Women with a SAD history consistently experienced more negative automatic
thoughts relative to controls, regardless of the season (i.e., fall, winter, or summer), with
their highest level of negative automatic thoughts occurring in the winter. Rohan and
colleagues (2003) also found that SAD history women did not differ from controls in
dysfunctional attitudes overall, but experienced greater levels of dysfunctional attitudes
in the fall as compared to the summer. In addition, Rohan et al. (2003) found that women
with a SAD history endorsed greater rumination frequency than nondepressed controls,
and rumination frequency in the fall predicted the intensity of SAD-related symptoms
during the subsequent winter, above and beyond fall depressive symptoms. It is possible
that the fall peak in dysfunctional attitudes interacted with rumination and/or stress to
contribute to more frequent negative automatic thoughts in the winter among SAD
history women.
In an analog study, Rohan, Sigmon, Dorhofer, and Boulard (2004) conducted a
longitudinal comparison of college women with subsyndromal SAD (S-SAD) and a
group of nondepressed female controls to determine whether cognitive correlates of SAD
generalize to individuals with S-SAD. Women with S-SAD demonstrated more frequent
negative automatic thoughts during the winter and nonwinter months than controls, but
12

reported the most frequent automatic negative thoughts in the winter. This pattern of
findings is a replication of Rohan et al.’s (2003) study of SAD participants in a S-SAD
sample. It is noteworthy that both women with a SAD history and women with S-SAD
reported more frequent negative automatic thoughts than nondepressed controls across
the seasons, even when their depressive symptoms had remitted.
In another extension of response styles theory to SAD, Young and Azam (2003)
had SAD participants keep daily records of specific ruminative and distractive coping
strategies. Consistent with Rohan et al. (2003), results revealed that frequency of
ruminative responses measured in the fall significantly predicted subsequent winter
depression severity, after controlling for fall depression levels. However, after
controlling for fall depression, frequency of distracting responses in the fall did not
predict winter depression severity. Young and Azam’s (2003) findings, in combination
with Rohan et al. (2003), suggest that frequent rumination may represent a cognitive
vulnerability for SAD symptom onset.
Taken together, the results of the studies performed by Hodges and Marks (1998),
Levitan et al. (1998), Rohan et al. (2004), and Young and Azam (2003) provide
preliminary evidence that cognitive factors play a role in the development and/or
maintenance of SAD. At a minimum, cognitive factors including negative automatic
thoughts, dysfunctional attitudes, negative attributional style, and rumination appear to be
correlates of both seasonal and nonseasonal depression.
Treatments for SAD
Light Therapy
13

To date, the “gold standard” for SAD treatment involves direct exposure to bright
artificial light (i.e., light therapy), a treatment based on the proposed biological
mechanisms for SAD. The most common type of light therapy involves daily exposure
to a metal box containing fluorescent lamps producing between 2,500 and 10,000 luminal
intensity (lux) for approximately 20-120 minutes during the symptomatic months.
Therefore, light therapy requires a considerable daily time commitment for an individual
with SAD.
The effectiveness of light therapy for SAD has been demonstrated in various
studies and reviewed extensively (e.g., Lee et al., 1997; Tam et al., 1995; Terman et al.,
1989). In a quantitative synthesis of the literature, Terman et al. (1989) conducted a
pooled analysis from 14 research centers involving 332 light therapy participants over 5
years. Results revealed that 47% of individuals with SAD did not experience remission
with light therapy (Terman et al., 1989). Only 43% of participants experiencing
moderate to severe SAD symptoms remitted with light therapy (Terman et al., 1989).
Therefore, roughly half of SAD patients do not remit with light therapy, especially those
experiencing more severe symptoms.
In addition, other concerns have been raised with light therapy, including residual
symptoms and poor compliance. Postolache et al. (1998) found that residual depressive
symptoms are common with light therapy in that the degree of observed improvement
with light therapy was less complete than spontaneous remission status during the
subsequent summer. In addition, the majority of SAD participants who enroll in light
therapy trials (59%) discontinue light use after the research protocol for cited reasons of
“ineffectiveness” and “inconvenience” of the treatment regimen (Schwartz, Brown,
14

Wehr, & Rosenthal, 1996). Of those who continued long-term light therapy, Schwartz et
al. (1996) found that 38% of participants with “pure” SAD and 88% of participants with
“complicated” SAD experienced a breakthrough Major Depressive Disorder, despite
regular light use. Given the remission rates, the persistence of residual symptoms,
noncompliance with light use, and the recurrent nature of SAD, there is a clear need to
find efficacious supplements or alternatives to light therapy.
Cognitive-Behavioral Therapy (CBT)
Because of the problems associated with light therapy and based on preliminary
support that negative cognitions are operative in SAD, cognitive-behavioral therapy
(CBT) appears to be a plausible complementary and/or alternative treatment for SAD. In
particular, CBT may be an option for treating individuals with SAD who are refractory to
light therapy. The presence of negative automatic thoughts, dysfunctional attitudes, and
rumination in SAD provide a viable, cognitive target for intervention via CBT.
Based on Beck’s (1967, 1976) cognitive model, CBT for depression is a
structured, short-term, present-oriented psychotherapy. CBT is directed toward problem-
solving and modifying dysfunctional thinking and behavior (Beck, 1967). A fundamental
premise of Beck’s model is that distorted or dysfunctional thinking is associated with
depressed mood and maladaptive behavior. Therefore, CBT works to produce enduring
improvements in mood and behavior through modification of an individual’s underlying
dysfunctional beliefs (J. Beck, 1995). Utilizing a variety of techniques such as cognitive
restructuring (i.e., identifying negative cognitions, challenging their validity through
Socratic questioning, and eliciting alternative rationale responses), and behavioral
15

activation (i.e., structuring and scheduling pleasant activities), therapists collaborate with
patients to change their thinking, mood, and behavior.
CBT has been used for decades as a highly efficacious treatment for nonseasonal
depression. Several studies have shown that CBT is an effective treatment for
nonseasonal depression when compared to various control groups and other treatment
modalities. In one of the first meta-analytic studies on CBT use for depression, Dobson
(1989) compared participants across 28 randomized clinical studies that compared CBT
to wait list, no treatment, various psychotherapies, pharmacotherapy, and behavior
therapy. Results revealed that CBT evidenced the greatest change in depression severity;
CBT participants had, on average, outcomes superior to 98% of no-treatment or wait-list
controls, 67% of behavior therapy participants, 70% of pharmacotherapy participants,
and 70% of other therapy participants. In a more recent meta-analysis of 48 high-quality
controlled trials, Gloaguen, Cottraux, Cucherat, and Blackburn (1998) demonstrated clear
superiority for CBT relative to other psychotherapies, antidepressant therapy, and wait-
list conditions (effect size comparisons with CBT: -0.24, -.0.38, and -0.82, respectively,
all significant at p = 0.01). In both of these meta-analyses, the magnitude of the
difference between CBT and the other treatment modalities is noteworthy.
Furthermore, studies have shown that CBT reduces the risk of relapse in
nonseasonal depression compared to other forms of treatment (Blackburn et al., 1986;
Paykel et al., 1999; Simons et al., 1986) up to 6 years post-treatment (Fava et al., 2004).
With regard to this “treatment durability,” Gloaguen et al.’s (1998) meta-analysis found
that 60% of individuals treated with pharmacotherapy relapsed at 1-year followup
compared to only 29.5% of individuals treated with CBT. CBT’s lasting effects have
16

been attributed to active, ongoing use of skills learned in CBT to alleviate residual and
subsequent depressive symptoms, although studies have not directly tested this
assumption (Gloaguen et al., 1998). Given the long-term shortcomings of light treatment
for SAD (i.e., high relapse rates resulting from noncompliance with regular light use) and
the recurrent nature of SAD, the prophylactic effects of CBT further bolster the rationale
for using CBT in the treatment of SAD. Collectively, these results support the clinical
effectiveness of CBT for treating acute, nonseasonal depression as well as durability for
CBT’s effects beyond the conclusion of treatment.
Despite overwhelming support for CBT’s efficacy in treating nonseasonal
depression, studies are just beginning to extend CBT to the treatment of SAD. One small
preliminary study found that both group cognitive therapy and group behavioral therapy
significantly improved SAD symptoms relative to a wait-list control (Sigmon et al.,
2000). More recently, another research group has begun to test the efficacy of a full CBT
protocol (i.e., restructuring negative cognitions and behavioral activation). In a pilot
study, Rohan, Tierney Lindsey, Roecklein, and Lacy (2004) designed a novel, SAD-
tailored, CBT protocol and tested it against, and in combination with, light therapy.
Specifically, these researchers compared their group-based CBT, light therapy (LT), and
the combination of group CBT and light therapy (CBT+LT) for SAD over a 6-week
randomized clinical trial.
Throughout the treatment phase, CBT participants received 12 twice-weekly
sessions of CBT in small groups of participants based on a manual (Rohan, 2000). The
SAD-tailored CBT protocol promoted the use of more adaptive coping strategies during
the winter season. For example, the CBT protocol included the behavioral activation and
17

cognitive restructuring components typical of CBT, but added a role for environmental
cues in the onset of symptoms and the maintenance of depressive behaviors. Consistent
with the integrative, cognitive-behavioral model (Rohan, 2002), some cognitive
restructuring sought to identify and challenge SAD-specific automatic negative thoughts
as proposed in Rohan’s (2002). In addition, to increase prophylactic benefits,
participants learned to identify SAD symptoms, particularly those that occur at the
beginning of an episode, and to design a personalized relapse-prevention plan for
implementation next fall/winter. During the treatment phase of this study, light therapy
was self-administered via a standard light box to participants in two daily 45-minute
doses of 10,000-lux light, once in the morning (between 6:00 and 9:00 am) and once in
the evening (between 6:00 and 9:00 pm). CBT+LT participants received all elements of
both the CBT and LT protocols.
Results demonstrated statistically significant pre- to post-treatment symptom
reductions in all three treatment groups on two separate outcome measures with no
significant differences between the treatments. At the 1-year naturalistic followup of the
sample during the subsequent winter, relapse rates (i.e., the return of SAD symptoms
severe enough to qualify for a full-blown recurrence) were determined. Remarkably, the
CBT and CBT+LT groups had no episode recurrences (both groups 0%), whereas LT
alone had a recurrence rate of 63%. In addition, CBT- and CBT + LT-treated participants
reported significantly fewer severe depressive symptoms than participants treated with
LT alone at the 1-year followup. Inspection of the trends in symptom severity from pre-
to post-treatment to 1-year followup on both outcome measures suggested that
individuals in the CBT and CBT+LT groups sustained their acute treatment gains at the
18

1-year followup, whereas LT participants did not. These findings are consistent with the
observed treatment durability for CBT in the nonseasonal depression literature.
Based on these preliminary findings, Rohan et al. (2005) initiated a randomized
clinical trial comparing their CBT, LT, and CBT+LT to a minimal contact/delayed
treatment control group (MCDT). This was a larger study than the feasibility study
whereby 61 participants were randomized to treatment over the 3-year study (N = 54
completers). As hypothesized, results revealed that all three active treatments (CBT
alone, LT alone, and CBT+LT) improved symptoms across a 6-week trial relative to the
minimal contact/delayed treatment control group on both patient- and blind interviewer-
rated measures of depression severity. More importantly, the CBT + LT group (79%)
demonstrated a statistically superior remission rate to the MCDT group (23%) at post-
treatment, whereas CBT (46%) and LT (57%) did not differ significantly from MCDT.
The overall pattern of results was replicated in intent-to-treat analyses using all
randomized participants. This study provides further support for the efficacy of CBT in
the treatment of individuals with SAD.
To assess whether the efficacy of the CBT for SAD protocol may have resulted
from changing cognitions, Tierney Lindsey (2003) assessed the changes in cognitive
constructs (i.e., automatic thoughts, dysfunctional attitudes, and rumination) for the three
active treatment modalities (CBT, CBT+LT, and LT) across the 6-week trial. This
analysis pooled data from the feasibility study with data from the first 2 years of the
controlled trial, available at the time. Results showed that, regardless of treatment
modality, SAD participants’ negative automatic thoughts and dysfunctional attitudes
significantly improved across treatment, and rumination descriptively, but not
19

significantly, improved. One possible rationale for the lack of CBT’s specificity with
regard to improving cognitions was the use of measurement instruments designed for and
normed on nonseasonal depression samples. These nonsignificant results may indicate
that dysfunctional attitudes and negative automatic thoughts as measured by the two
instruments in Tierney Lindsey’s (2003) mechanistic study (i.e., the Automatic Thoughts
Questionnaire and Dysfunctional Attitudes Scale) are not as relevant to SAD as they are
to nonseasonal depression. As suggested by Rohan et al. (2004), the content of some
cognitions in SAD may be qualitatively different (e.g., related to light availability,
seasonal changes, and weather) than in nonseasonal depression. A measurement
instrument designed specifically for the proposed SAD-specific cognitions is needed. To
provide a foundation for devising a SAD-specific cognitive measure, the development of
cognitive measures for depression is reviewed next.
Cognitive Measures for Depression
Several instruments exist to assess cognitions that are hypothesized to maintain or
exacerbate depression. The most often used and most thoroughly researched
measurement tools to assess cognitive processing are based on Beck’s cognitive model of
depression (1967, 1976). The measures reviewed below have been developed to reflect
the different levels of cognitive processing described in Beck’s model (i.e, dysfunctional
attitudes, automatic thoughts, and core beliefs).
Dysfunctional Attitudes Scale (DAS)
Weissman and Beck (1978) developed the Dysfunctional Attitudes Scale (DAS;
Appendix C) to identify the common assumptions underlying the typical idiosyncratic
cognitions endorsed by individuals with depression. As the name implies, the DAS was
20

designed to quantify cognitions at the level of attitudes and assumptions. The rationale
for creating this self-report questionnaire was the lack of an objective method to quantify
the relative presence or absence of these cognitive processes in depression at the time
(Weissman & Beck, 1978).
The specific DAS items were generated by the authors with the goal that items
should reflect the relative presence or absence of appropriate, idiosyncratic beliefs that
characterize patients with depression (Weissman & Beck, 1978). Potential items then
were screened by psychiatry interns, tested on college instructors (N = 25), and refined on
undergraduate students (N = 275), resulting in a reliable and valid 40-item measure.
Example items include: “If I fail at my work, then I am a failure as a person,” and “It is
difficult to be happy unless one is good looking, intelligent, rich, and creative.”
Participants’ ratings are given on a 7-point Likert scale indicating how much they agree
with each statement: 7 = “totally agree,” 6 = “agree very much,” 5 = “agree slightly,” 4 =
“neutral,” 3 = “disagree slightly,” 2 = “disagree very much,” and 1 = “totally disagree.”
In their original psychometric study, Weissman and Beck (1978) found that the
DAS demonstrated good internal reliability (Cronbach’s alpha = 0.86), good test-retest
reliability (r = 0.71), and good concurrent validity with the Beck Depression Inventory
(BDI; r = 0.53). The results of a later study with undergraduate students (Dobson &
Breiter, 1983) also showed good internal reliability (Cronbach’s alphas = 0.90 and 0.88
for males and females, respectively) and good concurrent validity between the DAS and
the BDI (r = 0.30).
Automatic Thoughts Questionnaire (ATQ)
21

Hollon and Kendall (1980) created a self-report measure of the frequency of
automatic negative thoughts associated with depression, the Automatic Thoughts
Questionnaire (ATQ; Appendix D). The ATQ, like the DAS, was created because of a
lack of suitable measures of cognitions associated with depression. Because one of the
primary goals of CBT for depression is a restructuring of negative automatic thoughts,
Hollon and Kendall (1980) recognized the need to assess changes in thought content as a
function of treatment with a valid, reliable measure.
The questionnaire items for the ATQ were generated retrospectively by asking
male and female undergraduate students (N = 788) to recall a depressing experience and
to report any associated cognitions. Potential items then were piloted on additional
undergraduate students (N = 312) to pare the original 100 items down using empirical
discriminate validity analyses. This procedure resulted in a reliable and valid 30-item
measure. Examples of ATQ items are: “I’m no good,” “No one understands me,” and
“There must be something wrong with me.” For each item, a rating is given on a 5-point
Likert scale with the following anchors: 1 = “not at all,” 2 = “sometimes,” 3 =
“moderately often,” 4 = “often,” and 5 = “all the time.” The rating indicates how
frequently the respective thought occurred over the last week.
Hollon and Kendall (1980) showed that the ATQ possesses excellent internal
reliability (Cronbach’s alpha = 0.96), excellent split-half reliability (r = 0.97), and good
concurrent validity with the Beck Depression Inventory (BDI; r = 0.45). A separate
analysis with an equal number of male and female college students (Dobson & Breiter,
1983) confirmed the high reliability and validity of the ATQ (Cronbach’s alphas = 0.96
and 0.95 for males and females, respectively; intercorrelation with the BDI of r = 0.30).
22

Young Schema Questionnaire (YSQ)
The Young Schema Questionnaire (YSQ; Young and Brown, 1994) is another
measure that, like the DAS and the ATQ, is based on Beck’s cognitive model of
depression (1967; 1976). The original 205-item version of the YSQ was developed by
Young to measure 16 early primary maladaptive cognitive schemas/core beliefs. The
YSQ was subsequently modified to a shorter 75-item version (YSQ-Short Form;
Appendix E) to assess 15 early maladaptive schemas (Young, 1998): emotional
deprivation, abandonment/instability, mistrust/abuse, social isolation/alienation,
defectiveness/shame, failure, dependence/incompetence, vulnerability to harm or illness,
enmeshment/underdeveloped self, subjugation, self sacrifice, emotional inhibition,
unrelenting standards/hypercritical ness, entitlement/grandiosity, insufficient self-
control/self-discipline. The YSQ was the first measure specifically designed to measure
core beliefs.
The questionnaire items were based on the observations and reasoning of
experienced clinicians (Young & Brown, 1994). Examples of YSQ items include: for
abandonment (“I need other people so much that I worry about losing them,” and “I
worry that people I feel close to will leave me or abandon me”), for vulnerability to harm
(“I can’t seem to escape the feeling that something bad is about to happen,” and “I worry
about being attacked”), and for unrelenting standards (“I must meet all my
responsibilities,” and “I can’t let myself off the hook easily or make excuses for my
mistakes”). Individuals complete the questionnaire using a 6-point Likert scale: 6 =
“Describes me perfectly,” 5 = “Mostly true of me,” 4 = “Moderately true of me,” 3 =
“Slightly more true than untrue,” 2 = “Mostly untrue of me,” and 1 = “Completely untrue
23

of me.” Having two or more ratings of 5 or 6 on the subset of items measuring a
particular schema indicates endorsement of the corresponding schema. Most people have
two or three of the primary schemas, and often even more (Young and Brown, 1994).
The YSQ has demonstrated adequate test-retest reliability (rs = 0.51 - 0.82 for 13
subscale factors), internal consistency (Cronbach’s alpha range = 0.83 - 0.96) and
convergent (with the BDI: r = 0.59) and discriminant (with the Self-Esteem
Questionnaire: r = -.26; Schmidt, Joiner, Young, & Telch, 1995) validity. Welburn,
Coristine, Dagg, Pontefract, and Jordan (2002) examined the psychometric properties of
the YSQ-Short Form (SF) in a clinical sample from a psychiatric day treatment program.
The results of their analysis showed that the YSQ-SF possesses adequate to very good
internal reliability (Cronbach’s alpha range = 0.76 - 0.93 for 15 subscale factors) and
adequate to excellent convergent validity with the Brief Symptom Inventory (BSI; range
of intercorrelations: rs = 0.05 – 0.69). Welburn et al. (2002) also performed a factor
analysis, which supported the 15 schema subscales proposed by Young.
Measurement of SAD-Specific Cognitions
Although all three of the above questionnaires are reliable and valid measures of
maladaptive cognitions based on Beck’s cognitive model of depression (1967, 1976),
they were all developed for use in nonseasonal depression. Further, although
nonseasonal depression and SAD share cognitive similarities, a preponderance of
etiological models for SAD propose mechanisms that are different than those
hypothesized in the etiology of nonseasonal depression. Thus, a few researchers have
begun to address this need for more SAD-specific cognitive measures. Available
measures are reviewed below.
24

Seasonal Attitudes Scale (SAS)
The Seasonal Attitudes Scale (SAS; Sigmon, Rohan, Boulard, Whitcomb, &
Dorhofer, 2000; Appendix F) was designed to measure feelings, behavior, and reactions
regarding the changing seasons. Participants are asked to rate how well the statements
describe their attitudes on a 7-point Likert scale with the following anchors: 1 = “does
not describe me at all,” 4 = “describes me somewhat,” and 7 = “describes me very well.”
A preliminary study (Sigmon et al., 2000) found that the SAS possesses good internal
reliability (Cronbach’s alpha = 0.86), good test-retest reliability (r = 0.81), and good
convergent validity (rs = 0.41 and 0.38 with the BDI and ATQ, respectively).
Although better tailored for SAD than any previous measure, the 25-item
questionnaire uses a broad approach by measuring not only attitudes and assumptions in
SAD, but also behavioral and affective changes (i.e., symptoms) associated with the
changing seasons. In this respect, the SAS does not appear to be very different from the
Seasonal Pattern Assessment Questionnaire (SPAQ; Rosenthal et al., 1984). The SPAQ
asks respondents to rate the degree to which six factors (i.e., mood, energy, appetite,
weight, sleep length, and social activities) change across the seasons and sums these to
generate a global seasonality score (GSS; Kasper et al., 1989). Similar to the SPAQ, the
SAS is heavily tied to SAD symptomology. For example, several SAS items are similar
to the GSS items for mood (e.g., “As winter approaches, I start to feel down” and
“During the summer months I start to feel less depressed”), energy level (e.g., “As winter
approaches, my energy level begins to decrease” and “As summer approaches, I begin to
feel more energetic”), weight (e.g., “I tend to gain weight during the winter months” and
“During the summer months, I tend to lose weight”), appetite (e.g., “I notice that I like to
25

eat different types of food depending on the season” and “My appetite increases as the
amount of daylight decreases”), and activity level (e.g., “During the winter months, I tend
to engage in fewer social activities” and “I feel more active when there is more sunlight
in the day”). Although there is likely to be a cognitive appraisal involved in rendering
SAS ratings for these items, the respondent is rating symptoms rather than cognitions per
se.
After eliminating all SAS items that appear symptom-specific, very few items
remain to measure cognitions in SAD that are well-matched to Rohan’s (2002) model.
Examples of more cognitive SAS items are “When the seasons change, I know that it will
affect my mood and behavior” and “I feel that there is little to do to improve my mood in
the winter months.”
Seasonal Automatic Thoughts Survey (SATS)
In an attempt to create a SAD-specific measurement tool with a more cognitive
emphasis, Whitcomb-Smith, Sigmon, and Kendrew (2002) created the Seasonal
Automatic Thoughts Survey (SATS; Appendix G). Items were generated for the SATS
based on typical cognitions that individuals with SAD have reported. The SATS has 22
items and uses a 5-point Likert scale: 1 = “not at all,” 2 = “occasionally,” 3 =
“moderately often,” 4 = “often,” and 5 = “all the time.” Preliminary results indicate that
the SATS possesses excellent internal reliability (Cronbach’s alpha = 0.92) and adequate
convergent validity with other instruments related to seasonality and depression (r = 0.65,
0.70, 0.63; BDI, ATQ, and SAS, respectively). Further assessment is needed to
determine the test-retest reliability of the SATS in addition to testing with a clinical
sample.
26

The SATS was designed to assess the frequency and intensity of negative
automatic thoughts associated with SAD. However, the SATS also contains many
cognitions related to depression in general, not just SAD. Approximately one-third (8 of
22) of the items on the SATS reflect automatic thoughts associated with general,
nonseasonal depression similar to Hollon and Kendall’s (1980) ATQ: “I am
overwhelmed,” “It is hard to be social,” and “I can’t do this much longer.” Similar to the
SAS, several SATS items reflect specific SAD symptoms. Approximately one-half (10
of 22) of the items on the SATS are related to symptoms of SAD or depression in general
such as the following: “I’m too tired to do anything” (anergia), “It is hard to get out of
bed in the morning” (hypersomnia), and “I can’t control my food cravings”
(hyperphagia). There are a few SATS items that represent SAD-specific cognitions
consistent with Rohan’s (2001) model (e.g., “Everything is so dark and dreary” and “I am
going to be depressed until spring”). However, a thorough measure focused on SAD-
specific cognitions is lacking to date.
Study Purpose
Several cognitive correlates of SAD have been identified in recent work,
including negative automatic thoughts, dysfunctional attitudes, and rumination (Hodges
& Marks, 1998; Levitan et al., 1998; Rohan et al, 2003; Young & Azam, 2003).
Although these preliminary studies show support for the role of cognitive factors in SAD,
further studies need to be conducted to explicate the specific role of these cognitive
factors. It is unknown whether these cognitive constructs may contribute to SAD
symptom onset, maintenance, and/or recurrence. Because SAD-specific cognitive
measures did not exist at the time, these preliminary studies included only measures
27

based on Beck’s model of nonseasonal depression. Therefore, SAD-tailored cognitive
measures should be developed and included in future SAD studies.
There is no measure available to assess the SAD-specific cognitions proposed in
Rohan’s (2002) integrative, cognitive-behavioral model. Unlike prior attempts at SAD-
specific measures that focus on the general symptomology of SAD (i.e., the SAS) and on
automatic thoughts that are not necessarily specific to SAD (i.e., the SATS), a new
questionnaire is needed to determine whether Rohan’s (2002) hypothesized cognitions
about light, winter, and weather are present in SAD. Development of a new SAD-
tailored cognitive measure would help to determine whether individuals with SAD
experience cognitions distinct in content from cognitions associated with nonseasonal
depression.
This study developed a new self-report questionnaire to measure the cognitive
constructs proposed in Rohan’s (2002) integrative, cognitive-behavioral model, and
determined the instrument’s psychometric properties (i.e., reliability and validity). Items
were derived through qualitative analysis of thoughts that were self-reported by
participants with SAD from a prior study. The preliminary items were pilot-tested on a
sample of SAD participants to determine appropriateness of the items. The
questionnaire, called the Seasonal Beliefs Questionnaire (SBQ), subsequently was
administered to a general volunteer sample at two universities. It was expected that
scores on this new measure would approximate a normal distribution and would be
highly correlated with the depression measures outlined above (i.e., DAS, ATQ, SAS,
SATS), but will not be significantly correlated with a measure of a different construct
(i.e., the Current Behaviors Scale, a measure of Attention Deficit Disorder).
28

Hypotheses
Hypothesis One: Validity
With regard to validity, it was hypothesized that both convergent and divergent
validity will be demonstrated for the SBQ. Convergent validity is the association
between a given measure and other measures of the same construct. The SBQ should be
related to measures of depression, in general, and to SAD, in specific. However, if two
measures are extremely highly correlated, then they are essentially measuring the same
construct (Streiner & Norman, 1995). Convergent validity was examined by computing
Pearson’s correlations between scores on the SBQ and scores on other depression-,
cognition-, and SAD-related questionnaires. Because no consensus exists as to the
maximum acceptable correlation, it was predicted that the new questionnaire would
demonstrate a moderate correlation (r > 0.40) with the Structured Interview Guide for the
Hamilton Rating Scale for Depression – Seasonal Affective Disorder Version - Self
Report (SIGH-SAD-SR), the Center for Epidemiological Studies – Depression Scale
(CES-D), the Seasonal Pattern Assessment Questionnaire (SPAQ), the Automatic
Thoughts Questionnaire (ATQ), the Dysfunctional Attitudes Scale (DAS), the Seasonal
Attitudes Scale (SAS), and the Seasonal Automatic Thoughts Survey (SATS).
Because the SATS is the most conceptually related measure to the SBQ, it was
expected to have the highest correlation with the SBQ. It was further predicted that the
SIGH-SAD-SR, SPAQ, and SAS would correlate strongly with the SBQ because they are
SAD-specific measures. The CES-D, ATQ, and DAS were expected to have somewhat
lower correlations with the SBQ because they are related to general, nonseasonal
depression. Due to these conceptual overlaps, the SBQ and these SAD and depression
29

measures were expected to covary. However, it was expected that the SBQ and the other
measures would also vary separately because the SBQ uniquely focuses on cognitions
specific to SAD as proposed in Rohan’s (2002) model.
Divergent validity was determined by a correlation between scores on the SBQ
and scores on the Current Behaviors Scale (CBS), a measure of attentional deficits and
hyperactivity such as those related to Attention Deficit Hyperactivity Disorder (ADHD).
Because seasonal thoughts were expected to be relatively unrelated to attentional deficits,
it was predicted that the SBQ would exhibit a low correlation with the CBS, but not a
zero correlation because there are some similar features to both constructs (e.g, attention
and focus).
Hypothesis Two: Reliability
It was predicted that the SBQ would possess good reliability in terms of internal
consistency and stability over time (test-retest). Internal consistency was calculated using
Cronbach’s coefficient alpha (Cronbach, 1951). Cronbach’s alpha (α) is an intraclass
correlation coefficient defined as the mean correlation among individual questionnaire
items, each of which has been measured for every member of a sample. High inter-item
correlations suggest that items are all measuring the same construct (DeVellis, 1991).
Although coefficient alpha is dependent on the magnitude of the correlations between
individual items and the number of items on the scale, alpha should be above 0.70
(Nunnally, 1978; Nunnally & Bernstein, 1994), but probably not higher than 0.90, as
correlations above 0.90 generally indicate item redundancy (Steiner & Norman, 1995).
Following factor analysis of a measure, separate coefficient alphas are typically
computed for each factor grouping because the overall coefficient alpha can be less
30

informative, especially if the number of items is large. Therefore, the overall coefficient
alpha for the SBQ will require supplementation with internal consistency data for each
individual factor based on further study.
Test-retest reliability was computed with Pearson’s correlations between total
SBQ scores at the initial and 2-week followup assessments. For test-retest reliability of
scale items, Pearson’s r > 0.70 is considered acceptable (Anastasi & Urbina, 1997;
Nunnally, 1978). Total SBQ scores were expected to demonstrate high (> 0.70) test-
retest reliability.
Method
Phase One: Item Development
Phase one involved the generation of items for a self-report questionnaire of
thoughts and attitudes related to the winter season, light availability, and the changing
environment with items given in a first person, affirmative statement form. Items for the
new questionnaire were derived from Rohan’s (2002) model, clinical observations, and
self-disclosed cognitions from SAD participants during cognitive-behavioral therapy
(CBT) in our ongoing clinical trial. The initial items were generated based on Rohan’s
clinical observations of individuals with SAD enrolled in research projects. Additional
items were added based on the Principal Investigator’s extensive review of tape-recorded
sessions of our CBT treatment protocol. Any verbally reported negative thought with the
hypothesized SAD-specific content from the recorded sessions was considered as a
potential SBQ item.
Items were grouped into seven a priori factor categories: Global Winter
Negativity, External Control Over Mood, Sensitivity to Cues Signaling Winter,
31

Avoidance of Winter, Personal Deficiency, Positive Expectations for Spring, and Global
Summer Positivism. Additionally, a total of 19 reverse items were added to avoid a
positive response bias (e.g., “Winter is the best season of the year” versus “I hate
winter”). The addition of these items resulted in a 94-item questionnaire called the
Seasonal Beliefs Questionnaire (SBQ; Appendix H). Instructions were added to ask
respondents to rate items based on how they “generally think” on a 7-point Likert-type
scale with anchors from 1 = “totally disagree” to 7 = “totally agree.” The response
format is similar to previous measures such as the ATQ, SAS, and SAS, but the content is
more closely targeted to Rohan’s (2002) integrative, cognitive-behavioral model.
Phase Two: Descriptive Feedback from SAD Participants
The next step in the development of the SBQ involved obtaining feedback from a
clinical sample for which the new measure was designed to target. To obtain this
important feedback, a preliminary 75-item SBQ and a feedback form (Appendix I) were
mailed to past and current SAD participants in Rohan and colleagues’ ongoing clinical
trial. The feedback form asked questions about the clarity of the instructions and the
individual items, asked for possible items to be excluded or included, and solicited any
general comments about the SBQ. Inclusion criteria for prospective respondents
included: a) consent to be contacted for future SAD-related research on the original
signed informed consent form for the clinical trial, b) a diagnosis of Major Depression,
Recurrent with Seasonal Pattern on the Structured Clinical Interview for DSM-IV Axis I
Disorders (SCID, First et al., 1996) given as part of the treatment study, and c) having
experienced a clinical SAD episode at the time of their inclusion in the clinical trial
[based on Terman et al.’s (1989) criteria of a total Structured Interview Guide for the
32

Hamilton Rating Scale for Depression – Seasonal Affective Disorder Version score >
20].
After obtaining Uniformed Services University of the Health Sciences (USUHS)
Institutional Review Board approval, the preliminary SBQ and feedback form were
mailed to 95 past SAD participants. A cover letter in the packet explained the reason for
the additional contact and the purpose of the present study and invited respondents to
complete the SBQ, provide written comments on the enclosed feedback form, and return
the materials in a pre-paid envelope. Forty-eight participants returned their packets
(response rate = 51%).
Although the returned SBQ measures were not quantitatively analyzed,
anecdotally, there was an overall strong endorsement of the majority of the items. Many
of the SAD respondents provided written comments that the SBQ items were “right on
target” with the way they thought about light, weather, and the changing seasons. This
type of comment was consistently reported on the feedback form. Based on feedback
from several respondents, one item was deleted due to its potentially offensive nature: “I
am a slave to Mother Nature.” Additionally, some participants suggested minor
rewording of a few items. Interestingly, none of the respondents recommended adding
any new items to the SBQ. All respondents indicated that the instructions were clearly
written. The most frequent feedback was that many of the items were redundant.
However, this redundancy was intentional in order to ensure the comprehensiveness of
item development. The future goal will be to maintain the most frequently endorsed
items, and then to subsequently eliminate redundant items based on further study using
SAD patients with a current winter major depressive episode.
33

Phase Three: Administration to a Large Sample
After the SBQ items were developed and reviewed by past SAD participants,
phase three was undertaken. This phase entailed administration of the revised SBQ to a
large sample from the general population where, presumably, seasonality, depression, and
related cognitions are normally distributed. Because of guidance to obtain a sufficiently
large sample (e.g., Nunnally & Bernstein, 1994), two separate college student samples
were used: one from American University in Washington, D.C. and a second from
Pennsylvania State University in State College, Pennsylvania. There were no specific
inclusion or exclusion criteria for either sample except that study volunteers had to be at
least 18 years old. Institutional Review Board approval was obtained for the study from
both universities and from the Uniformed Services University of the Health Sciences
(USUHS).
Procedure
In addition to the SBQ, eight other self-report questionnaires were administered to
study volunteers in order to determine convergent and divergent validity: Dysfunctional
Attitudes Scale (DAS; Appendix C), Automatic Thoughts Questionnaire (ATQ; Appendix
D), Seasonal Attitudes Scale (SAS; Appendix F), Seasonal Automatic Thoughts Survey
(SATS; Appendix G), Center for Epidemiological Studies – Depression Scale (CES-D;
Appendix J), Structured Interview Guide for the Hamilton Rating Scale for Depression –
Seasonal Affective Disorder Version - Self Report (SIGH-SAD-SR; Appendix K),
Seasonal Pattern Assessment Questionnaire (SPAQ; Appendix L), and Current
Behaviors Scale (CBS; Appendix M). Of these questionnaires, the ATQ, DAS, SAS, and
SATS were thoroughly discussed above and will not be reviewed here. The other
34

measures (CES-D, SIGH-SAD-SR, SPAQ, and CBS) were included because of their
relevance to depression, seasonality, or divergent constructs, and are discussed below.
For logistical reasons and for ease of administration, the questionnaires were
converted to an electronic format as an internet-based protocol. The questionnaires were
built on a secure website (https://cim01.usuhs.mil/mps/rlippy/index.tpx) using internet
survey creation software (Test Pilot™) owned by the Uniformed Services University of
the Health Sciences (USUHS). Volunteers were recruited using campus flyers and in-
class announcements.
After accessing the website, participants self-registered by typing a unique
password and user identification code of their choosing. After log-on and registration,
participants read an informed consent form before they were allowed to proceed to the 9
questionnaires. All questionnaire items required either clicking on a specific response
category or typing a very brief response on the keyboard. After the questionnaires,
demographic information was obtained such as age, race, gender, current place of
residence and number of years lived there, previous permanent place of residence and
number of years lived there, as well as relevant weather information for that day (i.e.,
approximate hours of daylight, approximate temperature, and overall weather condition
[mostly sunny, mostly cloudy, raining, snowing, etc.]). The entire questionnaire battery,
including demographic information, took volunteers approximately 1 hour to complete.
A final prompt thanked volunteers for their time and reminded them to return to the
website in 2 weeks to finish the project. At the 2-week point, a general email was sent to
volunteers to remind them of the second assessment and to email the Principal
Investigator if they had any questions (e.g., forgotten password). At the second session,
35

volunteers completed the SBQ again to help determine its test-retest reliability.
Volunteers were required to complete both sessions to obtain their respective
compensation. The incentive of obtaining 1.5 extra credit points to apply towards a
psychology course was used for American University students. For Penn State
University students, volunteers received two coupons worth $10 each at their campus
bookstore.
Measures
Center for Epidemiological Studies – Depression Scale (CES-D). The CES-D
(Radloff, 1977; Appendix J) is a 20-item self-report measure that assesses symptoms of
depression in the general population. Each of the 20 items on the scale states an
experience related to depression including depressed mood, feelings of guilt and
worthlessness, feelings of helplessness and hopelessness, loss of energy, and sleep and
appetite disturbances. Sixteen of the items express negative experiences and four items
express positive experiences, which are reverse-scored. Responses are coded on a four-
point Likert scale and include: “Rarely, or none of the time (less than 1 day),” “Some or
little of the time (1-2 days),” “Occasionally or a moderate amount of time (3-4 days)” and
“Most or all of the time (5-7 days).” For each item, the respondent selects the value (1, 2,
3, or 4) that best describes how frequently the experience occurred during the previous
week.
A total score is calculated as the sum of responses to the 20 items, with total
scores ranging between 0 and 60, with higher scores indicating more symptoms, weighted
by frequency of occurrence during the past week. A cutoff score of 16 has been used in
prior studies to indicate possible clinical depression (Weissman et al., 1977). In the
36

original study, Ratloff (1977) reported high internal consistency (ranging from .84 to .90)
and moderate test-retest reliability (ranging from .32 to .67) for 3 different population
samples. Good reliability and validity have been found across a wide variety of
demographic characteristics including age, education, geographic area, and racial, ethnic,
and language groups (Radloff, 1977, 1991; Radloff & Locke, 1986).
Structured Interview Guide for the Hamilton Rating Scale for Depression –
Seasonal Affective Disorder Version - Self Report (SIGH-SAD-SR). The SIGH-SAD
(Williams et al., 1992; Appendix K) is comprised of the 21-item Structured Interview
Guide for the Hamilton Rating Scale for Depression (HAM-D) and the supplementary 8-
item SAD subscale that assesses atypical or reverse vegetative symptoms most
commonly found in seasonal depression (i.e., anergia, hypersomnia, and hyperphagia).
The Hamilton Rating Scale for Depression (HAM-D) has been the gold standard for the
assessment of depression for over 40 years (Bagby et al., 2004). The HAM-D has been
shown to possess adequate psychometric properties including: internal consistency, test-
retest reliability, and convergent and predictive validity (Bagby et al., 2004). The SIGH-
SAD is the most commonly used measure to assess SAD symptom severity in research
studies. The Self-Report version (SIGH-SAD-SR) of the SIGH-SAD was used to
conform to the online survey format of this study.
Seasonal Pattern Assessment Questionnaire (SPAQ). The Seasonal Pattern
Assessment Questionnaire (SPAQ, Rosenthal, Bradt, & Wehr, 1984; Appendix L) is one
of the most widely used self-report instruments to screen for SAD. It has several scales
designed to assess mood and behavioral changes with the seasons. One of the central
features of the SPAQ is the Global Seasonality Score (GSS), which sums 6 items that
37

measure seasonal variations in mood, appetite, weight, sleep, energy, and socializing.
Each GSS item is scored on a 5-point Likert scale, ranging from 0 (no change) to 4
(extremely marked change), and the GSS ranges from 0 to 24. In addition to GSS, other
SPAQ items evaluate the degree to which seasonal changes are experienced as a problem
and specific month of the year when respondents “feels worst.” Together with GSS,
these items are used to classify respondents as SAD, subsyndromal SAD (S-SAD), or no
diagnosis. The SPAQ has shown high internal reliability (Cronbach’s α = 0.82,
Magnusson et al., 1997) and test-retest reliability (r = 0.62, Raheja et al., 1996).
Current Behaviors Scale (CBS). The Current Behaviors Scale (Murphy &
Barkley, 1998; Appendix M) was chosen as a comparison measure of divergent validity
because it measures a construct that is quite different from SAD. The Current Behaviors
Scale (CBS) is a new name given to the Current Symptoms Scale (CSS) that was
developed as a measure of the presence or absence of the 18 symptoms of attention
deficit hyperactivity disorder (ADHD) as outlined in the Diagnostic and Statistical
Manual of Mental Disorders, Fourth Edition (DSM-IV; APA, 1994). The 18 items of the
CBS directly reflect the DSM-IV ADHD symptoms associated with the two ADHD
subtypes (i.e., 9 “inattentive” items and 9 “hyperactive/impulsive” items) and, thus,
possesses high face validity. Each item is measured on a 4-point Likert scale with
anchors 0 (“Never or rarely”) and 3 (“Very often”), allowing quantification of the number
and degree of symptoms. The CBS has been shown to possess good internal consistency
(Cronbach’s α = 0.63 - 0.75) and good test-retest reliability (r = 0.82; Aycicegi & Harris,
2003).
Participant Safeguards
38

Because this study involved obtaining sensitive confidential information from
volunteers, several safeguards were implemented. With regard to general confidentiality,
participant information was obtained via a secure internet website (https:) requiring a
personal username and password. Once participants completed the questionnaires, their
data was encrypted using current security software and sent to a protected, limited-access
server located at USUHS. This procedure ensured that any data intercepted during
transmission could not be decoded and prevented individual responses from being traced
back to an individual respondent. Only the Principal Investigator, Dr. Rohan, and the
USUHS software technical staff had access to this server and to the data.
In addition, specific participant safeguards had to be implemented regarding
information collected concerning potential suicidality of some participants. Specifically,
on the SIGH-SAD-SR, one item assesses levels of suicidal ideation. If respondents
endorsed anything other than a 0 (“I have not had any thoughts about dying or about
hurting or killing myself, or that life is not worth living”), they received the following
feedback automatically at the end of the first on-line assessment: “On the SIGH-SAD-SR
questionnaire, you reported (1 “I have had thoughts that life is not worth living, or that
I’d be better off dead”/ 2 “I have thought about dying, or wish I were dead”/ 3 “I have
thought about killing myself, or I have done something to hurt myself”/ 4 “I have tried to
kill myself”). You would likely benefit from seeing a mental health professional who can
help you deal with these thoughts. One resource available to you is the (AU Counseling
Center at (202) 885-3500 / PSU Center for Counseling and Psychological Services at
(814) 863-0395). If you feel significantly depressed, have suicidal thoughts, or actually
want to harm yourself, we recommend that you call the National Suicide Hopeline
39

Network immediately at 1-800-SUICIDE (1-800-784-2433), a 24-hour suicide/crisis
hotline. Please do not hesitate to use this resource.” Participants who endorsed either a
3 (“I have thought about killing myself, or I have done something to hurt myself”) or a 4
(“I have tried to kill myself”) on this item, received a personal follow up phone call by
Dr. Rohan, a licensed psychologist.
Additionally, tailored feedback was also given to respondents whose CES-D score
indicated they might be experiencing symptoms of depression. For the CES-D,
investigators have designated a cutoff score of 16 as a suitable indicator to differentiate
depressed from nondepressed patients (Comstock & Helsing, 1976). Therefore, if a
volunteer scored above 16 on the CES-D, they received the following feedback upon
completion of all the questionnaires: “One of the questionnaires you just completed, the
Center for Epidemiological Studies – Depression Scale (CES-D), measures symptoms
associated with depression. Your score on this questionnaire was . Your score
suggests that you may be experiencing some symptoms of depression. Your score on this
questionnaire does not necessarily mean that you are currently depressed. Only a mental
health professional can diagnose depression. However, you may benefit from seeing a
mental health professional who can evaluate your symptoms and, if indicated,
recommend an effective treatment. One resource available to you is the (AU Counseling
Center at (202) 885-3500 / PSU Center for Counseling and Psychological Services at
(814) 863-0395).” This feedback was designed to provide useful referral information for
any volunteers who might have depression-related problems.
40

Results
All statistical analyses were conducted using Statistical Package for the Social
Sciences (SPSS) version 11.0.
Participant Demographics, Depression Severity, and Seasonality
Phase three of the study included 104 volunteers from both universities [56
American University (AU), 48 Penn State University (PSU)]. Participant characteristics
(gender, age, race, and education level) and mean CES-D, SIGH-SAD-SR, and global
seasonality scores (GSS), overall and by university, and statistical comparisons between
universities are presented in Table 1. The two universities did not significantly differ on
gender, age, or racial composition. The mean age for participants was 21.1 years (SD =
4.7, range = 18 - 50 years). The sample as a whole consisted of a significantly greater
proportion of females (71%) than males (22%), χ² (1, N=97) = 26.81, p < .001, a
significantly higher proportion of white (66%) than non-white students (30%), χ² (1,
N=97) = 17.33, p < .001, and a significantly higher proportion of students with some
college (i.e., 85%; included “High School,” “Some College,” and “Associates/2-yr”
degree) than advanced degrees (i.e., 9%; included “Bachelors/4-yr” degree, “Masters”
degree, and “Graduate/Medical” degree), χ² (1, N=97) = 64.34, p < .001. The PSU
sample had a significantly higher proportion (19%) of students with advanced degrees
(i.e., Bachelor’s, Master’s, Doctorate) than the AU sample (0%), χ² (1, N=97) = 10.13, p
< .001.
Data collection began in the summer of 2004 and ended in February 2005. The
overall Chi-square comparing seasons of assessment was significant, χ² (2, N=104) =
11.34, p < .01. A greater proportion of students participated in the fall months (63%; i.e.,
41

Sept. – Nov.) than in the winter (29%; i.e., Dec. – Feb.), χ² (1, N=104) = 16.12, p < .001,
and summer (9%; i.e., Jun. – Aug.), χ² (1, N=104) = 71.12, p < .001. Differences in mean
SBQ scores across seasons of assessment did not reach statistical significance, F(2,103) =
1.652, p = .197. Interestingly, mean SBQ scores were descriptively highest for students
who participated during the summer months (M = 423.11, SD = 69.7), and mean SBQ
scores were roughly equivalent during the fall (M = 369.83, SD = 89.2) and winter
months (M = 370.03, SD = 74.5). The universities differed on the overall proportions of
students who completed the study in certain seasons. Specifically, a greater proportion of
AU students than PSU students completed the study in the summer (16% vs. 0%,
respectively), χ² (1, N=9) = 8.45, p < .05. On the other hand, a greater proportion of PSU
students than AU students completed the study in the winter (40% vs. 20%, respectively),
χ² (1, N=30) = 5.01, p < .05.
The two university samples did not significantly differ on depression severity on
the CES-D or SIGH-SAD-SR (see Table 1). Mean CES-D scores were generally higher
than anticipated for a college sample. As discussed above, a cutoff score of 16 on the
CES-D has been used in prior studies to indicate possible clinical depression (Weissman
et al., 1977). Thus, the mean CES-D score in this study (18.6, SD = 11.8) suggested that
the student sample was, on average, mildly depressed. Similar to mean CES-D scores,
the mean SIGH-SAD score (15.7, SD = 11.8) was higher than would be expected for a
college sample. Criteria to define a current depressive episode include a SIGH-SAD
score ≥ 20 (Terman et al., 1990). The mean SIGH-SAD score obtained in this study did
not meet, but approached, this cutoff, indicating at least mild levels of depression in this
sample, on average.
42
The universities did not significantly differ on mean global seasonality scores
(GSS) on the SPAQ (see Table 1). As would be expected because of its higher latitude,
the mean GSS score at PSU was descriptively somewhat higher than the mean GSS score
at AU. Based on previous epidemiological research (e.g., Rohan & Sigmon, 2000; Rosen
et al., 1990), a GSS score of 8 or 9 is included in the criteria for subsyndromal SAD (S-
SAD; i.e., mild to moderate seasonal symptoms). Therefore, the mean GSS observed in
this study (9.2, SD = 5.1) suggests that mild seasonality characterizes this sample.
Insert Table 1 about here
Hypothesis One: Validity
Correlations between the Seasonal Beliefs Questionnaire (SBQ) and the other
seasonal-related measures are presented in Table 2. Correlations between the SBQ and
the nonseasonal depression-related measures are presented in Table 3. The distribution
of SBQ scores is presented in Figure 1. SBQ scores were approximately normally
distributed in this sample.
Insert Table 2 about here
Insert Table 3 about here
Insert Figure 1 about here
Overall, the SBQ demonstrated adequate convergent validity with the other
depression and seasonality measures, all rs >.28, all ps < .01. Contrary to prediction, the
Seasonal Attitudes Scale (SAS), not the Seasonal Automatic Thoughts (SATS),
demonstrated the highest correlation with the SBQ, sharing 69.8% of the variance. With
the exception of the SAS, the relative rankings of the correlations of the other measures
with the SBQ were in the predicted order. As predicted, the next highest correlations
43

were between the SBQ and the SAD-specific measures: the SATS (32.7% shared
variance with the SBQ), Seasonal Pattern Assessment Questionnaire (SPAQ)-Global
Seasonality Score (GSS; 24.3% shared variance), and Structured Interview Guide for the
Hamiliton Rating Scale for Depression – Seasonal Affective Disorders Version-Self
Rating (SIGH-SAD-SR; 11.8% shared variance).
The general, nonseasonal depression measures had the next highest correlations
with the SBQ. These measures included the Dysfunctional Attitudes Scale (DAS; 9.5%
shared variance with the SBQ), Automatic Thoughts Questionnaire (ATQ; 8.2% shared
variance), and Center for Epidemiological Studies – Depression Scale (CES-D; 8.0%
shared variance). Although statistically significant, the Current Behaviors Scale (CBS)
had the lowest correlation and shared the smallest proportion of variance with the SBQ
(7.7% shared variance), providing support for divergent validity of the SBQ.
Hypothesis Two: Reliability
SBQ scores were examined for reliability in terms of internal consistency and
stability over time (test-retest). As predicted, the overall internal consistency of the SBQ
was high. Cronbach’s coefficient α was .978, p < .001. The coefficient α was also
calculated for each university separately, but showed only slight deviation from the
overall sample coefficient α (PSU = .968, AU = .983). The split-half reliability
coefficient was also high and statistically significant, Guttman split-half = .942, p <
.0001.
Test-retest reliability was calculated using Pearson’s correlations between the first
assessment and the second assessment, approximately 2 weeks later. Although e-mail
reminders were sent to all volunteers, only 74 / 104 participants returned to complete the
44

second assessment for a followup rate of 71.2%. The test-retest reliability was high and
statistically significant, r = .93, p < .001. Test-retest reliability was significantly higher
for the AU, r = .95, p < .001 than for the PSU sample, r = .89, p < .001, z = 1.69, p < .05.
Despite efforts to ensure that the followup assessment occurred approximately 2
weeks after the initial assessment for all volunteers (e.g., email reminders at the 2-week
point), there was considerable variability in time between assessments. The mean time
between assessments was 18.5 days (SD = 8.4). Because the testing software package did
not allow for preventing volunteers to log-on before 2 weeks had elapsed, several
volunteers completed the second assessment before the 2-week interval, with the earliest
follow-up occurring 5 days after the initial assessment. The longest delay between
assessments was 46 days. There was a significantly longer mean time between
assessments for the AU volunteers (M = 20.8, SD = 9.8 days) relative to the PSU
volunteers (M = 16.6, SD = 6.5 days), t (72) = 2.18, p = .03. In conclusion, SBQ scores
appear to be relatively stable over an interval of 2 – 4 weeks.
Discussion
The present study generated items for a self-report measure of SAD-specific
thoughts related to the seasons, light availability, and cues about the changing seasons.
The resulting measure, the Seasonal Beliefs Questionnaire (SBQ), was pilot tested on a
sample of university students. SBQ scores approximated a normal distribution in this
study. The SBQ demonstrated statistically significant and positive correlations with two
measures of thoughts and attitudes towards the seasons [i.e., the Seasonal Attitudes Scale
(SAS) and the Seasonal Automatic Thoughts Survey (SATS)], a measure of dispositional
seasonality [i.e., the Seasonal Pattern Assessment Questionnaire (SPAQ)], two measures
45

of cognitions related to depression [i.e., the Automatic Thoughts Questionnaire (ATQ)
and the Dysfunctional Attitudes Scale (DAS)], and two measures of current depression
severity [i.e., the Center for Epidemiological Studies – Depression scale (CES-D) and the
Structured Interview Guide for the Hamilton Rating Scale for Depression – Seasonal
Affective Disorder – Self Report version (SIGH-SAD-SR)]. The observed correlations
with the SBQ were in the predicted order of strength, with the highest correlations
between the SBQ and two preliminary cognitive measures for SAD (i.e., the SATS and
SAS). The observed correlations suggest good convergent validity for the SBQ.
The SBQ also demonstrated a high internal consistency based on an intraclass
correlation coefficient (e.g., Cronbach’s coefficient α), indicating general homogeneity of
the items comprising the SBQ. Test-retest reliability over approximately a 2-week period
was high, indicating stability of SBQ scores over a short time. Longer-term stability of
the SBQ is yet to be determined. Longer-term test-retest reliability of the SBQ is
dependent on the state- versus trait-oriented nature of the cognitions measured by the
SBQ, as discussed further below. Therefore, based on these promising preliminary
psychometrics, continued validation of the SBQ is warranted.
As expected, the SBQ exhibited the highest correlations with the four seasonal-
specific measures: SAS, SATS, SPAQ, and SIGH-SAD-SR. Contrary to prediction, the
SAS, not the SATS demonstrated the highest correlation with the SBQ and shared the
greatest proportion of variance (69.8%). The SBQ not only demonstrated the highest
correlation with the SAS, the overall pattern of correlations for the SBQ was most similar
to that of the SAS. The high observed correlation between the SBQ and the SAS was not
expected because the SAS item content is heavily tied to the symptoms of SAD (e.g.,
46

energy, appetite, mood, weight), whereas the SBQ is more cognitive in nature. In
contrast to the SAS, the SBQ focuses more extensively on the unique cognitions
regarding light availability and the changing seasons (Rohan, 2002).
There are several possible reasons for the high observed correlation between the
SBQ and SAS. First, both scales assess reactions to the changing seasons and light
availability. Similar to the SBQ, the majority of items on the SAS reflect thoughts
related to the changing seasons (e.g., “I have always been affected by the changing
seasons,” “When the seasons change, I know that it will affect my mood and behavior,”
“I believe that my behavior is affected by the changing seasons”). Additionally, 7 of the
25 (28%) SAS items refer to daylight or day length, which is the focus of several SBQ
items. Second, the directions for the SBQ and the SAS are similar in that both require
respondents to answer items based on “how you generally think.” When responding to
the SBQ and the SAS, participants may have been referencing a variety of time frames.
In contrast, directions on the SATS require respondents to indicate the frequency of
specific thoughts over “the past week.”
Does the SBQ add anything above and beyond the two preliminary cognitive
measures developed for high seasonality samples (i.e., the SATS and the SAS)? The
general, nonseasonal depression measures correlated higher and shared more variance
with the SATS than with the SBQ: DAS (rs = .516 vs. .308; 27% vs. 9% shared
variance), ATQ (rs = .684 vs. .286; 47% vs. 8% shared variance), and CES-D (rs = .640
vs. .282; 41% vs. 8% shared variance), respectively. This is consistent with the SATS
items’ focus on cognitions (e.g., “I am overwhelmed,” “I can’t do this much longer”) and
symptoms of depression (i.e., depressed mood, fatigue, appetite changes), in general, not
47
necessarily specific to SAD. Although the SATS is highly correlated with the SBQ, the
SATS appears to be more closely related to the construct of nonseasonal depression than
the SBQ is. Future studies are needed to determine whether the SBQ and SAS are
assessing the same or related constructs.
The SBQ was not intended, nor was it designed to be, heavily influenced by
nonseasonal depression-related constructs. Consistent with this aim, the SBQ
demonstrated relatively modest correlations with two cognitive measures designed for
nonseasonal depression, the DAS and the ATQ, r = .308, 9.5% shared variance and r=
.286, 8.2% shared variance, respectively. Therefore, the content of the SBQ appears
distinguishable from that of the DAS and the ATQ, which were based on Beck’s (1967,
1976) cognitive model of nonseasonal depression.
Similarly, the SBQ correlated modestly with measures of current depressive
symptom severity, the CES-D, r = .282 (8.0% shared variance) and the SIGH-SAD-SR, r
= .343 (11.8% shared variance). The item development of the SBQ and its relatively low
correlation with nonseasonal, general depression measures is consistent with the
conceptualization of SAD as a unique syndrome of depression with its own unique
etiology, prevalence, recurrence, and treatment (Danilenko & Putilov, 1996). These
modest correlations with nonseasonal depression measures also support the idea that the
SBQ is tapping into new and unique SAD cognitions as proposed in Rohan’s (2002)
integrative, cognitive behavioral model.
Similarly, because participants were tested across the year rather than in the
winter only, when seasonal symptoms peak, those observed correlations were expected.
Although the SIGH-SAD-SR was designed for use with high seasonality samples, it
48

remains a measure of current depressive symptom severity, focusing on symptoms “over
the past week.” Importantly, the SBQ was more strongly related to a dispositional
seasonality measure, SPAQ global seasonality score, than with the current depression
measures.
The next appropriate step in the development and validation of any new measure
is to optimize the scale length (Devellis, 1991). The intent in the initial development of
the SBQ was to generate a large pool of items at the risk of being overly inclusive and
redundant (Devellis, 1991). In subsequent studies, the 94 SBQ items will be empirically
reduced to a more feasible and efficient (e.g., less burdensome, non-redundant) 30 to 40
items. Item reduction can be accomplished in a number of ways. The effect of omitting
each scale item on the overall alpha can be examined. The items that, when omitted,
have the least negative effect on alpha should be dropped first (Devellis, 1991). Because
the overall coefficient alpha is high and because many of the individual items already
have high item-total correlations, this method would not be useful in this study.
Alternatively, the item-total scale correlation method excludes those items with the
lowest correlations between item and total scale scores. For example, items that are
correlated less than .20 with the total score would be eliminated (Devillis, 1991). For the
same reasons this method also would not be very useful in this study. Another method of
item reduction is to use item loadings in a factor analysis. For example, items not
substantially correlated with any of the factors of the scale would be eliminated Devillis,
1991). Although there is no consensus on the best method of item reduction (Devillis,
49

1991), the factor analysis method appears to be the best-suited strategy to reduce the
number of SBQ items.
Another important direction for the continued development of the SBQ is to
determine its factor structure. When the individual SBQ items were initially generated,
they were grouped a priori into seven descriptive factor categories: “Global Winter
Negativity,” “External Control over Mood,” “Sensitivity to Cues Signaling Winter,”
“Avoidance of Winter,” “Personal Deficiency,” “Positive Expectations for Spring,” and
“Global Summer Positivism.” Therefore, a confirmatory factor analysis should be
conducted to determine if this a priori grouping applies, or if more appropriate concept-
related factors account for the majority of variance in total SBQ scores. In addition, after
determining the factor structure of the SBQ, internal reliability will need to be determined
for each factor.
Although the sample size of the current study was sufficient to determine the
preliminary psychometrics of the SBQ (i.e., validity and reliability), available guidelines
suggest that the sample size is too small to show a stable factor structure in the SBQ.
Large sample sizes are recommended for factor analyses to ensure that the resultant
groupings are not simply due to the effects of sampling error (Nunnally & Bernstein,
1994). Many studies suggest that the proportion of sample size to the number of items
used for factor analysis should be in the range of 4:1 to 5:1 (Streiner & Norman, 1999).
Based on these recommendations, the current 94-item SBQ would require a sample size
ranging from 376 to 470 to perform a reliable factor analysis. Guadagnoli and Velicer
(1988) conducted a Monte Carlo study to empirically determine the sample size required
for a factor analysis and determined that the necessary sample size depended on the
50

saturation level (i.e., the magnitude of the factor loadings; eigenvalues) and number of
items per factor. They suggested that a pattern composed of 10 to 12 items per factor
with loadings of 0.40 would generate an accurate solution at sample sizes greater than
150 and that factors with fewer than 10 items would require a sample size of 300 or more
(Guadagnoli & Velicer, 1988). Based on this approach, the sample size of this study
would need to be at least doubled and possibly tripled before a stable factor analytic
solution could be determined.
For this preliminary study of the SBQ, assessments took place across the year,
over three seasons (i.e., fall, winter, spring). Consequently, mean SBQ scores for each
season were examined to determine whether season affected SBQ scores. Interestingly,
mean SBQ scores for the total sample were descriptively highest in the summer, although
summer was not statistically different from fall or winter. However, only 17% of
participants were assessed in the summer and no participants were assessed in the spring.
Therefore, future studies with larger samples of college students and equal subsamples
assessed in each of the four seasons are needed to determine whether there are seasonal
differences in the SBQ.
Items on the SBQ reflect cognitions at two levels of Beck’s (1967, 1976)
cognitive model (i.e., intermediate beliefs and automatic thoughts). By definition,
automatic thoughts are moment-to-moment cognitions activated in response to the
situation at hand. Intermediate beliefs can also be situationally activated, but tend to
reflect a more latent, stable level of cognition. Unlike the ATQ and DAS, which measure
cognitions that wax and wane with depressive episodes (Persons & Miranda, 1992), it is
expected that the cognitions captured by the SBQ are more trait-like or dispositional in
51

nature. Spring and summer, the seasons when seasonal symptoms are in remission, could
serve to reinforce the cognitions assessed by the SBQ. For example, degree of conviction
in cognitions such as “I hate winter” and “I need sunshine to feel happy” could be
reinforced by positive affect experienced in the summer, when the photoperiod is longest
in duration.
One of the main limitations to this study was the use of a college sample. Ideally,
a study on the psychometric properties of the SBQ would include administration to a
large representative SAD sample. Logistical constraints (e.g., no funding, no research
assistants, limited time-frame, etc.) were the primary prohibitive reasons against using a
clinical sample. However, the use of a general college sample is an accepted practice in
the preliminary development of a new measure. Many questionnaires, including some of
the questionnaires used in this study (e.g., ATQ, DAS, SAS, and SATS) have used
college students to establish their preliminary psychometric properties. DeVillis (1991)
suggested that in order to concentrate on the adequacy of the items, the sample should be
sufficiently large (i.e., 100-300 participants) to eliminate subject variance as a significant
concern. Also, the SBQ scores of the two samples used in this study were normally
distributed, indicating a continuum of the construct of interest (i.e., attitudes and beliefs
about the changing seasons and the weather). Thus, although the exclusive use of a
college sample in the present study was not an ideal methodology, the sample used was
appropriate at this stage in the validation of the SBQ. Future validation studies should
include administration of the preliminary SBQ to clinically diagnosed and currently
episodic SAD patients.
52

Another main limitation to this study was the relatively small sample size. The
present study fell far short of an initial recruitment goal of 500 participants for a
comprehensive psychometric study, including factor analysis. The necessary sample size
to establish the basic psychometric properties (i.e., reliability and validity) of a new
measure ranges from 200 participants (Guilford, 1956; Kline, 1986) to 300 participants
(Nunnally, 1978). However, these recommendations are based on limited empirical
support. In addition, these suggestions do no take into account that for a confidence
interval (CI) of a given width, the sample size varies with the magnitude of the reliability
coefficient. For example, for a 90% CI with α set at 0.05, Nunnally’s N = 300
recommendation yields more power than is necessary to detect a statistically significant
difference for any reliability coefficient greater than 0.18. Similarly, Guilford’s and
Kline’s N = 200 recommendation results in more power than is required to detect any
reliability coefficient greater than 0.58 (Streiner & Norman, 1999).
For the above reasons, a sample size estimation for reliability studies was
calculated using a formula derived from Pearson correlations and Fisher’s Z
transformations (Streiner & Norman, 1999). The reliability coefficient of the SBQ
obtained in this preliminary investigation was α = .978. However, because the internal
reliability coefficient is expected to decrease after reducing the overall number of items, a
more conservative α of .90 was used to estimate sample size. With Type I error set at
0.05, a sample size of approximately 100 participants would be needed to obtain an α of
.90 with a 95% CI and only 65 participants would be needed for a 90% CI. Based on
Streiner and Norman’s (1999) sample size estimation procedure, the sample size included
in this study (N = 104) has sufficient power to determine the basic psychometrics (i.e.,
53

reliability and validity) of the SBQ. Nevertheless, the preliminary results obtained in this
study should be viewed with caution because of the overall relatively small sample size
and the use of a college student sample. More definitive validation of the SBQ will
require replication with larger samples (Devellis, 1991).
Another limitation relates to the reliability coefficient alpha obtained in the study.
All things being equal, the larger the alpha, the more reliable the measure (Streiner &
Norman, 1999). Devellis (1991) advises during the initial measure development stage to
strive for alphas that are slightly higher than the experimenter would like so that if alphas
decrease slightly when used in a new research context, they will still be acceptably high.
The high observed alpha may be appropriate for this stage in the validation of the SBQ.
Although, the high alpha obtained in this study could be interpreted as a positive and
favorable psychometric attribute of the SBQ, uncritically accepting high values of alpha
is problematic. First, coefficient alpha is dependent not only on the magnitude of the
correlations among the items, but also on the number of items in the scale. In other
words, a scale can be made to look more homogeneous (reliable) by simply doubling the
number of items, even though the average inter-item correlation remains the same.
Second, if alpha is too high, then it may suggest a high level of item redundancy (e.g.,
several items asking the same question in slightly different ways; Boyle, 1991). Streiner
and Norman (1999) suggest that alpha should be above 0.70 (Nunnally, 1978), but
probably not higher than 0.90. Because the SBQ contains a relatively large number of
items, the resulting alpha is likely inflated.
Another limitation of this study involves the exclusive use of self-report
measures. Because most SBQ items are highly face-valid, the SBQ is likely subject to
54

the same general responses biases inherent to all self-report questionnaires, including:
social desirability (i.e., faking bad or faking good), acquiescence bias (i.e., ‘yea-saying’
or ‘nay-saying’), and ceiling effects. There are few, if any, ways to counter these biases
in self-report measures. The main method used here to counter these biases, especially
ceiling effects, was imbedding 18 reverse-coded items in the SBQ. Therefore, the biases
related to self-report measures likely manifest in the SBQ, but their presence does not
likely invalidate the SBQ. In addition, this study could have been improved by including
a measure of social desirability to empirically examine this variable as a confound.
If found to be reliable and valid in larger studies and in studies using clinical SAD
samples, the SBQ could be used to provide further support for the psychological
vulnerability in Rohan’s (2002) integrative, cognitive-behavioral model of SAD. One
test of the SAD-specific cognitive component of the model would be a cross-sectional
comparison of individuals with SAD, individuals with nonseasonal depression, and
never-depressed controls on cognitive vulnerability measures to elucidate the unique vs.
overlapping cognitive features. A longitudinal study in which SAD patients are followed
over time (i.e., across all seasons) could help to determine whether the cognitions
assessed by the SBQ change over the seasons or remain consistent over time. This type
of design would determine whether SBQ scores wax and wane with a SAD episode.
Specifically, it could determine whether SBQ cognitions are only a concomitant (i.e., co-
occurrence) or possibly a consequence (i.e., “scar”) of SAD. In order to determine
whether SBQ cognitions are an antecedent to SAD, a prospective, developmental
psychopathology study in which a large sample from the general population is followed
from adolescence into adulthood would be needed. Some individuals would eventually
55

develop SAD and others would not. If SBQ scores were elevated prior to initial SAD
episode onset, SBQ cognitions may be an antecedent, and possibly causally related, to
SAD.
In addition to questionnaires like the SBQ that measure effortful cognitions,
future studies of cognitions that are unique to SAD should also include experimental
tasks to measure more implicit cognitions. The implicit associations test (IAT;
Greenwald, McGhee, & Schwartz, 1998) is an experimental cognitive task that assesses
automatic judgments (i.e., attitudes, thinking) outside of awareness. The IAT may
represent a less face-valid method of determining whether individuals with SAD have
implicit negative cognitions about low light availability or winter seasonal cues. Rohan
and colleagues (2003) are currently using an IAT to measure implicit cognitive
associations between light and positive valence and dark and negative valence.
Although premature at this time, a future potential use of the SBQ is to help
inform cognitive-behavioral therapy (CBT) for SAD and evaluate its mechanisms. If
further study determines that cognitions about the seasons and light availability are an
important cognitive feature of SAD, greater time and emphasis could be placed on this
type of cognitive restructuring in the CBT for SAD protocol (Rohan, 2000). According
to Beck’s (1967, 1976) cognitive model of depression, the modification of negative
thoughts about oneself, others, and the world is the purported mechanism of change in
cognitive therapy. In the same manner, maladaptive beliefs specific to individuals with
SAD, such as the thoughts measured by the SBQ, could represent the potential
mechanism of change underlying CBT for SAD. Rohan’s (2000) SAD-tailored CBT
protocol for seasonal depression includes cognitive restructuring with specific emphasis
56

on challenging negative automatic thoughts about the changing seasons, light availability,
and other environmental cues. This focus would presumably be most adequately
captured by the SBQ. Future studies could administer the SBQ repeatedly across CBT
sessions to determine whether cognitive change specific to beliefs about the seasons and
light availability precedes changes in depression. If change in SBQ cognitions is
identified as a mechanism of change in CBT for SAD, strategies aimed at changing SBQ-
type cognitions could be emphasized more in the treatment to enhance CBT’s efficacy.
57

Table 1
Participant Demographics, Depression Severity, and Seasonality
All Participants (N = 104)
PSU (n = 48)
AU (n = 56)
Statistic (Comparing Sites)
p
Gender, No. (%) Males Females
23 (22) 74 (71)
10 (21) 38 (79)
13 (23) 36 (64)
χ² (1, N=97) = .44
.51
Age, M (SD) 21.1 (4.7) 21.9 (5.9) 20.2 (3.0) t (95) = 1.77 .08
Race, No. (%) White Nonwhite Black Asian Nat. American HA/Pac Islander Latino International
69 (66) 31 (30) 5 (5)
17 (16) 0 (0) 1 (1) 4 (4) 4 (4)
34 (71) 14 (29) 1 (2)
10 (21) 0 (0) 1 (2) 1 (2) 1 (2)
35 (63) 17 (30) 4 (7) 7 (13) 0 (0) 0 (0) 3 (5) 3 (5)
χ² (1, N=97) = .01
.95
Education, No. (%) Some college High School Some College Assoc/2-yr Bachelors degree Bachelors/4-yr Masters Grad./Medical
88 (85) 12 (12) 74 (71) 2 (2) 9 (9) 3 (3) 4 (4) 2 (2)
39 (81) 2 (4)
37 (77) 0 (0) 9 (19) 3 (6) 4 (8) 2 (4)
49 (88) 10 (18) 37 (66) 2 (4) 0 (0) 0 (0) 0 (0) 0 (0)
χ² (1, N=97) = 16.3
.01
Testing, No. (%) Summer Fall Winter Spring
9 (9)
65 (63) 30 (29) 0 (0)
0 (0)
29 (60) 19 (40) 0 (0)
9 (16) 36 (64) 11 (20) 0 (0)
χ² (1, N=104) = 11.3
.01
Depression, M (SD) CES-D SIGH-SAD-SR
18.6 (11.8) 15.7 (11.8)
17.4 (11.6) 15.6 (12.2)
19.3 (12.0) 15.8 (11.5)
t (95) =.79 t (95) =.08
.43 .94
GSS, M (SD) 9.2 (5.1) 9.6 (5.4) 8.7 (4.9) t (95) = .81 .42 Notes. 7 participants did not report any demographic information. PSU = Penn State University, AU = American University. Summer = Jun. – Aug., Fall = Sep. – Nov., Winter = Dec. – Feb., Spring = Mar. – May, CES-D = Center for Epidemiologic Studies – Depression Scale, SIGH-SAD-SR = Structured Interview Guide for the Hamiliton Rating Scale for Depression – Seasonal Affective Disorders Version-Self Rating, GSS = Global Seasonality Score on the Seasonal Pattern Assessment Questionnaire (SPAQ).
58

Table 2 Pearson’s Correlations Between SBQ and Seasonal Measures
SAS SATS SPAQ SIGH-SAD-SR
Seasonal Beliefs Questionnaire (SBQ)
.836** .572** .493** .343**
Seasonal Attitudes Scale (SAS)
.533** .508** .362**
Seasonal Automatic Thoughts Survey (SATS)
.696** .650**
Seasonal Pattern Assessment Questionnaire (SPAQ)
.492**
Structured Interview Guide for the Hamilton Rating Scale for Depression – Seasonal Affiective Disorder - Self Report version (SIGH-SAD-SR)
Dysfunctional Attitudes Scale (DAS)
.232* .576** .445** .403**
Automatic Thoughts Questionnaire (ATQ)
.300** .684** .424** .708**
Center for Epidemiological Studies – Depression Scale (CES-D)
.288** .640** .511** .385**
Current Behaviors Scale (CBS)
.338** .485** .385** .501**
* p < 0.05 (2-tailed)
** p < 0.01 (2-tailed)
59

Table 3
Pearson’s Correlations Between SBQ and Nonseasonal Measures
DAS ATQ CES-D CBS
Seasonal Beliefs Questionnaire (SBQ)
.308** .286** .282** .277**
Dysfunctional Attitudes Scale (DAS)
.607** .574** .382**
Automatic Thoughts Questionnaire (ATQ)
.809** .486**
Center for Epidemiological Studies – Depression Scale (CES-D)
.444**
Current Behaviors Scale (CBS)
* p < 0.05 (2-tailed)
** p < 0.01 (2-tailed)
60

Figure 1. SBQ score distributions.
525.0500.0
475.0450.0
425.0400.0
375.0350.0
325.0300.0
275.0250.0
225.0200.0
175.0150.0
SBQ SCORES (PSU)Fr
eque
ncy
10
8
6
4
2
0
Std. Dev = 70.14
Mean = 359.2
N = 48.00
575.0550.0
525.0500.0
475.0450.0
425.0400.0
375.0350.0
325.0300.0
275.0250.0
225.0200.0
175.0
SBQ SCORES (AU)
Freq
uenc
y
7
6
5
4
3
2
1
0
Std. Dev = 93.78
Mean = 387.9
N = 55.00
61

List of Appendices
Appendix A. Spectrum of Disease Model for SAD.
Appendix B. Integrative, Cognitive-Behavioral Model.
Appendix C. Dysfunctional Attitudes Scale (DAS).
Appendix D. Automatic Thoughts Questionnaire (ATQ).
Appendix E. Young Schema Questionnaire (YSQ).
Appendix F. Seasonal Attitudes Scale (SAS).
Appendix G. Seasonal Automatic Thoughts Survey (SATS).
Appendix H. Seasonal Beliefs Questionnaire (SBQ).
Appendix I. SBQ Feedback Form.
Appendix J. Center for Epidemiological Studies – Depression Scale (CES-D).
Appendix K. Structured Interview Guide for the Hamilton Rating Scale for Depression
– Seasonal Affective Disorder Version - Self Report (SIGH-SAD-SR).
Appendix L. Seasonal Pattern Assessment Questionnaire (SPAQ).
Appendix M. Current Behaviors Scale (CBS).
62

APPENDIX A
Spectrum of Disease Model for SAD (Lam et al., 2001)
63

APPENDIX B
Integrative, Cognitive-Behavioral Model (Rohan, 2002)
64
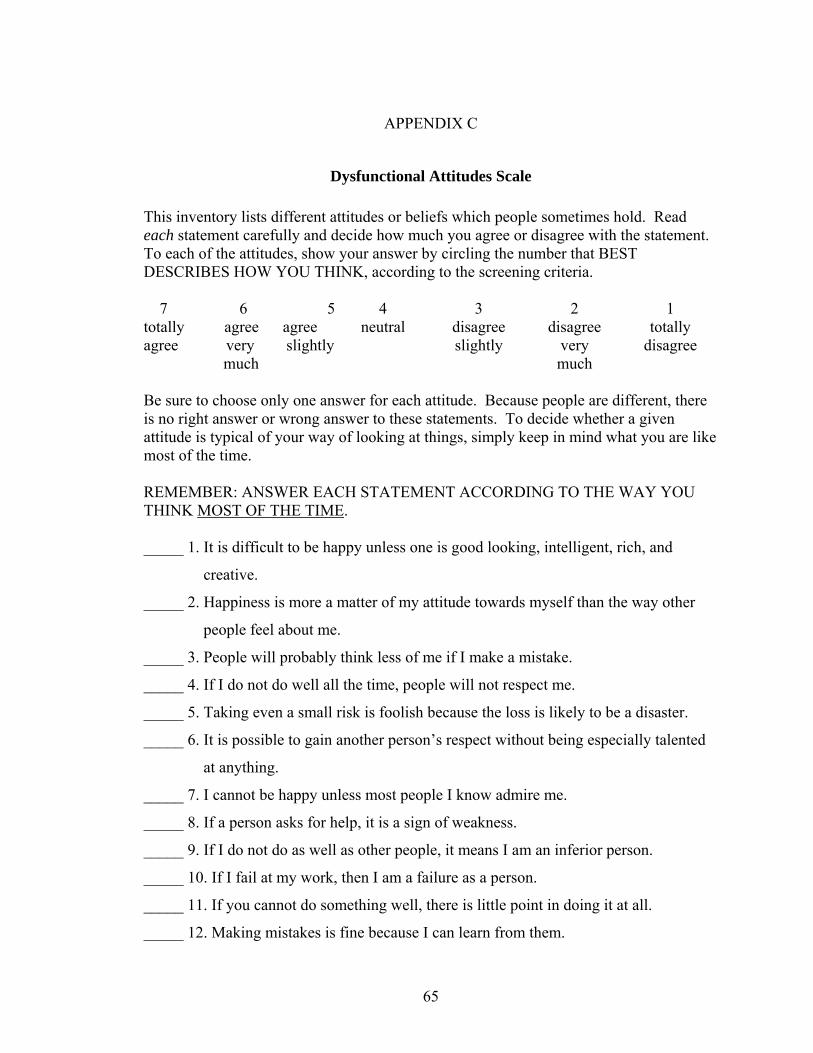
APPENDIX C
Dysfunctional Attitudes Scale
This inventory lists different attitudes or beliefs which people sometimes hold. Read each statement carefully and decide how much you agree or disagree with the statement. To each of the attitudes, show your answer by circling the number that BEST DESCRIBES HOW YOU THINK, according to the screening criteria. 7 6 5 4 3 2 1 totally agree agree neutral disagree disagree totally agree very slightly slightly very disagree much much Be sure to choose only one answer for each attitude. Because people are different, there is no right answer or wrong answer to these statements. To decide whether a given attitude is typical of your way of looking at things, simply keep in mind what you are like most of the time. REMEMBER: ANSWER EACH STATEMENT ACCORDING TO THE WAY YOU THINK MOST OF THE TIME. _____ 1. It is difficult to be happy unless one is good looking, intelligent, rich, and
creative.
_____ 2. Happiness is more a matter of my attitude towards myself than the way other
people feel about me.
_____ 3. People will probably think less of me if I make a mistake.
_____ 4. If I do not do well all the time, people will not respect me.
_____ 5. Taking even a small risk is foolish because the loss is likely to be a disaster.
_____ 6. It is possible to gain another person’s respect without being especially talented
at anything.
_____ 7. I cannot be happy unless most people I know admire me.
_____ 8. If a person asks for help, it is a sign of weakness.
_____ 9. If I do not do as well as other people, it means I am an inferior person.
_____ 10. If I fail at my work, then I am a failure as a person.
_____ 11. If you cannot do something well, there is little point in doing it at all.
_____ 12. Making mistakes is fine because I can learn from them.
65

7 6 5 4 3 2 1 totally agree agree neutral disagree disagree totally agree very slightly slightly very disagree much much
_____ 13. If someone disagrees with me, it probably indicates that he does not like me.
_____ 14. If I fail partly, it is as bad as being a complete failure.
_____ 15. If other people know what you are really like they will think less of you.
_____ 16. I am nothing if a person I love doesn’t love me.
_____ 17. One can get pleasure from an activity regardless of the end result.
_____ 18. People should have a reasonable likelihood of success before undertaking
anything
_____ 19. My value depends greatly on what others think of me.
_____ 20. If I don’t set the highest standards for myself, I am likely to end up a second
rate person.
_____ 21. If I am to be a worthwhile person, I must be truly outstanding in one major
respect.
_____ 22. People who have good ideas are more worthy than those who do not.
_____ 23. I should be upset if I make a mistake.
_____ 24. My own opinions of myself are more important than others’ opinions of me.
_____ 25. To be a good, moral, worthwhile person, I must help everyone who needs it.
_____ 26. If I ask a question, it makes me look inferior.
_____ 27. It is awful to be disapproved of by people important to you.
_____ 28. If you don’t have other people to lean on, you are bound to be sad.
_____ 29. I can reach important goals without slave driving myself.
_____ 30. It is possible for a person to be scolded and not get upset.
_____ 31. I cannot trust other people because they might be cruel to me.
_____ 32. If others dislike you, you cannot be happy.
_____ 33. It is best to give up your own interests in order to please people.
_____ 34. My happiness depends more on other people than it does on me.
_____ 35. I do not need the approval of other people in order to be happy.
_____ 36. If a person avoids problems, the problem tends to go away.
66

7 6 5 4 3 2 1 totally agree agree neutral disagree disagree totally agree very slightly slightly very disagree much much
_____ 37. I can be happy even if I miss out on many of the good things in life.
_____ 38. What other people think about me is important.
_____ 39. Being isolated from others is bound to lead to unhappiness.
_____ 40. I can find happiness without being loved by another person.
67

APPENDIX D
Automatic Thoughts Questionnaire
Instructions: Listed below are a variety of thoughts that pop into people’s heads. Please read each thought and indicate how frequently, if at all, the thought occurred to you over the last week. Please read each item carefully and put the number in the blank that most closely corresponds to your answer. 1 2 3 4 5 not at all sometimes moderately often often all the time
_____ 1. I feel like I’m up against the world.
_____ 2. I’m no good.
_____ 3. Why can’t I ever succeed?
_____ 4. No one understands me.
_____ 5. I’ve let people down.
_____ 6. I don’t think I can go on.
_____ 7. I wish I were a better person.
_____ 8. I’m so weak.
_____ 9. My life’s not going the way I want it to.
_____ 10. I’m so disappointed in myself.
_____ 11. Nothing feels good anymore.
_____ 12. I can’t stand this anymore.
_____ 13. I can’t get started.
_____ 14. What’s wrong with me?
_____ 15. I wish I were somewhere else.
_____ 16. I can’t get things done.
_____ 17. I hate myself.
_____ 18. I’m worthless.
_____ 19. Wish I could just disappear.
_____ 20. What’s the matter with me?
_____ 21. I’m a loser.
68

1 2 3 4 5 not at all sometimes moderately often often all the time
_____ 22. My life is a mess.
_____ 23. I’m a failure.
_____ 24. I’ll never make it.
_____ 25. I feel so helpless.
_____ 26. Something has to change.
_____ 27. There must be something wrong with me.
_____ 28. My future is bleak.
_____ 29. It’s just not worth it.
_____ 30. I can’t finish anything.
69

APPENDIX E
Young Schema Questionnaire –Short Form
INSTRUCTIONS: Listed below are statements that a person might use to describe himself or herself. Please read each statement and decide how well it describes you. When there you are not sure, base your answer on what you emotionally feel, not on what you think to be true. Choose the highest rating from 1 to 6 that describes you and write the number in the space before the statement. RATING SCALE:
1 = Completely untrue of me. 2 = Mostly untrue of me 3 = Slightly more true than untrue 4 = Moderately true of me 5 = Mostly true of me 6 = Describes me perfectly
1. _____ Most of the time, I haven't had someone to nurture me, share him/herself with me, or care deeply about everything that happens to me.
2. _____ In general, people have not been there to give me warmth, holding, and affection. 3. _____ For much of my life, I haven't felt that I am special to someone. 4. _____ For the most part, I have not had someone who really listens to me,
understands me, or is tuned into my true needs and feelings. 5. _____ I have rarely had a strong person to give me sound advice or direction when I'm not sure
what to do. *ed 6. _____ I find myself clinging to people I'm close to, because I'm afraid they'll leave me. 7. _____ I need other people so much that I worry about losing them. 8. _____ I worry that people I feel close to will leave me or abandon me. 9. _____ When I feel someone I care for pulling away from me, I get desperate. 10. ____ Sometimes I am so worried about people leaving me that I drive them away. *ab 11. _____ I feel that people will take advantage of me. 12.______I feel that I cannot let my guard down in the presence of other people, or else they will
intentionally hurt me. 13.______It is only a matter of time before someone betrays me. 14. _____ I am quite suspicious of other people's motives. 15. _____ I'm usually on the lookout for people's ulterior motives. *ma 16. _____ I don't fit in. 17. _____ I'm fundamentally different from other people. 18. _____ I don't belong; I'm a loner. 19. _____ I feel alienated from other people. 20. _____ I always feel on the outside of groups. *si 21. _____ No man/woman I desire could love me one he/she saw my defects. 22. _____ No one I desire would want to stay close to me if he/she knew the real me.
70

23. _____ I'm unworthy of the love, attention, and respect of others. 24. _____ I feel that I'm not lovable. 25. _____ I am too unacceptable in very basic ways to reveal myself to other people. *ds 26. _____ Almost nothing I do at work (or school) is as good as other people can do. 27. _____ I'm incompetent when it comes to achievement. 28. _____ Most other people are more capable than I am in areas of work and achievement. 29. _____ I'm not as talented as most people are at their work. 30. _____ I'm not as intelligent as most people when it comes to work (or school). *fa 31. _____ I do not feel capable of getting by on my own in everyday life. 32. _____ I think of myself as a dependent person, when it comes to everyday functioning. 33. _____ I lack common sense. 34. _____ My judgment cannot be relied upon in everyday situations. 35. _____ I don't feel confident about my ability to solve everyday problems that come up. *di 36. _____ I can't seem to escape the feeling that something bad is about to happen. 37. _____ I feel that a disaster (natural, criminal, financial, or medical) could strike at any
moment. 38. _____ I worry about being attacked. 39. _____ I worry that I'll lose all my money and become destitute. 40. _____ I worry that I'm developing a serious illness, even though nothing serious has been
diagnosed by a physician. *vh 41. _____I have not been able to separate myself from my parent(s), the way other people my age
seem to. 42. _____ My parent(s) and I tend to be over involved in each other's lives and problems. 43. _____ It is very difficult for my parent(s) and me to keep intimate details from each other,
without feeling betrayed or guilty. 44. _____ I often feel as if my parent(s) are living through me--I don't have a life of my own. 45. _____I often feel that I do not have a separate identity from my parent(s) or partner. *em 46. _____ I think that if I do what I want, I'm only asking for trouble. 47. _____ I feel that I have no choice but to give in to other people's wishes, or else they will
retaliate or reject me in some way. 48. _____ In relationships, I let the other person have the upper hand. 49. _____ I've always let others make choices for me, so I really don't know what I want for
myself. 50. _____ I have a lot of trouble demanding that my rights be respected and that my feelings be
taken into account. *sb 51. _____ I'm the one who usually ends up taking care of the people I'm close to. 52. _____ I am a good person because I think of others more than of myself. 53. _____ I'm so busy doing for the people that I care about, that I have little time for myself. 54. _____ I've always been the one who listens to everyone else's problems. 55. _____ Other people see me as doing too much for others and not enough for myself. *ss 56. _____ I am too self-conscious to show positive feelings to others (e.g., affection, showing I
care). 57. _____ I find it embarrassing to express my feelings to others. 58. _____ I find it hard to be warm and spontaneous.
71

59. _____ I control myself so much that people think I am unemotional. 60. _____ People see me as uptight emotionally. *ei 61. _____ I must be the best at most of what I do; I can't accept second best. 62. _____ I try to do my best; I can't settle for "good enough." 63. _____ I must meet all my responsibilities. 64. _____ I feel there is constant pressure for me to achieve and get things done. 65. _____ I can't let myself off the hook easily or make excuses for my
mistakes. *us 66. _____ I have a lot of trouble accepting "no" for an answer when I want something from other
people. 67. _____ I'm special and shouldn't have to accept many of the restrictions placed on other
people. 68. _____ I hate to be constrained or kept from doing what I want. 69. _____ I feel that I shouldn't have to follow the normal rules and conventions other people do. 70. _____ I feel that what I have to offer is of greater value than the contributions of others. *et 71. _____ I can't seem to discipline myself to complete routine or boring tasks. 72. _____ If I can't reach a goal, I become easily frustrated and give up. 73. _____ I have a very difficult time sacrificing immediate gratification to achieve a long-range
goal. 74. _____ I can't force myself to do things I don't enjoy, even when I know it's for my own good. 75. _____ I have rarely been able to stick to my resolutions. *is
72

APPENDIX F
Seasonal Attitudes Scale
Instructions: Please indicate to what extent the following statements about the seasons adequately describe your attitudes. There are no right or wrong answers, just indicate what you generally think or feel. Put the number that corresponds to your choice in the blank before the item. 1 2 3 4 5 6 7 does not describe describes me describes me me at all somewhat very well ___ 1. I have always been affected by the changing seasons ___ 2. As winter approaches, my energy level begins to decrease. ___ 3. Sunny long days make me feel the best. ___ 4. I notice that I like to eat different types of food depending on the season. ___ 5. My appetite increases as the amount of daylight decreases. ___ 6. I feel the best during the summer months. ___ 7. As winter approaches, I start to feel down. ___ 8. During the summer months, I start to feel less depressed. ___ 9. I believe I am affected by the changing seasons more than most people. ___ 10. When the seasons change, I know that it will affect my mood and behavior. ___ 11. As summer approaches, I begin to feel more energetic. ___ 12. I often think about the changing seasons and what will happen to my mood. ___ 13. I tend to gain weight during the winter months. ___ 14. My energy level starts to decrease as the amount of daylight decreases. ___ 15. During the winter months, I tend to engage in fewer social activities. ___ 16. I believe there is a close relationship between the changing seasons and my
mood.
73

1 2 3 4 5 6 7 does not describe describes me describes me me at all somewhat very well ___ 17. I feel more active when there is more sunlight in the day. ___ 18. During the summer months, I tend to lose weight. ___ 19. When the days start getting shorter, I start feeling worse. ___ 20. During the summer months, I begin to feel like my old self again. ___ 21. I feel the worst during the winter months. ___ 22. I am very aware of how seasons affect my mood and behavior. ___ 23. I feel that there is little to do to improve my mood in the winter months. ___ 24. When the amount of daylight starts increasing in the spring, I start to feel better. ___ 25. I believe that my behavior is affected by the changing seasons.
74

APPENDIX G
Seasonal Automatic Thoughts Survey
Directions: Below is a list of thoughts that people might have during the day. Please read each thought and indicate how often, if ever, you had each thought in the past week. Please read each item carefully and write the number in the blank that best describes how frequently you had the thought in the past week. 1 2 3 4 5 not at all occasionally moderately often often all the time ___ 1. I worry that I won’t have enough energy. ___ 2. I’m going to feel worse when the days get much shorter. ___ 3. I am overwhelmed. ___ 4. I shouldn’t be eating this much. ___ 5. No one else feels this way every year. ___ 6. The amount of daylight has been changing lately. ___ 7. I am dreading the next few months. ___ 8. I’m too tired to do anything. ___ 9. I am worried about how bad I will feel this winter. ___ 10. I wish spring would get here sooner. ___ 11. It is hard to get out of bed in the morning. ___ 12. I am always going to feel down in the winter months. ___ 13. There are signs that the season is changing. ___ 14. I can’t control my food cravings. ___ 15. I’m going to be depressed until spring. ___ 16. I can’t do this much longer. ___ 17. There is nothing that I can do to stop depression from coming.
75

1 2 3 4 5 not at all occasionally moderately often often all the time ___ 18. I dread the cold. ___ 19. Everything is so dark and dreary. ___ 20. I just want to crawl into bed for a long time. ___ 21. There are not enough hours in the day to accomplish everything I need to do. ___ 22. It is hard to be social.
76

APPENDIX H
Seasonal Beliefs Questionnaire
Directions: Below is a list of thoughts, attitudes, and beliefs about the seasons that people might have. Please read each statement carefully and decide how much you agree or disagree with it. For each item, write the number that corresponds to how much you agree or disagree with that statement in the blank space in front of it. Answer each statement based on HOW YOU GENERALLY THINK. 1 2 3 4 5 6 7 totally disagree disagree neutral agree agree totally disagree very slightly slightly very agree much much ___ 1. I function better when the sun is shining.
___ 2. I feel trapped in the winter.
___ 3. I am not concerned with the amount of daylight
___ 4. My mood falls with the leaves.
___ 5. Winter days are better if the sun is out.
___ 6. Winter is a problem for me.
___ 7. I am neutral to the end of summer.
___ 8. I wish I could take a vacation to a warm place.
___ 9. I need sunshine to feel happy.
___ 10. Winter is the best season of the year.
___ 11. I feel cheated when the days get shorter.
___ 12. I can’t be productive on dark, dreary days.
___ 13. I hate winter.
___ 14. Dark, gloomy days are depressing.
___ 15. I crave light.
___ 16. As the days get longer, I feel the same.
___ 17. Dark, winter days are the worst.
___ 18. The weather should not affect me.
___ 19. When the first flowers bloom, my slump begins to lift.
___ 20. Dark, winter days bring me down.
___ 21. I dread the days getting shorter.
___ 22. I wish the summer would never end.
77

1 2 3 4 5 6 7 totally disagree disagree neutral agree agree totally disagree very slightly slightly very agree much much
___ 23. Winter is such a hassle.
___ 24. When I look out the window, my mood adjusts to the weather.
___ 25. I look forward to winter.
___ 26. When the leaves change, I know it won’t be long until I start to feel down.
___ 27. I feel great all summer long.
___ 28. Bright days are depressing.
___ 29. Everything is easier in the summertime.
___ 30. There’s no point to winter.
___ 31. Losing minutes of daylight in winter isn’t fair.
___ 32. I don’t pay much attention to the changing seasons.
___ 33. Everything looks dead during winter.
___ 34. I wish I could live some place warmer.
___ 35. I should give myself a break because of the bad weather.
___ 36. I can’t do anything when it’s dark or cold.
___ 37. Spring is no better than any other season.
___ 38. Everything takes so much effort in the winter.
___ 39. I can’t get motivated in the winter.
___ 40. It’s difficult to feel good on dark, dreary days.
___ 41. The sun energizes me.
___ 42. I thrive across all the seasons.
___ 43. I’m in a fog all winter long.
___ 44. As the days grow shorter, I anticipate the coming winter.
___ 45. I can’t function when it’s cold.
___ 46. I wish I could just skip winter.
___ 47. I dread the summertime.
___ 48. I wish we never had dreary weather.
___ 49. I feel really down in the winter.
___ 50. It’s hard to get up in the dark.
78

1 2 3 4 5 6 7 totally disagree disagree neutral agree agree totally disagree very slightly slightly very agree much much
___ 51. I love winter.
___ 52. I count the days until spring.
___ 53. It’s not fair that I feel down every winter.
___ 54. The weather determines how I feel.
___ 55. Sunlight doesn’t affect my mood.
___ 56. I’m a summer person.
___ 57. Winter feels so long.
___ 58. Spring revitalizes me.
___ 59. The end of daylight savings signals the downturn of my mood.
___ 60. I hate the cold.
___ 61. There’s something wrong with me in the winter.
___ 62. I get more productive as the days grow longer.
___ 63. Winter is not a problem for me.
___ 64. I wish I could hibernate the winter away.
___ 65. All is well if the sun is shining.
___ 66. It’s easiest to just stay in bed during winter.
___ 67. I function well in the winter.
___ 68. I don’t expect much of myself in the winter.
___ 69. I can’t handle the winter.
___ 70. Dark, dreary days exhaust me.
___ 71. I feel the same as the days grow shorter.
___ 72. Things seem worse in the winter.
___ 73. I can’t seem to get going on dark, dreary mornings.
___ 74. Summer empowers me.
___ 75. As the days get longer, my mood gets better.
___ 76. I’m a failure in the winter.
___ 77. I welcome cold winter days.
___ 78. I’m stuck in a rut in the winter.
79

1 2 3 4 5 6 7 totally disagree disagree neutral agree agree totally disagree very slightly slightly very agree much much
___ 79. Winter is draining.
___ 80. I should be happy like other people in the wintertime.
___ 81. The transition into fall and winter is pleasant.
___ 82. I wish I could control the sunlight.
___ 83. Winter is my bad time.
___ 84. I can’t cope with dark days.
___ 85. How I feel is irrelevant to the weather.
___ 86. I am going to have the winter blues every year.
___ 87. I love sunny, summer days.
___ 88. I’m not a winter person.
___ 89. I’m always happier when it’s warmer.
___ 90. My outlook on life gets better with the arrival of spring.
___ 91. I don’t feel like being around anyone in the winter.
___ 92. Summer lasts too long.
___ 93. I can’t snap out of my winter funk.
___ 94. I’m ineffective in the winter.
* Bold indicates reverse items (for manuscript clarification; actual questionnaire items
are not bolded)
80

APPENDIX I
SBQ Feedback Form
1. Were the instructions on the first page clear? If NO, how could they be changed to improve clarity?
2. Were there any specific items that were unclear or that did not make sense? Please explain.
3. What is your opinion on the length of this questionnaire / number of items? (We plan to reduce the number of items by about half from what it is now for the final version).
4. Are there any specific items that you think should not be included that were not included in this questionnaire? Please explain.
5. Are there any important items that you think should be included that were not included in this questionnaire?
6. Do you have any other general comments, ideas, or opinions about this questionnaire that you would like to share?
THANK YOU for completing this questionnaire and for providing your feedback! We value your comments and suggestions, which will help to improve this questionnaire.
81

APPENDIX J
Center for Epidemiological Studies – Depression Scale
82

APPENDIX K
Structured Interview Guide for the Hamilton Rating Scale for Depression –
Seasonal Affective Disorder Version - Self Report
(SIGH-SAD-SR)
Have you been physically ill in the past week? Circle one: yes / no. If yes, please explain: ________________________________________________________________ Females (pre-menopausal): About when did your last period begin? ___ ___ / ___ ___ / ___ ___ In the questions that follow, please circle the number of one alternative in each set that best describes how you have been during the past week. If you have changed during the last few days, circle the alternative that best describes how you are today. Before you select an alternative in each set, read all of the choices to make sure you pick the most accurate one. DURING THE PAST WEEK . . . H1 0 - I have not been feeling down or depressed at all 1 - I have been feeling somewhat down or depressed. 2 - I have been feeling quite down or depressed. 3 - I have been feeling and looking very depressed (or others have said so). 4 - I haven't been able to think about anything except how bad or depressed I feel. H2 0 - I have been keeping busy and have been interested in the things I've been doing. 1 - I haven't been quite as interested in doing things as I used to be. 2 - I have definitely not been as interested in things as I used to be, and I have had to push myself to do them. 3 - I have not been doing much because I feel so bad. 4 - I have stopped doing nearly everything — I just sit or sleep most of the day. Note: When an item refers to how you "normally" are, it means when you are feeling OK, or as close to OK as you get. A1 0 - I have been interested in socializing with others as much as normal. 1 - I have still been interacting with others but am less interested in doing so. 2 - I have been interacting less with other people in social situations. 3 - I have been interacting less with others at home or at work. 4 - I have become quite withdrawn at home or at work.
83

DURING THE PAST WEEK . . . Page 2 H3 (This question is about your interest in sex, not your actual sexual activity 0 - My interest in sex has been about the same as it was before I became depressed, or greater than normal. 1 - I have not been quite as interested in sex as I was before I became depressed. 2 - I have been much less interested in sex than I was before I became depressed. Remember, "normal" means how you're feeling when you're OK. H4 0 - My appetite has been normal or greater than normal. 1 - I have had less appetite than normal, but I eat without anyone having to urge me. 2 - I have had so little appetite that I have not been eating regularly unless someone urges me to. H5 (Circle "0" for this question if you have lost weight due to dieting,or have lost weight that you had previously gained when you were depressed.) 0 - I don't think I have lost any weight since I became depressed, or if I have lost weight, I have started to gain it back. 1 - I have probably lost some weight (that I haven't gained back at all) because I haven't felt like eating. 2 - I have definitely lost weight (that I haven't gained back at all) because I haven't felt like eating. A2 0 - I have not gained weight above my normal level in the past week. 1 - I have probably gained weight (two or more pounds) in the past week, and my current weight is above normal for me. 2 - I have definitely gained weight (two or more pounds) in the past week, and my current weight is above normal for me. A3 (This question is about your appetite, not what you have actually been eating 0 - My appetite has been normal or less than normal. 1 - I have wanted to eat just a little more than normal. 2 - I have wanted to eat somewhat more than normal. 3 - I have wanted to eat much more than normal. A4 (This question is about what you have actually been eating.) 0 - I have not been eating more than normal. 1 - I have been eating a little more than normal. 2 - I have been eating somewhat more than normal. 3 - I have been eating much more than normal.
84

DURING THE PAST WEEK . . . Page 3 A5 0 - I have not been craving or eating sweets or starches any more than when I feel normal. 1 - I have been craving or eating sweets or starches somewhat more than when I feel normal. 2 - I have been craving or eating sweets or starches much more than when I feel normal. 3 - I have had an irresistible craving for sweets or starches. If you circled "1", "2" or "3" for the question above, please also answer the following: The craving or eating has focused mainly on: 1 - sweets 2 - starches 3 - both sweets and starches List any specific foods you have been craving: _______________________ Which of the following describes you best? 1 - I have been craving sweets or starches, but have been able to control eating them. 2 - I have actually been eating sweets or starches excessively. At what time of day has the craving or eating usually occurred? 0 - It can occur at any time — it comes and goes. 1 - It usually occurs in the morning. 2 - It usually occurs in the afternoon or evening. 3 - It has been nearly all the time. H6 0 - I have not had any difficulty falling asleep at night. 1 - Some nights it has taken me longer than half an hour to fall asleep. 2 - I have had trouble falling asleep every night. H7 0 - I have not been waking up in the middle of the night, or if I have gotten up to go to the bathroom, I have fallen right back asleep. 1 - My sleep has been restless and disturbed during the night. 2 - I have been waking during the night without being able to get right back to sleep, or I've been getting out of bed in the middle of the night (not just to go to the bathroom).
85

DURING THE PAST WEEK . . . Page 4 H8 0 - I have been oversleeping or waking up at a reasonable hour in the morning. 1 - I have been waking up very early in the morning, but I have been able to go back to sleep. 2 - I have been waking up very early in the morning without being able to go back to sleep, especially if I've gotten out of bed. Remember, "normal" means how you're feeling when you're OK. A6 (When I am feeling normal, I usually sleep about ___ hours each day, including naps.) 0 - I have been sleeping no more than I usually do when I feel normal. 1 - I have been sleeping at least one hour more than I usually do when I feel normal. 2 - I have been sleeping at least two hours more than I usually do when I feel normal. 3 - I have been sleeping at least three hours more than I usually do when I feel normal. 4 - I have been sleeping at least four hours more than I usually do when I feel normal. The following question asks about how difficult it has been waking up in the morning: 0 - Usually I have been waking up on time and quickly feeling wide awake. 1 - Although I've had to depend on an alarm clock to wake up on time, I've usually felt wide awake within 30 minutes. 2 - I've been feeling sleepy for 30 minutes or longer after I wake up. 3 - It's been a major effort to get out of bed, and I've continued to feel sleepy for at least three hours after I wake up. 4 - I've been falling back asleep after the alarm, or feeling sleepy for at least five hours after I first wake up. If you have been using an alarm, what time is it set for? ____:____ AM / PM (circle) H9 0 - I have not had a heavy feeling in my limbs, back or head. ↓ 1 - I have had a heavy feeling in my limbs, back, or head, some of the time. 2 - I have had a heavy feeling in my limbs, back, or head, a lot of the time. H9b 0 - I have not been bothered by backaches, headache, or muscle aches. ↓ 1 - I have been bothered some of the time by backaches, headache, or muscle aches. 2 - I have been bothered a lot of the time by backaches, headache, or muscle aches. Remember, "normal" means how you're feeling when you're OK. H9c 0 - I have not been feeling more tired than normal. 1 - I have felt slightly more tired than normal. 2 - I have been more tired than normal for at least a few hours per day. 3 - I have felt tired much of the time most days. 4 - I have felt an overwhelming fatigue all of the time.
86

DURING THE PAST WEEK . . . Page 5 H10 0 - I have not been putting myself down, or feeling like a failure or that I have let other people down, or feeling guilty about things I have done. 1 - I have been feeling like a failure or that I have let other people down. 2 - I have been feeling very guilty or thinking a lot about bad things I have done, or bad mistakes I have made. 3 - I believe that my being depressed is a punishment for something bad that I've done. 4 - I have been hearing voices accusing me of bad things, or seeing things that are scary, that others said were not really there. H11 0 - I have not had any thoughts about dying or about hurting or killing myself, or that life is not worth living. 1 - I have had thoughts that life is not worth living, or that I'd be better off dead. 2 - I have thought about dying, or wish I were dead. 3 - I have thought about killing myself, or I have done something to hurt myself. 4 - I have tried to kill myself. H12 0 - I have not been feeling especially tense or irritable, or worrying a lot. 1 - I have been feeling somewhat tense or irritable. 2 - I have been worrying about little unimportant things — that I wouldn't ordinarily worry about — or I have been excessively tense or irritable. 3 - Other people notice that I look or sound tense, anxious, or fearful. 4 - I feel tense, anxious, or fearful all of the time. Check off all the following physical symptoms that have bothered you in the past week: _ dry mouth _ cramps _ hyperventilating _ gas _ belching _ sighing _ indigestion _ heart palpitations _ having to urinate frequently _ diarrhea _ headaches _ sweating If you checked off any of the symptoms listed above, please also answer the following: (0 if none) 1 - Altogether, the symptom(s) have only been bothering me a little bit. 2 - Altogether, the symptom(s) have been bothering me somewhat. 3 - Altogether, the symptom(s) have been bothering me a lot. 4 - Altogether, the symptom(s) have been making it difficult for me to function.
87

DURING THE PAST WEEK . . . Page 6 Circle one of the following: 0a - These symptoms bother me only when I am depressed. 0b - These symptoms bother me from time to time, but they get worse when I’m depressed. 2 - In my experience, these symptoms occur whether or not I am depressed. 3 - I think these symptoms are due to physical illness or a medication that I am taking. If you circled "3" above, what illness or medication? __________________________ H14 0 - I have not been thinking much about my physical health. 1 - I have been worrying about being or becoming physically ill. 2 - I have been spending most of my time worrying about my physical health. 3 - I have been complaining frequently about how I feel physically, or asking for help a lot. 4 - I am sure that I have a physical disease, even though the doctors tell me that I don't. Have you had a specific medical problem this week? If yes, please describe: H15 0a - Although previously I was depressed, this past week I have felt distinctly better. (recode 2 to 0?) 0b - I have become depressed, or have continued feeling depressed, in the past week. If neither 0a nor 0b is true, circle 1 or 2 below: 1 - I haven't been feeling very good, but it's not because of depression — rather, I ate something bad, or overworked, or had a virus, or just have been needing a rest. 2 - Depression has not been a problem of mine, now or before. Remember, "normal" means how you're feeling when you're OK. H16 0 - My rate of speech and thought are normal. 1 - My speech and physical movements are slightly slowed down, or my thoughts are slightly slower, which has made it difficult for me to concentrate. 2 - My physical movements, speech or thoughts are somewhat slow compared to normal, and other people have noticed this. 3 - My physical movements are markedly slower, or my speech or thoughts are so slow that it has been hard to have a conversation with me. 4 - My physical movements are greatly slowed down, or my speech and thoughts are so slow that it has been difficult for me to think or talk at all.
88

DURING THE PAST WEEK . . . Page 7 H17 0 - I have not been restless or fidgety. 1 - I have been somewhat restless, or sometimes have been playing with my hands, hair, or other things. 2 - I have been very restless, or often have been playing with my hands, hair, or other things. 3 - I have trouble sitting still, and need to keep moving about a lot of the time. 4 - I am unable to sit still, or have been wringing my hands, biting my nails, pulling my hair, or biting my lips, nearly all the time. H18a 0 - Overall, the problems I have been asked about in this questionnaire have bothered me equally in the morning and in the late evening. 1 - Overall, these problems have bothered me more in the morning. 2 - Overall, these problems have bothered me more in the late evening. H18b If you circled "1" or "2" for the question above, please also circle one of the following: (0 if none) 1 - I have been feeling only a little worse in the mornings (or evenings). 2 - I have been feeling much worse in the mornings (or evenings). In the following question, a "slump" means a temporary reduction in mood or energy from which you recover, at least partially, later in the day. 0 - I have not regularly had a slump in my mood or energy in the afternoon or evening. 1 - I have regularly had a slump in my mood or energy in the afternoon or evening. If you circled "1" for the question above, please also answer the following: The slumps usually begin about ___ p.m. and end about ___ p.m. Please specify: 0 - Once these slumps occur, they usually last till bedtime. 1 - I usually come out of these slumps at least an hour before bedtime. A8 If you usually come out of these slumps at least an hour before bedtime, please also circle one of the following: (0 if none) 1 - Usually, the slumps have been only mild in intensity. 2 - Usually, the slumps have been moderate in intensity. 3 - Usually, the slumps have been severe in intensity. How would you characterize the slumps? 0 - They are mostly in my mood. 1 - They are mostly in my energy. 2 - They are in both mood and energy.
89

DURING THE PAST WEEK . . . Page 8 H19 0 - I have not been having any sensation that things around me are unreal, or that I'm in a dream. 1 - I have been having only very mild sensations of unreality. 2 - I have been having some definite sensations of unreality or of being in a dream. 3 - I have been having sensations of unreality a lot of the time. 4 - I have been so bothered by sensations of unreality that it has been hard for me to function. H20 0 - I have not thought that anyone was trying to give me a hard time or hurt me. 1 - I have been suspicious of people. 2 - I have noticed certain things that probably mean that someone is trying to harm me. 3 - I am sure someone is trying to get me or hurt me. H21a 0 - I have not had things that I've had to do over and over again, like checking the ↓ locks on the doors several times, or repeatedly washing my hands. 1 - I have been compelled to check certain things repeatedly — more than should be necessary. 2 - I have been spending excessive amounts of time checking certain things repeatedly. H21b 0 - I have not been bothered by thoughts that run over and over in my mind but don't make any sense to me. 1 - I have been a little bothered by thoughts that keep running through my mind but don't make any sense to me. 2 - I have been very bothered by thoughts that keep running through my mind but don't make any sense to me. ( T29 = H21 + A8) (SIGH-SAD 29-item total)
90

APPENDIX L
Seasonal Pattern Assessment Questionnaire
The purpose of this form is to find out how your mood and behavior change over time. NOTE: We are interested in your experience; not others you may have observed. To what degree do the following change with the seasons? Please indicate the appropriate number in front of the item. no slight moderate marked extremely change change change change marked change 0 1 2 3 4 _____ a. sleep length _____ b. social activity
_____ c. mood (overall feeling of well being) _____ d. weight
_____ e. appetite _____ f. energy level
_____ g. exercising
_____ h. binge eating (Binge eating means eating a very large amount of food within 2 hours while feeling like one cannot stop eating or control how much one is eating. If you don’t binge eat, leave item h blank.)
_____ i. purging (Purging means vomiting or taking laxatives, water pills, or diet pills after eating. If you don’t purge, leave item i blank.)
In the following questions, circle all applicable months. You may have one circle for a single month or you may have several circles for a cluster of months, or any grouping of months. If an item does not apply to you, leave it blank. For example, if you do not purge, leave items c and j blank. At what time of the year do you:
a. feel best Jan Feb Mar Apr May Jun Jul Aug Sep Oct Nov Dec
No particular month
b. tend to gain most weight Jan Feb Mar Apr May Jun Jul Aug Sep Oct Nov Dec
No particular month
c. purge most Jan Feb Mar Apr May Jun Jul Aug Sep Oct Nov Dec
No particular month
d. socialize most Jan Feb Mar Apr May Jun Jul Aug Sep Oct Nov Dec
No particular month
91

e. sleep least Jan Feb Mar Apr May Jun Jul Aug Sep Oct Nov Dec
No particular month
f. eat most Jan Feb Mar Apr May Jun Jul Aug Sep Oct Nov Dec
No particular month
g. binge least Jan Feb Mar Apr May Jun Jul Aug Sep Oct Nov Dec
No particular month
h. lose most weight Jan Feb Mar Apr May Jun Jul Aug Sep Oct Nov Dec
No particular month
i. socialize least Jan Feb Mar Apr May Jun Jul Aug Sep Oct Nov Dec
No particular month
j. purge least Jan Feb Mar Apr May Jun Jul Aug Sep Oct Nov Dec
No particular month
k. feel worst Jan Feb Mar Apr May Jun Jul Aug Sep Oct Nov Dec
No particular month
l. eat least Jan Feb Mar Apr May Jun Jul Aug Sep Oct Nov Dec
No particular month
m. sleep most Jan Feb Mar Apr May Jun Jul Aug Sep Oct Nov Dec
No particular month
n. binge most Jan Feb Mar Apr May Jun Jul Aug Sep Oct Nov Dec
No particular month
Using the following scale, indicate how the following weather changes make you feel. Place your response in front of the item. -3 = in very low spirits or markedly slowed down -2 = moderately low/slowed down -1 = mildly low/slowed down 0 = no effect +1 = slightly improves your mood or energy level +2 = moderately improves your mood or energy level +3 = markedly improves your mood or energy level -- = don’t know _____ a. cold weather
_____ b. hot weather
_____ c. humid weather
92

_____ d. sunny days
_____ e. dry days
_____ f. gray cloudy days
_____ g. long days
_____ h. high pollen count
_____ i. foggy, smoggy days
_____ j. short days How much does your weight fluctuate during the course of the year? (circle one) 0 - 3 lbs. 4 - 7 lbs. 8 - 11 lbs. 12 - 15 lbs. 16 - 20 lbs. over 20 lbs. Approximately how many hours of each 24-hour day do you sleep during each season? (include naps) _____ a. winter (Dec. 21 - Mar. 20)
_____ b. spring (Mar. 21 - June 20)
_____ c. summer (June 21 - Sept. 20)
_____ d. fall (Sept. 21 - Dec. 20) Do you notice a change in food preference during different seasons? Yes___ No___
If yes, please specify the changes.
________________________________________________________________________
________________________________________________________________________
If you experience changes with the seasons, do you feel that these are a problem for you?
Yes_____ No_____
If this is a problem, circle the severity: Mild Moderate Marked Severe Disabling
93

APPENDIX M
Current Behaviors Scale
94

References
American Psychiatric Association (1994). Diagnostic and Statistical Manual of Mental
Disorders (4th ed.). Washington, DC: Author.
Anastasi, A., & Urbina, S. (1997). Psychological Testing, 7th ed. New York: MacMillan.
Aycicegi, A. D., & Harris, C. L. (2003). Assessing adult attention-deficit/hyperactivity
disorder: A Turkish version of the current symptoms scale. Psychopathology, 36,
160-167.
Azam, O., & Young, M. A. (1998) November. Ruminative response style as a predictor
of severity of seasonal affective disorder. Paper presented at the annual meeting of
the Society for Research in Psychopathology, Cambridge, MA.
Bagby, R. M., Ryder, A. G., Schuller, D. R., & Marshall, M. B. (2004). The Hamilton
Depression Rating Scale: Has the gold standard become a lead weight? American
Journal of Psychiatry, 161, 2163-2177.
Barkley, R. A., & Murphy, K. R. (1998). Attention-deficit hyperactivity disorder: A
clinical workbook (2nd Ed.). New York: The Guilford Press.
Bartko, J. J., & Kasper, S. (1989). Seasonal changes in mood and behavior: A cluster
analytic approach. Psychiatry Research, 28, 227-239.
Beck, A. T. (1967). Depression: Clinical, experimental, and theoretical aspects. New
York: Hoeber.
Beck, A. T. (1976). Cognitive therapy and the emotional disorders. New York:
International Universities Press.
Beck, A. T., Rush, A. J., Shaw, B. F., & Emery, G. (1979). Cognitive therapy of
depression. New York: Guilford Press.
95

Beck, A. T., Steer, R. A., & Brown, G. K. (1996). Beck Depression Inventory – 2nd
Edition. San Antonio: The Psychological Corporation.
Beck, A. T., Steer, R. A., & Garbin, M. G. (1988). Psychometric properties of the Beck
Depression Inventory. Clinical Psychology Review, 8(1), 77-100.
Beck, J. S. (1995). Cognitive therapy: Basics and beyond (1st ed.). New York: Guilford
Press.
Blackburn, I. M., Eunson, K. M., & Bishop, S. (1986). A two-year naturalistic follow-up
of depressed patients treated with cognitive therapy, pharmacotherapy and a
combination of both. Journal of Affective Disorders, 10(1), 67-75.
Blaney, P. H. (1986). Affect and memory: A review. Psychological Bulletin, 99, 229-246.
Booker, J. M., & Hellekson, C. J. (1992). Prevalence of seasonal affective disorder in
Alaska. American Journal of Psychiatry, 149, 1176-1182.
Bower, G. H. (1981). Mood and memory: A review. American Psychologist, 36, 129-148.
Boyle, G. J. (1991). Does item homogeneity indicate internal consistency or item
redundancy in psychometric scales? Personality and Individual Differences, 12,
291-4.
Cronbach, L. J. (1951). Coefficient alpha and the internal structure of tests.
Psychometrika, 16, 297-334.
Dalgleish, T., Rosen, K., & Marks, M. (1996). Rhythm and blues: The theory and
treatment of seasonal affective disorder. British Journal of Psychology, 35, 163-
182.
96

Danilenko, K.V. & Putilov, A. A. (1996). The importance of full summer remission as a
criterion for the diagnosis of seasonal affective disorder. Psychopathology, 29,
230-235.
Dobson, K. S. (1989). A meta-analysis of the efficacy of cognitive therapy for
depression. Journal of Consulting and Clinical Psychology, 57(3), 414-419.
Dobson, K. S., & Breiter, H. J. (1983). Cognitive assessment of depression: Reliability
and validity of three measures. Journal of Abnormal Psychology, 92, 107-109.
Fava, G. A., Ruini, C., Rafanelli, C., Finos, L., Conti, S., & Grandi, S. (2004). Six-year
outcome of cognitive behavior therapy for prevention of recurrent depression.
American Journal of Psychiatry, 161, 1872-1876.
First, M. B., Spitzer, R. L., Gibbon, M., & Williams, J. B. W. (1995). Structured Clinical
Interview for DSM-IV Axis I Disorders (SCID-Clinician Version). New York:
New York State Psychiatric Institute Biometrics Research Department.
Gloaguen, V., Cottraux, J., Cucherat, M., & Blackburn, I. (1998). A meta-analysis of the
effects of cognitive therapy in depressed patients. Journal of Affective Disorders,
49, 59-72.
Greenwald, A. G., McGhee, D. E., & Schwartz, J. L. K. (1998). Measuring individual
differences in implicit cognition: The implicit association test. Journal of
Personality and Social Psychology, 74(6), 1464-1480.
Guilford, J. P. (1956). Psychometric methods (2nd ed). New York: McGraw Hill.
Hodges, S., & Marks, M. (1998). Cognitive characteristics of seasonal affective disorder:
A preliminary investigation. Journal of Affective Disorders, 50, 59-64.
97

Hollon, S. D., & Kendall, P. C. (1980). Cognitive self-statements in depression:
Development of an Automatic Thoughts Questionnaire. Cognitive Therapy and
Research, 3, 383-396.
Just, N., & Alloy, L. B. (1997). The response styles theory of depression: Tests and an
extension of the theory. Journal of Abnormal Psychology, 2, 221-229.
Kasper, S., Rogers, S. L. B., Yancey, A., Schultz, P. M., Skwerer, R. G., & Rosenthal, N.
E. (1989a). Phototherapy in individuals with and without subsyndromal seasonal
affective disorder. Archives of General Psychiatry, 46, 837-844.
Kasper, S., Wehr, T. A., Bartko, J.J., Gaist, P. A., & Rosenthal, N. E. (1989b).
Epidemiological findings of seasonal changes in mood and behavior: A telephone
survey of Montgomery County, Maryland. Archives of General Psychiatry, 46,
823-833.
Kessler, R. C. (2002). Epidemiology of depression. In I. H. Gotlib & C. L. Hammen
(Eds.), Handbook of depression (pp. 23-42). New York: The Guilford Press.
Kline, P. (1986). A handbook of test construction. London: Methuen.
Lam, R. W., Tam, E. M., Yatham, L. N., Shiah, I.-S., & Zis, A. P. (2001). Seasonal
depression: The dual vulnerability hypothesis revisited. Journal of Affective
Disorders, 63, 123-132.
Lee, T. M. C., Blashko, C. A., Janzen, H. L., Paterson, J. G., & Chan, C. C. H. (1997).
Pathophysiological mechanisms of seasonal affective disorder. Journal of
Affective Disorders, 46, 25-38.
Levitan, R. D., Rector, N. A., & Bagby, M. (1998). Negative attributional style in
seasonal affective disorder. American Journal of Psychiatry, 155, 428-430.
98

Lewinsohn, P. M. (1974) The psychology of depression: Contemporary theory and
research. In R. Friedman & M. Katz (Eds.), Washington DC: V. H. Winston.
Lewy, A. J., Wehr, T. A., Goodwin, F. K., Newsome, D. A., & Markey, S. P. (1980).
Light suppresses melatonin secretion in humans. Science, 210(4475), 1267-1269.
Lewy, A. J., Kern, H. A., Rosenthal, N. E., & Wehr, T. A. (1982). Bright artificial light
treatment of manic-depressive patients with a seasonal mood cycle. American
Journal of Psychiatry, 139, 1496-1498.
Lucas, C. P. (1991). Seasonal affective disorder in adolescence. British Journal of
Psychiatry, 159, 863-865.
Lyubomirsky, S., Caldwell, N. D., & Nolen-Hoeksema, S. (1998). Effects of rumination
and distracting response to depressed mood on retrieval of autobiographical
memories. Journal of Personality and Social Psychology, 75, 166-177.
Magnusson, A. (2000). An overview of the epidemiological studies on seasonal affective
disorder. Acta Psychiatrica Scandinavica, 101, 176-184.
Magnusson, A., & Boivin, D. (2003). Seasonal affective disorder: An overview.
Chronobiology International, 20(2), 189-207.
Magnusson, A., Friis, S., Opjordsmoen, S. (1997). Internal consistency of the seasonal
pattern assessment questionnaire (SPAQ). Journal of Affective Disorders, 42,
113-116.
Mersh, P. P., Middendorp, H. M., Bouhuys, A. L., Beersma, D. G. M., van den
Hoofdakker, R. H. (1999). Seasonal affective disorder and latitude: A review of
the literature. Journal of Affective Disorders, 53, 35-48.
Morrow, J. (1990). The effects of rumination, distraction, and negative mood on
99

memories, evaluations, and problem solving. Unpublished manuscript, Stanford
University, Stanford, CA.
Murphy, K. R., & Barkley, R. A. (1998). Attention-Deficit Hyperactivity Disorder: A
clinical workbook (2nd ed.). Guilford Press.
Murray, C. J. L., & Lopez, A. D. (1996). The global burden of disease: A comprehensive
assessment of mortality and disability from diseases, injuries, and risk factors in
1990 and projected to 2020. Cambridge, MA: Harvard University Press.
Musson, R. E., & Alloy, L. B. (1988). Depression and self-directed attention. In L. B.
Alloy (Ed.), Cognitive processes in depression (pp. 193-220). New York:
Guilford Press.
Nolen-Hoeksema, S. (1987). Sex differences in unipolar depression: Evidence and
theory. Psychological Bulletin, 101, 259-282.
Nolen-Hoeksema, S., & Morrow, J. (1991). A prospective study of depression and
posttraumatic stress symptoms after a natural disaster: The 1989 Loma Prieta
earthquake. Journal of personality and Social Psychology, 61, 115-121.
Nolen-Hoeksema, S., Morrow, J., & Frederickson, B. L. (1993). Response styles and the
duration of episodes of depressed mood. Journal of Abnormal Psychology, 102,
20-28.
Nunnally, J.C. (1978). Psychometric theory, 2nd ed. New York, NY: McGraw-Hill Inc.
Nunnally, J.C. & Bernstein, I.H. (1994). Psychometric theory, 3rd ed. New York, NY:
McGraw-Hill Inc.
Paykel, E. S., Scott, J., Teasdale, J. D., Johnson, A. L., Garland, A., Moore, R., Jenaway,
A., Cornwall, P. L., Hayhurst, H., Abbott, R., & Pope, M. (1999). Prevention of
100

relapse in residual depression by cognitive therapy: A controlled trial. Archives of
General Psychiatry, 65, 829-835.
Persons, J. B., & Miranda, J. (1992). Cognitive theories of vulnerability to depression:
Reconciling negative evidence. Cognitive Therapy and Research, 16, 485-502.
Postolache, T. T., Hardin, T. A., Myers, F. S., Turner, E. H., Yi, L. Y., & Barnett, R. L. et
al. (1998). Greater improvement in summer than with light treatment in winter in
patients with seasonal affective disorder. American Journal of Psychiatry,
155(11), 1614-1616.
Radloff, L. S. (1977). The CES-D scale: A self report depression scale for research in the
general population. Applied Psychological Measurement, 1(3), 385-401.
Radloff, L. S. (1991). The use of the Center for Epidemiologic Studies Depression Scale
in adolescents and young adults. Journal of Youth and Adolescence, 20, 149-165.
Radloff, L. S., & Locke, B. Z. (1986). The Community Mental Health Assessment Survey
and the CES-D Scale. In M. Weissman, J. Myers & C. Ross (Eds.), Community
surveys. New Brunswick, NJ: Rutgers University Press.
Raheja, S. K., King, E. A., & Thompson, C. (1996). The seasonal pattern assessment
questionnaire for identifying seasonal affective disorders. Journal of Affective
Disorders, 41, 193-199.
Rohan, K. J. (2000). Coping with the seasons: A cognitive-behavioral group treatment
for seasonal affective disorder. Unpublished treatment manual.
Rohan, K. J. (2002). Cognitive-behavioral approaches to seasonal depression (R03
MH0659-01A1). Behavioral Science Track Award for Rapid Transition
(B/START), National Institute of Mental Health.
101

Rohan, K. J., Lippy, R. D., Roecklein, K. A., Tierney Lindsey, K., Nguyen, A. T.,
Massac, A. I., & Haaga, D. A. F (2003). Implicit light-specific and self-
representative cognitions across the seasonality continuum. Paper presented at the
annual meeting of the Association for Advancement of Behavior Therapy,
Boston.
Rohan, K. J., & Sigmon, S. T. (2000). Seasonal mood patterns in a northeastern college
sample. Journal of Affective Disorders, 59, 85-96.
Rohan, K. J., Sigmon, S. T., & Dorhofer, D. M. (2003). Cognitive-behavioral factors in
seasonal affective disorder. Journal of Consulting and Clinical Psychology, 71(1),
22-30.
Rohan, K. J., Sigmon, S. T., Dorhofer, D. M., & Boulard, N. E. (2004). Cognitive and
psychophysiological correlates of subsyndromal seasonal affective disorder.
Cognitive Therapy and Research.
Rohan, K.J., Tierney Lindsey, K., Roecklein, K.A., Lippy, R.D., Johnson, L.G., Nguyen,
A.T., Massac, A.I., & Lacy, T. J. (2003). Cognitive-behavioral and light
treatments for seasonal affective disorder: Interim analyses from a controlled,
randomized clinical trial. Chronobiology International.
Rohan, K. J., Tierney Lindsey, K., Roecklein, K. A., & Lacy, T. J. (2004). Cognitive-
behavioral therapy, light therapy, and their combination in treating seasonal
affective disorder: A pilot study. Journal of Affective Disorders, 80 (2), 273-283.
Rosen, L. N., Targum, S. D., Terman, M., Bryant, M. J., Hoffman, H., & Kasper, S. F. et
al. (1990). Prevalence of seasonal affective disorder at four latitudes. Psychiatry
Research, 31, 131-144.
102

Rosenthal, N. E., Bradt, G. H., & Wehr, T. A. (1984). Seasonal Pattern Assessment
Questionnaire. Bethesda, MD: National Institute of Mental Health.
Rosenthal, N. E., Sack, D. A., Gillin, J. C., Lewy, A. J., Goodwin, F. K., & Davenport, Y.
et al. (1984). Seasonal affective disorder: A description of the syndrome and
preliminary findings with light therapy. Archives of General Psychiatry, 41, 72-
80.
Rosenthal, N. E., Carpenter, C. J., James, S. P., Parry, B. L., Rogers, S. L. B., & Wehr, T.
A. (1986). Seasonal affective disorder in children and adolescents. American
Journal of Psychiatry, 143, 356-358.
Rosenthal, N. E., & Wehr, T. A. (1992). Towards understanding the mechanism of action
of light in seasonal affective disorder. Pharmacopsychiatry, 25(1), 56-60.
Schmidt, N. B., Joiner, T. E., Young, J. E., & Telch, M. J. (1995). The Schema
Questionnaire: Investigation of psychometric properties and the hierarchical
structure of a measure of maladaptive schemas. Cognitive Therapy and Research,
19, 295-321.
Schwartz, P. J., Brown, C., Wehr, T. A., & Rosenthal, N. E. (1996). Winter Seasonal
affective disorder: A follow-up study of the first 59 patients of the National
Institute of Mental Health Seasonal Studies Program. American Journal of
Psychiatry, 153, 1028-1036.
Shah, A. (1993). Seasonal affective disorder in an elderly woman. International Journal
of Geriatric Psychiatry, 7(11), 847.
Sigmon, S. T., Rohan, K. J., Boulard, N. E., Whitcomb, S. R., & Dorhofer, D. M. (2000).
Development and validation of the Seasonal Attitudes Questionnaire. Paper
103

presented at the meeting of the Association for the Advancement of Behavior
Therapy, New Orleans, LA.
Simons, A. D., Garfield, S. L., & Murphy, G. E. (1984). The process of change in
cognitive therapy and pharmacotherapy for depression. Archives of General
Psychiatry, 41, 45-51.
Simons, A. D., Murphy, G. E., Levine, J. L., & Wetzel, R. D. (1986). Cognitive therapy
and pharmacotherapy for depression: Sustained improvement over one year.
Archives of General Psychiatry, 150, 645-652.
Strack, S., Blaney, P. H., Ganellen, R. J., & Coyne, J. C. (1985). Pessimistic self-
preoccupation, performance deficits, and depression. Journal of Personality and
Social Psychology, 49, 1076-1085.
Streiner, D. L. & Norman, G. R. (1995). Health measurement scales: A practical guide to
their development and use, 2nd ed. New York, NY: Oxford University Press.
Swedo, S. E., Pleeter, J. D., Richter, D. M., Hoffman, C. L., Allen, A. J., Hamburger, S.
D., Turner, E. H., Yamada, E. M., & Rosenthal, N. E. (1995). Rates of seasonal
affective disorder in children and adolescents. American Journal of Psychiatry,
152, 1016-1019.
Tam, E. M., Lam, R. W., & Levitt, A. J. (1995). Treatment of seasonal affective disorder:
A review. Canadian Journal of Psychiatry, 40, 457-466.
Terman, M., Terman, J. S., Quitkin, F. M., McGrath, P. J., Stewart, J. W., & Rafferty, B.
(1989). Light therapy for seasonal affective disorder: A review of efficacy.
Neuropsychopharmacology, 2, 1-22.
104

Tierney Lindsey, K. (2003). Changes in cognitive-behavioral constructs across treatment
modalities for seasonal affective disorder: Cognitive-behavioral therapy, light
therapy, and their combination. Unpublished master’s thesis, Uniformed Services
University of the Health Sciences, Bethesda, MD.
U.S. Department of Health and Human Services [USDHHS]. (1993). Depression in
Primary Care: Volume 1. Detection and Diagnosis (AHCPR Publication No. 93-
0550). Washington, DC: U.S. Government Printing Office.
Weissman, A., & Beck, A. (1978). Development and validation of the Dysfunctional
Attitude Scale. Paper presented at the meeting of the Association for the
Advancement of Behavior Therapy, Chicago, IL.
Weissman, M. M., Sholomskas, D., Pottenger, M., Prusoff, B. A., & Locke, B. Z. (1977).
Assessing depressive symptoms in five psychiatric populations: A validation
study. American Journal of Epidemiology,106, 203-213.
Wehr, T. A., Sack, D. A., & Rosenthal, N. E. (1987). Seasonal affective disorder with
summer depression and winter hypomania. Am J Psychiatry, 144 (12), p1602-
1603.
Welburn, K., Coristine, M., Dagg, P., Pontefract, A., & Jordan, S. (2002). The Schema
Questionnaire-Short Form: Factor analysis and relationship between schemas and
symptoms. Cognitive Therapy and Research, 26(4), 519-530.
Whitcomb-Smith, S., Sigmon, S., & Kendrew, J. (2002). The development of an
instrument to measure cognitions about seasonal changes. Poster presented at the
meeting of the Association for the Advancement of Behavior Therapy, Reno, NV.
105

Williams, J. B., Link, M. J., Rosenthal, N. E., Amira, L., & Terman, M. (1992).
Structured Interview Guide for the Hamilton Depression Rating Scale—Seasonal
Affective Disorder Version (SIGH-SAD). New York: New York State Psychiatric
Institute.
Young, J. E. (1998). Young Schema Questionnaire Short Form (1st ed.). New York:
Cognitive Therapy Center.
Young, J. E., & Brown, G. (1994). Young Schema Questionnaire. In J. E. Young (Ed.),
Cognitive therapy for personality disorders: A schema-focused approach. (Rev.
ed., pp. 63-76). Sarasota, FL: Professional Resource Exchange.
Young, M. A. (1999). Integrating psychological and physiological mechanisms of SAD:
The dual vulnerability model. Biological Rhythms Bulletin, 1, 4-6.
Young, M. A, and Azam, O. A. (2003). Ruminative response style and the severity of
Seasonal Affective Disorder. Cognitive Therapy and Research, 27(2), 223-232.
Young, M. A., Watel, L. G., Lahmeyer, H. W., & Eastman, C. I. (1991). The temporal
onset of individual symptoms in winter depression: Differentiating underlying
mechanisms. Journal of Affective Disorders, 22, 191-197.
106