appropriation bill (no. 2) 2012-2013 no. , · pdf filepart 4—general drawing rights...
TRANSCRIPT
2010-2011-2012 The Parliament of the Commonwealth of Australia HOUSE OF REPRESENTATIVES Presented and read a first time
Appropriation Bill (No. 2) 2012-2013
No. , 2012 (Finance and Deregulation)
A Bill for an Act to appropriate money out of the Consolidated Revenue Fund for certain expenditure, and for related purposes


i Appropriation Bill (No. 2) 2012-2013 No. , 2012
Contents Part 1—Preliminary 1
1 Short title ........................................................................................... 1
2 Commencement ................................................................................. 2
3 Definitions ......................................................................................... 2
4 Portfolio Statements ........................................................................... 4
5 Notional payments, receipts etc. ........................................................ 4
Part 2—Appropriation items 5
6 Summary of appropriations ............................................................... 5
7 State, ACT, NT and local government items ..................................... 5
8 Administered items ............................................................................ 5
9 Administered assets and liabilities items ........................................... 6
10 Other departmental items ................................................................... 6
11 CAC Act body payment items ........................................................... 6
Part 3—Adjusting appropriation items 8
12 Reducing State, ACT, NT and local government items and administered items ............................................................................. 8
13 Reducing administered assets and liabilities items and other departmental items ............................................................................. 8
14 Reducing CAC Act body payment items ........................................... 9
15 Advance to the Finance Minister ..................................................... 10
Part 4—General drawing rights limits 12
16 General drawing rights limits........................................................... 12
17 Adjustments for GST ....................................................................... 12
Part 5—Amendment of the Commonwealth Inscribed Stock Act 1911 14
18 Amendment...................................................................................... 14
19 Application ...................................................................................... 14
Part 6—Miscellaneous 15
20 Crediting amounts to Special Accounts ........................................... 15
21 Conditions etc. applying to State, ACT, NT and local government items ............................................................................. 15
22 Appropriation of the Consolidated Revenue Fund ........................... 16

Appropriation Bill (No. 2) 2012-2013 No. , 2012 ii
Schedule 1—Payments to or for the States, ACT, NT and local government 17
Schedule 2—Services for which money is appropriated 19

Appropriation Bill (No. 2) 2012-2013 No. , 2012 1
A Bill for an Act to appropriate money out of the 1
Consolidated Revenue Fund for certain 2
expenditure, and for related purposes 3
The Parliament of Australia enacts: 4
Part 1—Preliminary 5 6
1 Short title 7
This Act may be cited as the Appropriation Act (No. 2) 2012-2013. 8
Part 1 Preliminary Section 2
2 Appropriation Bill (No. 2) 2012-2013 No. , 2012
2 Commencement 1
This Act commences on the day this Act receives the Royal 2
Assent. 3
3 Definitions 4
In this Act: 5
acquisition has the same meaning as in the GST Act. 6
administered assets and liabilities item means an amount set out in 7
Schedule 2 in relation to an Agency opposite the heading 8
“Administered Assets and Liabilities”. 9
administered item means an amount set out in Schedule 2 opposite 10
an outcome for an Agency under the heading “New Administered 11
Outcomes”. 12
Agency means: 13
(a) an Agency within the meaning of the Financial Management 14
and Accountability Act 1997; or 15
(b) the High Court of Australia. 16
CAC Act body means: 17
(a) a Commonwealth authority within the meaning of the 18
Commonwealth Authorities and Companies Act 1997; or 19
(b) a Commonwealth company within the meaning of the 20
Commonwealth Authorities and Companies Act 1997. 21
CAC Act body payment item means the amount set out in 22
Schedule 2 in relation to a CAC Act body under the heading 23
“Non-operating”. 24
Chief Executive has the same meaning as in the Financial 25
Management and Accountability Act 1997. 26
current year means the financial year ending on 30 June 2013. 27
expenditure means payments for expenses, acquiring assets, 28
making loans or paying liabilities. 29

Preliminary Part 1
Section 3
Appropriation Bill (No. 2) 2012-2013 No. , 2012 3
Finance Minister means the Minister administering this Act. 1
GST Act means the A New Tax System (Goods and Services Tax) 2
Act 1999, as it applies because of Division 177 of that Act. 3
Note: Under Division 177 of the GST Act, that Act applies notionally to the 4 Commonwealth and Commonwealth entities. They are therefore 5 notionally liable to pay GST, are notionally entitled to input tax 6 credits and notionally have adjustments. 7
GST qualifying amount means: 8
(a) an input tax credit (within the meaning of the GST Act); or 9
(b) a decreasing adjustment (within the meaning of the GST 10
Act). 11
importation has the same meaning as in the GST Act. 12
item means any of the following: 13
(a) a State, ACT, NT and local government item; 14
(b) an administered item; 15
(c) an administered assets and liabilities item; 16
(d) an other departmental item; 17
(e) a CAC Act body payment item. 18
other departmental item means an amount set out in Schedule 2 in 19
relation to an Agency opposite the heading “Equity Injections”. 20
Portfolio Budget Statements means the Portfolio Budget 21
Statements that were tabled in the Senate or the House of 22
Representatives in relation to the Bill for this Act. 23
Portfolio Statements means the Portfolio Budget Statements. 24
Special Account has the same meaning as in the Financial 25
Management and Accountability Act 1997. 26
State, ACT, NT and local government item means an amount set 27
out in Schedule 2 opposite an outcome for an Agency under the 28
heading “Payments to States, ACT, NT and local government”. 29

Part 1 Preliminary Section 4
4 Appropriation Bill (No. 2) 2012-2013 No. , 2012
4 Portfolio Statements 1
The Portfolio Statements are hereby declared to be relevant 2
documents for the purposes of section 15AB of the Acts 3
Interpretation Act 1901. 4
Note: See paragraph 15AB(2)(g) of the Acts Interpretation Act 1901. 5
5 Notional payments, receipts etc. 6
For the purposes of this Act, notional transactions between 7
Agencies are to be treated as if they were real transactions. 8
Note: This section applies, for example, to a “payment” between Agencies 9 that are both part of the Commonwealth. One of the effects of this 10 section is that the payment will be debited from an appropriation for 11 the paying Agency, even though no payment is actually made from the 12 Consolidated Revenue Fund. 13
14

Appropriation items Part 2
Section 6
Appropriation Bill (No. 2) 2012-2013 No. , 2012 5
Part 2—Appropriation items 1 2
6 Summary of appropriations 3
The total of the items specified in Schedule 2 is $7,246,259,000. 4
Note 1: Items in Schedule 2 can be adjusted under Part 3 of this Act. 5
Note 2: Sections 30 to 32 of the Financial Management and Accountability 6 Act 1997 also provide for adjustments of amounts appropriated by this 7 Act. 8
7 State, ACT, NT and local government items 9
(1) The amount specified in a State, ACT, NT and local government 10
item for an outcome for an Agency may be applied for the purpose 11
of making payments to or for the States, the Australian Capital 12
Territory, the Northern Territory and local government authorities 13
for the purpose of contributing to achieving that outcome. 14
Note: The Finance Minister manages the expenditure of public money 15 through the issue of drawing rights under the Financial Management 16 and Accountability Act 1997. 17
(2) If the Portfolio Statements indicate that activities of a particular 18
kind were intended to be treated as activities in respect of a 19
particular outcome, then expenditure for the purpose of carrying 20
out those activities is taken to be expenditure for the purpose of 21
contributing to achieving the outcome. 22
8 Administered items 23
(1) The amount specified in an administered item for an outcome for 24
an Agency may be applied for expenditure for the purpose of 25
contributing to achieving that outcome. 26
Note: The Finance Minister manages the expenditure of public money 27 through the issue of drawing rights under the Financial Management 28 and Accountability Act 1997. 29
(2) If the Portfolio Statements indicate that activities of a particular 30
kind were intended to be treated as activities in respect of a 31
particular outcome, then expenditure for the purpose of carrying 32

Part 2 Appropriation items Section 9
6 Appropriation Bill (No. 2) 2012-2013 No. , 2012
out those activities is taken to be expenditure for the purpose of 1
contributing to achieving the outcome. 2
9 Administered assets and liabilities items 3
(1) The amount specified in an administered assets and liabilities item 4
for an Agency may be applied for expenditure for the purpose of 5
contributing to achieving any outcome specified for the Agency: 6
(a) in Schedule 2 to this Act; or 7
(b) in Schedule 1 to the Appropriation Act (No. 1) 2012-2013. 8
Note: The Finance Minister manages the expenditure of public money 9 through the issue of drawing rights under the Financial Management 10 and Accountability Act 1997. 11
(2) If the Portfolio Statements indicate that activities of a particular 12
kind were intended to be treated as activities in respect of a 13
particular outcome, then expenditure for the purpose of carrying 14
out those activities is taken to be expenditure for the purpose of 15
contributing to achieving the outcome. 16
10 Other departmental items 17
The amount specified in an other departmental item for an Agency 18
may be applied for the departmental expenditure of the Agency. 19
Note: The Finance Minister manages the expenditure of public money 20 through the issue of drawing rights under the Financial Management 21 and Accountability Act 1997. 22
11 CAC Act body payment items 23
(1) The amount specified in a CAC Act body payment item for a CAC 24
Act body may be paid to the body to be applied for the purposes of 25
the body. 26
Note: The Finance Minister manages the expenditure of public money 27 through the issue of drawing rights under the Financial Management 28 and Accountability Act 1997. 29
(2) If: 30
(a) an Act provides that a CAC Act body must be paid amounts 31
that are appropriated by the Parliament for the purposes of 32
the body; and 33
Appropriation items Part 2
Section 11
Appropriation Bill (No. 2) 2012-2013 No. , 2012 7
(b) Schedule 2 contains a CAC Act body payment item for that 1
body; 2
then the body must be paid the full amount specified in the item. 3
4

Part 3 Adjusting appropriation items Section 12
8 Appropriation Bill (No. 2) 2012-2013 No. , 2012
Part 3—Adjusting appropriation items 1 2
12 Reducing State, ACT, NT and local government items and 3
administered items 4
(1) If: 5
(a) an annual report for an Agency for the current year is tabled 6
in the Parliament; and 7
(b) the report specifies the amount required by an Agency in 8
respect of: 9
(i) a State, ACT, NT and local government item for the 10
Agency; or 11
(ii) an administered item for the Agency; and 12
(c) the required amount is less than the amount of the item; 13
the item is taken to be reduced to the required amount. 14
(2) The Finance Minister may, by writing: 15
(a) determine that subsection (1): 16
(i) does not apply in relation to the item; or 17
(ii) applies as if the amount specified in the annual report 18
were the amount specified in the determination; or 19
(b) if the report does not specify the required amount—20
determine an amount that is taken to be the required amount 21
for the purposes of subsection (1). 22
(3) A determination made under subsection (2) is a legislative 23
instrument and, despite subsection 44(2) of the Legislative 24
Instruments Act 2003, section 42 (disallowance) of that Act applies 25
to the determination. However, Part 6 (sunsetting) of that Act does 26
not apply to the determination. 27
13 Reducing administered assets and liabilities items and other 28
departmental items 29
(1) A written request to reduce an administered assets and liabilities 30
item or an other departmental item for an Agency may be made to 31
the Finance Minister by: 32

Adjusting appropriation items Part 3
Section 14
Appropriation Bill (No. 2) 2012-2013 No. , 2012 9
(a) the Prime Minister or a Minister acting on behalf of the 1
Prime Minister; or 2
(b) the Minister who is responsible for the Agency; or 3
(c) if the Finance Minister is responsible for the Agency—the 4
Chief Executive of the Agency. 5
(2) If a request is made under subsection (1), the Finance Minister 6
may, by writing, determine that the item is to be reduced by the 7
amount specified in the request. 8
(3) However, the determination has no effect to the extent that it would 9
reduce the item below nil, after subtracting amounts that have been 10
applied under Part 2 in respect of the item. 11
(4) The item is taken to be reduced in accordance with the 12
determination. 13
(5) Despite subsection 33(3) of the Acts Interpretation Act 1901, the 14
determination must not be rescinded, revoked, amended or varied. 15
(6) A request made under subsection (1) is not a legislative instrument. 16
(7) A determination made under subsection (2) is a legislative 17
instrument and, despite subsection 44(2) of the Legislative 18
Instruments Act 2003, section 42 (disallowance) of that Act applies 19
to the determination. However, Part 6 (sunsetting) of that Act does 20
not apply to the determination. 21
14 Reducing CAC Act body payment items 22
(1) A written request to reduce a CAC Act body payment item for a 23
CAC Act body may be made to the Finance Minister by: 24
(a) the Prime Minister or a Minister acting on behalf of the 25
Prime Minister; or 26
(b) the Minister who is responsible for the body; or 27
(c) if the Finance Minister is responsible for the body—the 28
Secretary of the Department. 29
Note: For Department, see subsection 19A(3) of the Acts Interpretation Act 30 1901. 31

Part 3 Adjusting appropriation items Section 15
10 Appropriation Bill (No. 2) 2012-2013 No. , 2012
(2) If a request is made under subsection (1), the Finance Minister 1
may, by writing, determine that the item is to be reduced by the 2
amount specified in the request. 3
(3) However, the determination has no effect to the extent that it would 4
reduce the item below nil, after subtracting amounts that have been 5
paid to the body in respect of the item. 6
(4) The item is taken to be reduced in accordance with the 7
determination. 8
(5) Despite subsection 33(3) of the Acts Interpretation Act 1901, the 9
determination must not be rescinded, revoked, amended or varied. 10
(6) Subsection 11(2) does not limit the reduction of a CAC Act body 11
payment item under this section. 12
(7) A request made under subsection (1) is not a legislative instrument. 13
(8) A determination made under subsection (2) is a legislative 14
instrument and, despite subsection 44(2) of the Legislative 15
Instruments Act 2003, section 42 (disallowance) of that Act applies 16
to the determination. However, Part 6 (sunsetting) of that Act does 17
not apply to the determination. 18
15 Advance to the Finance Minister 19
(1) This section applies if the Finance Minister is satisfied that there is 20
an urgent need for expenditure, in the current year, that is not 21
provided for, or is insufficiently provided for, in Schedule 2: 22
(a) because of an erroneous omission or understatement; or 23
(b) because the expenditure was unforeseen until after the last 24
day on which it was practicable to provide for it in the Bill 25
for this Act before that Bill was introduced into the House of 26
Representatives. 27
(2) This Act has effect as if Schedule 2 were amended, in accordance 28
with a determination of the Finance Minister, to make provision for 29
so much (if any) of the expenditure as the Finance Minister 30
determines. 31

Adjusting appropriation items Part 3
Section 15
Appropriation Bill (No. 2) 2012-2013 No. , 2012 11
(3) The total of the amounts determined under subsection (2) cannot be 1
more than $380 million. 2
(4) A determination made under subsection (2) is a legislative 3
instrument, but neither section 42 (disallowance) nor Part 6 4
(sunsetting) of the Legislative Instruments Act 2003 applies to the 5
determination. 6
7

Part 4 General drawing rights limits Section 16
12 Appropriation Bill (No. 2) 2012-2013 No. , 2012
Part 4—General drawing rights limits 1 2
16 General drawing rights limits 3
Building Australia Fund 4
(1) The general drawing rights limit for the current year for the 5
purposes of section 109 of the Nation-building Funds Act 2008 is 6
$1,229,400,000. 7
Education Investment Fund 8
(2) The general drawing rights limit for the current year for the 9
purposes of section 199 of the Nation-building Funds Act 2008 is 10
$683,331,000. 11
Health and Hospitals Fund 12
(3) The general drawing rights limit for the current year for the 13
purposes of section 267 of the Nation-building Funds Act 2008 is 14
$907,141,000. 15
General purpose financial assistance 16
(4) The general drawing rights limit for the current year for the 17
purposes of section 9 of the Federal Financial Relations Act 2009 18
is $1,500,000,000. 19
National partnership payments 20
(5) The general drawing rights limit for the current year for the 21
purposes of section 16 of the Federal Financial Relations Act 2009 22
is $16,000,000,000. 23
17 Adjustments for GST 24
If: 25
(a) a payment in respect of an acquisition or importation is made 26
in reliance on a general drawing rights limit specified in 27
section 16; and 28

General drawing rights limits Part 4
Section 17
Appropriation Bill (No. 2) 2012-2013 No. , 2012 13
(b) a GST qualifying amount arises for that acquisition or 1
importation; 2
then the general drawing rights limit is increased by the amount of 3
the GST qualifying amount. 4
5

Part 5 Amendment of the Commonwealth Inscribed Stock Act 1911 Section 18
14 Appropriation Bill (No. 2) 2012-2013 No. , 2012
Part 5—Amendment of the Commonwealth 1
Inscribed Stock Act 1911 2 3
18 Amendment 4
Subsection 5(1) of the Commonwealth Inscribed Stock Act 1911 is 5
amended by omitting “$250” and substituting “$300”. 6
19 Application 7
The amendment made by section 18 applies to stock and securities 8
on issue after the commencement of that section, regardless of 9
whether the stock and securities were issued before or after the 10
commencement of that subsection. 11
12

Miscellaneous Part 6
Section 20
Appropriation Bill (No. 2) 2012-2013 No. , 2012 15
Part 6—Miscellaneous 1 2
20 Crediting amounts to Special Accounts 3
If any of the purposes of a Special Account is a purpose that is 4
covered by an item (whether or not the item expressly refers to the 5
Special Account), then amounts may be debited against the 6
appropriation for that item and credited to that Special Account. 7
21 Conditions etc. applying to State, ACT, NT and local government 8
items 9
(1) This section applies to any payment made out of money 10
appropriated by a State, ACT, NT and local government item for 11
an outcome specified in column 2 of the table in Schedule 1. 12
(2) The payment: 13
(a) must be made on the terms and conditions (if any) from time 14
to time determined, in the way described in subsection (3), as 15
applying to payments made: 16
(i) in relation to the outcome; and 17
(ii) to or for a State, the Australian Capital Territory, the 18
Northern Territory or a local government authority; and 19
(iii) out of money appropriated by an annual Appropriation 20
Act; and 21
(b) must be made in accordance with any determination in 22
writing made by the Minister specified, in column 4 of the 23
table in Schedule 1, for the outcome as to amounts and times 24
of payments. 25
(3) The way of determining the terms and conditions applying to 26
payments described in paragraph (2)(a) is for the Minister 27
specified, in column 3 of the table in Schedule 1, for the outcome 28
to make the determination in writing before or after the 29
commencement of this Act. 30
(4) Determinations mentioned in paragraph (2)(a) and determinations 31
made under paragraph (2)(b) are not legislative instruments. 32

Part 6 Miscellaneous Section 22
16 Appropriation Bill (No. 2) 2012-2013 No. , 2012
(5) This section does not limit the Commonwealth’s power to: 1
(a) apply terms and conditions to payments made out of money 2
that is not appropriated by a State, ACT, NT and local 3
government item; or 4
(b) determine the amounts and times of those payments. 5
22 Appropriation of the Consolidated Revenue Fund 6
The Consolidated Revenue Fund is appropriated as necessary for 7
the purposes of this Act, including the operation of this Act as 8
affected by the Financial Management and Accountability Act 9
1997. 10

Payments to or for the States, ACT, NT and local government Schedule 1
Appropriation Bill (No. 2) 2012-2013 No. , 2012 17
Schedule 1—Payments to or for the States, ACT, NT and local government
Note: See section 21. Column 1 Column 2 Column 3 Column 4 Minister Minister determining determining Entity Outcome conditions payments
Attorney-General’s Department
A just and secure society through the maintenance and improvement of Australia’s law and justice framework and its national security and emergency management system
Attorney-General Attorney-General
Department of Climate Change and Energy Efficiency
Reduction of Australia’s greenhouse gas emissions, adaptation to the impacts of climate change, and negotiation of an effective global solution, through the development and implementation of a national response to climate change; and bilateral, regional and multilateral engagement internationally
Minister for Climate Change and Energy Efficiency
Minister for Climate Change and Energy Efficiency
Department of Education, Employment and Workplace Relations
Improved learning, and literacy, numeracy and educational attainment for school students, through funding for quality teaching and learning environments, workplace learning and career advice
Minister for School Education, Early Childhood and Youth
Minister for School Education, Early Childhood and Youth
Department of Families, Housing, Community Services and Indigenous Affairs
Access to affordable, safe housing through: payments and support services; and rental subsidies to low and moderate income households
Minister for Housing
Minister for Housing
Department of Health of Ageing
Population Health - A reduction in the incidence of preventable mortality and morbidity in Australia, including through regulation and national initiatives that support healthy lifestyles and disease prevention
Minister for Health
Minister for Health
Department of Infrastructure and Transport
Improved infrastructure across Australia through investment in and coordination of transport and other infrastructure
Minister for Infrastructure and Transport
Minister for Infrastructure and Transport

Schedule 1 Payments to or for the States, ACT, NT and local government
18 Appropriation Bill (No. 2) 2012-2013 No. , 2012
Column 1 Column 2 Column 3 Column 4 Minister Minister determining determining Entity Outcome conditions payments
Department of Regional Australia, Local Government, Arts and Sport
Strengthening the sustainability, capacity and diversity of regional economies including through facilitating local partnerships between all levels of government and local communities; and providing grants and financial assistance
Minister for Regional Australia, Regional Development and Local Government
Minister for Regional Australia, Regional Development and Local Government
Department of Sustainability, Environment, Water, Population and Communities
Adaptation to climate change, wise water use, secure water supplies and improved health of rivers, waterways and freshwater ecosystems by supporting research, and reforming the management and use of water resources
Minister for Sustainability, Environment, Water, Population and Communities
Minister for Sustainability, Environment, Water, Population and Communities
Department of Sustainability, Environment, Water, Population and Communities
Increased protection, awareness and appreciation of Australia’s environment and heritage through regulating matters of national environmental significance and the identification, conservation and celebration of natural, indigenous and historic places of national and World Heritage significance
Minister for Sustainability, Environment, Water, Population and Communities
Minister for Sustainability, Environment, Water, Population and Communities
Services for which money is appropriated Schedule 2
Appropriation Bill (No. 2) 2012-2013 No. , 2012 19
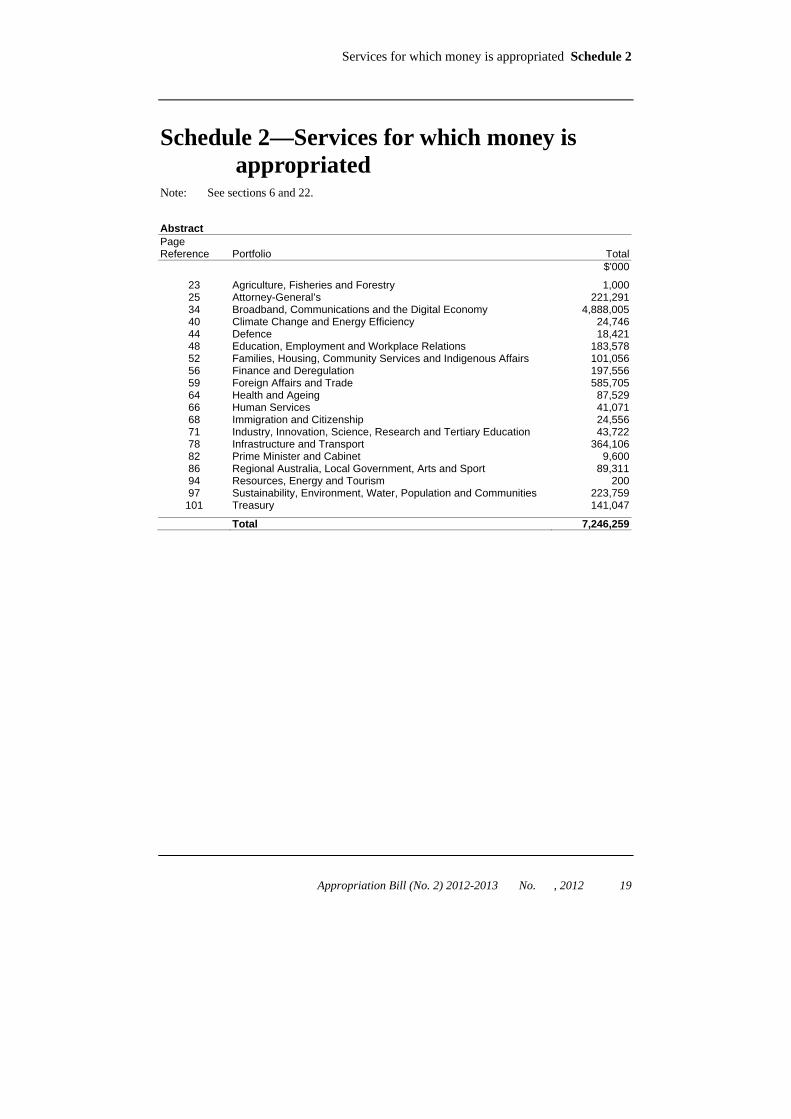
Schedule 2—Services for which money is appropriated
Note: See sections 6 and 22. Abstract
Page Reference
Portfolio
Total
$'000
23 Agriculture, Fisheries and Forestry 1,000 25 Attorney-General’s 221,291 34 Broadband, Communications and the Digital Economy 4,888,005 40 Climate Change and Energy Efficiency 24,746 44 Defence 18,421 48 Education, Employment and Workplace Relations 183,578 52 Families, Housing, Community Services and Indigenous Affairs 101,056 56 Finance and Deregulation 197,556 59 Foreign Affairs and Trade 585,705 64 Health and Ageing 87,529 66 Human Services 41,071 68 Immigration and Citizenship 24,556 71 Industry, Innovation, Science, Research and Tertiary Education 43,722 78 Infrastructure and Transport 364,106 82 Prime Minister and Cabinet 9,600 86 Regional Australia, Local Government, Arts and Sport 89,311 94 Resources, Energy and Tourism 200 97 Sustainability, Environment, Water, Population and Communities 223,759
101 Treasury 141,047
Total 7,246,259

Schedule 2 Services for which money is appropriated
20 Appropriation Bill (No. 2) 2012-2013 No. , 2012
APPROPRIATIONS

Services for which money is appropriated Schedule 2
Appropriation Bill (No. 2) 2012-2013 No. , 2012 21
SUMMARY
Summary of Appropriations (plain figures)—2012-2013 Actual Available Appropriation (italic figures)—2011-2012
Portfolio
Payments to States, ACT, NT and local government
New
Administered Outcomes
Non- operating
Total $'000 $'000 $'000 $'000
Agriculture, Fisheries and Forestry - - 1,000 1,000 - - 14,169 14,169
Attorney-General’s 5,000 - 216,291 221,291 5,709 - 145,716 151,425
Broadband, Communications and the Digital Economy
- 45,000 4,843,005 4,888,005 - - 2,362,503 2,362,503
Climate Change and Energy Efficiency 6,889 - 17,857 24,746 7,138 - 35,372 42,510
Defence - - 18,421 18,421 - - 2,793,191 2,793,191
Education, Employment and Workplace Relations
177,058 - 6,520 183,578 322,134 - 20,644 342,778
Families, Housing, Community Services and Indigenous Affairs
35,000 - 66,056 101,056 30,000 - 36,947 66,947
Finance and Deregulation - - 197,556 197,556 - - 210,159 210,159
Foreign Affairs and Trade - - 585,705 585,705 - - 136,107 136,107
Health and Ageing 15,226 - 72,303 87,529 25,793 - 25,148 50,941
Human Services - - 41,071 41,071 - - 62,078 62,078
Immigration and Citizenship - - 24,556 24,556 - - 35,927 35,927
Industry, Innovation, Science, Research and Tertiary Education
- - 43,722 43,722 - - 96,118 96,118
Infrastructure and Transport 360,545 - 3,561 364,106 439,902 - 63 439,965
Prime Minister and Cabinet - - 9,600 9,600 - - 1,980 1,980
Regional Australia, Local Government, Arts and Sport
26,862 - 62,449 89,311 120,388 - 64,544 184,932
Resources, Energy and Tourism - - 200 200 - - 4,963 4,963
Sustainability, Environment, Water, Population and Communities
23,332 - 200,427 223,759 16,804 - 427,075 443,879
Continued

Schedule 2 Services for which money is appropriated
22 Appropriation Bill (No. 2) 2012-2013 No. , 2012
SUMMARY
Summary of Appropriations (plain figures)—2012-2013 Actual Available Appropriation (italic figures)—2011-2012
Portfolio
Payments to States, ACT, NT and local government
New
Administered Outcomes
Non- operating
Total $'000 $'000 $'000 $'000
Treasury - - 141,047 141,047 - - 101,568 101,568
Total: Bill 2 649,912 45,000 6,551,347 7,246,259 967,868 - 6,574,272 7,542,140

Services for which money is appropriated Schedule 2
Appropriation Bill (No. 2) 2012-2013 No. , 2012 23
AGRICULTURE, FISHERIES AND FORESTRY PORTFOLIO
SUMMARY
Summary of Appropriations (plain figures)—2012-2013 Actual Available Appropriation (italic figures)—2011-2012
Entity
Payments to States, ACT, NT and local government
New
Administered Outcomes
Non- operating
Total $'000 $'000 $'000 $'000
Department of Agriculture, Fisheries and Forestry
- - 1,000 1,000 - - 14,169 14,169
Total: Agriculture, Fisheries and Forestry
- - 1,000 1,000 - - 14,169 14,169

Schedule 2 Services for which money is appropriated
24 Appropriation Bill (No. 2) 2012-2013 No. , 2012
AGRICULTURE, FISHERIES AND FORESTRY PORTFOLIO
Appropriation (plain figures)—2012-2013 Actual Available Appropriation (italic figures)—2011-2012
Payments to
States, ACT, NT and local government
New
Administered Outcomes
Total $'000 $'000 $'000
DEPARTMENT OF AGRICULTURE, FISHERIES AND FORESTRY
Non-operating Equity Injections 1,000
14,169 Total: Department of Agriculture, Fisheries
and Forestry - - 1,000 - - 14,169

Services for which money is appropriated Schedule 2
Appropriation Bill (No. 2) 2012-2013 No. , 2012 25
ATTORNEY-GENERAL’S PORTFOLIO
SUMMARY
Summary of Appropriations (plain figures)—2012-2013 Actual Available Appropriation (italic figures)—2011-2012
Entity
Payments to States, ACT, NT and local government
New
Administered Outcomes
Non- operating
Total $'000 $'000 $'000 $'000
Attorney-General’s Department 5,000 - 127,367 132,367 5,709 - 26,728 32,437
Australian Crime Commission - - 196 196 - - 300 300
Australian Customs and Border Protection Service
- - 64,882 64,882 - - 56,537 56,537
Australian Federal Police - - 11,973 11,973 - - 8,139 8,139
Australian Security Intelligence Organisation
- - 5,062 5,062 - - 41,806 41,806
Australian Transaction Reports and Analysis Centre
- - 5,361 5,361 - - 9,800 9,800
High Court of Australia - - 1,450 1,450 - - 1,361 1,361
Insolvency and Trustee Service Australia
- - - - - - 1,045 1,045
Total: Attorney-General’s 5,000 - 216,291 221,291 5,709 - 145,716 151,425

Schedule 2 Services for which money is appropriated
26 Appropriation Bill (No. 2) 2012-2013 No. , 2012
ATTORNEY-GENERAL’S PORTFOLIO
Appropriation (plain figures)—2012-2013 Actual Available Appropriation (italic figures)—2011-2012
Payments to
States, ACT, NT and local government
New
Administered Outcomes
Total $'000 $'000 $'000
ATTORNEY-GENERAL’S DEPARTMENT Operating
Outcome 1 - A just and secure society through the maintenance and improvement of Australia’s law and justice framework and its national security and emergency management system
5,000 - 5,000 5,709 - 5,709
Total: Operating 5,000 - 5,000 5,709 - 5,709 Non-operating
Equity Injections 234 8,057
Administered Assets and Liabilities 127,133 18,671
Total: Non-operating 127,367 26,728 Total: Attorney-General’s Department 5,000 - 132,367
5,709 - 32,437

Services for which money is appropriated Schedule 2
Appropriation Bill (No. 2) 2012-2013 No. , 2012 27
ATTORNEY-GENERAL’S PORTFOLIO
Appropriation (plain figures)—2012-2013 Actual Available Appropriation (italic figures)—2011-2012
Payments to
States, ACT, NT and local government
New
Administered Outcomes
Total $'000 $'000 $'000
AUSTRALIAN CRIME COMMISSION Non-operating
Equity Injections 196 300
Total: Australian Crime Commission - - 196 - - 300

Schedule 2 Services for which money is appropriated
28 Appropriation Bill (No. 2) 2012-2013 No. , 2012
ATTORNEY-GENERAL’S PORTFOLIO
Appropriation (plain figures)—2012-2013 Actual Available Appropriation (italic figures)—2011-2012
Payments to
States, ACT, NT and local government
New
Administered Outcomes
Total $'000 $'000 $'000
AUSTRALIAN CUSTOMS AND BORDER PROTECTION SERVICE
Non-operating Equity Injections 64,882
56,537 Total: Australian Customs and Border
Protection Service - - 64,882 - - 56,537

Services for which money is appropriated Schedule 2
Appropriation Bill (No. 2) 2012-2013 No. , 2012 29
ATTORNEY-GENERAL’S PORTFOLIO
Appropriation (plain figures)—2012-2013 Actual Available Appropriation (italic figures)—2011-2012
Payments to
States, ACT, NT and local government
New
Administered Outcomes
Total $'000 $'000 $'000
AUSTRALIAN FEDERAL POLICE Non-operating
Equity Injections 11,973 8,139
Total: Australian Federal Police - - 11,973 - - 8,139

Schedule 2 Services for which money is appropriated
30 Appropriation Bill (No. 2) 2012-2013 No. , 2012
ATTORNEY-GENERAL’S PORTFOLIO
Appropriation (plain figures)—2012-2013 Actual Available Appropriation (italic figures)—2011-2012
Payments to
States, ACT, NT and local government
New
Administered Outcomes
Total $'000 $'000 $'000
AUSTRALIAN SECURITY INTELLIGENCE ORGANISATION
Non-operating Equity Injections 5,062
41,806 Total: Australian Security Intelligence
Organisation - - 5,062 - - 41,806
Services for which money is appropriated Schedule 2
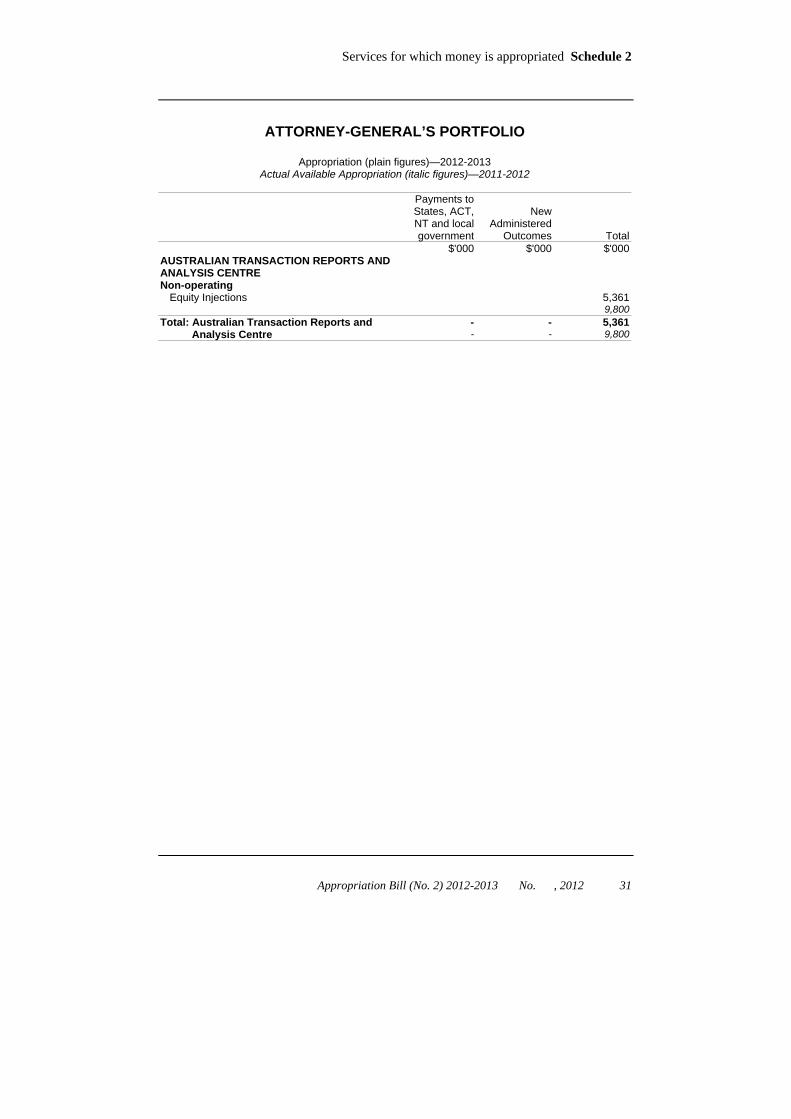
Appropriation Bill (No. 2) 2012-2013 No. , 2012 31
ATTORNEY-GENERAL’S PORTFOLIO
Appropriation (plain figures)—2012-2013 Actual Available Appropriation (italic figures)—2011-2012
Payments to
States, ACT, NT and local government
New
Administered Outcomes
Total $'000 $'000 $'000
AUSTRALIAN TRANSACTION REPORTS AND ANALYSIS CENTRE
Non-operating Equity Injections 5,361
9,800 Total: Australian Transaction Reports and
Analysis Centre - - 5,361 - - 9,800

Schedule 2 Services for which money is appropriated
32 Appropriation Bill (No. 2) 2012-2013 No. , 2012
ATTORNEY-GENERAL’S PORTFOLIO
Appropriation (plain figures)—2012-2013 Actual Available Appropriation (italic figures)—2011-2012
Payments to
States, ACT, NT and local government
New
Administered Outcomes
Total $'000 $'000 $'000
HIGH COURT OF AUSTRALIA Non-operating
Equity Injections 1,450 1,361
Total: High Court of Australia - - 1,450 - - 1,361

Services for which money is appropriated Schedule 2
Appropriation Bill (No. 2) 2012-2013 No. , 2012 33
ATTORNEY-GENERAL’S PORTFOLIO
Appropriation (plain figures)—2012-2013 Actual Available Appropriation (italic figures)—2011-2012
Payments to
States, ACT, NT and local government
New
Administered Outcomes
Total $'000 $'000 $'000
INSOLVENCY AND TRUSTEE SERVICE AUSTRALIA
Non-operating Equity Injections -
1,045 Total: Insolvency and Trustee Service
Australia - - - - - 1,045

Schedule 2 Services for which money is appropriated
34 Appropriation Bill (No. 2) 2012-2013 No. , 2012
BROADBAND, COMMUNICATIONS AND THE DIGITAL ECONOMY PORTFOLIO
SUMMARY
Summary of Appropriations (plain figures)—2012-2013 Actual Available Appropriation (italic figures)—2011-2012
Entity
Payments to States, ACT, NT and local government
New
Administered Outcomes
Non- operating
Total $'000 $'000 $'000 $'000
Department of Broadband, Communications and the Digital Economy
- - 4,822,455 4,822,455 - - 2,351,390 2,351,390
Payments to CAC Act bodies:
Australian Broadcasting Corporation - - 17,100 17,100 - - 5,950 5,950
Special Broadcasting Service Corporation
- - 2,900 2,900 - - 5,013 5,013
Australian Communications and Media Authority
- - 350 350 - - 150 150
Telecommunications Universal Service Management Agency
- 45,000 200 45,200 - - - -
Total: Broadband, Communications and the Digital Economy
- 45,000 4,843,005 4,888,005 - - 2,362,503 2,362,503

Services for which money is appropriated Schedule 2
Appropriation Bill (No. 2) 2012-2013 No. , 2012 35
BROADBAND, COMMUNICATIONS AND THE DIGITAL ECONOMY PORTFOLIO
Appropriation (plain figures)—2012-2013 Actual Available Appropriation (italic figures)—2011-2012
Payments to
States, ACT, NT and local government
New
Administered Outcomes
Total $'000 $'000 $'000
DEPARTMENT OF BROADBAND, COMMUNICATIONS AND THE DIGITAL ECONOMY
Non-operating
Equity Injections 900 2,116
Administered Assets and Liabilities 4,821,555 2,349,274
Total: Department of Broadband, Communications and the Digital Economy
- - 4,822,455 - - 2,351,390

Schedule 2 Services for which money is appropriated
36 Appropriation Bill (No. 2) 2012-2013 No. , 2012
BROADBAND, COMMUNICATIONS AND THE DIGITAL ECONOMY PORTFOLIO
Appropriation (plain figures)—2012-2013 Actual Available Appropriation (italic figures)—2011-2012
Non-operating $'000
DEPARTMENT OF BROADBAND, COMMUNICATIONS AND THE DIGITAL ECONOMY FOR PAYMENT TO
AUSTRALIAN BROADCASTING CORPORATION
17,100 5,950
Services for which money is appropriated Schedule 2
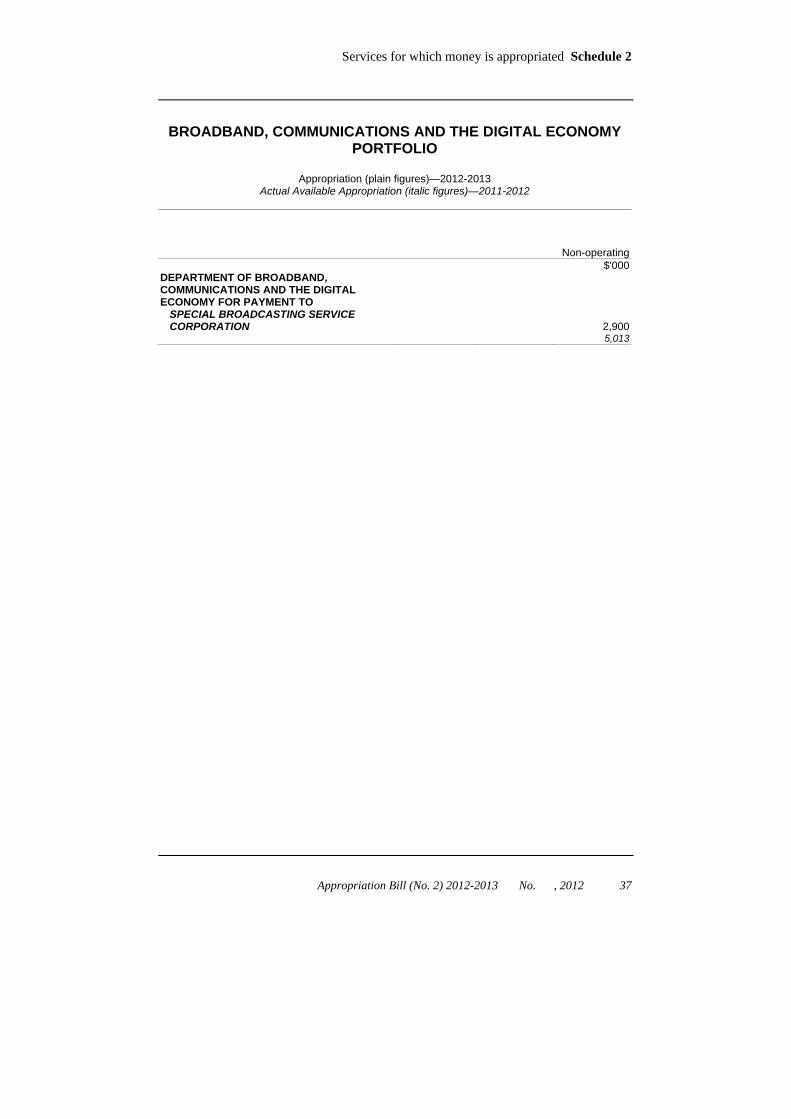
Appropriation Bill (No. 2) 2012-2013 No. , 2012 37
BROADBAND, COMMUNICATIONS AND THE DIGITAL ECONOMY PORTFOLIO
Appropriation (plain figures)—2012-2013 Actual Available Appropriation (italic figures)—2011-2012
Non-operating $'000
DEPARTMENT OF BROADBAND, COMMUNICATIONS AND THE DIGITAL ECONOMY FOR PAYMENT TO
SPECIAL BROADCASTING SERVICE CORPORATION
2,900 5,013

Schedule 2 Services for which money is appropriated
38 Appropriation Bill (No. 2) 2012-2013 No. , 2012
BROADBAND, COMMUNICATIONS AND THE DIGITAL ECONOMY PORTFOLIO
Appropriation (plain figures)—2012-2013 Actual Available Appropriation (italic figures)—2011-2012
Payments to
States, ACT, NT and local government
New
Administered Outcomes
Total $'000 $'000 $'000
AUSTRALIAN COMMUNICATIONS AND MEDIA AUTHORITY
Non-operating Equity Injections 350
150 Total: Australian Communications and Media
Authority - - 350 - - 150

Services for which money is appropriated Schedule 2
Appropriation Bill (No. 2) 2012-2013 No. , 2012 39
BROADBAND, COMMUNICATIONS AND THE DIGITAL ECONOMY PORTFOLIO
Appropriation (plain figures)—2012-2013 Actual Available Appropriation (italic figures)—2011-2012
Payments to
States, ACT, NT and local government
New
Administered Outcomes
Total $'000 $'000 $'000
TELECOMMUNICATIONS UNIVERSAL SERVICE MANAGEMENT AGENCY
Operating Outcome 1 - Support the delivery of universal service and other public interest telecommunications services for all Australians in accordance with Government policy, including through the management of telecommunications service agreements and grants
- 45,000 45,000 - - -
Total: Operating - 45,000 45,000 - - - Non-operating
Equity Injections 200 -
Total: Non-operating 200 - Total: Telecommunications Universal Service
Management Agency - 45,000 45,200 - - -
Schedule 2 Services for which money is appropriated
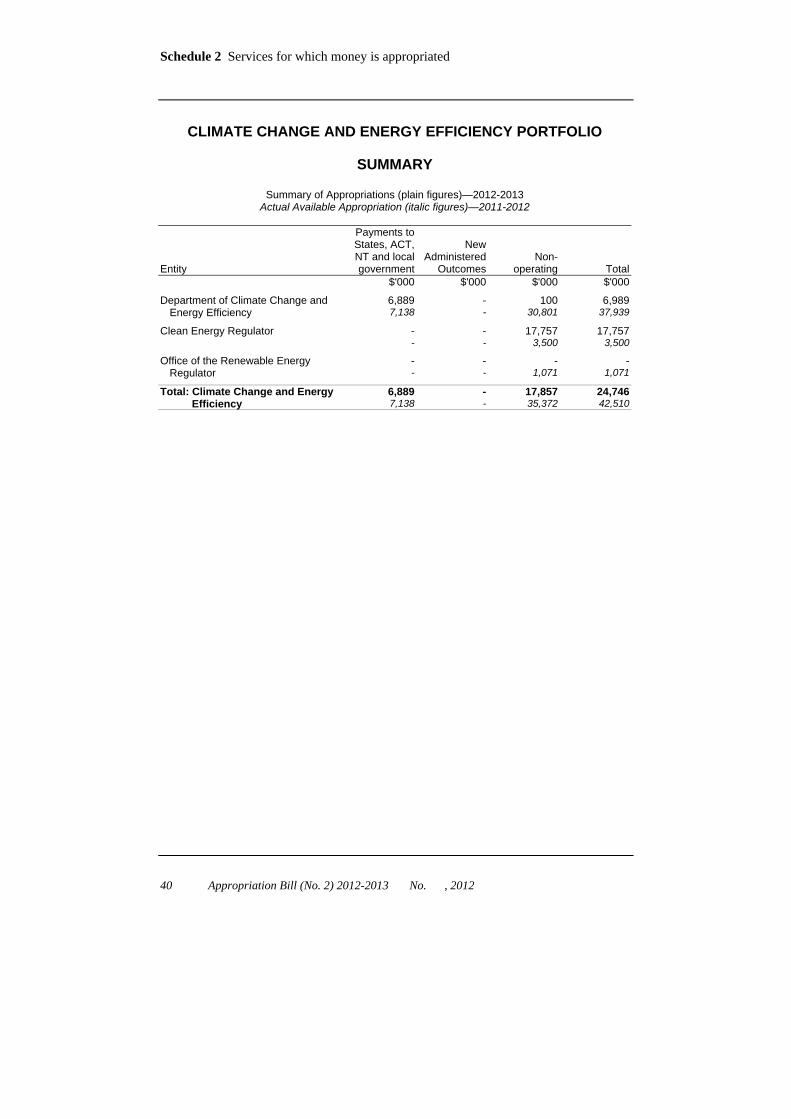
40 Appropriation Bill (No. 2) 2012-2013 No. , 2012
CLIMATE CHANGE AND ENERGY EFFICIENCY PORTFOLIO
SUMMARY
Summary of Appropriations (plain figures)—2012-2013 Actual Available Appropriation (italic figures)—2011-2012
Entity
Payments to States, ACT, NT and local government
New
Administered Outcomes
Non- operating
Total $'000 $'000 $'000 $'000
Department of Climate Change and Energy Efficiency
6,889 - 100 6,989 7,138 - 30,801 37,939
Clean Energy Regulator - - 17,757 17,757 - - 3,500 3,500
Office of the Renewable Energy Regulator
- - - - - - 1,071 1,071
Total: Climate Change and Energy Efficiency
6,889 - 17,857 24,746 7,138 - 35,372 42,510

Services for which money is appropriated Schedule 2
Appropriation Bill (No. 2) 2012-2013 No. , 2012 41
CLIMATE CHANGE AND ENERGY EFFICIENCY PORTFOLIO
Appropriation (plain figures)—2012-2013 Actual Available Appropriation (italic figures)—2011-2012
Payments to
States, ACT, NT and local government
New
Administered Outcomes
Total $'000 $'000 $'000
DEPARTMENT OF CLIMATE CHANGE AND ENERGY EFFICIENCY
Operating Outcome 1 - Reduction of Australia’s greenhouse gas emissions, adaptation to the impacts of climate change, and negotiation of an effective global solution, through the development and implementation of a national response to climate change; and bilateral, regional and multilateral engagement internationally
6,889 - 6,889 7,138 - 7,138
Total: Operating 6,889 - 6,889 7,138 - 7,138 Non-operating
Equity Injections 100 30,801
Total: Non-operating 100 30,801 Total: Department of Climate Change and
Energy Efficiency 6,889 - 6,989 7,138 - 37,939

Schedule 2 Services for which money is appropriated
42 Appropriation Bill (No. 2) 2012-2013 No. , 2012
CLIMATE CHANGE AND ENERGY EFFICIENCY PORTFOLIO
Appropriation (plain figures)—2012-2013 Actual Available Appropriation (italic figures)—2011-2012
Payments to
States, ACT, NT and local government
New
Administered Outcomes
Total $'000 $'000 $'000
CLEAN ENERGY REGULATOR Non-operating
Equity Injections 17,757 3,500
Total: Clean Energy Regulator - - 17,757 - - 3,500
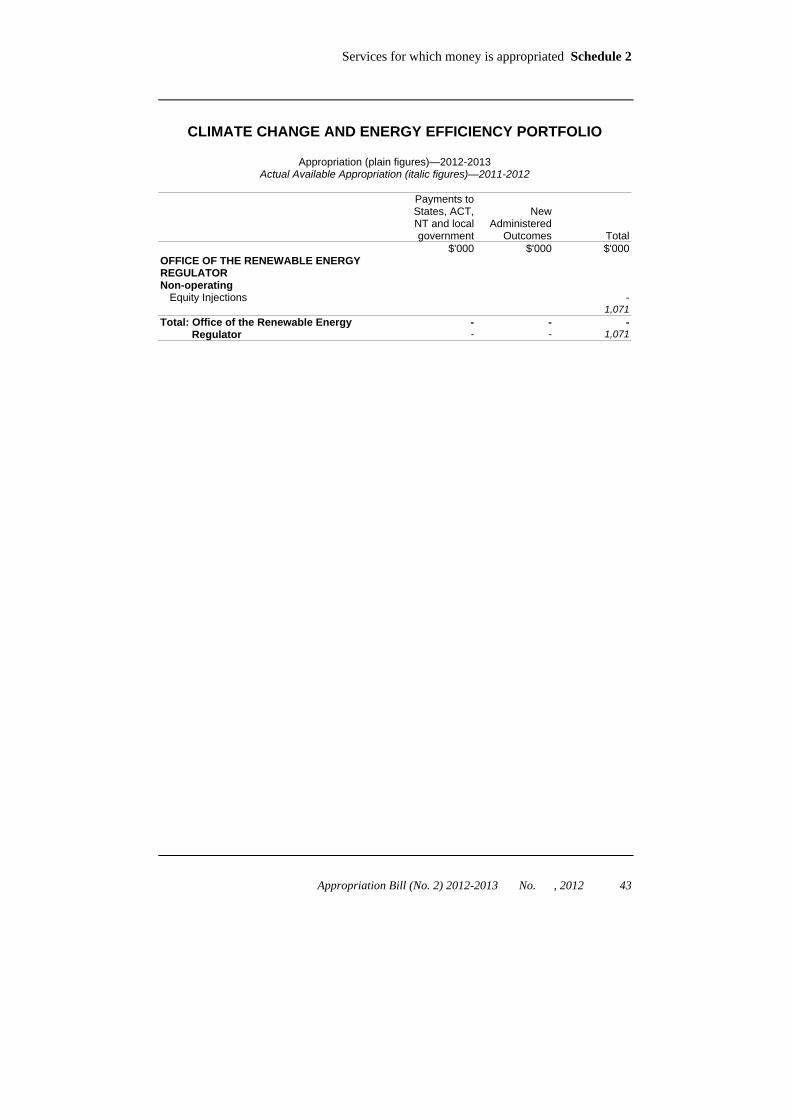
Services for which money is appropriated Schedule 2
Appropriation Bill (No. 2) 2012-2013 No. , 2012 43
CLIMATE CHANGE AND ENERGY EFFICIENCY PORTFOLIO
Appropriation (plain figures)—2012-2013 Actual Available Appropriation (italic figures)—2011-2012
Payments to
States, ACT, NT and local government
New
Administered Outcomes
Total $'000 $'000 $'000
OFFICE OF THE RENEWABLE ENERGY REGULATOR
Non-operating Equity Injections -
1,071 Total: Office of the Renewable Energy
Regulator - - - - - 1,071

Schedule 2 Services for which money is appropriated
44 Appropriation Bill (No. 2) 2012-2013 No. , 2012
DEFENCE PORTFOLIO
SUMMARY
Summary of Appropriations (plain figures)—2012-2013 Actual Available Appropriation (italic figures)—2011-2012
Entity
Payments to States, ACT, NT and local government
New
Administered Outcomes
Non- operating
Total $'000 $'000 $'000 $'000
Department of Defence - - - - - - 2,773,786 2,773,786
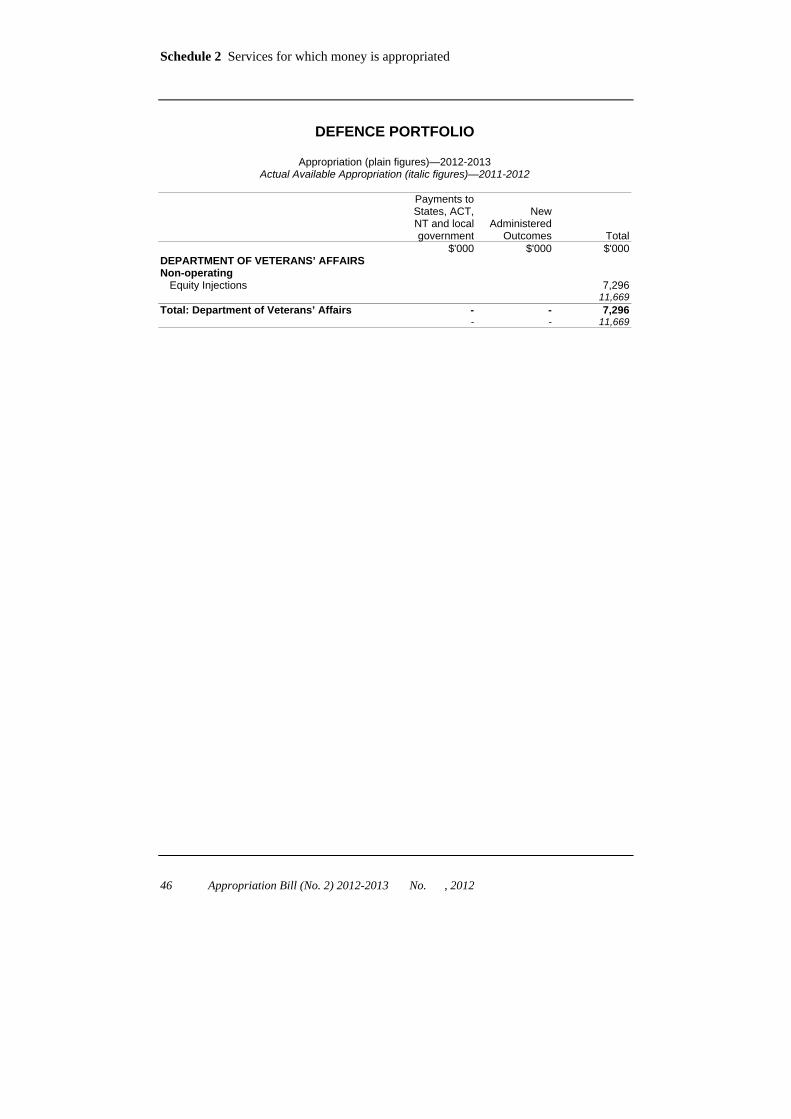
Department of Veterans’ Affairs - - 7,296 7,296 - - 11,669 11,669
Payments to CAC Act bodies:
Australian War Memorial - - 11,125 11,125 - - 7,736 7,736
Total: Defence - - 18,421 18,421 - - 2,793,191 2,793,191

Services for which money is appropriated Schedule 2
Appropriation Bill (No. 2) 2012-2013 No. , 2012 45
DEFENCE PORTFOLIO
Appropriation (plain figures)—2012-2013 Actual Available Appropriation (italic figures)—2011-2012
Payments to
States, ACT, NT and local government
New
Administered Outcomes
Total $'000 $'000 $'000
DEPARTMENT OF DEFENCE Non-operating
Equity Injections - 2,773,786
Total: Department of Defence - - - - - 2,773,786
Schedule 2 Services for which money is appropriated
46 Appropriation Bill (No. 2) 2012-2013 No. , 2012
DEFENCE PORTFOLIO
Appropriation (plain figures)—2012-2013 Actual Available Appropriation (italic figures)—2011-2012
Payments to
States, ACT, NT and local government
New
Administered Outcomes
Total $'000 $'000 $'000
DEPARTMENT OF VETERANS’ AFFAIRS Non-operating
Equity Injections 7,296 11,669
Total: Department of Veterans’ Affairs - - 7,296 - - 11,669

Services for which money is appropriated Schedule 2
Appropriation Bill (No. 2) 2012-2013 No. , 2012 47
DEFENCE PORTFOLIO
Appropriation (plain figures)—2012-2013 Actual Available Appropriation (italic figures)—2011-2012
Non-operating $'000
DEPARTMENT OF VETERANS’ AFFAIRS FOR PAYMENT TO
AUSTRALIAN WAR MEMORIAL
11,125 7,736
Schedule 2 Services for which money is appropriated
48 Appropriation Bill (No. 2) 2012-2013 No. , 2012
EDUCATION, EMPLOYMENT AND WORKPLACE RELATIONS PORTFOLIO
SUMMARY
Summary of Appropriations (plain figures)—2012-2013 Actual Available Appropriation (italic figures)—2011-2012
Entity
Payments to States, ACT, NT and local government
New
Administered Outcomes
Non- operating
Total $'000 $'000 $'000 $'000
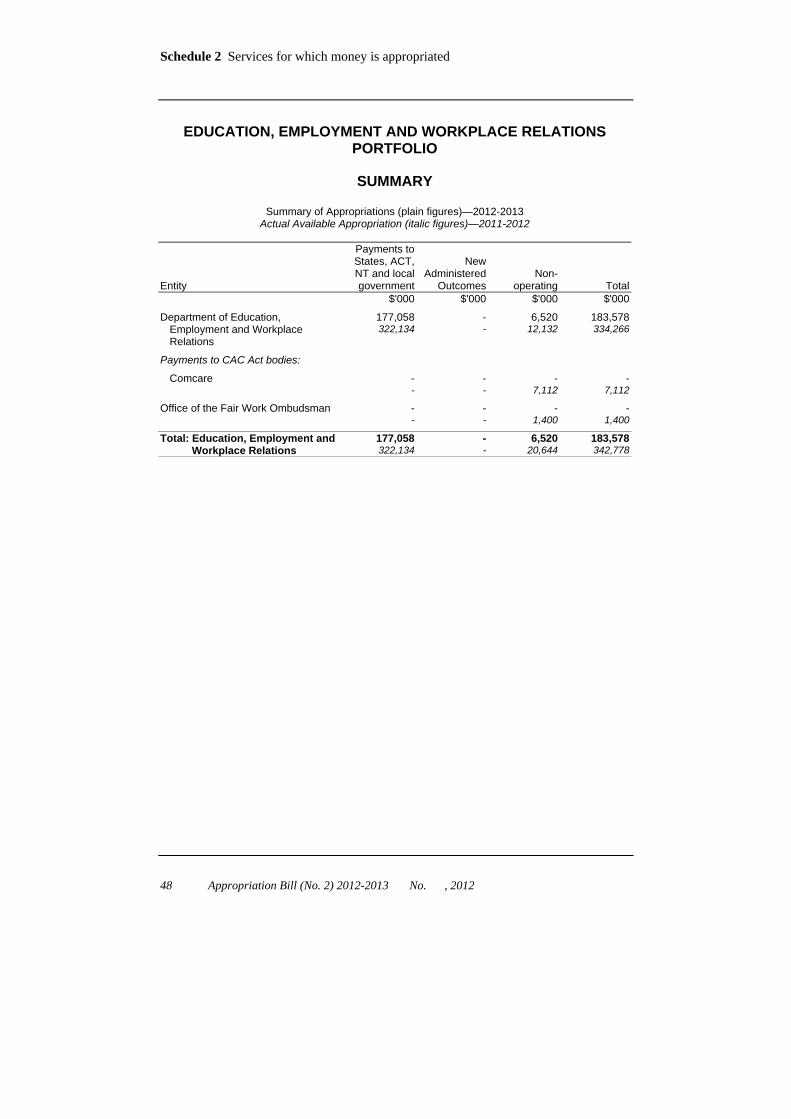
Department of Education, Employment and Workplace Relations
177,058 - 6,520 183,578 322,134 - 12,132 334,266
Payments to CAC Act bodies:
Comcare - - - - - - 7,112 7,112
Office of the Fair Work Ombudsman - - - - - - 1,400 1,400
Total: Education, Employment and Workplace Relations
177,058 - 6,520 183,578 322,134 - 20,644 342,778

Services for which money is appropriated Schedule 2
Appropriation Bill (No. 2) 2012-2013 No. , 2012 49
EDUCATION, EMPLOYMENT AND WORKPLACE RELATIONS PORTFOLIO
Appropriation (plain figures)—2012-2013 Actual Available Appropriation (italic figures)—2011-2012
Payments to
States, ACT, NT and local government
New
Administered Outcomes
Total $'000 $'000 $'000
DEPARTMENT OF EDUCATION, EMPLOYMENT AND WORKPLACE RELATIONS
Operating
Outcome 2 - Improved learning, and literacy, numeracy and educational attainment for school students, through funding for quality teaching and learning environments, workplace learning and career advice
177,058 - 177,058 322,134 - 322,134
Total: Operating 177,058 - 177,058 322,134 - 322,134 Non-operating
Equity Injections 6,520 12,132
Total: Non-operating 6,520 12,132 Total: Department of Education, Employment
and Workplace Relations 177,058 - 183,578 322,134 - 334,266

Schedule 2 Services for which money is appropriated
50 Appropriation Bill (No. 2) 2012-2013 No. , 2012
EDUCATION, EMPLOYMENT AND WORKPLACE RELATIONS PORTFOLIO
Appropriation (plain figures)—2012-2013 Actual Available Appropriation (italic figures)—2011-2012
Non-operating $'000
DEPARTMENT OF EDUCATION, EMPLOYMENT AND WORKPLACE RELATIONS FOR PAYMENT TO
COMCARE
- 7,112

Services for which money is appropriated Schedule 2
Appropriation Bill (No. 2) 2012-2013 No. , 2012 51
EDUCATION, EMPLOYMENT AND WORKPLACE RELATIONS PORTFOLIO
Appropriation (plain figures)—2012-2013 Actual Available Appropriation (italic figures)—2011-2012
Payments to
States, ACT, NT and local government
New
Administered Outcomes
Total $'000 $'000 $'000
OFFICE OF THE FAIR WORK OMBUDSMAN Non-operating
Equity Injections - 1,400
Total: Office of the Fair Work Ombudsman - - - - - 1,400

Schedule 2 Services for which money is appropriated
52 Appropriation Bill (No. 2) 2012-2013 No. , 2012
FAMILIES, HOUSING, COMMUNITY SERVICES AND INDIGENOUS AFFAIRS PORTFOLIO
SUMMARY
Summary of Appropriations (plain figures)—2012-2013 Actual Available Appropriation (italic figures)—2011-2012
Entity
Payments to States, ACT, NT and local government
New
Administered Outcomes
Non- operating
Total $'000 $'000 $'000 $'000
Department of Families, Housing, Community Services and Indigenous Affairs
35,000 - 27,686 62,686 30,000 - 2,997 32,997
Payments to CAC Act bodies:
Indigenous Business Australia - - 37,540 37,540 - - 33,170 33,170
Equal Opportunity for Women in the Workplace Agency
- - 830 830 - - 780 780
Total: Families, Housing, Community Services and Indigenous Affairs
35,000 - 66,056 101,056 30,000 - 36,947 66,947
Services for which money is appropriated Schedule 2
Appropriation Bill (No. 2) 2012-2013 No. , 2012 53
FAMILIES, HOUSING, COMMUNITY SERVICES AND INDIGENOUS AFFAIRS PORTFOLIO
Appropriation (plain figures)—2012-2013 Actual Available Appropriation (italic figures)—2011-2012
Payments to
States, ACT, NT and local government
New
Administered Outcomes
Total $'000 $'000 $'000
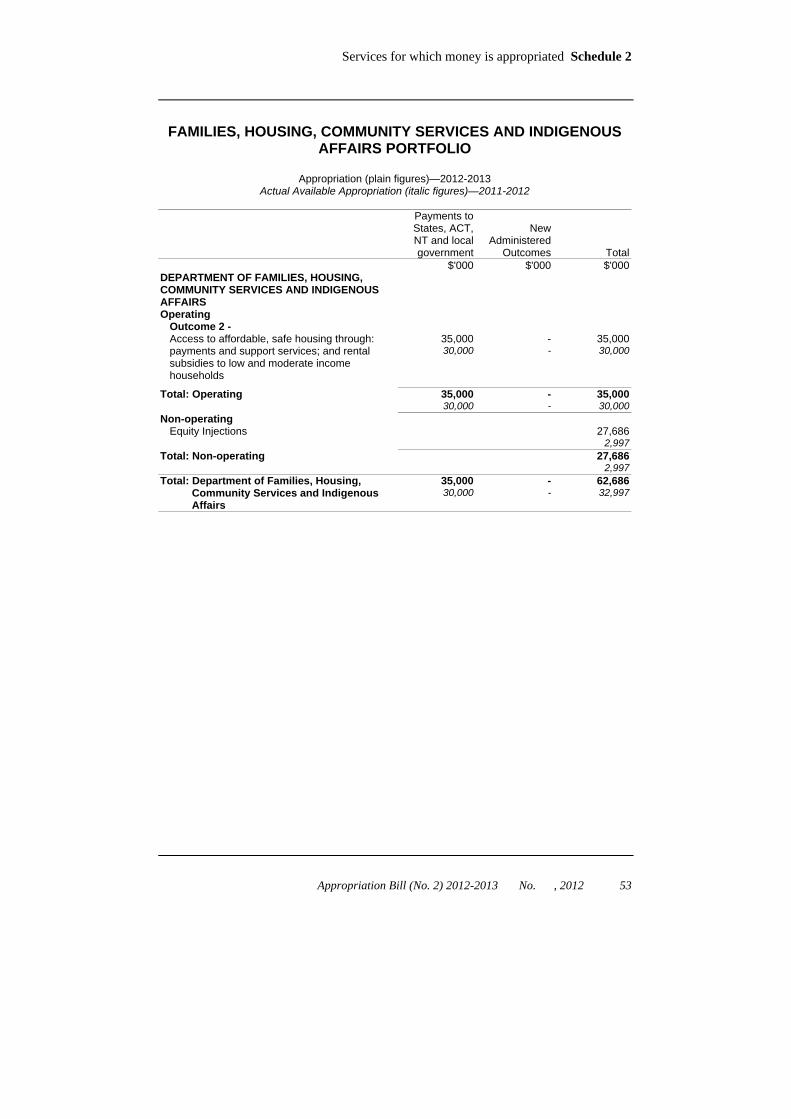
DEPARTMENT OF FAMILIES, HOUSING, COMMUNITY SERVICES AND INDIGENOUS AFFAIRS
Operating
Outcome 2 - Access to affordable, safe housing through: payments and support services; and rental subsidies to low and moderate income households
35,000 - 35,000 30,000 - 30,000
Total: Operating 35,000 - 35,000 30,000 - 30,000 Non-operating
Equity Injections 27,686 2,997
Total: Non-operating 27,686 2,997 Total: Department of Families, Housing,
Community Services and Indigenous Affairs
35,000 - 62,686 30,000 - 32,997

Schedule 2 Services for which money is appropriated
54 Appropriation Bill (No. 2) 2012-2013 No. , 2012
FAMILIES, HOUSING, COMMUNITY SERVICES AND INDIGENOUS AFFAIRS PORTFOLIO
Appropriation (plain figures)—2012-2013 Actual Available Appropriation (italic figures)—2011-2012
Non-operating $'000
DEPARTMENT OF FAMILIES, HOUSING, COMMUNITY SERVICES AND INDIGENOUS AFFAIRS FOR PAYMENT TO
INDIGENOUS BUSINESS AUSTRALIA
37,540 33,170

Services for which money is appropriated Schedule 2
Appropriation Bill (No. 2) 2012-2013 No. , 2012 55
FAMILIES, HOUSING, COMMUNITY SERVICES AND INDIGENOUS AFFAIRS PORTFOLIO
Appropriation (plain figures)—2012-2013 Actual Available Appropriation (italic figures)—2011-2012
Payments to
States, ACT, NT and local government
New
Administered Outcomes
Total $'000 $'000 $'000
EQUAL OPPORTUNITY FOR WOMEN IN THE WORKPLACE AGENCY
Non-operating Equity Injections 830
780 Total: Equal Opportunity for Women in the
Workplace Agency - - 830 - - 780

Schedule 2 Services for which money is appropriated
56 Appropriation Bill (No. 2) 2012-2013 No. , 2012
FINANCE AND DEREGULATION PORTFOLIO
SUMMARY
Summary of Appropriations (plain figures)—2012-2013 Actual Available Appropriation (italic figures)—2011-2012
Entity
Payments to States, ACT, NT and local government
New
Administered Outcomes
Non- operating
Total $'000 $'000 $'000 $'000
Department of Finance and Deregulation
- - 197,286 197,286 - - 209,789 209,789
Australian Electoral Commission - - 270 270 - - 370 370
Total: Finance and Deregulation - - 197,556 197,556 - - 210,159 210,159

Services for which money is appropriated Schedule 2
Appropriation Bill (No. 2) 2012-2013 No. , 2012 57
FINANCE AND DEREGULATION PORTFOLIO
Appropriation (plain figures)—2012-2013 Actual Available Appropriation (italic figures)—2011-2012
Payments to
States, ACT, NT and local government
New
Administered Outcomes
Total $'000 $'000 $'000
DEPARTMENT OF FINANCE AND DEREGULATION
Non-operating Equity Injections 190,464
208,000 Administered Assets and Liabilities 6,822
1,789 Total: Department of Finance and
Deregulation - - 197,286 - - 209,789

Schedule 2 Services for which money is appropriated
58 Appropriation Bill (No. 2) 2012-2013 No. , 2012
FINANCE AND DEREGULATION PORTFOLIO
Appropriation (plain figures)—2012-2013 Actual Available Appropriation (italic figures)—2011-2012
Payments to
States, ACT, NT and local government
New
Administered Outcomes
Total $'000 $'000 $'000
AUSTRALIAN ELECTORAL COMMISSION Non-operating
Equity Injections 270 370
Total: Australian Electoral Commission - - 270 - - 370

Services for which money is appropriated Schedule 2
Appropriation Bill (No. 2) 2012-2013 No. , 2012 59
FOREIGN AFFAIRS AND TRADE PORTFOLIO
SUMMARY
Summary of Appropriations (plain figures)—2012-2013 Actual Available Appropriation (italic figures)—2011-2012
Entity
Payments to States, ACT, NT and local government
New
Administered Outcomes
Non- operating
Total $'000 $'000 $'000 $'000
Department of Foreign Affairs and Trade
- - 56,814 56,814 - - 72,005 72,005
AusAID - - 522,507 522,507 - - 63,683 63,683
Australian Centre for International Agricultural Research
- - 304 304 - - 200 200
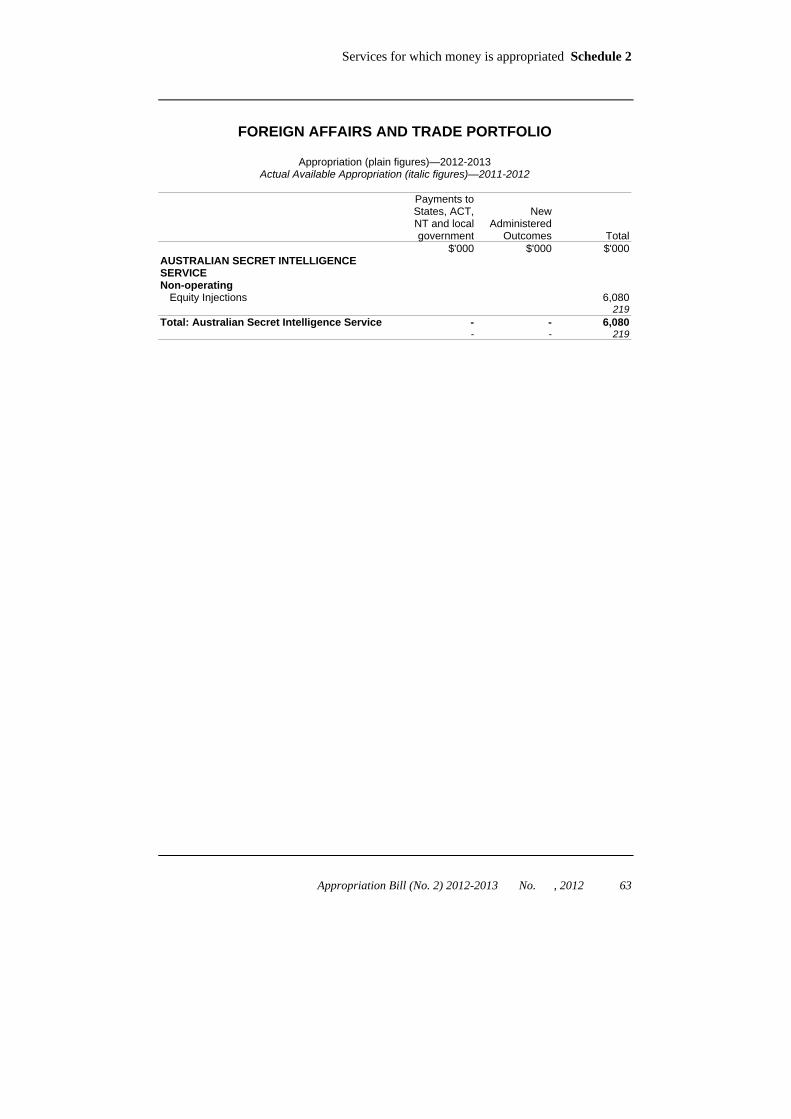
Australian Secret Intelligence Service - - 6,080 6,080 - - 219 219
Total: Foreign Affairs and Trade - - 585,705 585,705 - - 136,107 136,107

Schedule 2 Services for which money is appropriated
60 Appropriation Bill (No. 2) 2012-2013 No. , 2012
FOREIGN AFFAIRS AND TRADE PORTFOLIO
Appropriation (plain figures)—2012-2013 Actual Available Appropriation (italic figures)—2011-2012
Payments to
States, ACT, NT and local government
New
Administered Outcomes
Total $'000 $'000 $'000
DEPARTMENT OF FOREIGN AFFAIRS AND TRADE
Non-operating Equity Injections 56,814
72,005 Total: Department of Foreign Affairs and
Trade - - 56,814 - - 72,005
Services for which money is appropriated Schedule 2
Appropriation Bill (No. 2) 2012-2013 No. , 2012 61
FOREIGN AFFAIRS AND TRADE PORTFOLIO
Appropriation (plain figures)—2012-2013 Actual Available Appropriation (italic figures)—2011-2012
Payments to
States, ACT, NT and local government
New
Administered Outcomes
Total $'000 $'000 $'000
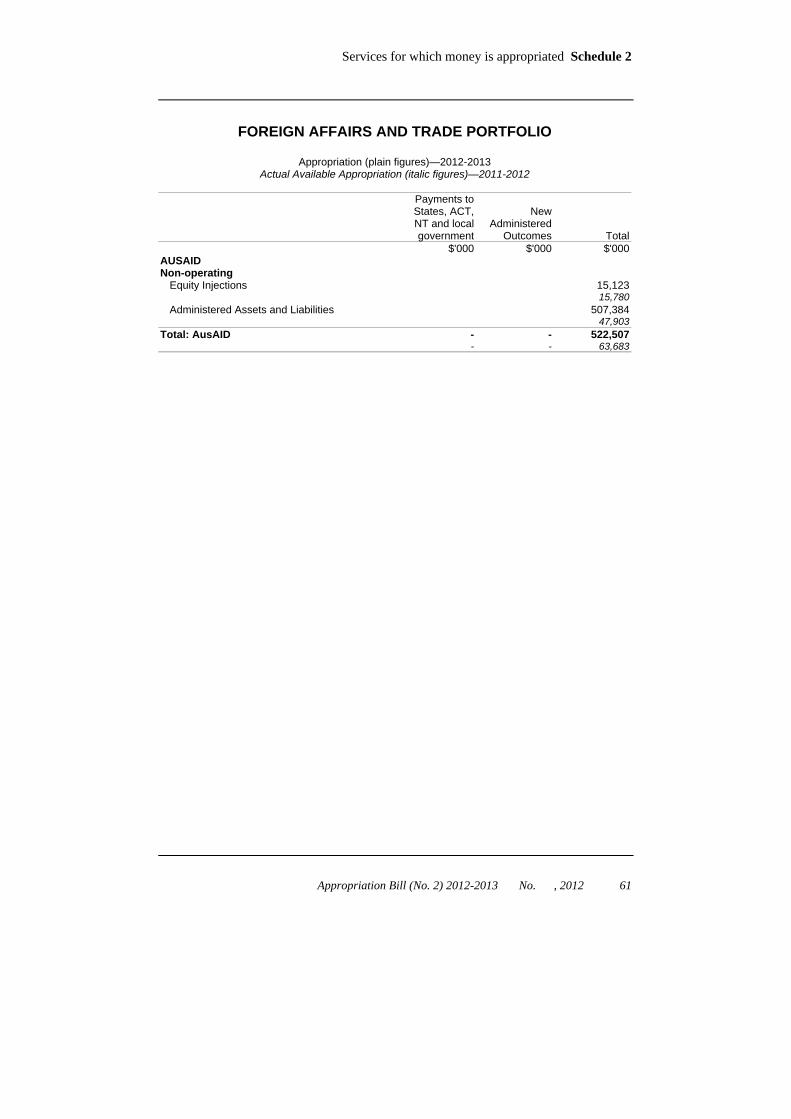
AUSAID Non-operating
Equity Injections 15,123 15,780
Administered Assets and Liabilities 507,384 47,903
Total: AusAID - - 522,507 - - 63,683

Schedule 2 Services for which money is appropriated
62 Appropriation Bill (No. 2) 2012-2013 No. , 2012
FOREIGN AFFAIRS AND TRADE PORTFOLIO
Appropriation (plain figures)—2012-2013 Actual Available Appropriation (italic figures)—2011-2012
Payments to
States, ACT, NT and local government
New
Administered Outcomes
Total $'000 $'000 $'000
AUSTRALIAN CENTRE FOR INTERNATIONAL AGRICULTURAL RESEARCH
Non-operating Equity Injections 304
200 Total: Australian Centre for International
Agricultural Research - - 304 - - 200
Services for which money is appropriated Schedule 2
Appropriation Bill (No. 2) 2012-2013 No. , 2012 63
FOREIGN AFFAIRS AND TRADE PORTFOLIO
Appropriation (plain figures)—2012-2013 Actual Available Appropriation (italic figures)—2011-2012
Payments to
States, ACT, NT and local government
New
Administered Outcomes
Total $'000 $'000 $'000
AUSTRALIAN SECRET INTELLIGENCE SERVICE
Non-operating Equity Injections 6,080
219 Total: Australian Secret Intelligence Service - - 6,080
- - 219
Schedule 2 Services for which money is appropriated
64 Appropriation Bill (No. 2) 2012-2013 No. , 2012
HEALTH AND AGEING PORTFOLIO
SUMMARY
Summary of Appropriations (plain figures)—2012-2013 Actual Available Appropriation (italic figures)—2011-2012
Entity
Payments to States, ACT, NT and local government
New
Administered Outcomes
Non- operating
Total $'000 $'000 $'000 $'000
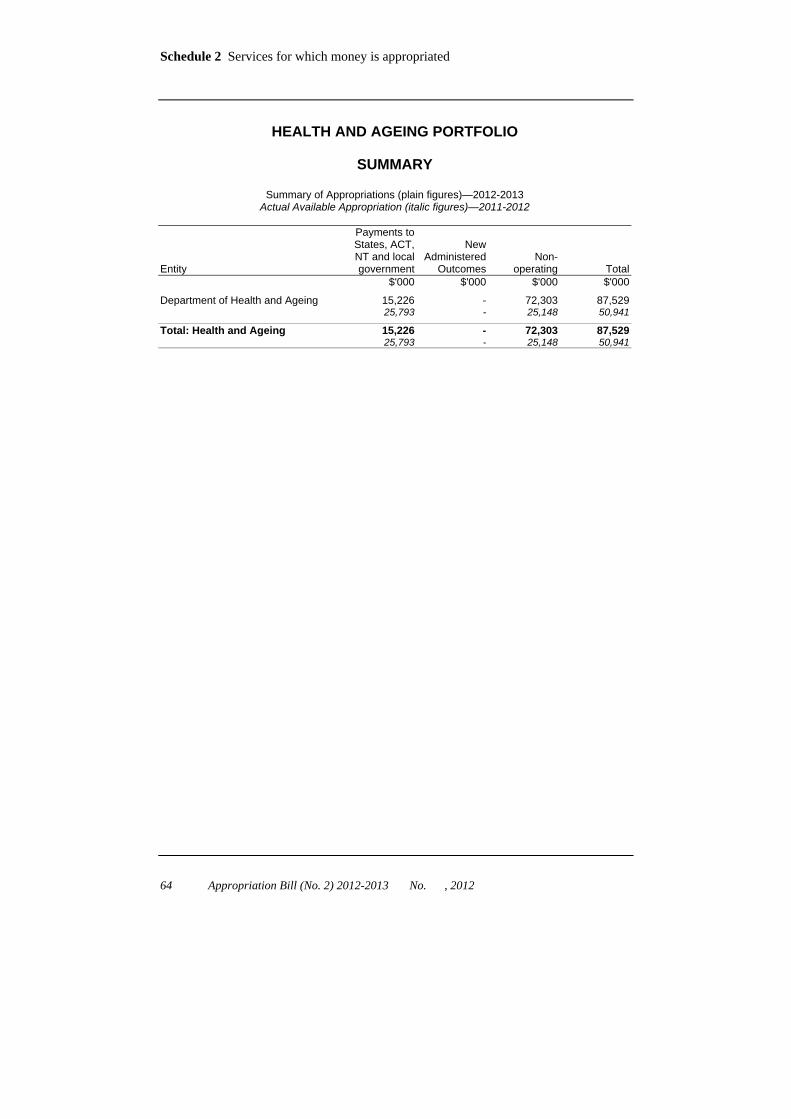
Department of Health and Ageing 15,226 - 72,303 87,529 25,793 - 25,148 50,941
Total: Health and Ageing 15,226 - 72,303 87,529 25,793 - 25,148 50,941

Services for which money is appropriated Schedule 2
Appropriation Bill (No. 2) 2012-2013 No. , 2012 65
HEALTH AND AGEING PORTFOLIO
Appropriation (plain figures)—2012-2013 Actual Available Appropriation (italic figures)—2011-2012
Payments to
States, ACT, NT and local government
New
Administered Outcomes
Total $'000 $'000 $'000
DEPARTMENT OF HEALTH AND AGEING Operating
Outcome 1 - Population Health - A reduction in the incidence of preventable mortality and morbidity in Australia, including through regulation and national initiatives that support healthy lifestyles and disease prevention
15,226 - 15,226 25,793 - 25,793
Total: Operating 15,226 - 15,226 25,793 - 25,793 Non-operating
Equity Injections 52,510 24,613
Administered Assets and Liabilities 19,793 535
Total: Non-operating 72,303 25,148 Total: Department of Health and Ageing 15,226 - 87,529
25,793 - 50,941

Schedule 2 Services for which money is appropriated
66 Appropriation Bill (No. 2) 2012-2013 No. , 2012
HUMAN SERVICES PORTFOLIO
SUMMARY
Summary of Appropriations (plain figures)—2012-2013 Actual Available Appropriation (italic figures)—2011-2012
Entity
Payments to States, ACT, NT and local government
New
Administered Outcomes
Non- operating
Total $'000 $'000 $'000 $'000
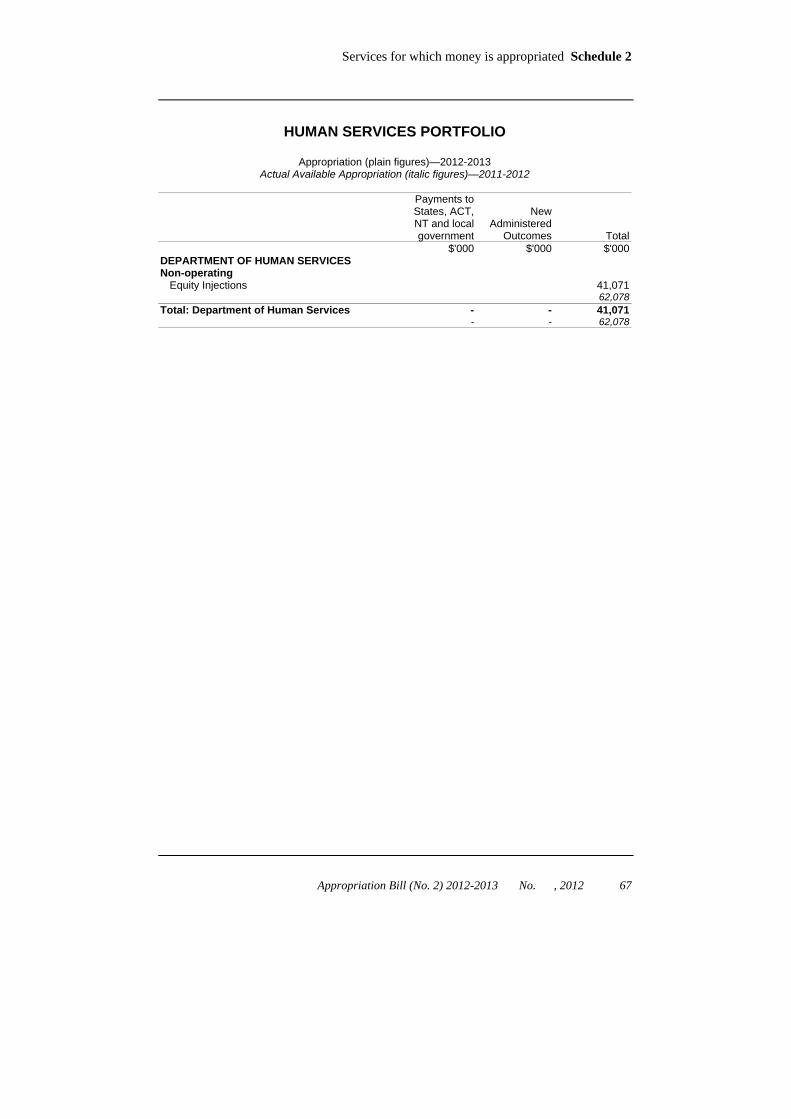
Department of Human Services - - 41,071 41,071 - - 62,078 62,078
Total: Human Services - - 41,071 41,071 - - 62,078 62,078
Services for which money is appropriated Schedule 2
Appropriation Bill (No. 2) 2012-2013 No. , 2012 67
HUMAN SERVICES PORTFOLIO
Appropriation (plain figures)—2012-2013 Actual Available Appropriation (italic figures)—2011-2012
Payments to
States, ACT, NT and local government
New
Administered Outcomes
Total $'000 $'000 $'000
DEPARTMENT OF HUMAN SERVICES Non-operating
Equity Injections 41,071 62,078
Total: Department of Human Services - - 41,071 - - 62,078

Schedule 2 Services for which money is appropriated
68 Appropriation Bill (No. 2) 2012-2013 No. , 2012
IMMIGRATION AND CITIZENSHIP PORTFOLIO
SUMMARY
Summary of Appropriations (plain figures)—2012-2013 Actual Available Appropriation (italic figures)—2011-2012
Entity
Payments to States, ACT, NT and local government
New
Administered Outcomes
Non- operating
Total $'000 $'000 $'000 $'000
Department of Immigration and Citizenship
- - 24,515 24,515 - - 35,664 35,664
Migration Review Tribunal and Refugee Review Tribunal
- - 41 41 - - 263 263
Total: Immigration and Citizenship - - 24,556 24,556 - - 35,927 35,927

Services for which money is appropriated Schedule 2
Appropriation Bill (No. 2) 2012-2013 No. , 2012 69
IMMIGRATION AND CITIZENSHIP PORTFOLIO
Appropriation (plain figures)—2012-2013 Actual Available Appropriation (italic figures)—2011-2012
Payments to
States, ACT, NT and local government
New
Administered Outcomes
Total $'000 $'000 $'000
DEPARTMENT OF IMMIGRATION AND CITIZENSHIP
Non-operating Equity Injections 24,515
11,698 Administered Assets and Liabilities -
23,966 Total: Department of Immigration and
Citizenship - - 24,515 - - 35,664

Schedule 2 Services for which money is appropriated
70 Appropriation Bill (No. 2) 2012-2013 No. , 2012
IMMIGRATION AND CITIZENSHIP PORTFOLIO
Appropriation (plain figures)—2012-2013 Actual Available Appropriation (italic figures)—2011-2012
Payments to
States, ACT, NT and local government
New
Administered Outcomes
Total $'000 $'000 $'000
MIGRATION REVIEW TRIBUNAL AND REFUGEE REVIEW TRIBUNAL
Non-operating Equity Injections 41
263 Total: Migration Review Tribunal and Refugee
Review Tribunal - - 41 - - 263

Services for which money is appropriated Schedule 2
Appropriation Bill (No. 2) 2012-2013 No. , 2012 71
INDUSTRY, INNOVATION, SCIENCE, RESEARCH AND TERTIARY EDUCATION PORTFOLIO
SUMMARY
Summary of Appropriations (plain figures)—2012-2013 Actual Available Appropriation (italic figures)—2011-2012
Entity
Payments to States, ACT, NT and local government
New
Administered Outcomes
Non- operating
Total $'000 $'000 $'000 $'000
Department of Industry, Innovation, Science, Research and Tertiary Education
- - 34,762 34,762 - - 85,857 85,857
Payments to CAC Act bodies:
Australian Institute of Aboriginal and Torres Strait Islander Studies
- - 73 73 - - 71 71
Australian Nuclear Science and Technology Organisation
- - 3,500 3,500 - - 1,400 1,400
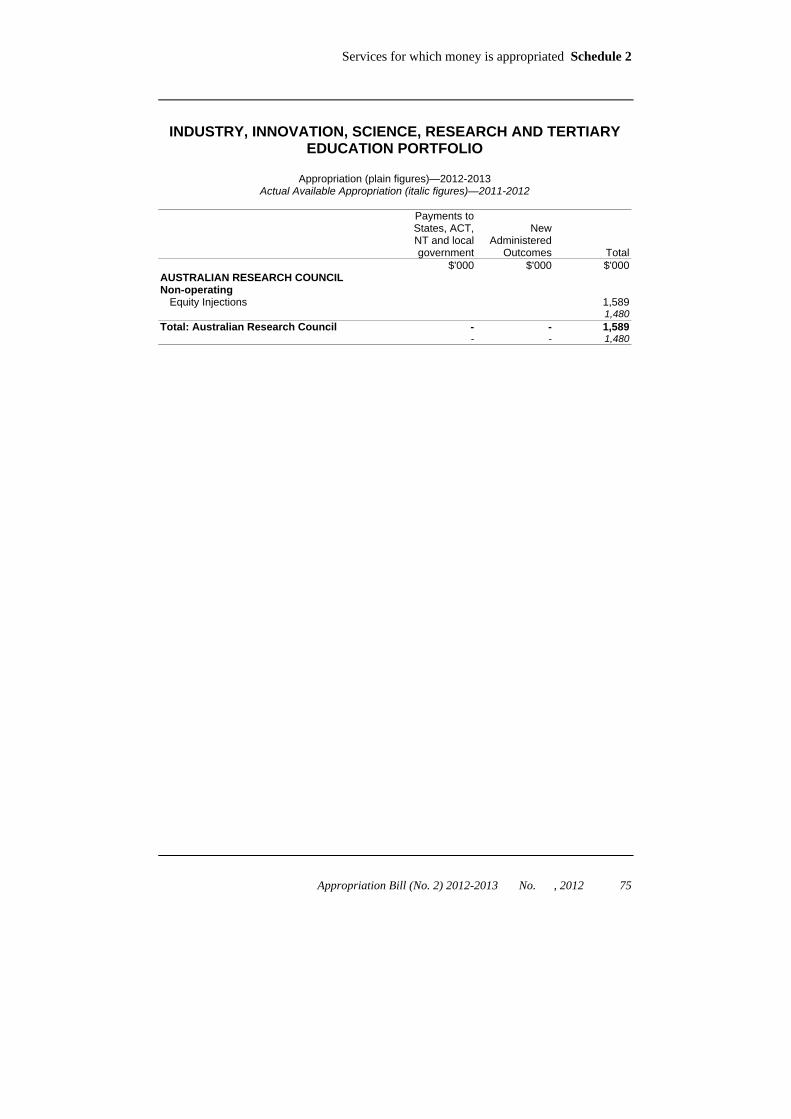
Australian Research Council - - 1,589 1,589 - - 1,480 1,480
National Vocational Education and Training Regulator (Australian Skills Quality Authority)
- - 1,898 1,898 - - 3,524 3,524
Tertiary Education Quality and Standards Agency
- - 1,900 1,900 - - 3,786 3,786
Total: Industry, Innovation, Science, Research and Tertiary Education
- - 43,722 43,722 - - 96,118 96,118

Schedule 2 Services for which money is appropriated
72 Appropriation Bill (No. 2) 2012-2013 No. , 2012
INDUSTRY, INNOVATION, SCIENCE, RESEARCH AND TERTIARY EDUCATION PORTFOLIO
Appropriation (plain figures)—2012-2013 Actual Available Appropriation (italic figures)—2011-2012
Payments to
States, ACT, NT and local government
New
Administered Outcomes
Total $'000 $'000 $'000
DEPARTMENT OF INDUSTRY, INNOVATION, SCIENCE, RESEARCH AND TERTIARY EDUCATION
Non-operating
Equity Injections 10,762 3,610
Administered Assets and Liabilities 24,000 82,247
Total: Department of Industry, Innovation, Science, Research and Tertiary Education
- - 34,762 - - 85,857

Services for which money is appropriated Schedule 2
Appropriation Bill (No. 2) 2012-2013 No. , 2012 73
INDUSTRY, INNOVATION, SCIENCE, RESEARCH AND TERTIARY EDUCATION PORTFOLIO
Appropriation (plain figures)—2012-2013 Actual Available Appropriation (italic figures)—2011-2012
Non-operating $'000
DEPARTMENT OF INDUSTRY, INNOVATION, SCIENCE, RESEARCH AND TERTIARY EDUCATION FOR PAYMENT TO
AUSTRALIAN INSTITUTE OF ABORIGINAL AND TORRES STRAIT ISLANDER STUDIES
73 71

Schedule 2 Services for which money is appropriated
74 Appropriation Bill (No. 2) 2012-2013 No. , 2012
INDUSTRY, INNOVATION, SCIENCE, RESEARCH AND TERTIARY EDUCATION PORTFOLIO
Appropriation (plain figures)—2012-2013 Actual Available Appropriation (italic figures)—2011-2012
Non-operating $'000
DEPARTMENT OF INDUSTRY, INNOVATION, SCIENCE, RESEARCH AND TERTIARY EDUCATION FOR PAYMENT TO
AUSTRALIAN NUCLEAR SCIENCE AND TECHNOLOGY ORGANISATION
3,500 1,400
Services for which money is appropriated Schedule 2
Appropriation Bill (No. 2) 2012-2013 No. , 2012 75
INDUSTRY, INNOVATION, SCIENCE, RESEARCH AND TERTIARY EDUCATION PORTFOLIO
Appropriation (plain figures)—2012-2013 Actual Available Appropriation (italic figures)—2011-2012
Payments to
States, ACT, NT and local government
New
Administered Outcomes
Total $'000 $'000 $'000
AUSTRALIAN RESEARCH COUNCIL Non-operating
Equity Injections 1,589 1,480
Total: Australian Research Council - - 1,589 - - 1,480

Schedule 2 Services for which money is appropriated
76 Appropriation Bill (No. 2) 2012-2013 No. , 2012
INDUSTRY, INNOVATION, SCIENCE, RESEARCH AND TERTIARY EDUCATION PORTFOLIO
Appropriation (plain figures)—2012-2013 Actual Available Appropriation (italic figures)—2011-2012
Payments to
States, ACT, NT and local government
New
Administered Outcomes
Total $'000 $'000 $'000
NATIONAL VOCATIONAL EDUCATION AND TRAINING REGULATOR (AUSTRALIAN SKILLS QUALITY AUTHORITY)
Non-operating
Equity Injections 1,898 3,524
Total: National Vocational Education and Training Regulator (Australian Skills Quality Authority)
- - 1,898 - - 3,524

Services for which money is appropriated Schedule 2
Appropriation Bill (No. 2) 2012-2013 No. , 2012 77
INDUSTRY, INNOVATION, SCIENCE, RESEARCH AND TERTIARY EDUCATION PORTFOLIO
Appropriation (plain figures)—2012-2013 Actual Available Appropriation (italic figures)—2011-2012
Payments to
States, ACT, NT and local government
New
Administered Outcomes
Total $'000 $'000 $'000
TERTIARY EDUCATION QUALITY AND STANDARDS AGENCY
Non-operating Equity Injections 1,900
3,786 Total: Tertiary Education Quality and
Standards Agency - - 1,900 - - 3,786

Schedule 2 Services for which money is appropriated
78 Appropriation Bill (No. 2) 2012-2013 No. , 2012
INFRASTRUCTURE AND TRANSPORT PORTFOLIO
SUMMARY
Summary of Appropriations (plain figures)—2012-2013 Actual Available Appropriation (italic figures)—2011-2012
Entity
Payments to States, ACT, NT and local government
New
Administered Outcomes
Non- operating
Total $'000 $'000 $'000 $'000
Department of Infrastructure and Transport
360,545 - - 360,545 439,902 - - 439,902
Payments to CAC Act bodies:
Australian Maritime Safety Authority - - 2,380 2,380 - - - -
Australian Transport Safety Bureau - - 1,181 1,181 - - 63 63
Total: Infrastructure and Transport 360,545 - 3,561 364,106 439,902 - 63 439,965
Services for which money is appropriated Schedule 2
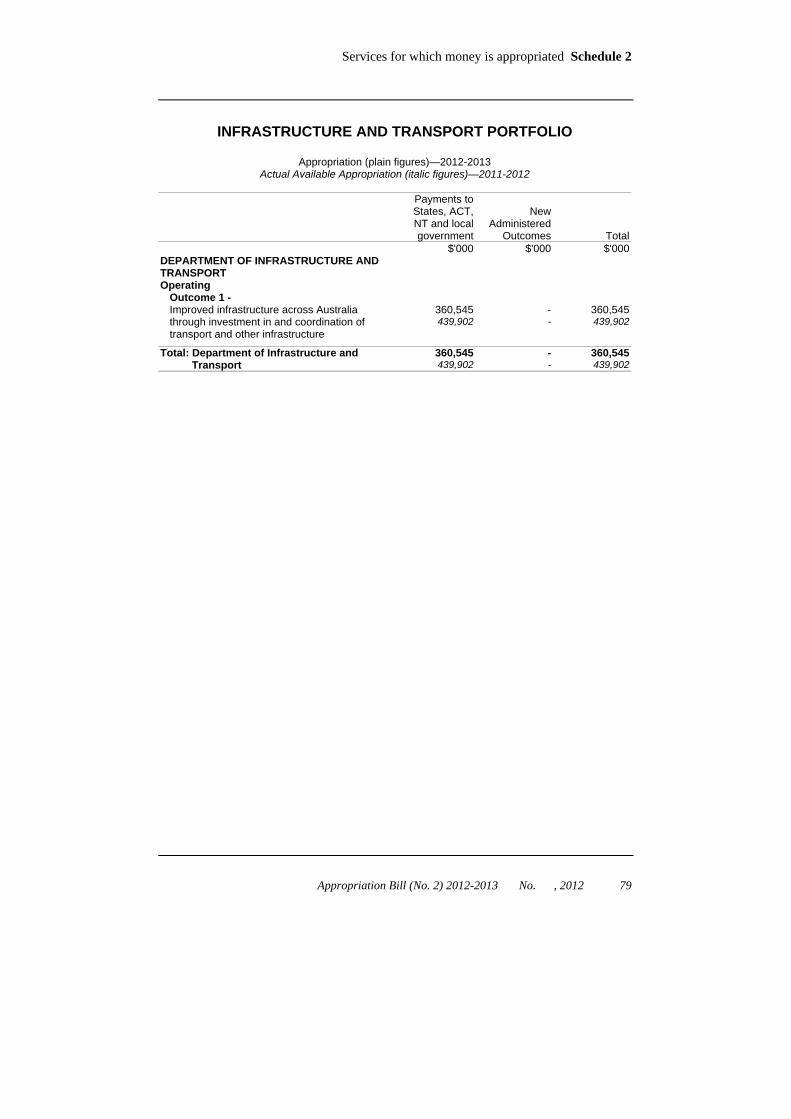
Appropriation Bill (No. 2) 2012-2013 No. , 2012 79
INFRASTRUCTURE AND TRANSPORT PORTFOLIO
Appropriation (plain figures)—2012-2013 Actual Available Appropriation (italic figures)—2011-2012
Payments to
States, ACT, NT and local government
New
Administered Outcomes
Total $'000 $'000 $'000
DEPARTMENT OF INFRASTRUCTURE AND TRANSPORT
Operating Outcome 1 - Improved infrastructure across Australia through investment in and coordination of transport and other infrastructure
360,545 - 360,545 439,902 - 439,902
Total: Department of Infrastructure and Transport
360,545 - 360,545 439,902 - 439,902
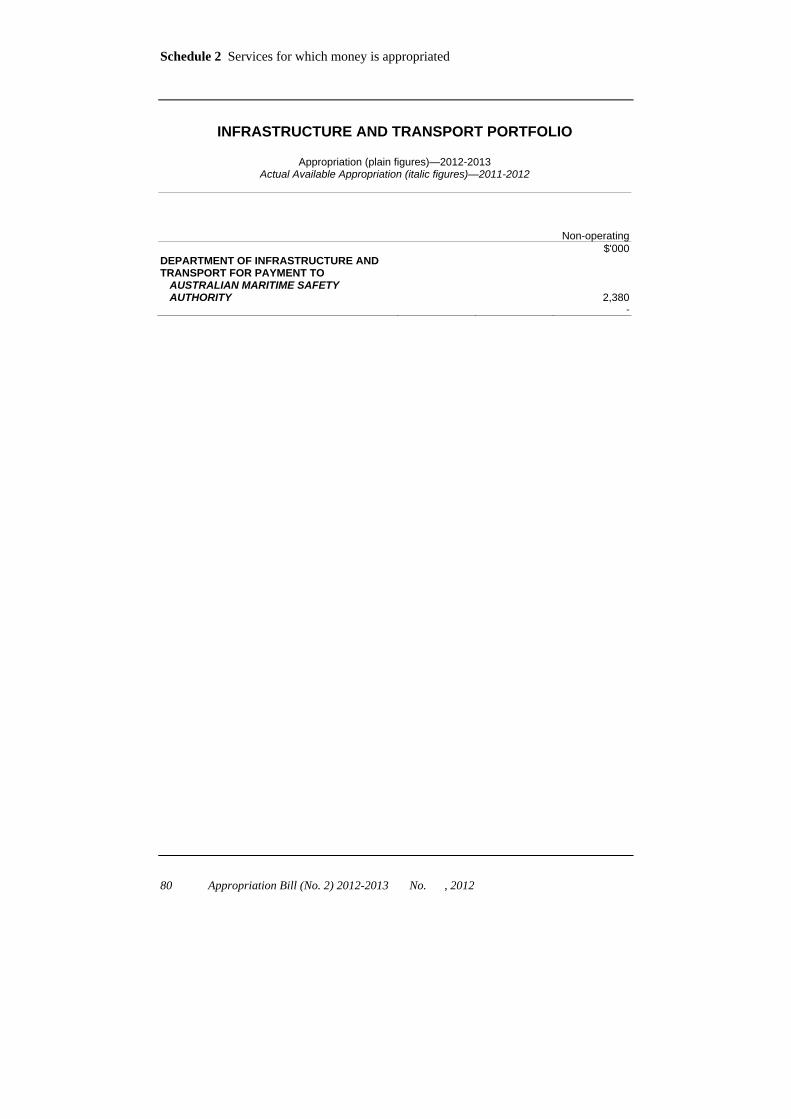
Schedule 2 Services for which money is appropriated
80 Appropriation Bill (No. 2) 2012-2013 No. , 2012
INFRASTRUCTURE AND TRANSPORT PORTFOLIO
Appropriation (plain figures)—2012-2013 Actual Available Appropriation (italic figures)—2011-2012
Non-operating $'000
DEPARTMENT OF INFRASTRUCTURE AND TRANSPORT FOR PAYMENT TO
AUSTRALIAN MARITIME SAFETY AUTHORITY
2,380 -
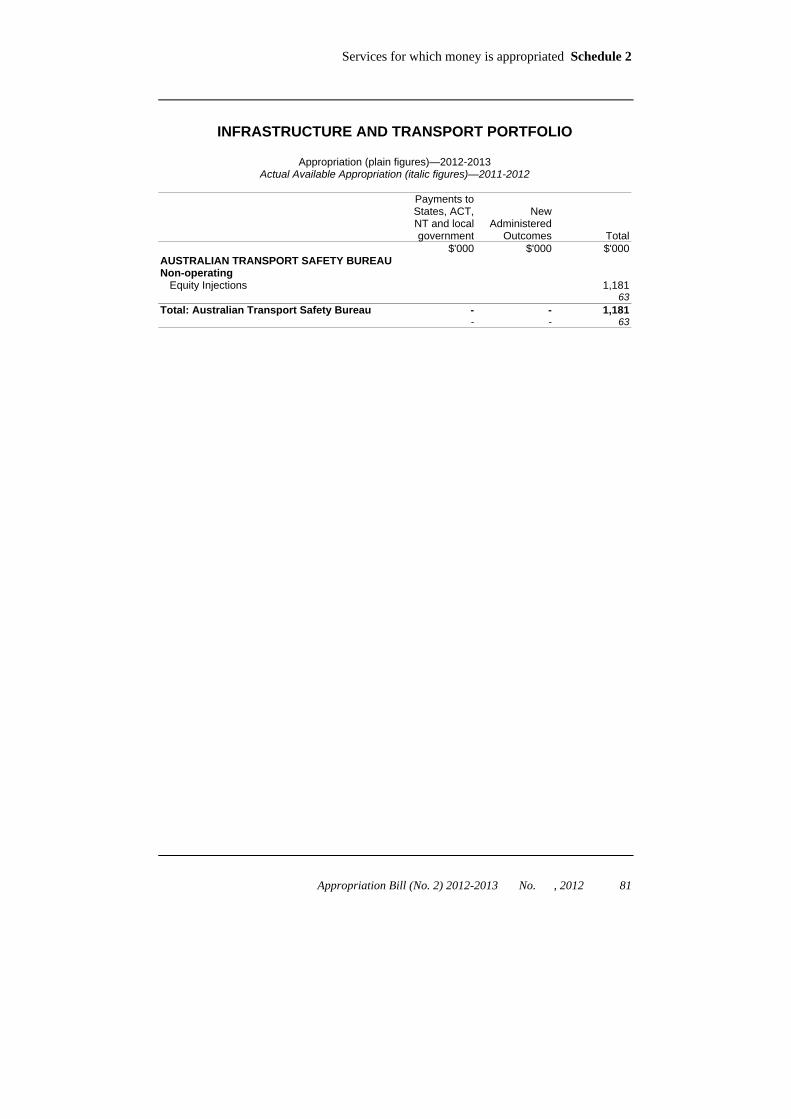
Services for which money is appropriated Schedule 2
Appropriation Bill (No. 2) 2012-2013 No. , 2012 81
INFRASTRUCTURE AND TRANSPORT PORTFOLIO
Appropriation (plain figures)—2012-2013 Actual Available Appropriation (italic figures)—2011-2012
Payments to
States, ACT, NT and local government
New
Administered Outcomes
Total $'000 $'000 $'000
AUSTRALIAN TRANSPORT SAFETY BUREAU Non-operating
Equity Injections 1,181 63
Total: Australian Transport Safety Bureau - - 1,181 - - 63

Schedule 2 Services for which money is appropriated
82 Appropriation Bill (No. 2) 2012-2013 No. , 2012
PRIME MINISTER AND CABINET PORTFOLIO
SUMMARY
Summary of Appropriations (plain figures)—2012-2013 Actual Available Appropriation (italic figures)—2011-2012
Entity
Payments to States, ACT, NT and local government
New
Administered Outcomes
Non- operating
Total $'000 $'000 $'000 $'000
Department of the Prime Minister and Cabinet
- - 9,600 9,600 - - 738 738
National Mental Health Commission - - - - - - 172 172
Office of the Official Secretary to the Governor-General
- - - - - - 1,070 1,070
Total: Prime Minister and Cabinet - - 9,600 9,600 - - 1,980 1,980
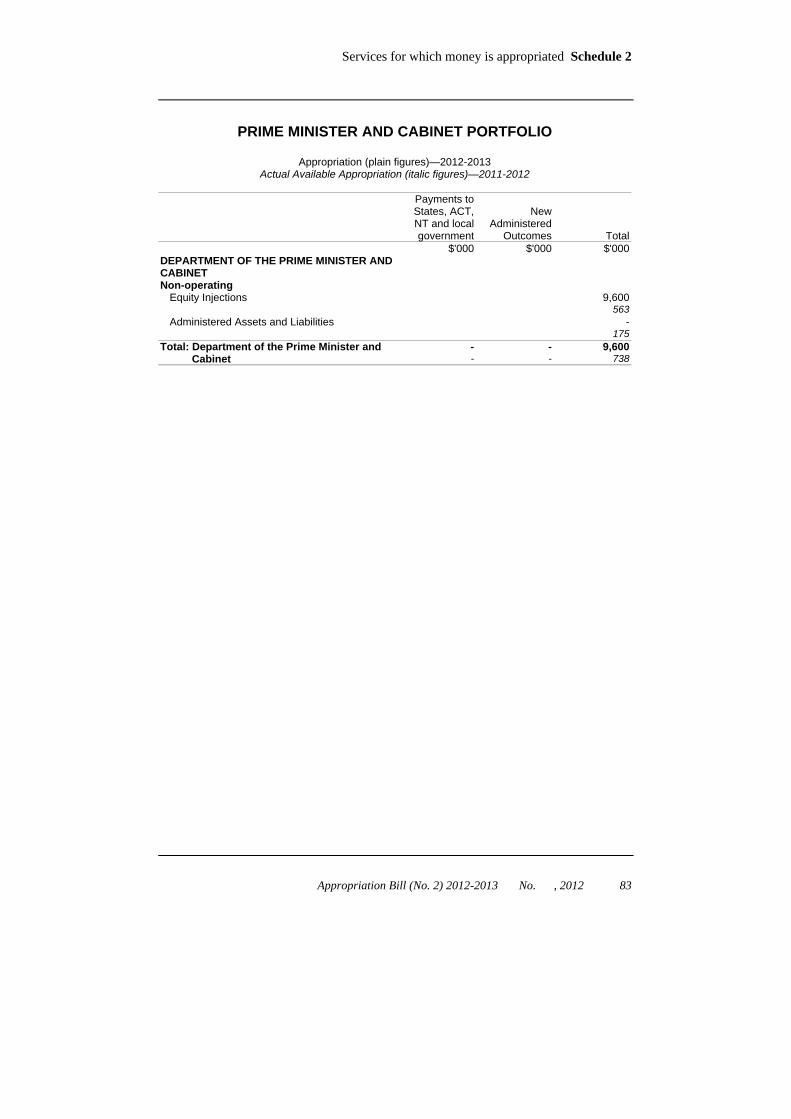
Services for which money is appropriated Schedule 2
Appropriation Bill (No. 2) 2012-2013 No. , 2012 83
PRIME MINISTER AND CABINET PORTFOLIO
Appropriation (plain figures)—2012-2013 Actual Available Appropriation (italic figures)—2011-2012
Payments to
States, ACT, NT and local government
New
Administered Outcomes
Total $'000 $'000 $'000
DEPARTMENT OF THE PRIME MINISTER AND CABINET
Non-operating Equity Injections 9,600
563 Administered Assets and Liabilities -
175 Total: Department of the Prime Minister and
Cabinet - - 9,600 - - 738

Schedule 2 Services for which money is appropriated
84 Appropriation Bill (No. 2) 2012-2013 No. , 2012
PRIME MINISTER AND CABINET PORTFOLIO
Appropriation (plain figures)—2012-2013 Actual Available Appropriation (italic figures)—2011-2012
Payments to
States, ACT, NT and local government
New
Administered Outcomes
Total $'000 $'000 $'000
NATIONAL MENTAL HEALTH COMMISSION Non-operating
Equity Injections - 172
Total: National Mental Health Commission - - - - - 172
Services for which money is appropriated Schedule 2
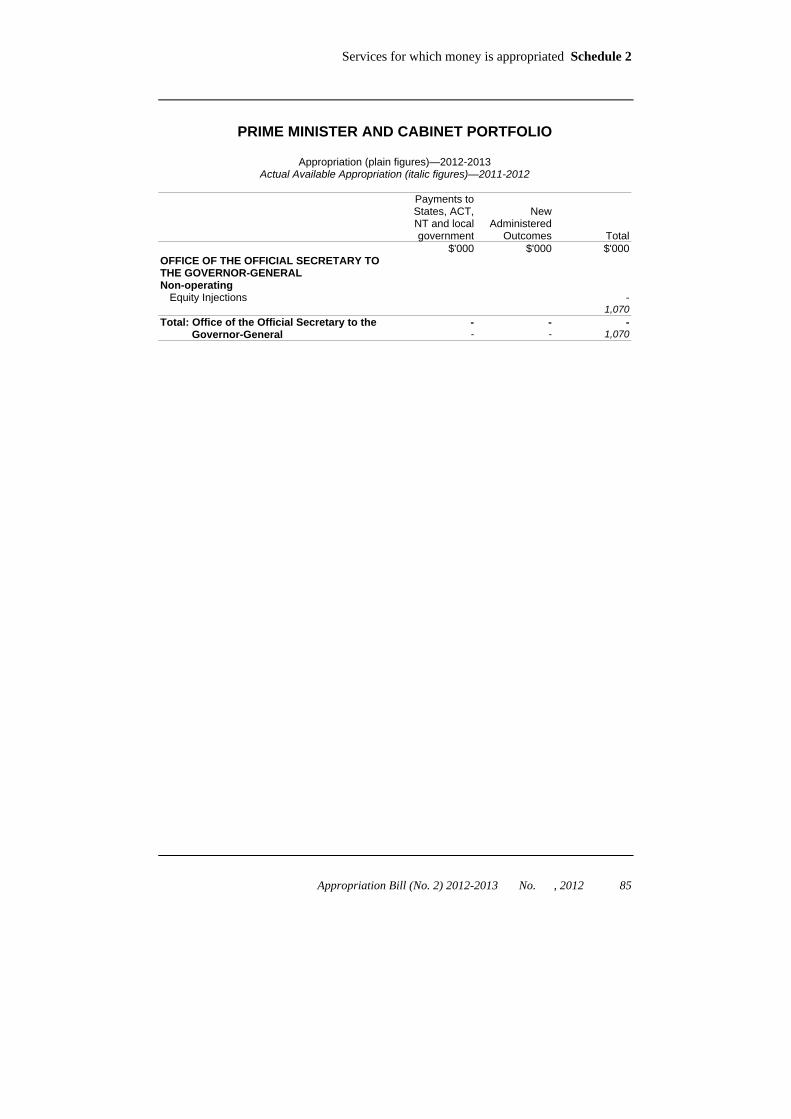
Appropriation Bill (No. 2) 2012-2013 No. , 2012 85
PRIME MINISTER AND CABINET PORTFOLIO
Appropriation (plain figures)—2012-2013 Actual Available Appropriation (italic figures)—2011-2012
Payments to
States, ACT, NT and local government
New
Administered Outcomes
Total $'000 $'000 $'000
OFFICE OF THE OFFICIAL SECRETARY TO THE GOVERNOR-GENERAL
Non-operating Equity Injections -
1,070 Total: Office of the Official Secretary to the
Governor-General - - - - - 1,070

Schedule 2 Services for which money is appropriated
86 Appropriation Bill (No. 2) 2012-2013 No. , 2012
REGIONAL AUSTRALIA, LOCAL GOVERNMENT, ARTS AND SPORT PORTFOLIO
SUMMARY
Summary of Appropriations (plain figures)—2012-2013 Actual Available Appropriation (italic figures)—2011-2012
Entity
Payments to States, ACT, NT and local government
New
Administered Outcomes
Non- operating
Total $'000 $'000 $'000 $'000
Department of Regional Australia, Local Government, Arts and Sport
26,862 - 31,500 58,362 120,388 - 33,982 154,370
Payments to CAC Act bodies:
Australian National Maritime Museum
- - 1,728 1,728 - - 1,668 1,668
National Film and Sound Archive - - 825 825 - - 766 766
National Gallery of Australia - - 16,392 16,392 - - 16,219 16,219
National Library of Australia - - 9,832 9,832 - - 9,779 9,779
National Museum of Australia - - 1,965 1,965 - - 1,924 1,924
Old Parliament House - - 207 207 - - 206 206
Total: Regional Australia, Local Government, Arts and Sport
26,862 - 62,449 89,311 120,388 - 64,544 184,932

Services for which money is appropriated Schedule 2
Appropriation Bill (No. 2) 2012-2013 No. , 2012 87
REGIONAL AUSTRALIA, LOCAL GOVERNMENT, ARTS AND SPORT PORTFOLIO
Appropriation (plain figures)—2012-2013 Actual Available Appropriation (italic figures)—2011-2012
Payments to
States, ACT, NT and local government
New
Administered Outcomes
Total $'000 $'000 $'000
DEPARTMENT OF REGIONAL AUSTRALIA, LOCAL GOVERNMENT, ARTS AND SPORT
Operating Outcome 1 - Strengthening the sustainability, capacity and diversity of regional economies including through facilitating local partnerships between all levels of government and local communities; and providing grants and financial assistance
26,862 - 26,862
120,388 - 120,388
Total: Operating 26,862 - 26,862 120,388 - 120,388 Non-operating
Administered Assets and Liabilities 31,500 33,982
Total: Non-operating 31,500 33,982 Total: Department of Regional Australia, Local
Government, Arts and Sport 26,862 - 58,362
120,388 - 154,370

Schedule 2 Services for which money is appropriated
88 Appropriation Bill (No. 2) 2012-2013 No. , 2012
REGIONAL AUSTRALIA, LOCAL GOVERNMENT, ARTS AND SPORT PORTFOLIO
Appropriation (plain figures)—2012-2013 Actual Available Appropriation (italic figures)—2011-2012
Non-operating $'000
DEPARTMENT OF REGIONAL AUSTRALIA, LOCAL GOVERNMENT, ARTS AND SPORT FOR PAYMENT TO
AUSTRALIAN NATIONAL MARITIME MUSEUM
1,728 1,668

Services for which money is appropriated Schedule 2
Appropriation Bill (No. 2) 2012-2013 No. , 2012 89
REGIONAL AUSTRALIA, LOCAL GOVERNMENT, ARTS AND SPORT PORTFOLIO
Appropriation (plain figures)—2012-2013 Actual Available Appropriation (italic figures)—2011-2012
Non-operating $'000
DEPARTMENT OF REGIONAL AUSTRALIA, LOCAL GOVERNMENT, ARTS AND SPORT FOR PAYMENT TO
NATIONAL FILM AND SOUND ARCHIVE
825 766

Schedule 2 Services for which money is appropriated
90 Appropriation Bill (No. 2) 2012-2013 No. , 2012
REGIONAL AUSTRALIA, LOCAL GOVERNMENT, ARTS AND SPORT PORTFOLIO
Appropriation (plain figures)—2012-2013 Actual Available Appropriation (italic figures)—2011-2012
Non-operating $'000
DEPARTMENT OF REGIONAL AUSTRALIA, LOCAL GOVERNMENT, ARTS AND SPORT FOR PAYMENT TO
NATIONAL GALLERY OF AUSTRALIA
16,392 16,219

Services for which money is appropriated Schedule 2
Appropriation Bill (No. 2) 2012-2013 No. , 2012 91
REGIONAL AUSTRALIA, LOCAL GOVERNMENT, ARTS AND SPORT PORTFOLIO
Appropriation (plain figures)—2012-2013 Actual Available Appropriation (italic figures)—2011-2012
Non-operating $'000
DEPARTMENT OF REGIONAL AUSTRALIA, LOCAL GOVERNMENT, ARTS AND SPORT FOR PAYMENT TO
NATIONAL LIBRARY OF AUSTRALIA
9,832 9,779
Schedule 2 Services for which money is appropriated
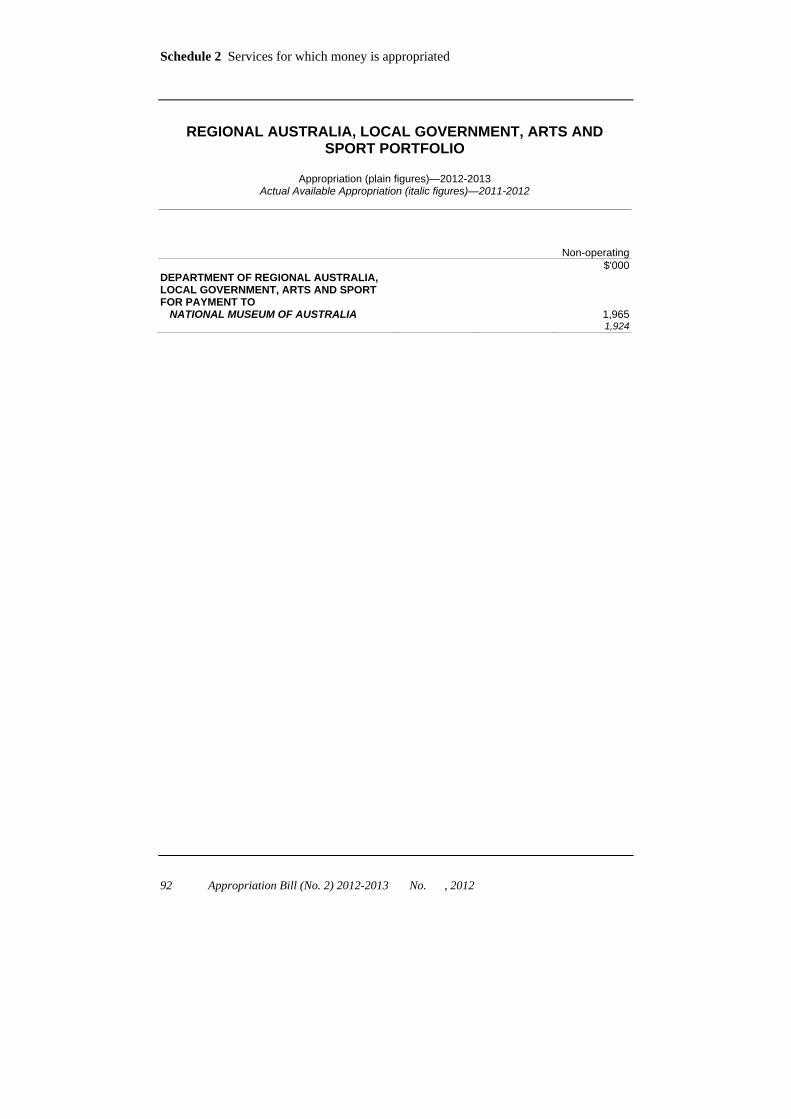
92 Appropriation Bill (No. 2) 2012-2013 No. , 2012
REGIONAL AUSTRALIA, LOCAL GOVERNMENT, ARTS AND SPORT PORTFOLIO
Appropriation (plain figures)—2012-2013 Actual Available Appropriation (italic figures)—2011-2012
Non-operating $'000
DEPARTMENT OF REGIONAL AUSTRALIA, LOCAL GOVERNMENT, ARTS AND SPORT FOR PAYMENT TO
NATIONAL MUSEUM OF AUSTRALIA
1,965 1,924

Services for which money is appropriated Schedule 2
Appropriation Bill (No. 2) 2012-2013 No. , 2012 93
REGIONAL AUSTRALIA, LOCAL GOVERNMENT, ARTS AND SPORT PORTFOLIO
Appropriation (plain figures)—2012-2013 Actual Available Appropriation (italic figures)—2011-2012
Payments to
States, ACT, NT and local government
New
Administered Outcomes
Total $'000 $'000 $'000
OLD PARLIAMENT HOUSE Non-operating
Equity Injections 52 52
Administered Assets and Liabilities 155 154
Total: Old Parliament House - - 207 - - 206

Schedule 2 Services for which money is appropriated
94 Appropriation Bill (No. 2) 2012-2013 No. , 2012
RESOURCES, ENERGY AND TOURISM PORTFOLIO
SUMMARY
Summary of Appropriations (plain figures)—2012-2013 Actual Available Appropriation (italic figures)—2011-2012
Entity
Payments to States, ACT, NT and local government
New
Administered Outcomes
Non- operating
Total $'000 $'000 $'000 $'000
Department of Resources, Energy and Tourism
- - - - - - 4,963 4,963
Geoscience Australia - - 200 200 - - - -
Total: Resources, Energy and Tourism
- - 200 200 - - 4,963 4,963

Services for which money is appropriated Schedule 2
Appropriation Bill (No. 2) 2012-2013 No. , 2012 95
RESOURCES, ENERGY AND TOURISM PORTFOLIO
Appropriation (plain figures)—2012-2013 Actual Available Appropriation (italic figures)—2011-2012
Payments to
States, ACT, NT and local government
New
Administered Outcomes
Total $'000 $'000 $'000
DEPARTMENT OF RESOURCES, ENERGY AND TOURISM
Non-operating Equity Injections -
4,963 Total: Department of Resources, Energy and
Tourism - - - - - 4,963

Schedule 2 Services for which money is appropriated
96 Appropriation Bill (No. 2) 2012-2013 No. , 2012
RESOURCES, ENERGY AND TOURISM PORTFOLIO
Appropriation (plain figures)—2012-2013 Actual Available Appropriation (italic figures)—2011-2012
Payments to
States, ACT, NT and local government
New
Administered Outcomes
Total $'000 $'000 $'000
GEOSCIENCE AUSTRALIA Non-operating
Equity Injections 200 -
Total: Geoscience Australia - - 200 - - -

Services for which money is appropriated Schedule 2
Appropriation Bill (No. 2) 2012-2013 No. , 2012 97
SUSTAINABILITY, ENVIRONMENT, WATER, POPULATION AND COMMUNITIES PORTFOLIO
SUMMARY
Summary of Appropriations (plain figures)—2012-2013 Actual Available Appropriation (italic figures)—2011-2012
Entity
Payments to States, ACT, NT and local government
New
Administered Outcomes
Non- operating
Total $'000 $'000 $'000 $'000
Department of Sustainability, Environment, Water, Population and Communities
23,332 - 191,443 214,775 16,804 - 412,434 429,238
Bureau of Meteorology - - 8,984 8,984 - - 12,741 12,741
Great Barrier Reef Marine Park Authority
- - - - - - 1,900 1,900
Total: Sustainability, Environment, Water, Population and Communities
23,332 - 200,427 223,759 16,804 - 427,075 443,879

Schedule 2 Services for which money is appropriated
98 Appropriation Bill (No. 2) 2012-2013 No. , 2012
SUSTAINABILITY, ENVIRONMENT, WATER, POPULATION AND COMMUNITIES PORTFOLIO
Appropriation (plain figures)—2012-2013 Actual Available Appropriation (italic figures)—2011-2012
Payments to
States, ACT, NT and local government
New
Administered Outcomes
Total $'000 $'000 $'000
DEPARTMENT OF SUSTAINABILITY, ENVIRONMENT, WATER, POPULATION AND COMMUNITIES
Operating
Outcome 4 - Adaptation to climate change, wise water use, secure water supplies and improved health of rivers, waterways and freshwater ecosystems by supporting research, and reforming the management and use of water resources
22,532 - 22,532 16,004 - 16,004
Outcome 5 - Increased protection, awareness and appreciation of Australia’s environment and heritage through regulating matters of national environmental significance and the identification, conservation and celebration of natural, indigenous and historic places of national and World Heritage significance
800 - 800 800 - 800
Total: Operating 23,332 - 23,332 16,804 - 16,804 Non-operating
Equity Injections 1,872 1,545
Administered Assets and Liabilities 189,571 410,889
Total: Non-operating 191,443 412,434 Total: Department of Sustainability,
Environment, Water, Population and Communities
23,332 - 214,775 16,804 - 429,238

Services for which money is appropriated Schedule 2
Appropriation Bill (No. 2) 2012-2013 No. , 2012 99
SUSTAINABILITY, ENVIRONMENT, WATER, POPULATION AND COMMUNITIES PORTFOLIO
Appropriation (plain figures)—2012-2013 Actual Available Appropriation (italic figures)—2011-2012
Payments to
States, ACT, NT and local government
New
Administered Outcomes
Total $'000 $'000 $'000
BUREAU OF METEOROLOGY Non-operating
Equity Injections 8,984 12,741
Total: Bureau of Meteorology - - 8,984 - - 12,741

Schedule 2 Services for which money is appropriated
100 Appropriation Bill (No. 2) 2012-2013 No. , 2012
SUSTAINABILITY, ENVIRONMENT, WATER, POPULATION AND COMMUNITIES PORTFOLIO
Appropriation (plain figures)—2012-2013 Actual Available Appropriation (italic figures)—2011-2012
Payments to
States, ACT, NT and local government
New
Administered Outcomes
Total $'000 $'000 $'000
GREAT BARRIER REEF MARINE PARK AUTHORITY
Non-operating Equity Injections -
1,900 Total: Great Barrier Reef Marine Park
Authority - - - - - 1,900

Services for which money is appropriated Schedule 2
Appropriation Bill (No. 2) 2012-2013 No. , 2012 101
TREASURY PORTFOLIO
SUMMARY
Summary of Appropriations (plain figures)—2012-2013 Actual Available Appropriation (italic figures)—2011-2012
Entity
Payments to States, ACT, NT and local government
New
Administered Outcomes
Non- operating
Total $'000 $'000 $'000 $'000
Department of the Treasury - - 58,839 58,839 - - 63,291 63,291
Australian Bureau of Statistics - - 429 429 - - 1,068 1,068
Australian Competition and Consumer Commission
- - 60 60 - - 55 55
Australian Prudential Regulation Authority
- - 4,810 4,810 - - - -
Australian Securities and Investments Commission
- - 13,934 13,934 - - 6,462 6,462
Australian Taxation Office - - 62,975 62,975 - - 30,692 30,692
Total: Treasury - - 141,047 141,047 - - 101,568 101,568

Schedule 2 Services for which money is appropriated
102 Appropriation Bill (No. 2) 2012-2013 No. , 2012
TREASURY PORTFOLIO
Appropriation (plain figures)—2012-2013 Actual Available Appropriation (italic figures)—2011-2012
Payments to
States, ACT, NT and local government
New
Administered Outcomes
Total $'000 $'000 $'000
DEPARTMENT OF THE TREASURY Non-operating
Equity Injections 1,839 583
Administered Assets and Liabilities 57,000 62,708
Total: Department of the Treasury - - 58,839 - - 63,291

Services for which money is appropriated Schedule 2
Appropriation Bill (No. 2) 2012-2013 No. , 2012 103
TREASURY PORTFOLIO
Appropriation (plain figures)—2012-2013 Actual Available Appropriation (italic figures)—2011-2012
Payments to
States, ACT, NT and local government
New
Administered Outcomes
Total $'000 $'000 $'000
AUSTRALIAN BUREAU OF STATISTICS Non-operating
Equity Injections 429 1,068
Total: Australian Bureau of Statistics - - 429 - - 1,068

Schedule 2 Services for which money is appropriated
104 Appropriation Bill (No. 2) 2012-2013 No. , 2012
TREASURY PORTFOLIO
Appropriation (plain figures)—2012-2013 Actual Available Appropriation (italic figures)—2011-2012
Payments to
States, ACT, NT and local government
New
Administered Outcomes
Total $'000 $'000 $'000
AUSTRALIAN COMPETITION AND CONSUMER COMMISSION
Non-operating Equity Injections 60
55 Total: Australian Competition and Consumer
Commission - - 60 - - 55

Services for which money is appropriated Schedule 2
Appropriation Bill (No. 2) 2012-2013 No. , 2012 105
TREASURY PORTFOLIO
Appropriation (plain figures)—2012-2013 Actual Available Appropriation (italic figures)—2011-2012
Payments to
States, ACT, NT and local government
New
Administered Outcomes
Total $'000 $'000 $'000
AUSTRALIAN PRUDENTIAL REGULATION AUTHORITY
Non-operating Equity Injections 4,810
- Total: Australian Prudential Regulation
Authority - - 4,810 - - -
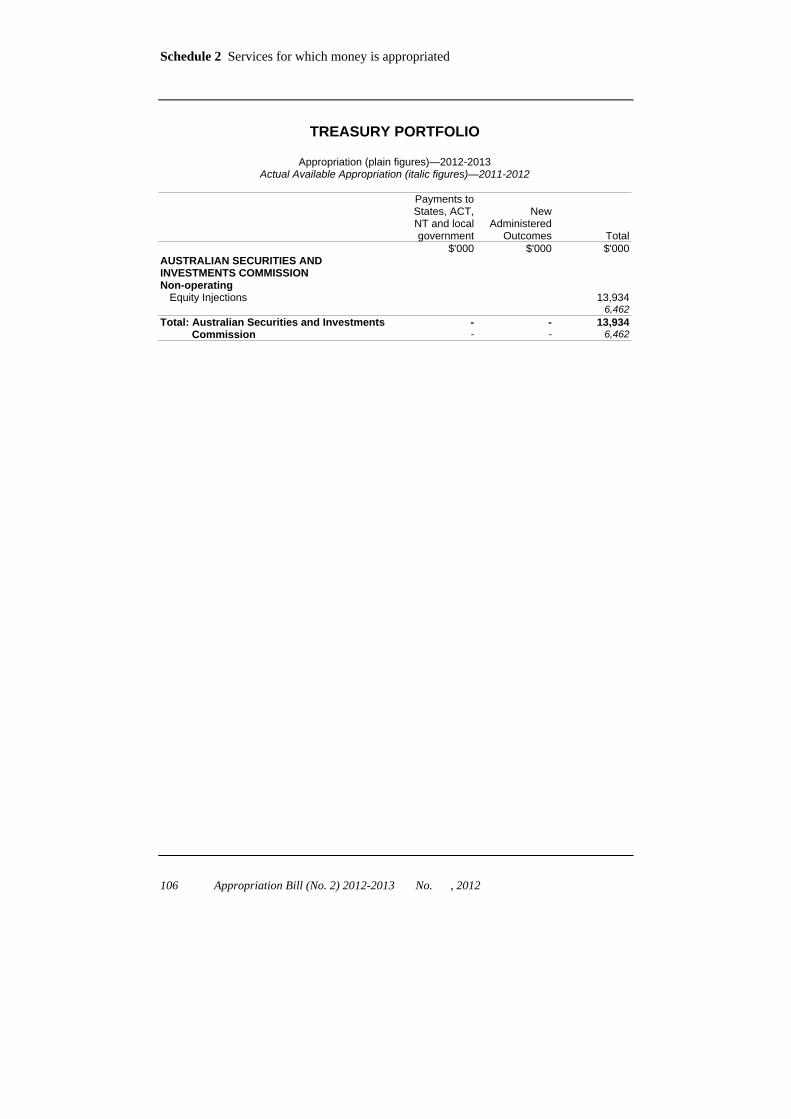
Schedule 2 Services for which money is appropriated
106 Appropriation Bill (No. 2) 2012-2013 No. , 2012
TREASURY PORTFOLIO
Appropriation (plain figures)—2012-2013 Actual Available Appropriation (italic figures)—2011-2012
Payments to
States, ACT, NT and local government
New
Administered Outcomes
Total $'000 $'000 $'000
AUSTRALIAN SECURITIES AND INVESTMENTS COMMISSION
Non-operating Equity Injections 13,934
6,462 Total: Australian Securities and Investments
Commission - - 13,934 - - 6,462

Services for which money is appropriated Schedule 2
Appropriation Bill (No. 2) 2012-2013 No. , 2012 107
TREASURY PORTFOLIO
Appropriation (plain figures)—2012-2013 Actual Available Appropriation (italic figures)—2011-2012
Payments to
States, ACT, NT and local government
New
Administered Outcomes
Total $'000 $'000 $'000
AUSTRALIAN TAXATION OFFICE Non-operating
Equity Injections 62,975 30,692
Total: Australian Taxation Office - - 62,975 - - 30,692


Appropriation Bill (No. 2) 2012-2013 No. , 2012 1