approaches to measuring quality in higher education
TRANSCRIPT
USC Rossier School of Education
Approaches to Measuring Quality in Higher Education
Alicia C. Dowd, Ph.D. Senior Research Associate, USC Center for Urban Education Professor of Education, Pennsylvania State University
USC Rossier School of Education
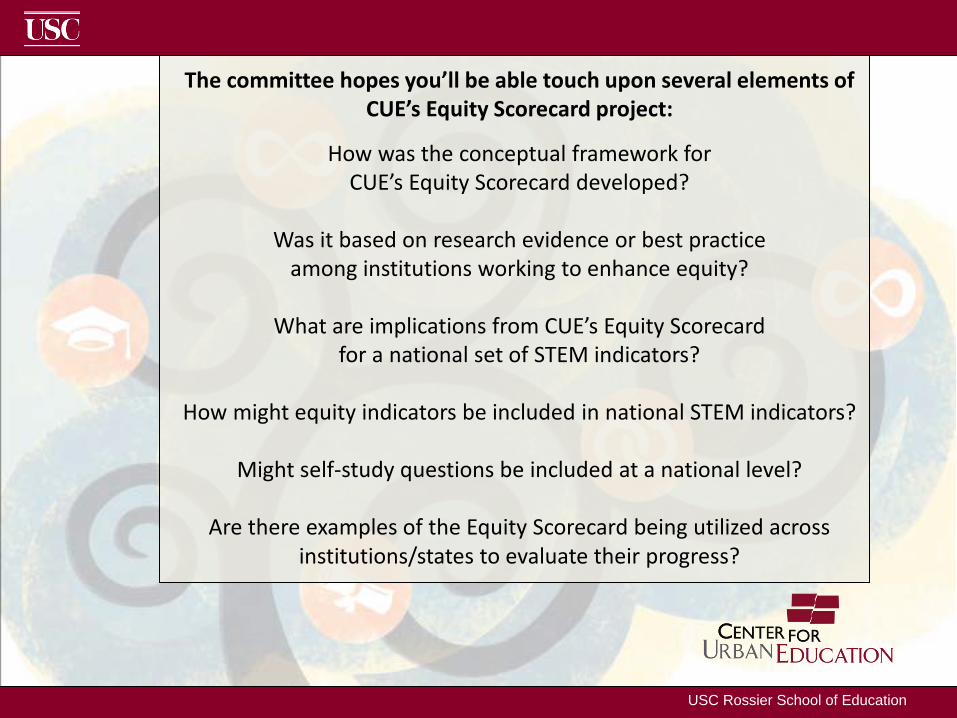
The committee hopes you’ll be able touch upon several elements of CUE’s Equity Scorecard project:
How was the conceptual framework for CUE’s Equity Scorecard developed?
Was it based on research evidence or best practice
among institutions working to enhance equity?
What are implications from CUE’s Equity Scorecard for a national set of STEM indicators?
How might equity indicators be included in national STEM indicators?
Might self-study questions be included at a national level?
Are there examples of the Equity Scorecard being utilized across
institutions/states to evaluate their progress?
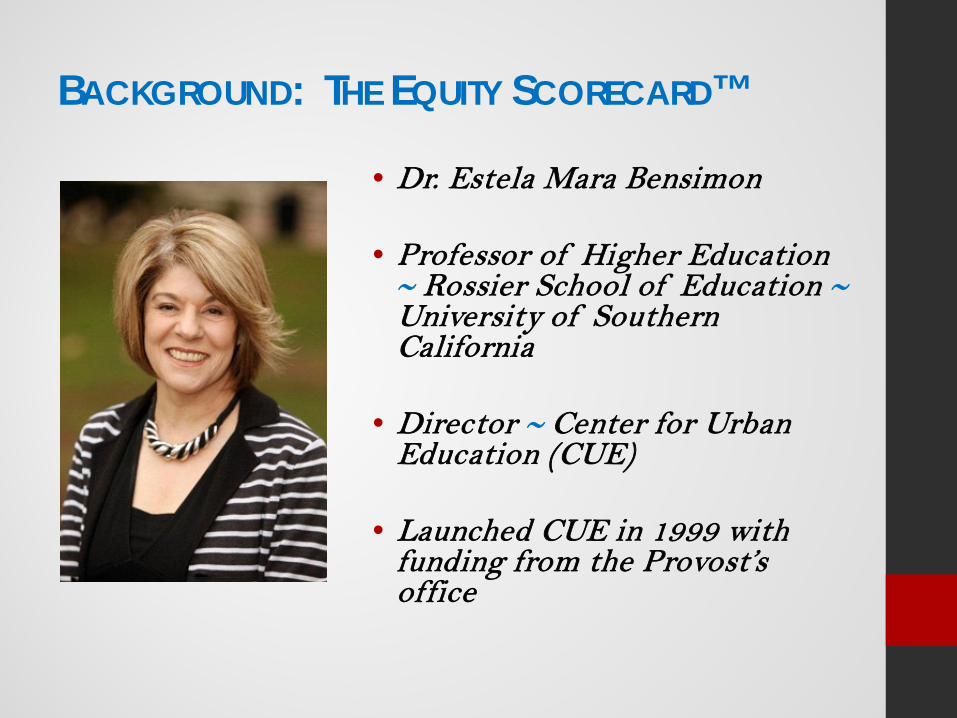
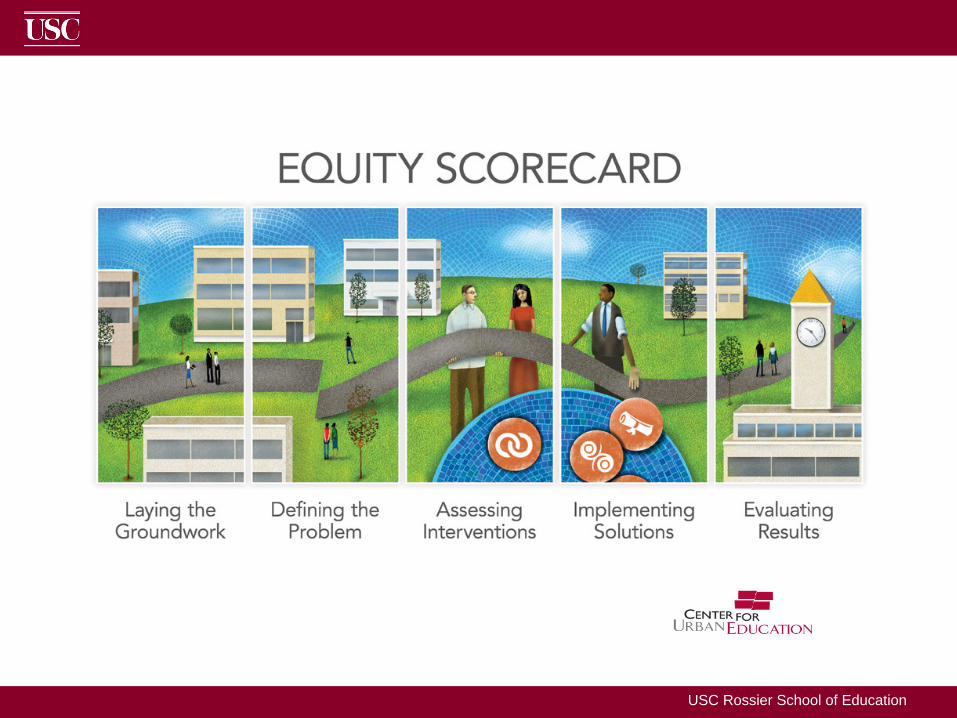
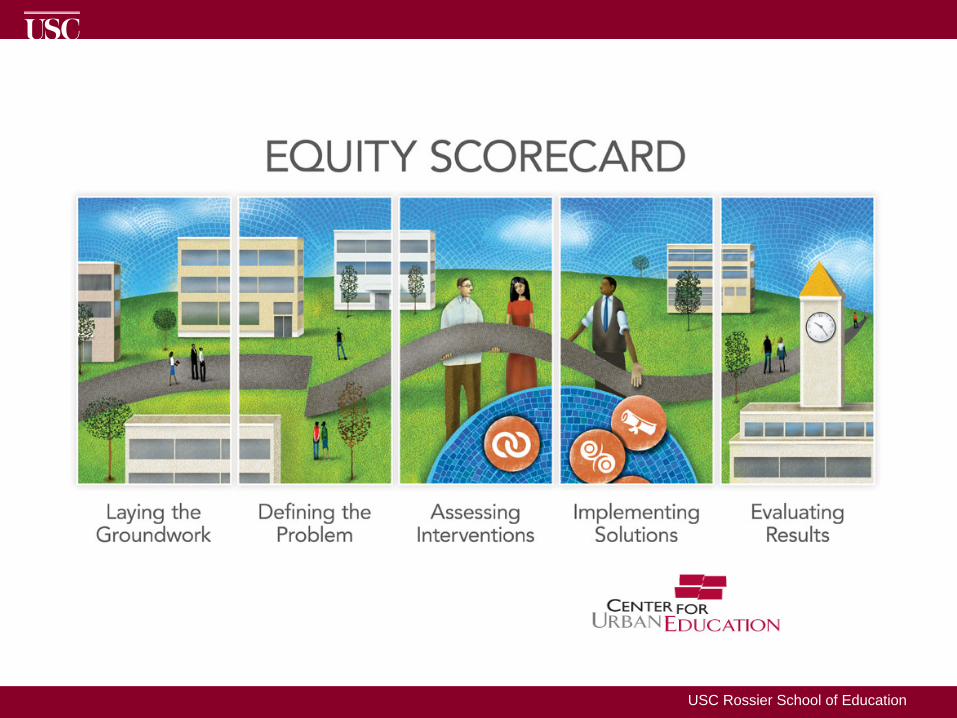
BACKGROUND: THE EQUITY SCORECARD™
• Dr. Estela Mara Bensimon
• Professor of Higher Education ∼ Rossier School of Education ∼ University of Southern California
• Director ∼ Center for Urban Education (CUE)
• Launched CUE in 1999 with funding from the Provost’s office

Embed Equity as a Standard of Quality
Measure the Quality of Educational Practice
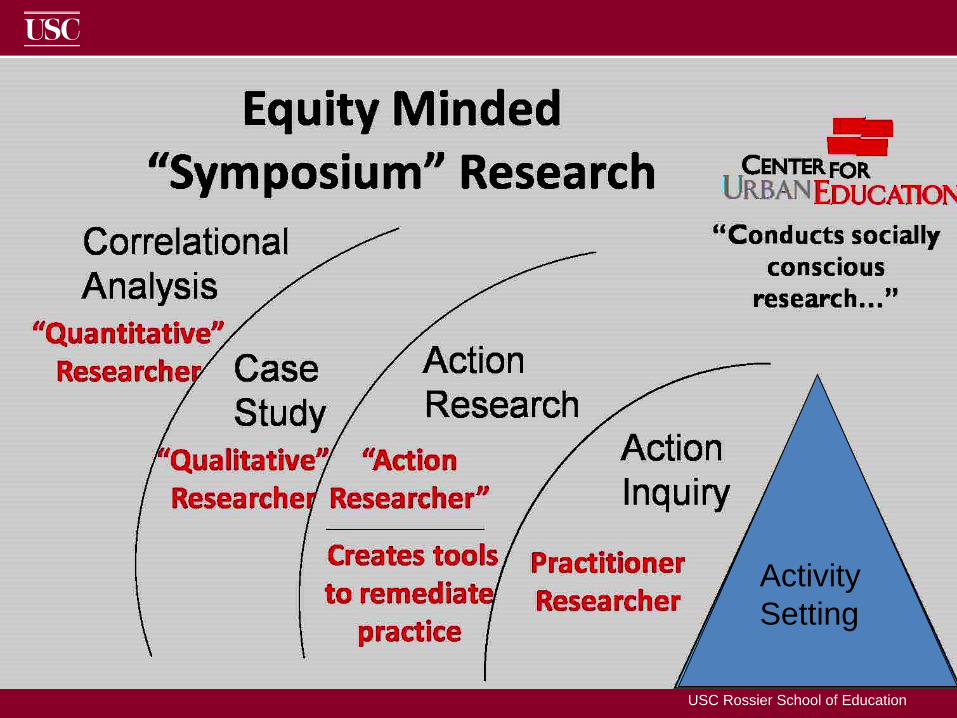
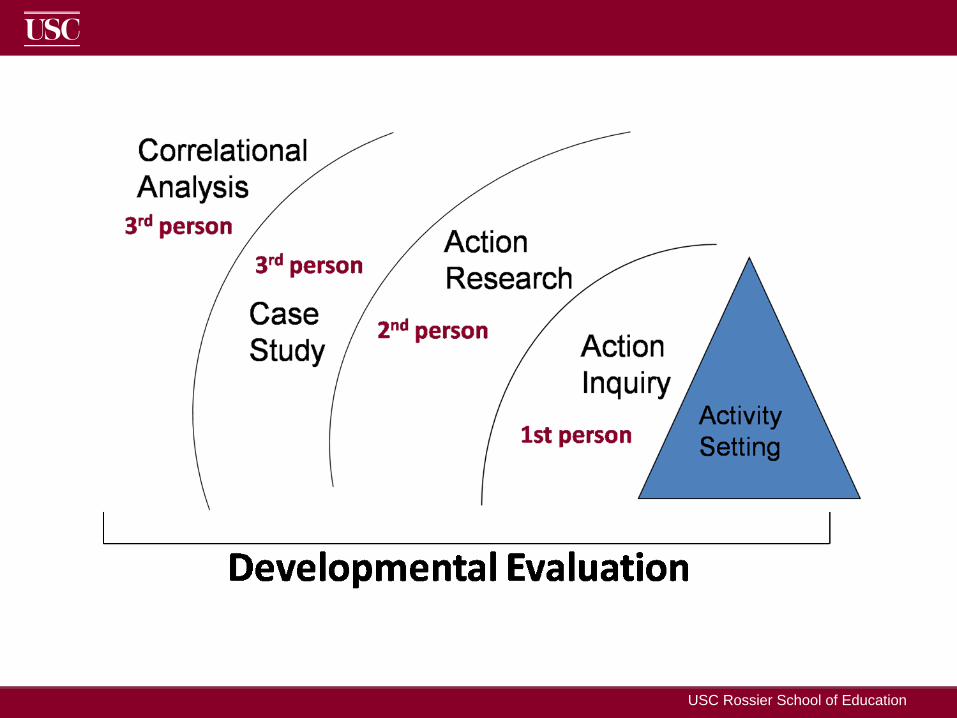
Practice is “activity directed towards accomplishing a goal.” Practices are shared among practitioners (Polkinghorne, 2004, p. 71).
USC Rossier School of Education
Activity Setting
USC Rossier School of Education
USC Rossier School of Education
Race/Ethnicity SES
Gender Ability Status
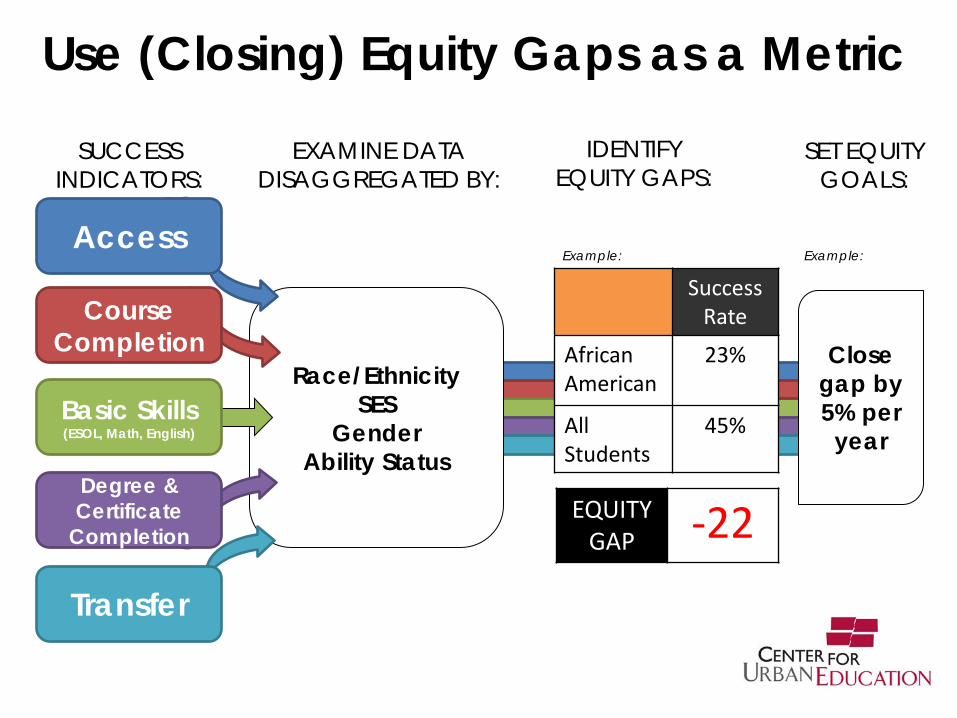
EXAMINE DATA DISAGGREGATED BY:
Use (Closing) Equity Gaps as a Metric
SET EQUITY GOALS:
IDENTIFY EQUITY GAPS:
Access
Course Completion
Basic Skills (ESOL, Math, English)
Degree & Certificate
Completion
Transfer
SUCCESS INDICATORS:
SuccessRate
African American
23%
All Students
45%
EQUITY GAP -22
Close gap by 5% per
year
Example: Example:
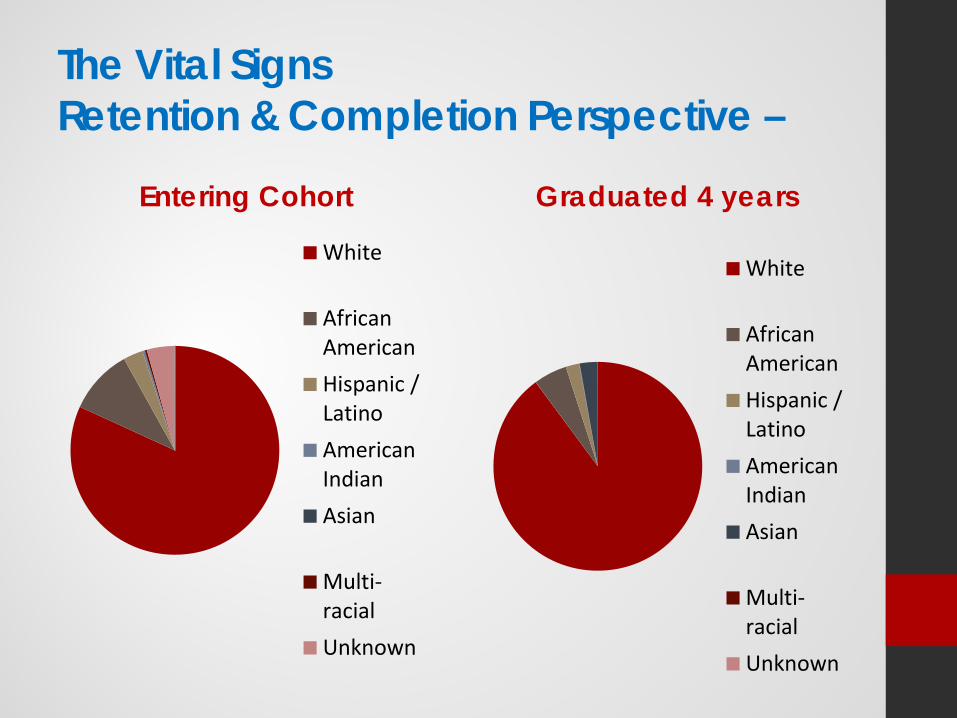
The Vital Signs Retention & Completion Perspective –
Entering Cohort
White
AfricanAmericanHispanic /LatinoAmericanIndianAsian
Multi-racialUnknown
Graduated 4 years
White
AfricanAmericanHispanic /LatinoAmericanIndianAsian
Multi-racialUnknown
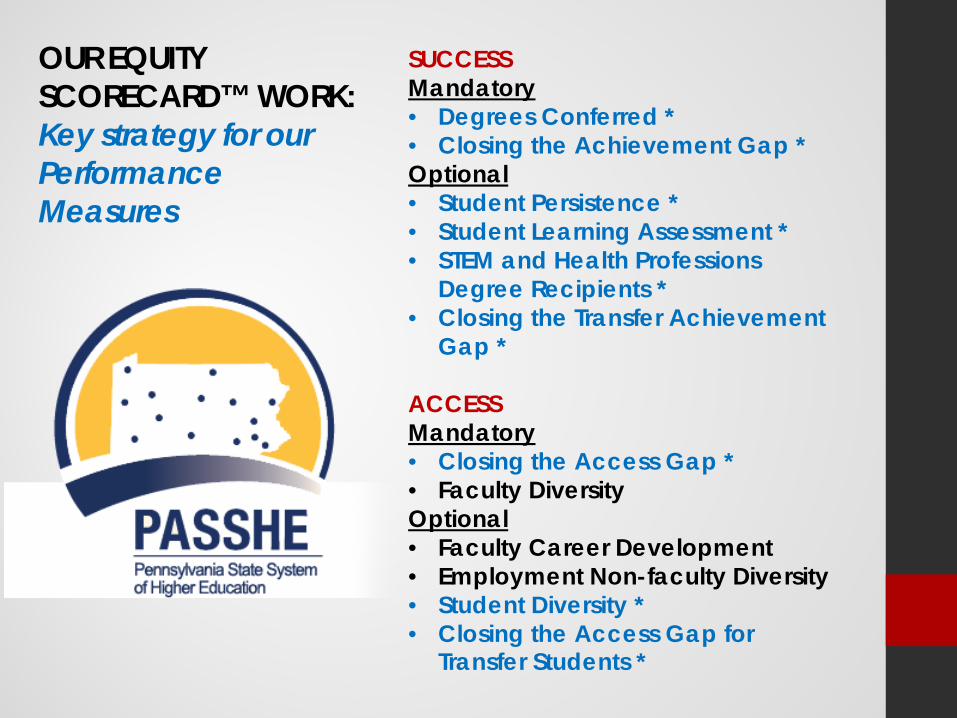
SUCCESS Mandatory • Degrees Conferred * • Closing the Achievement Gap * Optional • Student Persistence * • Student Learning Assessment * • STEM and Health Professions
Degree Recipients * • Closing the Transfer Achievement
Gap * ACCESS Mandatory • Closing the Access Gap * • Faculty Diversity Optional • Faculty Career Development • Employment Non-faculty Diversity • Student Diversity * • Closing the Access Gap for
Transfer Students *
OUR EQUITY SCORECARD™ WORK: Key strategy for our Performance Measures
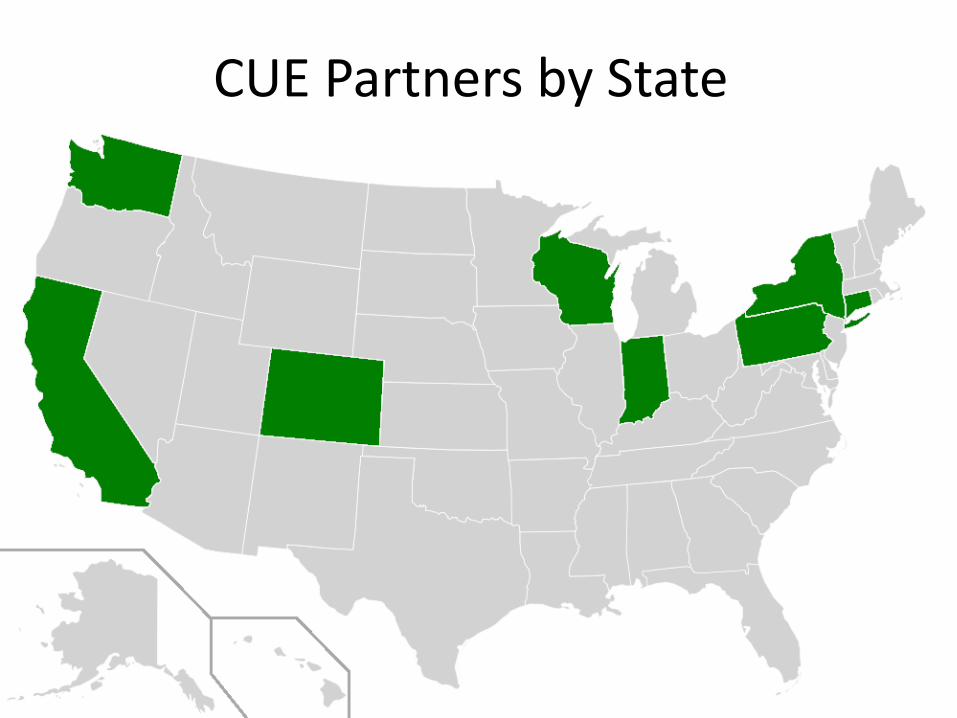
CUE Partners by State
Equity in Excellence: Higher Education for Colorado’s Future
Equity in Excellence: A Model of Policy & Practice Alignment | pg. 10
0.0%
10.0%
20.0%
30.0%
40.0%
50.0%
60.0%
70.0%
80.0%
0 2 4 6 8 10 12
Black
Hispanic
White
Overall
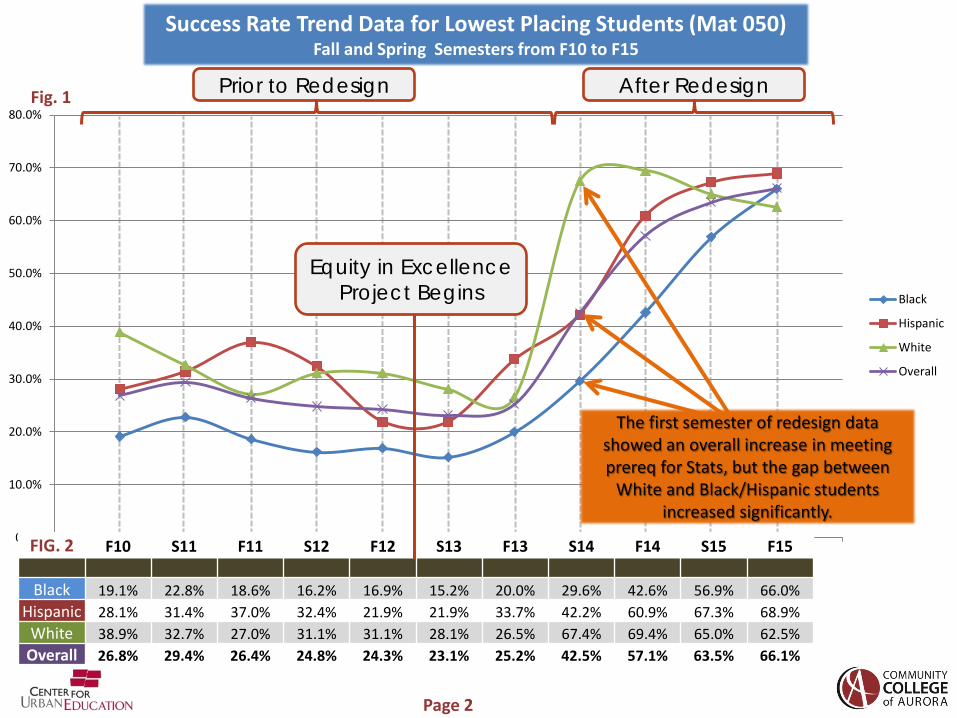
FIG. 2 F10 S11 F11 S12 F12 S13 F13 S14 F14 S15 F15
Black 19.1% 22.8% 18.6% 16.2% 16.9% 15.2% 20.0% 29.6% 42.6% 56.9% 66.0% Hispanic 28.1% 31.4% 37.0% 32.4% 21.9% 21.9% 33.7% 42.2% 60.9% 67.3% 68.9%
White 38.9% 32.7% 27.0% 31.1% 31.1% 28.1% 26.5% 67.4% 69.4% 65.0% 62.5% Overall 26.8% 29.4% 26.4% 24.8% 24.3% 23.1% 25.2% 42.5% 57.1% 63.5% 66.1%
Equity in Excellence Project Begins
Prior to Redesign After Redesign
The first semester of redesign data showed an overall increase in meeting prereq for Stats, but the gap between
White and Black/Hispanic students increased significantly.
Success Rate Trend Data for Lowest Placing Students (Mat 050) Fall and Spring Semesters from F10 to F15
Fig. 1
Page 2
0.0%
10.0%
20.0%
30.0%
40.0%
50.0%
60.0%
70.0%
80.0%
0 2 4 6 8 10 12
Black
Hispanic
White
Overall
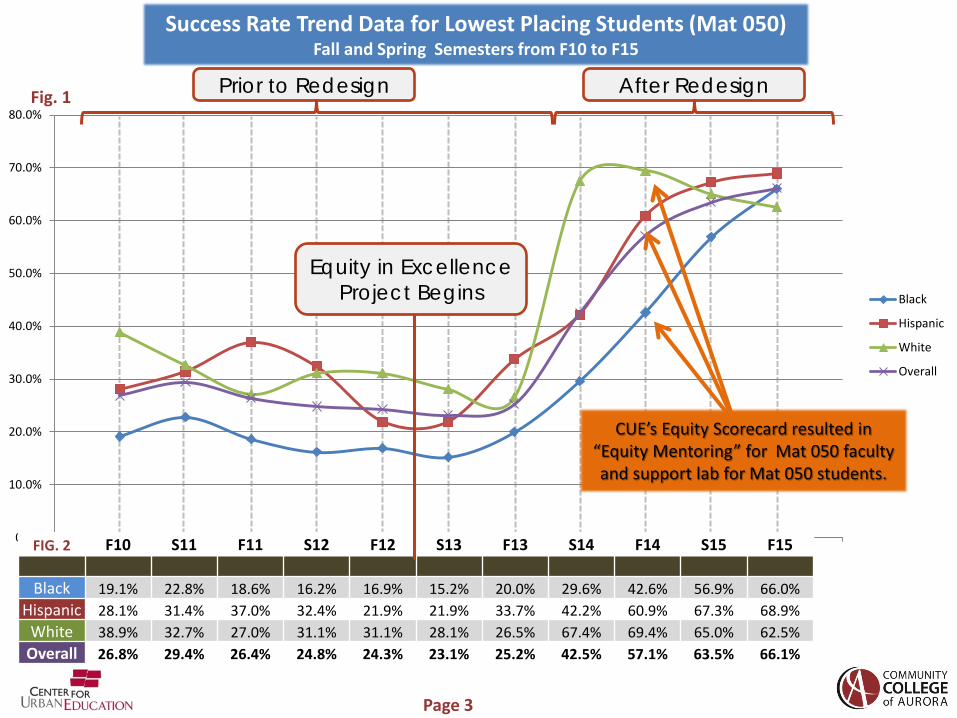
Success Rate Trend Data for Lowest Placing Students (Mat 050) Fall and Spring Semesters from F10 to F15
FIG. 2 F10 S11 F11 S12 F12 S13 F13 S14 F14 S15 F15
Black 19.1% 22.8% 18.6% 16.2% 16.9% 15.2% 20.0% 29.6% 42.6% 56.9% 66.0% Hispanic 28.1% 31.4% 37.0% 32.4% 21.9% 21.9% 33.7% 42.2% 60.9% 67.3% 68.9%
White 38.9% 32.7% 27.0% 31.1% 31.1% 28.1% 26.5% 67.4% 69.4% 65.0% 62.5% Overall 26.8% 29.4% 26.4% 24.8% 24.3% 23.1% 25.2% 42.5% 57.1% 63.5% 66.1%
Equity in Excellence Project Begins
Prior to Redesign After Redesign
CUE’s Equity Scorecard resulted in “Equity Mentoring” for Mat 050 faculty and support lab for Mat 050 students.
Fig. 1
Page 3
0.0%
10.0%
20.0%
30.0%
40.0%
50.0%
60.0%
70.0%
80.0%
0 2 4 6 8 10 12
Black
Hispanic
White
Overall
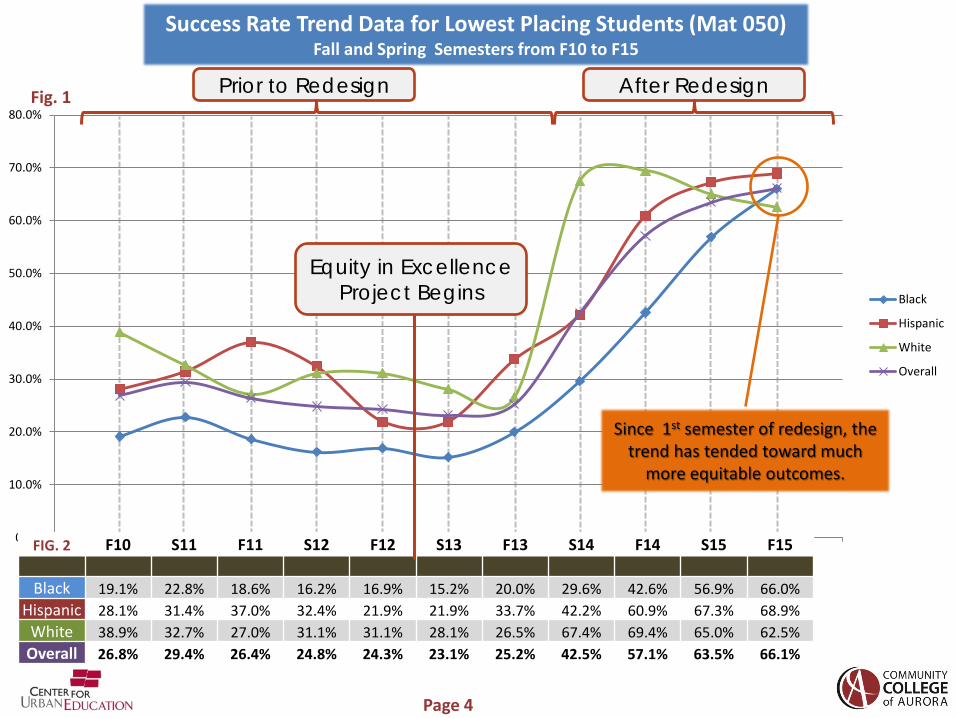
Success Rate Trend Data for Lowest Placing Students (Mat 050) Fall and Spring Semesters from F10 to F15
FIG. 2 F10 S11 F11 S12 F12 S13 F13 S14 F14 S15 F15
Black 19.1% 22.8% 18.6% 16.2% 16.9% 15.2% 20.0% 29.6% 42.6% 56.9% 66.0% Hispanic 28.1% 31.4% 37.0% 32.4% 21.9% 21.9% 33.7% 42.2% 60.9% 67.3% 68.9%
White 38.9% 32.7% 27.0% 31.1% 31.1% 28.1% 26.5% 67.4% 69.4% 65.0% 62.5% Overall 26.8% 29.4% 26.4% 24.8% 24.3% 23.1% 25.2% 42.5% 57.1% 63.5% 66.1%
Equity in Excellence Project Begins
Prior to Redesign After Redesign
Since 1st semester of redesign, the trend has tended toward much
more equitable outcomes.
Fig. 1
Page 4
USC Rossier School of Education
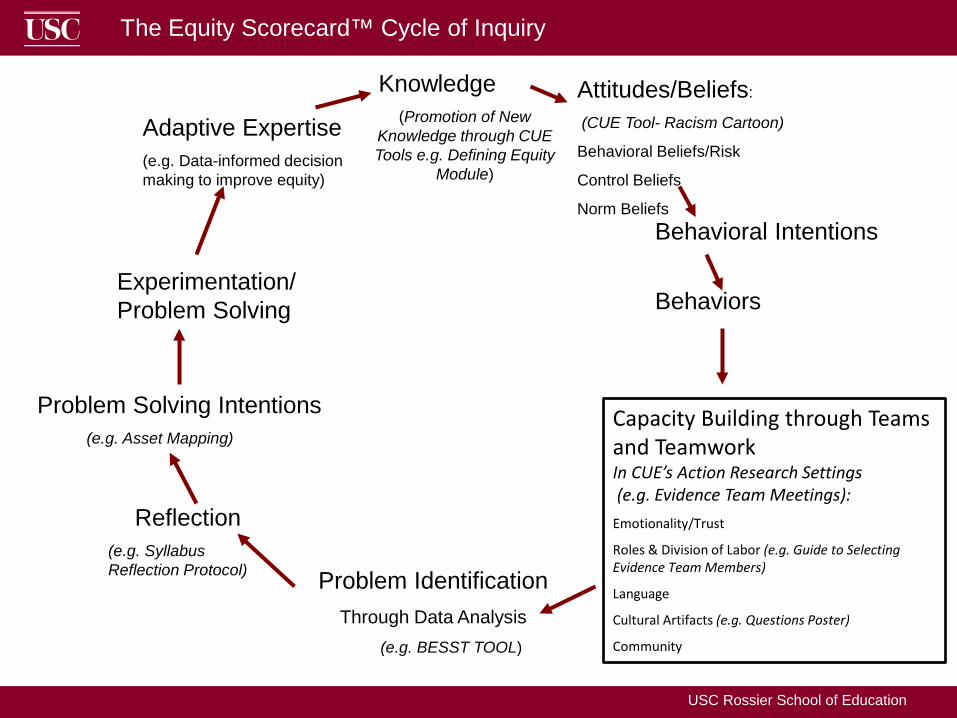
Attitudes/Beliefs:
(CUE Tool- Racism Cartoon)
Behavioral Beliefs/Risk
Control Beliefs
Norm Beliefs
Behaviors
Reflection (e.g. Syllabus Reflection Protocol)
Experimentation/Problem Solving
Adaptive Expertise (e.g. Data-informed decision making to improve equity)
Capacity Building through Teams and Teamwork In CUE’s Action Research Settings (e.g. Evidence Team Meetings): Emotionality/Trust
Roles & Division of Labor (e.g. Guide to Selecting Evidence Team Members)
Language
Cultural Artifacts (e.g. Questions Poster)
Community
Knowledge (Promotion of New
Knowledge through CUE Tools e.g. Defining Equity
Module)
Problem Identification Through Data Analysis (e.g. BESST TOOL)
The Equity Scorecard™ Cycle of Inquiry
Behavioral Intentions
Problem Solving Intentions (e.g. Asset Mapping)
USC Rossier School of Education
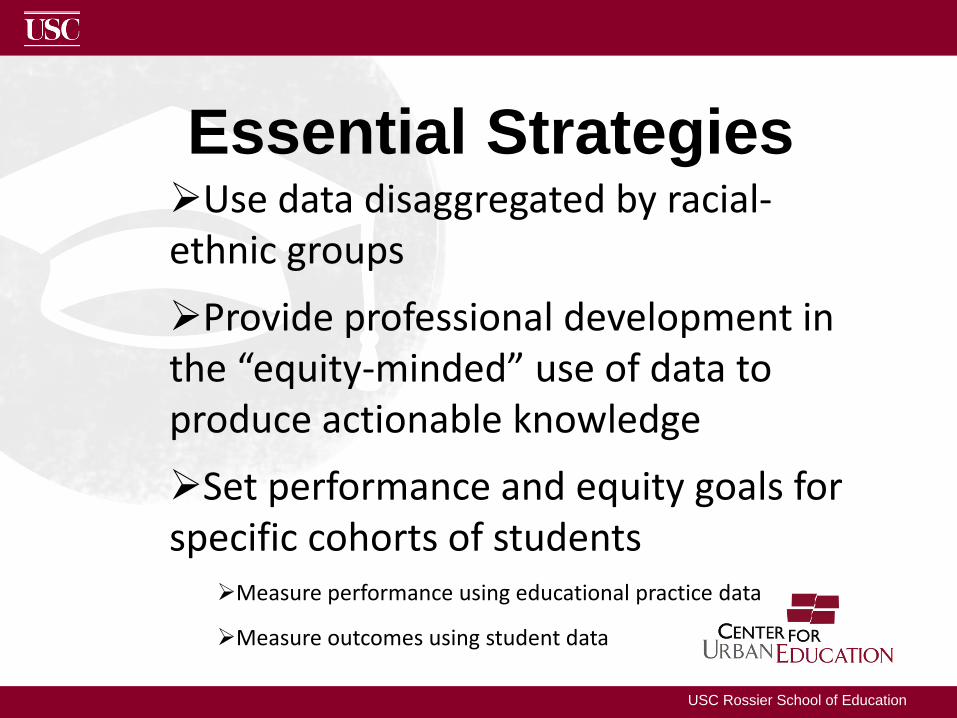
Use data disaggregated by racial-ethnic groups Provide professional development in the “equity-minded” use of data to produce actionable knowledge Set performance and equity goals for specific cohorts of students
Measure performance using educational practice data
Measure outcomes using student data
Essential Strategies
USC Rossier School of Education
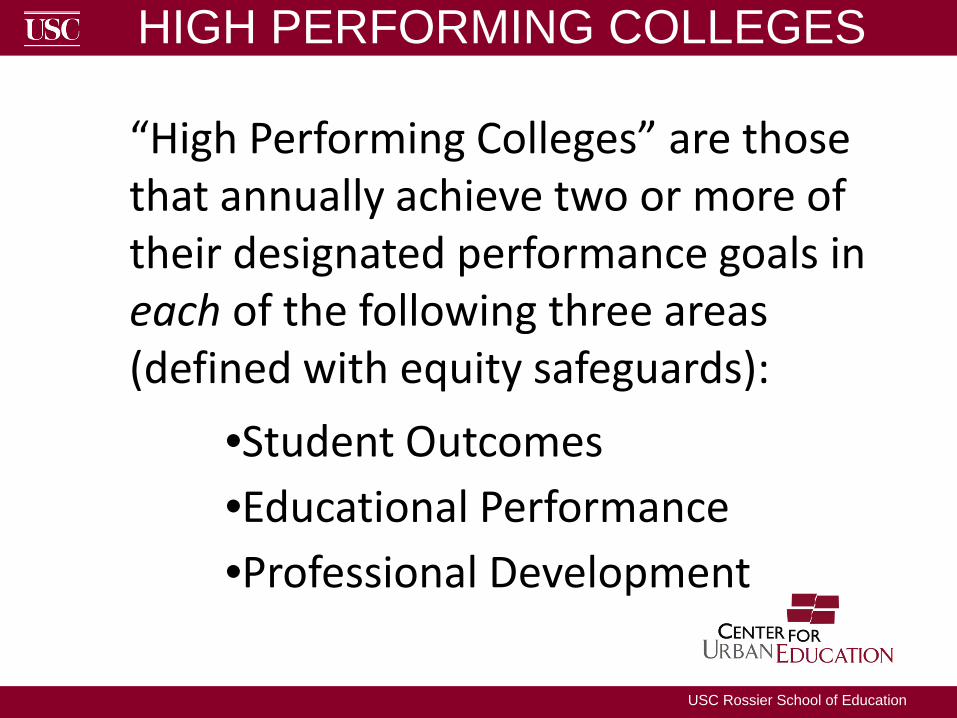
HIGH PERFORMING COLLEGES
“High Performing Colleges” are those that annually achieve two or more of their designated performance goals in each of the following three areas (defined with equity safeguards):
•Student Outcomes •Educational Performance •Professional Development
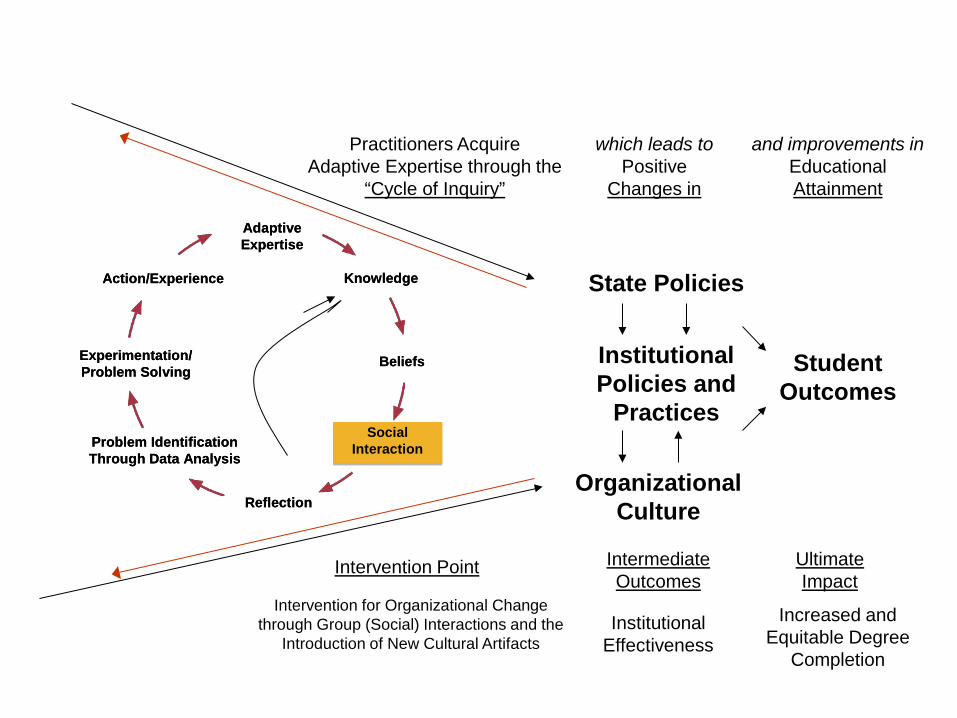
Institutional Policies and
Practices
Organizational Culture
Student Outcomes
Intervention for Organizational Change through Group (Social) Interactions and the
Introduction of New Cultural Artifacts Institutional
Effectiveness Increased and
Equitable Degree Completion
State Policies
AdaptiveExpertise
Knowledge
Experimentation/Problem Solving
SocialInteraction
Action/Experience
Beliefs
Problem IdentificationThrough Data Analysis
Reflection
AdaptiveExpertise
Knowledge
Experimentation/Problem Solving
SocialInteraction
Action/Experience
Beliefs
Problem IdentificationThrough Data Analysis
Reflection
Practitioners Acquire Adaptive Expertise through the
“Cycle of Inquiry”
Intervention Point
which leads to Positive
Changes in
and improvements in Educational Attainment
Intermediate Outcomes
Ultimate Impact
USC Rossier School of Education