appraising the economic benefits of new air routesrando… · york aviation appraising the economic...
TRANSCRIPT

York Aviation
Appraising the Economic Benefits of New Air Routes: Technical Report
Scottish Enterprise
March 2012

York Aviation
Contents
2
The York Aviation contacts associated with this report are:
Author:
James Brass
Principal Consultant
Tel: +44 (0)7767 455614
Reviewer:
Louise Congdon
Managing Partner
Tel: +44 (0)1625 614051
Page
1. Introduction 4
2. The Economic Benefits of Route Development 7
3. Scottish Market Context 12
4. Overview of the Economic Appraisal Framework 18
5. Transport Economic Efficiency 23
6. Business Competitiveness Impacts 33
7. Tourism Impacts 40
8. Regeneration & Social Impacts 44
9. Local Environmental Impacts 48
10. Risk Assessment 51
11. Decision Making with the Appraisal Framework 53
12. Recommendations for Future Development 55
Appendix A: References 57

York Aviation
Glossary ABZ – Aberdeen Airport
ACI EUROPE – Airport Council International Europe
ATAG – Air Transport Action Group
BCI – Business Connectivity Index
BCR – Benefit Cost Ratio
QC – Quota Count
CAA – Civil Aviation Authority
CO2 – Carbon Dioxide
CORINAIR - EMEP/EEA air pollutant emission inventory guidebook — 2009
DECC – Department for Energy and Climate Change
DXB – Dubai Airport
EDI – Edinburgh Airport
ETS – Emissions Trading Scheme
EWR – New York Newark Airport
FDI – Foreign Direct Investment
GaWC – Globalisation & World Cities Network
GDP – Gross Domestic Product
GLA – Glasgow International Airport
GVA – Gross Value Added
IATA – International Air Transport Association
INV – Inverness Airport
IPS - International Passenger Survey
LTO – Landing Take-Off Cycle
MIDT – air fare data collected from central reservation systems
NOX – mono-nitrogen oxides
NPV – Net Present Value
OAG – Official Airline Guide
Pax – Passengers
PIK – Prestwick Airport
RDF – Route Development Fund
SPASM – Department for Transport Passenger Allocation Model
STAG – Scottish Transport Appraisal Guidance
TEE – Transport Economic Efficiency
VFR – Visiting Friends and Relatives
WEBs – Wider Economic Benefits
WebTAG – UK Department for Transport Transport Appraisal Guidance
3

York Aviation
1. INTRODUCTION
4

York Aviation
Introduction Increasingly public sector partners including Transport Scotland,
Scottish Enterprise and Visit Scotland are taking a ‘Team Scotland’ approach to the strategic development of new air routes to Scotland. All partners are agreed on the importance of ensuring that support efforts are directed towards routes that will bring net economic benefits to Scotland.
With this in mind, in late December 2011, Scottish Enterprise, working in partnership with the other parties, commissioned York Aviation to develop a common economic appraisal framework for new route development activities that could be agreed by all parties.
The Study is specifically required to address three main components, summarised below:
• a brief overview of existing evidence, literature and research on the economic and carbon costs and benefits to an economy of increased air connectivity;
• a brief review of existing methodologies for assessing economic and carbon costs and benefits (including Transport Economic Efficiency appraisal and approaches to assessing wider economic benefits); an appropriate methodology is then to be proposed that will allow an assessment to be made of the quantitative and qualitative contribution of new air routes to the Scottish Government’s Economic Strategy and the National Performance Framework; this should also consider how contributions to the development of Scotland’s growth sectors might be measured, and whether economic benefits can be measured at a sub-Scotland, Scotland, UK and European level;
• the testing and use of the agreed methodology to appraise the quantitative and qualitative economic and carbon costs and benefits of five potential routes into Scotland (2 from Scotland to China and 3 from Scotland to the Middle East).
This Technical Report sets out the rationale for public sector intervention in the air transport market, provides a detailed description of the defined appraisal framework and its indicators, outlines the basis for calibration of the scored element, details the information requirements of the framework and main sources, and provides some guidance on the use of the framework in decision making. It is also provides some recommendations for the future development of the framework and improving calibration of the process over time.
The report is structured as follows:
• Section 2 considers the economic benefits associated with air services and new air routes based on a review of existing literature.
• Section 3 considers the particular circumstances in the Scottish air transport market and the benefits that could accrue from future route development;
• Section 4 introduces an overview of the economic appraisal framework, outlining the different elements of the framework and the linkages to air services’ ability to deliver economic benefit to the Scottish economy;
• Section 5 sets out in detail the different indicators within the TEE element of the appraisal framework and the basis for their calculation;
• Section 6 sets out the indicators within the Business Competiveness element of the appraisal framework, the calculation of these indicators and the basis for scoring where relevant;
• Section 7 sets out the indicators within the Tourism Impact element of the appraisal framework, the calculation of these indicators and the basis for scoring where relevant;
5

York Aviation
Introduction • Section 8 sets out the indicators within the Regeneration
and Social Impact element of the appraisal framework, the calculation of these indicators and the basis for scoring where relevant;
• Section 9 sets out the indicators within the Local Environmental Impact element of the appraisal framework, the calculation of these indicators and the basis for scoring where relevant
• Section 10 sets out the basis for the route risk assessment;
• Section 11 provides some guidance on the use of the appraisal framework in decision making;
• Section 12 sets out our recommendations for the future development of the appraisal framework.
6

York Aviation
2. The Economic Benefits of Route Development
7

York Aviation
The Economic Benefits of Route Development The economic benefits that stem from air services have been
long established by a wide range of research. Air transport is a provider of prosperity through its operations, employing large numbers of people at and around its geographic nodes (airports), and through its impact on supply chains, but, in many ways more importantly, it is a facilitator of wider economic activity in other sectors.
Air services provide connectivity that improves the functioning of a wide range of markets and extends their geographic scope. This enables flows of trade, investment, labour, knowledge and visitors that ultimately support economic growth by providing new opportunities, improving productivity and increasing competition. These benefits extend directly or indirectly across all sectors of the economy.
In the context of considering the economic benefits that stem from the development of new routes, it is these benefits to the wider economy that are most relevant. They are also the most relevant in the context of the Scottish economy, which is a modern, developed economy with a focus on developing high value added activities with a strong international focus, stemming from its relatively small domestic markets.
The evidence to support the role played by air services in supporting these benefits in the wider economy is set out in a wide range of different research documents, ranging from specific studies in to the economic impacts associated with Scotland’s major airports to high level research undertaken at national or international level.
Research undertaken by the Air Transport Action Group (ATAG)
in 2008 identified “that air transport industry’s most important economic contribution is through its impact on the performance of other industries and as a facilitator of their growth”. It cites survey work that identified that 52% of firms consider the availability of air services to be an essential factor in considering locating in Europe. It moves on to estimate that the increased connectivity offered by air transport over the previous decade had resulted in increased global GDP of around US$ 2,460 billion.
The social and economic impact of airports in Europe produced by York Aviation for ACI EUROPE again highlighted the importance of air services in supporting growth in the wider economy. It emphasises both the importance of major national airports, such as Amsterdam Schiphol, Paris Charles de Gaulle or Heathrow, in driving highly international economies but also focuses in on the essential role played by regional airports in developing international clusters.
This research also moves on to highlight the particular importance of air services to a number of economic sectors, namely insurance, banking and finance, other means of transport, printing and publishing, coke, petroleum and nuclear fuels, extraction, transport, communications, other business services, research and development, basic metals, computer activities and precision and optical instruments. The confluence with a range of Scotland’s growth sectors is clear.
8

York Aviation
The Economic Benefits of Route Development Research undertaken by Oxford Economic Forecasting in to
Aviation’s Contribution to the UK Economy (2006) identified again the importance of air services and connectivity in stimulating the wider economy. Specifically it identified that:
• visitors arriving by air contribute over £12 billion a year to the UK tourism industry, generating a further 170,000 jobs;
• 55% by value of the UK’s manufactured exports to countries outside the EU are transported by air;
• air services have been vital in developing economic relationships with emerging economies such as China;
• a quarter of companies report that access to air services is important in determining where they locate their operations in the UK.
More recently Frontier Economics have examined the link between the existence of direct flights and the UK’s trading relationships. This research identified that UK businesses trade 20 times as much with emerging market countries that have a direct daily flight to the UK, as they do with those countries that do not. It found that the lack of direct flights to emerging markets may already be costing the economy £1.2 billion a year as trade goes to better connected competitors.
In terms of FDI, a range of studies have homed in on the particularly vital role that air services play in attracting and retaining overseas investors. In 2003 research by Napier University identified air links as the most influential transport factor in the location decisions of most overseas based business investing in the UK.
9
A survey undertaken by Oxford Economics and IATA of 600 companies in five countries found that air links were vital or very important in location decisions. Oxford Economics 2011 study in to the economic benefits of air transport also clearly identified a positive correlation between FDI stocks and a country’s connectivity (see chart).
It is also noticeable that surveys of senior executives, such as the Cushman & Wakefield European Cities Monitor, consistently highlight the importance of factors such as access to markets and transport links in location decisions.
Source: Oxford Economics.

York Aviation
The Economic Benefits of Route Development In 2011, the European Cities Monitor identified that easy access
to markets, customers or clients was the single most important factor in location decisions (60% of respondents considered this absolutely essential). Transport links with other cities and internationally was the fourth most important factor (42% of respondents considered this absolutely essential).
This generic evidence on the importance of air service development and connectivity growth to the wider economy is supported by a range of research focussed on Scotland.
The evaluation of the Scottish Route Development Fund (RDF) undertaken by Scott Wilson Kirkpatrick in 2009 identified the significant economic benefits that had accrued to Scotland from previous market intervention to increase Scotland’s air connectivity:
• the evaluation identified that the transport economic efficiency net present value of RDF was around £406 million (2002 prices) with a benefit cost ratio of around 24;
• RDF generated additional Gross Value Added (GVA) of between £47 million and £52 million;
• the routes resulted in net additional tourism expenditure of around £27.7 million (net in this context refers to net of outbound expenditure);
• airlines supported by RDF supported an additional 37 full time equivalent jobs;
• the routes, particularly to the Highlands & Islands, where found to play an important role in combating social exclusion.
At an individual airport level, a number of economic impact
studies in recent years have identified the vital importance of Scotland’s airports in supporting the international economies within their catchment areas:
• York Aviation’s research in to the economic impact of Edinburgh Airport in 2009 identified that the Airport “is viewed by stakeholders as an important factor firstly in attracting investment to the Edinburgh City Region and secondly in allowing firms within the City Region to operate effectively in world markets. Of particular importance are the links to London, the UK capital, and one of the world’s leading business centres. However, the expansion in the range of international destinations has also been seen as an important factor in expanding Edinburgh’s image as an international business destination”;
• the report also identified the role that the Airport plays in supporting Edinburgh’s tourism economy with visitors arriving via the Airport spending £800 million in Scotland;
• despite these positive messages, the report still identified that Edinburgh suffers from a connectivity gap and is overly reliant on Heathrow for international connectivity;
• a similar study undertaken by York Aviation for BAA Glasgow and partners identified that the Airport was an important factor in company location decisions in and around the Glasgow City Region and an important enabler of the City’s growth sectors, particularly financial services;
• the Airport is seen as a vital part of Glasgow’s international image, putting it on the map in European and global terms;
10

York Aviation
The Economic Benefits of Route Development • the recent economic impact study of Aberdeen Airport
undertaken by York Aviation also identified a similar role. The Airport is essential to the functioning of the exceptionally global energy cluster in Aberdeen City & Shire;
• the economic impact study of Prestwick Airport undertaken by SQW cites responses from a survey of local business that show that more than half of all the businesses responding considered that the airport was of importance to their performance and almost a fifth thought it very important or critical.
This research articulates clearly the substantial economic benefits that can come from the development of air services and particularly the development of additional connectivity that supports international economic activity and tourism.
The Scottish Government acknowledges that, while good air links support Scotland's economy, including the tourism industry, and aims to encourage the development of direct routes to Scotland to foster inward investment and tourism, the sustainable growth of Scottish airports does, however, need to be considered in the context of the Scottish Government’s Climate Change Act.
While aviation is a relatively small contributor to the UK’s total CO2 emissions, around 6% according to the Department for Transport, the economic benefits need to be weighed against environmental costs and appropriate strategies for long term management of aviation’s emissions must be implemented, most obviously through the sector’s entry in to the EU Emissions Trading Scheme (ETS).
This policy position sets a context for the appraisal mechanism to be considered here. It sets out that consideration of a new route’s benefits to users and wider economic benefits must be set against its environmental impacts.
11

York Aviation
3. Scottish Market Context
12

York Aviation
Scottish Market Context In this Section we briefly consider the context in which the
economic appraisal framework will be operating in terms of the air transport market in Scotland. This is helpful in considering what elements and measures within any economic appraisal framework might be of particular value.
It should be noted that this is not intended to be a comprehensive review of the Scottish air transport market but aims to inform the appraisal structure and assist in providing a rationale for public sector interventions.
Overall, the Scottish air transport has, in the main, been growing healthily over the last decade, with significant growth at Edinburgh in particular (see Figure 1 opposite). The recent global recession has see some downturn in traffic but growth appears to be returning.
There are a number of issues of contextual issues that we believe warrant particular comment here:
• the growth of international services to and from Scotland in recent years;
• the size of markets in Scotland, particularly for long haul services;
• the importance of hub services in supporting connectivity;
• the reliance on connectivity via Heathrow and the vulnerability of this link;
• the geographic remoteness of parts of Scotland and the consequent social function of air services.
13

York Aviation
Growth of International Services
With this growth in recent years has come a substantial expansion in the number of scheduled international services offered from Scotland’s airports (see Figure 2).
This expansion is often cited as one of the key benefits of the original RDF. This public sector intervention is seen by many as having been vital in raising awareness amongst potential airline customers of the opportunities offered by the Scottish market.
This expansion also coincided with the ‘boom’ period for low fares airlines and it is noticeable that a lot of the growth in routes served has been within Europe.
While European connectivity is clearly important from an economic development perspective, the rest of the UK and the EU remain Scotland’s largest trading partners, it does not fit in entirely with the expected future development of the global economy, which is expected to focus on the East and South America.
In other words, prima facie there appears to be a degree of connectivity gap in Scotland in terms of the development of services to economically important long haul destinations.
Clearly, there are links here to the importance of international hub airports to the Scottish air transport market and to issues around the size of markets, but the economic imperative of connections to the major emerging economies and indeed to the world’s current economic centre of gravity, North America, would appear to provide basic justification for intervention in the market.
14

York Aviation
Size of the Scottish Market
One of the key challenges facing stakeholders involved in route development in Scotland is the scale of markets, particularly in relation to long haul services.
Put simply Scotland is a relatively small country with a population of only around 5.2 million people, albeit the great majority (around 4.3 million) are concentrated within a 90 minute catchment area of either Glasgow or Edinburgh airports.
The Table opposite illustrates this issue. It shows the total number of passengers travelling to/from long haul destinations in 2009 from the broad catchments for Scotland’s main airports (Scotland), the UK’s largest regional airport, Manchester, (the North of England) and Heathrow’s core catchment in London & the South East.
The problem in terms of long haul route development is clear. The market in Scotland is barely half the size of that for Manchester. Although this is market circumstance rather than market failure, it has a number of implications for both the rationale for public sector intervention and for the development of the Appraisal Framework:
• it will be harder for Scotland to develop the long haul connectivity it needs to support future economic development and to access emerging markets. Again, this suggests that there is a case for the public sector to intervene in the market to provide support for the establishment of a route where it is thought the route will eventually be sustainable in the medium to long term;
15
Origin or Destination Long Haul Passengers
Scotland 2,700,000
North of England (North West, North East, Yorks & Humber)
5,300,000
London & the South East 17,400,000
Source: CAA Passenger Survey 2009.
• it will be difficult for any long haul route to be viable purely on the basis of the size of the point to point markets. The great majority of opportunities are likely to involve feeding international hub airports. This brings benefits over and above those offered by the point to point connection and these need to be effectively recognised within the Appraisal Framework.

York Aviation
Hub Services and Reliance on Heathrow
Building on the point above, the importance of hub services generally within the Scottish air transport market has been a consistent theme during consultations with wider stakeholders undertaken as part of the Study.
There is a general recognition amongst the business community that, in the main, business markets in particular are small and that, as a consequence, hub services are going to be vitally important in providing the breadth of connectivity needed.
Over 40% of international passengers travelling from Scotland’s airports travelled via a hub in 2009 (see Figure 3). This hub market is dominated by Heathrow, which handled over 1.4 million passengers connecting either to or from a Scottish airport.
The other major players in terms of hub connections were Amsterdam, Gatwick and the long haul hubs of Dubai and New York Newark.
In the context of new route development from Scotland there are perhaps two further issues to be concerned with:
• it is important that new route activity that is supported in some form by the public sector does not significantly adversely impact on the existing hub services. It is highly unlikely that a new service will have no impact but it should not significantly undermine any single operation and any concerns should be reflected within a risk assessment for the route;
• Again, it re-emphasises the importance of understanding and articulating the economic benefits that come with particular hub connections and the onward connectivity they provide to economically important destinations.
16
The extent of Scotland’s reliance on Heathrow for hub connectivity is also a concern from a strategic perspective. The on-going capacity constraint at Heathrow has seen the continued decline of the Airport’s domestic feeder network as airlines have sought to use their Heathrow slots for more revenue intensive long haul services. The first evidence of this dynamic impacting on Scotland may be the withdrawal of the bmi service from Glasgow.
With the UK Government’s current moratorium on a third runway, there is little chance of an improvement in the capacity situation in the short or even medium term. There is therefore a strong rationale for the public sector to seek to support access to the full range of global destinations through the development of new hub services or the protection of existing ones.
Source: CAA Passenger Survey 2009.

York Aviation
Combating Peripherality
Scotland as a whole is a geographically peripheral part of the UK and Europe. Stakeholders have repeatedly emphasised the importance of good air service access to London, in particular and to other major centres more generally.
However, there is a further strategic consideration with regard to the peripherality of large parts of Scotland not just from London and the wider world but from the main centres in Scotland as well.
The Highlands and Islands of Scotland are amongst the most inaccessible parts of the UK and developing air service connectivity that benefits these areas is not just an economic prerogative but also a social one. The simple necessity of connecting to other parts of Scotland, the UK and Europe is an important factor in:
• quality of life;
• accessing essential and specialist goods and services;
• enabling visits to friends and relatives;
• facilitating cultural activities and links.
At the same time, given again the relatively small size of markets, securing sustainable route development can be challenging. Clearly there is therefore a role here for the public sector in supporting route development and equally the appraisal framework needs to be able to recognise a service’s contribution to wider social impacts.
17

York Aviation
4. Overview of the Appraisal Framework
18

York Aviation
Core Requirements of the Framework At the outset, it is important to outline the broad principles and
requirements of the Framework. These have been guided by discussions with partners, relevant appraisal guidance and our experience of previous route development evaluation frameworks:
• the appraisal process needs to be proportionate. It is currently unlikely that significant funding will relate to these activities and there are significant uncertainties in any air transport related intervention. The Framework should be robust but not excessive and should avoid the impression of spurious accuracy;
• the Framework should be transparent and clear. It is important that partners without strong economics backgrounds or backgrounds in air transport can understand and use the outputs effectively and it must be clear how decisions are reached;
• it is important to examine net economic benefits. Both in terms of covering major costs, including environmental costs, and benefits and in terms of re-distributional impacts;
• it should consider impacts at different spatial levels. These have been agreed as Scotland, the United Kingdom and European Union. It should however be noted that many of the scored indicators and the qualitative indicators are really only applicable to Scotland;
• it is important to go beyond traditional Transport Economic Efficiency analysis to consider Wider Economic Benefits (WEBs). In examining WEBs, there is a general recognition
that this needs to include analysis of both quantitative and qualitative indicators;
• the Framework needs to be able to identify both the best option amongst a range of routes, operators on the same route or between airports, and to provide a basis for one-off decision making where only a single route is on the table;
• there is a requirement to ensure that the strategic value of new routes to particular growth sectors is reflected in the appraisal methodology;
• the importance of recognising that there are risks and uncertainties attached to the delivery of the economic benefits associated with any given route is understood. However, given the likely paucity of reliable data on airline and route financials, airline strategy and other core elements of any assessment, it has been accepted that the risk element of the appraisal will be qualitative;
• the Framework should allow flexibility in decision making. Its purpose is to present evidence not to automate the decision process. Ultimately, decisions must be made by those appointed to that capacity.
The Framework set out in this Technical Report reflects these principles and has been the subject of consultation with key parties likely to be involved in the appraisal process.
19

York Aviation
Compliance with Existing Guidance The primary relevant guidance in this project is the Scottish
Transport Appraisal Guidance (STAG). The latest version of this Guidance was issued in June 2008, although there have been some minor updates since. The latest version can be accessed at http://www.transportscotland.gov.uk/stag/home.
STAG sets in place the broad framework for appraisal under the economy objective of examining three main areas:
• Transport Economic Efficiency;
• Wider Economic Benefits;
• Economic Activity and Location Impacts.
These three elements of analysis are at the centre of the appraisal framework developed here. However, in common with its English equivalent (WebTAG), the primary focus of STAG is surface transport appraisal. In consequence, while the broad principles can be adopted for the consideration of air transport issues, there are limits to the relevance of the guidance in some areas.
The new refreshed version does not alter the fundamental principles that were outlined in STAG at the time of the launch of the Scottish RDF in 2002. Given that this Appraisal Framework draws heavily on the previous RDF appraisal framework, which was deemed to be compliant with STAG, we are confident that the economic appraisal framework set out here is compliant with the core principles and practices within STAG.
Recently WebTAG has been updated with an additional module focussing on aviation appraisal that is currently out for consultation (TAG Unit 3.18). This module can be found at http://www.dft.gov.uk/webtag/documents/expert/unit3.18c.php. This guidance focuses primarily on TEE impacts through the examination of changes in shadow costs given different paths for airport development. In this context, shadow costs are an
economic construct used to balance supply and demand in a constrained airport system. They essentially reflect the costs of capacity constraints to users. This is not particularly helpful or appropriate to the current situation as shadow costs derived from the DfT’s national airport allocation model cannot distinguish between routes or frequencies. They only consider the impact of changes in system wide capacity.
Essentially, this appraisal unit is designed to offer guidance in appraising the impacts of major changes in airport capacity within the UK market. For instance, the building of new runways or terminals or even new airports. It is not an appropriate mechanism for examining the impacts of new routes or even changes of airport capability. We have not therefore considered this Guidance further.
In addition, we have also examined the latest Scottish Enterprise Guidance on economic impact assessment (Additionality & Economic Impact Assessment Guidance Note - November 2008). This reinforces the messages from STAG, particularly around the assessment of additionality. It also provides some useful ‘ready reckoners’ for examining displacement issues where these are relevant.
We have also considered a number of existing methodologies for examining the economic benefits of route development. By far the most relevant of these were our own work on the appraisal of route development funds in Scotland, Northern Ireland, Wales and for the Department for Transport. The new methodology here is fully compatible with this previous research and the alterations made in the new methodology are enhancements designed to address emerging issues, such as climate change, or weaknesses or gaps in the original analysis.
20

York Aviation
Overview of the Economic Appraisal Framework The economic appraisal framework for new routes from
Scotland is a form of multi-criteria analysis. It uses monetised estimates of the impact of changes in the market brought about by a new route wherever possible but recognises that there are issues that are either not quantifiable in monetary terms but are quantifiable using other measures or are simply not sensibly quantifiable in any form.
The Framework follows the broad format established by STAG for the appraisal of economic objectives:
• it examines the costs and benefits accruing to direct users from the introduction of the new route in a monetised form to enable a TEE analysis. Ultimately, positive TEE impacts will result in generalised economic benefits to Scotland via a number of routes such as by increasing productivity (time savings), increasing disposable incomes, securing company location and attracting new tourism activity;
• it then uses other indicators to examine the WEBs resulting from the introduction of the new route;
• it adjusts benefits and costs accrued to take account of locational impacts and assesses the extent of changes in economic activity relating to the introduction of the new route where possible;
• finally, it provides some guidance on the likelihood that the anticipated economic benefits will be delivered via a risk assessment.
Where non-monetary indicators are used, a scoring system has been defined to assist decision makers in understanding whether a route’s score is either good or bad.
For ease of use and transparency, the Appraisal Framework has been divided in to a number of analytical blocks. These blocks represent the TEE assessment plus a block for each area in
which a new route might result in wider economic costs or benefits. Locational impacts are reflected within each block.
Each block contains one or more indicators that provide evidence of the impact of the route on that particular aspect of the analysis. These indicators can be either monetised quantitative indicators, scored quantitative indicators or qualitative information. A summary diagram showing the different analytical blocks and the indicators within them is shown on the next page. This gives an initial overview of how the Appraisal Framework fits together and the range of information to be presented to decision makers.
There are two further points to note at this stage:
• some of the indicators presented in relation to the WEBs of a new route are simply transformations of each other. For instance additional tourism expenditure drives tourism related GVA which in turn drives the number of tourism jobs created. In these instances only one score is presented. This is to avoid accidental over weighting of what is essentially the same result within decisions. The transformed indicators remain within the appraisal as they are helpful for some stakeholders in benchmarking the results against other activities;
• although there are scores within the Framework there is no total score. After some debate amongst stakeholders, it was felt that there was no adequate or sensible way of weighting results across the different analytical elements and that a single score would potentially be overly prejudicial in terms of decision making. As it stands, the Framework simply presents the results and is neutral on weighting issues.
21

York Aviation
Summary of the Appraisal Framework
New Route
TEE
Surface Journey Time
Air Journey Time
Frequency Time Air Fare
Airport & Airline Revenue
Government Revenue
Air & Surface Carbon Costs
Business Competitiveness
Destination Status
Direct Business Connectivity
Indirect Business Connectivity
Day Return Trip Options
Strategic Connections
Tourism Impact
Additional Tourism Expenditure
Additional Tourism GVA
Additional Tourism Employment
Strategic Connections
Regeneration & Social
Direct Employment
Direct GVA
Direct Connections
Indirect Connections
Local Environmental
Noise Rating
Air Quality
22
Risk Assessment

York Aviation
5. Transport Economic Efficiency
23

York Aviation
Overview and Key Information Sources Overview
It is considered good practice within transport appraisal to reflect as many economic costs and benefits as possible within a monetised form. This forms the basis of TEE analysis which is the core element in most transport appraisal. As described above, this type of analysis is a core element within appraisal of the economy objective in STAG and in its UK equivalent WebTAG.
It considers the impact that a transport intervention will have on the economic welfare of the economic actors directly involved in the market. In this case, it considers the impact that a new route from Scotland will have on:
• Passengers;
• Airports;
• Airlines;
• Government;
• the Environment.
It should be noted that impacts on the environment would normally be considered under the separate Environment objective within a STAG appraisal. However, given the policy position of the Scottish Government and the particular concerns around the environmental impacts of aviation, we have included impact on carbon emissions as a monetised cost within this economic appraisal. This is common practice in aviation appraisal now and is an area that is an enhancement on the previous RDF appraisal framework.
The results of this analysis are presented as a discounted net present value based on a five year appraisal period. Given the general speed of evolution in the air transport market, a relatively short appraisal period has been used to minimise exposure to risk. The discount rate used is that recommended by STAG, 3.5%.
All indicators can be disaggregated in to Scottish, Other UK, Other EU and foreign passengers, as well as business and leisure users.
Key Information Sources
The TEE element of the appraisal framework is by some margin the most data intensive of the analytical blocks. It requires a wide range of information to enable the analysis from an array of different sources. Throughout this Section we have identified information requirements and key data sources. However, there are a number of data sources that are frequently used and some up front description is important.
Perhaps the most important single input to the TEE analysis is the demand forecast for the routes. These are prepared as part of the route development process. For the Appraisal Framework to be operated to its full effectiveness, there are a set of stringent output requirements from the demand forecasts that need to be provided:
• numbers of diverted and stimulated passengers on the new route;
• numbers of passengers travelling point to point between Scotland and the immediate destination and numbers travelling onward to other destinations;
• detailed breakdowns of passenger origin (Scotland, other UK, other EU, Foreign) and purpose of travel (Business or Leisure);
• detailed information on origins/destinations within Scotland for each passenger group;
• the impact on other routings following the introduction of the new service in terms of passengers lost by passenger group.
24

York Aviation
Overview and Key Information Sources Other key data sources that have been used throughout the TEE
analysis include:
• UK CAA Passenger Survey – the CAA surveys passengers at Scotland’s airports every three to four years. The last occasion was in 2009. These surveys ask passengers a wide range of questions including questions around nationality, purpose of travel, ultimate destination, airline used, area of residence and surface origin and destination. A copy of the latest questionnaire can be found at http://www.caa.co.uk/docs/81/LHR2009.pdf. This data is a key element of the forecasting process but is also be used to sense check and to enable additional assumptions to be made in relation to passenger behaviour at Scotland’s airports;
• DfT Values of Time – neither STAG nor WebTAG currently specify values of time for air travellers. However, air traveller values of time have been specified by DfT as part of its air traffic forecasting work. These values are in the main higher than for other modes, particularly for business travel, reflecting the status and productivity of air travel users. These values were last set out formally in in the SPASM Rules and Modelling and User Guide, which was issued as part of the Consultation on the Future Development of Air Transport White Paper;
• MIDT – this provides a centralised source of data on air fares. Some information has been provided from this source in testing the appraisal framework. However, the data set behind it is not perfect and it is limited in its
applicability to new routes as fares are not known. In early test appraisals fares extracted from airline websites have been used as an alternate view. MIDT data may however be a useful source for the future;
• CORINAIR Emission Inventory Guidebook – this provides details on fuel burn and carbon emissions for a wide range of aircraft types. While not all aircraft types are covered it provides a sound basis for benchmarking and analysis;
• DECC Carbon Costs – Carbon Valuation in UK Policy Appraisal has been used to identify a cost of carbon for emissions created within an ETS traded sector such as aviation. The range over next five years is expected to be £22 to £24 per tonne of CO2. Assumptions regarding the cost of carbon emissions is an area that changes regularly. It will be important for the appraisal framework to reflect the latest guidance in this area.
Below we have introduced each of the individual indicators within the TEE assessment and explain their relevance and calculation.
25

York Aviation
The Rule of a Half At this point it is also helpful to introduce an additional
concept that appears at a number of points in the TEE element of the appraisal – the Rule of a Half.
The Rule of a Half is a commonly used convention in transport appraisal that deals with the conceptual problem of assessing the benefits to passenger users stimulated to travel by the change in the market being appraised, in this case a new air route. The essence of the problem here is that as these passengers did not travel before there is no counterfactual against which to assess how the new route impacts on, for instance, their travel time or the fare they paid.
The Rule of a Half postulates a relationship between the costs or benefits to these travellers and the change in the market based on consumer surplus and the shape of the demand curve. The diagram opposite shows the impact on consumer surplus from a change in generalised cost, such as that which might be brought about by a new route.
Area A shows the change in consumer surplus for existing users. Area B shows the additional consumer surplus accruing to new users. The feature to note is that the area is bounded by the demand curve. The area is approximately equal to half the change in generalised cost multiplied by increase in demand.
Extending this to the present situation, it is therefore reasonable to estimate that benefits to stimulated users are equal to half the observed change in generalised cost (such as time or air fare) to existing users multiplied by the number of stimulated passengers.
26
A B
Generalised
Cost
Total Demand
Demand Curve
P0
P1
Q0 Q1

York Aviation
Passenger Related Indicators Indicator Notes Calculation
Surface Journey Time
• It essentially compares the access time to the airport used with and without new service. Where the new service results in the passenger switching airports there is potentially a time cost or benefit.
• In the case of long haul hub routes, there will often may limited impacts as the Scottish airport used will often be the same and only the air routing that changes.
• Time is monetised using DfT air passenger values of time. • Stimulated passengers are subject to the ‘rule of a half’
reflecting the fact that the impact on consumer surplus is not the same as for diverted passengers.
Diverted Pax ((SJTDAptA – SJTDAptB) x VoT) x DPAXD Stimulated Pax ((SJTS/DPAX) x SPAX)/2 SJTD = Surface Journey Time from District AptA = Airport A AptB = Airport B VoT = Value of Time DPAXD = Diverted Passengers from District SJTS = Total Surface Journey Time Savings DPAX = Diverted Pax SPAX = Stimulated Pax
Air Journey Time
• This considers the changes in flying and connecting times caused by a passenger switching from their original routing to the new routing.
• The largest single benefit to users is likely to come where a new route removes the requirement on passengers to hub, thereby eliminating connecting time.
• Flight times are estimated on the basis of existing schedules using reference airports in different world areas if required.
• Connecting times are based on the average connecting times in current schedules to different world areas within a three hour window.
• Stimulated passengers are again subject to the ‘rule of a half’.
Diverted Pax ((RouteA – RouteB) x VoT) x DPAX Stimulated Pax ((AJTS/DPAX) x SPAX)/2 Route – flight routing VoT = Value of Time AJTS = Total Air Journey Time Savings DPAX = Diverted Pax SPAX = Stimulated Pax
27

York Aviation
Passenger Related Indicators Indicator Notes Calculation
Frequency Time
• The importance of choice and frequency has been emphasised repeatedly during consultations.
• A new service reduces the wait time between services and increases choice.
• This measure was not previously used in the RDF appraisal but is recognised as important in the appraisal of other modes and in more complex aviation models.
• It is important to consider the frequency offered by direct and indirect routings.
• Frequency time effects all users not just passengers on the new service.
Diverted Passengers ((TIME/FRQAJ) – (TIME/FRQBJ) x PAXJA) x VoT Stimulated Passengers ((DFSAV / PAXJA) x SPAX)/2 TIME – Number of minutes in an operating day. FRQ – total direct and valid indirect connections A – without new route B – with new route J – destination airport/world area PAX – all passengers VoT – Value of Time DFSAV – Diverted passenger frequency savings SPAX – stimulated passengers
Air Fares • This analysis needs reliable data in relation to fares, which is hard to come by.
• A combination of web searches and MIDT data if available is recommended as the most appropriate basis for estimates.
• Results that are heavily driven by the impact on air fares should be considered with some caution and wider evidence should be given additional weight.
• Again, stimulated passengers would be subject to the ‘rule of a half’. • Where new short haul routes are being considered, some thought
should be given to including additional hotel costs if using the new route is likely to result in a passenger having to spend additional time at the destination. These are not included for long haul routes as in general a new route is unlikely to change the number of nights a passenger needs to spend at a destination.
Diverted Passengers (FareA – FareB) x DPAX Stimulated Passengers ((TFareS / DPAX) x SPAX) / 2 Fare – fare on route DPAX – Diverted Passengers TFareS – Total Air Fare Savings SPAX – Stimulated Passengers
28
York Aviation
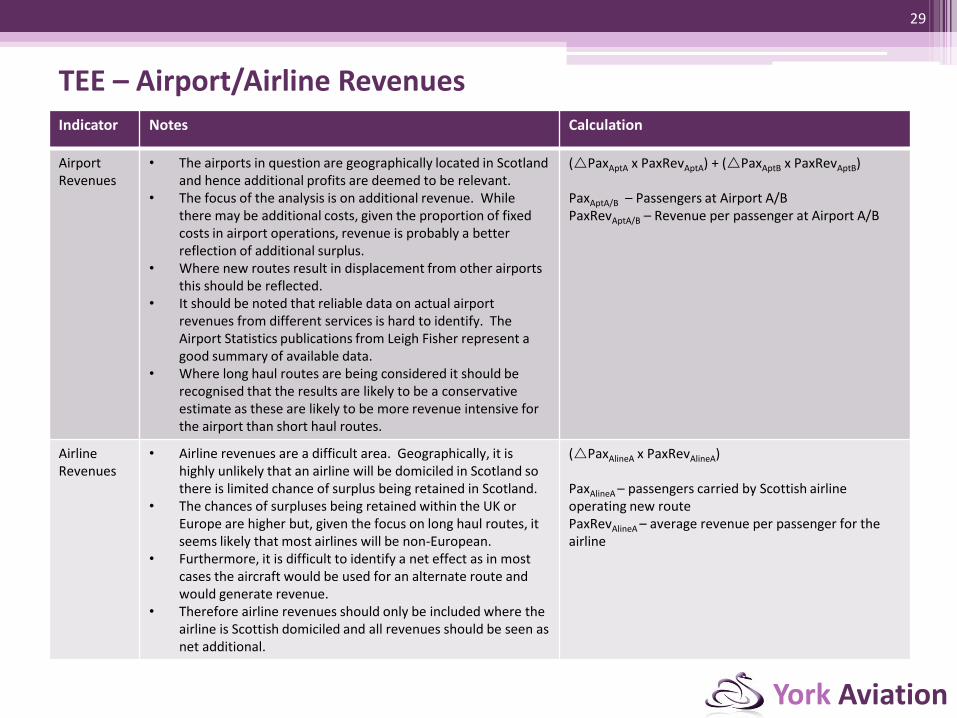
TEE – Airport/Airline Revenues Indicator Notes Calculation
Airport Revenues
• The airports in question are geographically located in Scotland and hence additional profits are deemed to be relevant.
• The focus of the analysis is on additional revenue. While there may be additional costs, given the proportion of fixed costs in airport operations, revenue is probably a better reflection of additional surplus.
• Where new routes result in displacement from other airports this should be reflected.
• It should be noted that reliable data on actual airport revenues from different services is hard to identify. The Airport Statistics publications from Leigh Fisher represent a good summary of available data.
• Where long haul routes are being considered it should be recognised that the results are likely to be a conservative estimate as these are likely to be more revenue intensive for the airport than short haul routes.
(PaxAptA x PaxRevAptA) + (PaxAptB x PaxRevAptB) PaxAptA/B – Passengers at Airport A/B PaxRevAptA/B – Revenue per passenger at Airport A/B
Airline Revenues
• Airline revenues are a difficult area. Geographically, it is highly unlikely that an airline will be domiciled in Scotland so there is limited chance of surplus being retained in Scotland.
• The chances of surpluses being retained within the UK or Europe are higher but, given the focus on long haul routes, it seems likely that most airlines will be non-European.
• Furthermore, it is difficult to identify a net effect as in most cases the aircraft would be used for an alternate route and would generate revenue.
• Therefore airline revenues should only be included where the airline is Scottish domiciled and all revenues should be seen as net additional.
(PaxAlineA x PaxRevAlineA) PaxAlineA – passengers carried by Scottish airline operating new route PaxRevAlineA – average revenue per passenger for the airline
29

York Aviation
TEE – Environment Indicator Notes Calculation
Flight Carbon Emissions
• This the primary environmental impact to be addressed via TEE.
• It assumes that new routes result in additional flights and that there are no off-setting reductions elsewhere. This is a conservative assumption.
• It is based on assumed aircraft type fuel burn data from CORINAIR database.
• It also assumes a radiative forcing factor to reflect impact of CO2 at high altitude.
• DECC carbon prices for ETS traded sectors are used. • Only carbon emitted from aircraft departing from Scottish
airports is estimated as costs for returning flights are assumed to accrue at the other end of the route.
(LTO + (Cruise x Distance) ) x CO2K x RFK x VoC LTO – Landing & Take-off Cycle Fuel Burn Cruise – Average fuel burn per km in cruise Distance – flight distance CO2K – multiplier to convert fuel burn to CO2 (3.16) RFK – Radiative forcing factor (1.9) VoC – Value of Carbon
Surface Access Carbon Emissions
• This is based on travel time to the airport, average speed and fuel consumption of a typical family car with an average occupancy.
• This could be positive in the context of the appraisal (the costs of carbon are reduced) or negative. A new service may result in shorter journeys to the airport.
• Stimulated passengers are again subject to the ‘rule of a half’.
Diverted Passengers ((((SJTAptA – SJTAptB)/AvgS)*Fcons*CO2*VoC)/Occup)/PrivCar Stimulated Passengers ((TSCO2/DPAX) x SPAX)/2 SJTApt – Surface Journey Time to Airport AvgS – Average Speed Fcons – Typical fuel consumption CO2E – DEFRA CO2 equivalent factor VoC – DECC Value of Carbon Occup – Typical car occupancy PrivCar – Propensity to use private car at Airport TSCO2 – Total Surface Carbon Emissions DPAX – Diverted Passengers SPAX – Stimulated Passengers
30

York Aviation
TEE – Government Indicator Notes Calculation
Air Passenger Duty
• There will potentially be a public accounts benefit from new routes relating to increased APD from stimulated passengers.
• Diverted passengers do not represent a gain as APD is already being paid on their travel based on their final destination.
• This impact will primarily be felt at UK level as APD is collected by HM Treasury and does not currently come back to Scotland directly through the block grant.
• It should be noted that this may become more relevant to Scotland in the future.
SPAX/2 x APD SPAX – Stimulated passengers on route APD – relevant APD rate
Support Costs
• Currently there is no mechanism for providing direct for route development in a similar manner to the former Route Development Fund.
• However, the staff, expenses and consultancy support costs of the current advocacy approach are relevant, as are any marketing support costs or de minimis support.
To be provided by project partners
31

York Aviation
TEE Outputs and Assessment The results for the TEE analysis are presented in the form of a
series of Net Present Values (NPVs). These sum the results for the different indicators described to provide a net assessment of the impact of the service on the economic welfare of direct users.
The different NPVs reflect the different geographic scopes of the assessment and also a subset of values that consider the impacts purely on business passengers:
• Business Users:
Net Present Value for Scottish Businesses (NPVScotBus) – this would include only benefits to Scottish business passengers plus all other costs and benefits assessed at the relevant geographic scope;
Net Present Value for UK Businesses (NPVUKBus) – this would extend the analysis to include all UK based business passengers. In most cases this is unlikely to be significantly different other than in relation to APD benefits;
Net Present Value for European Businesses (NPVEUBus) – this would further extend the analysis to include all EU based business passengers. Again, in the case of long haul routes this is unlikely to be significantly different.
• All Users:
Net Present Value for Scottish Users (NPVScot) – as above but including benefits to business and leisure passengers;
Net Present Value for UK Users (NPVUK) – as above but including benefits to business and leisure passengers;
Net Present Value for EU Users (NPVEU) – as above but including benefits to business and leisure passengers.
It should be noted that in relation to the Business Users NPVs the full burden of relevant costs remains within the calculation. So, for instance, the carbon costs associated with the new route will be included unadjusted despite the fact that clearly some of them relate to leisure travellers. This is because it is not possible to isolate effectively the costs relating purely to business travellers.
It should further be noted that no benefits to Foreign Users (outside the EU) are included in any of the NPVs. While benefits to foreign business travellers in particular in terms of accessibility or price could be argued to translate through ultimately to increased trade or investment, this is not deemed to be a direct relationship and will instead be reflected in the other analytical blocks.
In terms of the use of the TEE outputs in making a decision, in general a route should offer positive NPVs for it to be considered for any form of public sector support. However, judgement should be exercised, particularly for instance in cases where air fare impacts are substantially influencing results as, as discussed above, data in relation to this issue can be unreliable.
32

York Aviation
6. Business Competitiveness Impacts
33

York Aviation
Business Competitiveness - Overview It is widely recognised that TEE analysis does not fully articulate
the costs and benefits associated with changes in transport provision. This is particularly the case with air travel, where wider economic benefits are particularly important.
This set of indicators seeks to examine the extent to which a new route will provide a boost to Scotland’s business competitiveness through:
• providing improved access to economically important destinations around the world;
• providing links to important hub airports that ultimately improve Scotland’s connectivity to important business destinations;
• providing enhanced connectivity to destinations that are important for Scotland’s key growth sectors;
• providing enhanced connectivity to destinations that are of general importance in accessing sources of FDI or trade promotion.
These indicators are not monetised and hence are not comparable with the TEE indicators described above. They do however provide further evidence to support decision making.
The previous RDF appraisal framework had a similar group of indicators based known as Business Efficiency indicators. We have sought here to distil these indicators in to a smaller set that combine the principles previously established.
The core factor that is common across all the issues described is connectivity. Essentially, we are seeking to measure the extent to which a new route enhances Scotland’s ability to connect to
the world economy as a proxy indicator of the route’s likely ability to deliver new investment and new trading opportunities, leading to increased prosperity and jobs.
Measuring connectivity is, however, not a simple issue. All destinations are not equal in terms of their importance to economic development. Put simply, a connection to New York is more likely to deliver business opportunities to Scotland than a connection to Alicante.
Equally, the level of service is important to the business traveller. A once weekly connection may be better than no connection but it is of limited value for business travel as (ignoring indirect routings for the moment) any trip is both time intensive and will incur significant expense in terms of subsistence costs. Increasing levels of frequency are therefore important.
However, again, some further thought is required. There is an issue of diminishing returns with frequency. At some point the level of frequency reaches such a level that further increases have little impact on choice and flexibility in reality. They simply add capacity.
Traditional measures of connectivity, which tend to focus purely on numbers of destinations or numbers of frequencies, are therefore of limited use in considering the potential economies impact of air services.
34

York Aviation
The BCI and Related Indicators In recent years, York Aviation has developed the Business
Connectivity Index (BCI) to address these issues. We have identified a number of indicators based on this methodology to examine the potential impact of a route proposition.
The BCI uses research undertaken by the Globalisation and World Cities Network (GaWC) to score airport destination cities in terms of their economic importance. The research examines the location decisions of around 175 advanced service firms, such as accountancy, advertising, law, financial services and management consultancy firms, in over 500 cities around the world. The decisions of these firms are assumed to be reflective of dynamics in the wider economy. The latest GaWC results for 2010 are shown in the Table overleaf.
The analysis goes beyond a simply binary analysis of whether firms are present or not. It seeks to examine the extent of their commitment to individual cities, examining issues around size of the office and the functions and services offered. More information on the GaWC research and its methodology can be found at http://www.lboro.ac.uk/gawc/world2010.html.
The analysis categorises cities in to the following rankings:
• Alpha ++, Alpha +, Alpha, Alpha - ;
• Beta +, Beta, Beta - ;
• Gamma +, Gamma, Gamma - ;
• High Sufficiency, Sufficiency.
These rankings are used to score individual destinations for use within the BCI. These scores are then weighted based on the level of frequency offered to that destination to identify the BCI score for any given destination. The sum of these scores represents the BCI score for an airport or group of airports. The frequency weightings are derived from an analysis of business market capture at different frequency levels. In broad terms increasing frequency is assumed to offer more convenience and
therefore be more valuable. However, beyond a certain saturation point, additional frequencies do not make the connection more useful to the user but simply add capacity.
We have identified three BCI based indicators for use in the route appraisal process. Each can be expressed at an airport level and a Scotland level. We do not consider it helpful to consider these impacts at either a UK or European level as the impacts are likely to be minimal and the issue of attracting FDI or trade is essentially a local or Scottish issue.
• GaWC Classification of the Route Destination – this provides a simple prima-facie qualitative indicator of the value of the route destination;
• Percentage Increase in Direct BCI Score – this identifies the percentage increase in Scotland’s BCI score relating to direct connections resulting from the new route;
• Percentage Increase in Indirect BCI Score – this identifies the percentage increase in Scotland’s BCI score relating to indirect connections resulting from the new route. This is a new application of the BCI. It considers the BCI score relating to valid one-stop connections from Scotland as a whole. A valid connection is defined as:
a connection at the hub airport operated either by the same airline or an alliance partner;
a connection that has a minimum connection time of one hour and a maximum connection time of three hours;
connects either to a destination within the hub’s own world region (excluding European connections to the UK) or to a region that is more distant than Scotland.
35

York Aviation
GaWC World City Classifications 2010 Alpha ++
London, New York
Alpha +
Hong Kong, Paris, Singapore, Tokyo, Shanghai, Chicago, Dubai, Sydney
Alpha
Milan, Beijing, Toronto, Sao Paulo, Madrid, Mumbai, Los Angeles, Moscow, Frankfurt, Mexico City, Amsterdam, Buenos Aires, Kuala Lumpur, Seoul, Brussels, Jakarta, San Francisco, Washington
Alpha - Miami, Dublin, Melbourne, Zurich, New Delhi, Munich, Istanbul, Boston, Warsaw, Dallas, Vienna, Atlanta, Barcelona, Bangkok, Taipei, Santiago, Lisbon, Philadelphia
Beta +
Dusseldorf, Stockholm, Prague, Montreal, Rome, Hamburg, Manila, Houston, Berlin, Athens, Tel Aviv, Bangalore, Copenhagen, Cairo, Bogota
Beta
Budapest, Beirut, Luxembourg, Guangzhou, Seattle, Caracas, Ho Chi Minh City, Auckland, Oslo, Kiev, Chennai, Bucharest, Manchester, Karachi, Lima, Cape Town, Riyadh, Montevideo, Minneapolis Beta - Abu Dhabi, Nicosia, Birmingham (UK), Rio de Janeiro, Brisbane, Geneva, Calcutta, Detroit, Denver, Monterrey, Bratislava, Port Louis, Casablanca, Manama, Stuttgart, Sofia, Cologne, St Louise, Helsinki, Panama City, San Diego, Lagos, Perth, Shenzhen, Cleveland, San Juan, Calgary, Guatemala City, Osaka
Gamma +
Glasgow, Nairobi, Bristol, Hanoi, Cincinnati, Charlotte, Antwerp, Doha, Lahore, Baltimore, Jeddah, Edinburgh, Amman, Hyderabad (Ind), Zagreb, Adelaide, Kuwait, Portland, Belgrade, San Jose (CR), Tunis, San Jose (US), Riga Gamma
Valencia, Kansas City, Phoenix, Almaty, Guadalajara, Lyon, Quito, St Petersburg, Leeds, Santo Domingo, San Salvador, Vilnius, Rotterdam, Tampa, Columbus, Indianapolis, Pittsburgh, Edmonton
Gamma - Tallinn, Pune, Porto, Porto Alegre, Orlando, Gothenburg, Marseille, Ottawa, Colombo, Ljubljana, Tegucigalpa, Richmond, Islamabad, Muscat, Durban, Austin, Belfast, Guayaquil, Nagoya, Turin, Southampton, Milwaukee, Wellington, Curitiba, Accra, Georgetown (CI) High Sufficiency
Jacksonville, Leipzig, Raleigh, Strasbourg, Tijuana, Brasilia, Salt Lake City, Ankara, Pretoria, Tianjin, Bilbao, Ahmadabad, Las Vegas, Belo Horizonte, Liverpool, Malmo, Nuremburg, Canberra, Wroclaw, Queretaro, Nassau, Utrecht, Bologna, Newcastle, La Paz, Asuncion, Hartford, Seville, Lille, Krakow, Nashville, Salvador, Algiers, Dresden, The Hague, Poznan
Sufficiency
Florence, Medellin, Winnipeg, Nantes, Sacramento, Toulouse, Recife, Dar es Salaam, Kaohsiung, Managua, Puebla, Surabaya, Hamilton, Christchurch, Bordeaux, Tulsa, Dakar, Halifax, San Antonio, Johor Baharu, Tirana, Cardiff, Quebec, Lausanne, Baku, Luanda, Bremen, Aberdeen, Birmingham (US), Dhaka, Nanjing, Chihuahua, Hanover, Naples, Providence, Penang, Omaha, Chengdu, Abuja, Port of Spain, Lusaka, Arhus, Leon, Fukuoka, Honolulu, Genoa, Kampala, Hangzhou, Palo Alto, Cordoba, Abidjan, Tbilisi, Qingdao, Skopje, Campinas, Rochester, Windhoek, Memphis, Nottingham, Ciudad Juarez, Dalian, Kyoto, Alexandria, Sheffield, Santa Cruz, Izmir, Gabarone, Cali, Dortmund, Norwich, New Orleans, Valencia, Cebu, Harare, Jerusalem, Basle, Macao, Montpellier, Minsk, Linz, Haifa, Douala, Labuan, Nice
36

York Aviation
Scoring the BCI Indicators The scores for the three quantitative BCI indicators have been calibrated on the basis of notional maximum scores derived from high
value routes. All indicators have been scored between 0 (no impact) and 4 (high impact). The scales have been derived as follows:
• GaWC Classification of the Route Destination – based on a simple interpretation of the GaWC classifications:
0 – a city not rated by GaWC;
1 – a city rated as High Sufficiency or Sufficiency;
2 – a Gamma World City;
3 – a Beta World City;
4 – an Alpha World City.
• Percentage Increase in Direct BCI – the top end score has been derived on the basis of the average percentage increase in Scotland’s current direct BCI caused by either a twice daily short haul service or a daily long haul service to a notional Alpha++ World City. Currently, the total direct BCI for Scotland is 152. Such a service would increase the score by around 7. This gives a maximum increase of 4.4%. The percentage increase resulting from a new service is then scored as follows:
0 – no change;
1 – greater than 0% less than 1.1% increase;
2 – greater than 1.1% less than 2.2% increase;
3 – greater than 2.2% less than 3.3% increase;
4 – greater than 3.3% increase.
• Percentage Increase in Indirect BCI – the top end score has been defined as the maximum percentage increase achieved by adding a new triple daily service to a notional short haul hub with the characteristics of Heathrow, Frankfurt or Amsterdam or a single daily service to a long haul hub with the characteristics of Chicago O’Hare, Atlanta or Dubai. Currently, Scotland’s indirect BCI score is around 900. The average increase resulting from the additional services is around 14. This gives a maximum increase of 1.6%. The percentage increase resulting from a new service is then scored as follows:
0 – no change;
1 – greater than 0% less than 0.4% increase;
2 – greater than 0.4% less than 0.8% increase;
3 – greater than 0.8% less than 1.2% increase;
4 – greater than 1.2% increase.
37

York Aviation
Convenience Indicator In addition to the BCI related indicators, we have identified a
further convenience based indicator for short haul routes. Stakeholders have often emphasised the importance of being able to make day return business trips. Such trips involve less time away from the office, are cheaper in terms of subsistence costs and offer greater flexibility.
This benefit is not easily captured in monetised or quantitative form but we have developed an option based score on whether a service changes the ability of a Scottish based business person to do a day return trip to a short haul destination. For the purposes of this analysis, we have assumed that a successful day return trip must be completed within 16 hours from the origin airport and include 5 hours time at the destination excluding travel time to/from the destination airport.
The scoring system operates as follows:
• 0 – a route scores 0 if it does not improve the ability to do a day return trip directly or indirectly;
• 1 – a route scores 1 where it enables a day return trip with two indirect routings where it was not possible to do a day return trip at all before;
• 2 – a route scores 2 if it enables a day return trip with at least one direct routing where it was only possible via two indirect routes before;
• 3 – a route scores 3 if it enables a day return trip with one direct and one indirect routing where it was not possible directly or indirectly previously;
• 4 – a route scores 4 if it enables a direct day return trip
where it was not possible directly or indirectly previously.
38

York Aviation
Strategically Important Routes In addition to the BCI indicators, we have identified a series of
qualitative ‘flags’ that provide additional information in relation to the importance of a route for:
• identified strategically important FDI or trade markets;
• the connectivity requirements of Scotland’s identified growth sectors:
Education;
Forestry;
Technologies;
Food & Drink;
Financial Services;
Textiles;
Energy & Low Carbon;
Life Sciences/Chemical Sciences;
Creative Industries;
Tourism (relates to the development of the Scottish tourism product via investment not visitor markets. These are examined separately).
A list of priority markets relating to these has been identified using existing research that has been undertaken by Scottish Enterprise with SDI and SE Sector Team leads and through consultations with a number of external stakeholders at a national level and around Scotland’s four main airports. At the time of this report, these are China, India, USA (West Coast), Middle East, Japan, Singapore, Malaysia, Canada, Brazil, Russia, Benelux, Spain, Scandinavia and London. Over time, as well as
further strengthening international relationships, opportunities for route development will be considered as they arise, provided they are beneficial to Scotland’s economic growth.
39

York Aviation
7. Tourism Impacts
40

York Aviation
Overview and Indicators Tourism is a key sector in the Scottish economy, it generates
around £4.4 billion in GVA and employs around 200,000 people, and is clearly one that is directly related to air transport provision. This direct link means that we believe it is appropriate to consider a route’s impact on the tourism economy separately. This is common with the original RDF appraisal framework and the indicators used are similar.
VisitScotland considers its own impact in terms of the net additional tourism expenditure generated by its activities. Crucially, net in these circumstances means that its analysis seeks to strip out passengers who would have come to Scotland anyway. It seems appropriate and sensible to consider the impact of a new route to Scotland in the same terms.
One issue that is worthy of further discussion again relates to additionality. Some would suggest that any new inbound tourism expenditure should have additional outbound tourism expenditure by Scottish passengers stimulated to travel by the route netted off. However, following discussions, we believe that this is not an appropriate consideration for this type of appraisal. It makes assumptions as regards the expenditure and travel patterns of the outbound traveller that are not necessarily appropriate:
• while the passenger may be stimulated in relation to the individual route in question, they are not necessarily stimulated to travel as a whole;
• it assumes that the expenditure lost to Scotland would have been retained in the Scottish economy and not spent on imports or indeed not simply saved.
On this basis, we have identified three interrelated indicators for a new routes impact in Scotland. It should be noted that, as
explained previously, as these indicators are transformations of each other only a single score is calculated for the purposes of the appraisal. The three separate absolute values are calculated and shown for information and benchmarking purposes only. The three indicators are:
• Additional Tourism Expenditure Generated by Stimulated Inbound Passengers;
• Additional GVA Supported by Stimulated Inbound Passengers;
• Additional Tourism Employment Created by Stimulated Inbound Passengers.
The calculation of these indicators is enabled by three main sources of data:
• the demand forecasts for each route identify the number of stimulated passengers coming to Scotland via the new route;
• average expenditure per trip by purpose of travel and country of origin can be accessed from the International Passenger Survey (IPS);
• the Scottish Input Output Tables then provide the necessary multipliers to estimate impacts on GVA and employment based on the change in expenditure. Type II multipliers (these include both indirect and induced effects) have been used.
41

York Aviation
Overview and Indicators The indicators are then calculated as per the Table opposite.
Some further assumptions are also made, most notably that the expenditure is retained within Scotland and that passengers on the new service will exhibit similar characteristics to previous visitors recorded in the IPS data. This latter assumption is perhaps an area for further research. There is evidence from VisitScotland International Marketing Conversion Studies to suggest that new direct services enable visitors to stay for longer and hence an increase in average spend per trip might be expected. However, at present, there is not enough data on which to base a sensible assumption in this area in relation to the introduction of a new route. Estimates of spend should therefore be seen as potentially conservative.
As with the Business Competitiveness indicators, the quantitative tourism indicators have been converted to a single score of between 0 (low impact) and 4 (high impact). Again, the top end of the potential tourism impacts has been identified by reference to a notional very successful service.
In this case, we have assumed that such a route might have similar characteristics to the current largest foreign inbound flow to Scotland from a major tourism market. This is the Edinburgh to Amsterdam service based on the CAA Passenger Survey 2009. This service brought around 90,000 foreign leisure and 28,000 foreign business point to point passengers to Scotland, which, when combined with IPS data on average expenditure for visitors from the Netherlands, suggests a total contribution to tourism expenditure of around £28 million per annum.
Indicator Calculation
Additional Tourism Expenditure
((Stimulated Foreign Business Passengers / 2) x Average Spend per Business Trip) + ((Stimulated Foreign Leisure Passengers / 2) x Average Spend per Leisure Trip)
Additional Tourism GVA
Additional Tourism Expenditure x Hotel & Catering GVA Effect Multiplier (currently 0.82)
Additional Tourism Employment
(Additional Tourism Expenditure / 1,000,000) x Hotel & Catering Employment Effect Multiplier (currently 35.02)
42
We have further assumed that around 50% of these visitors would not come to Scotland if the service were not in place and adjusted for the level of frequency offered. It does not seem reasonable to expect, for instance, a daily service to compete with a quadruple daily service in terms of volumes of inbound visitors.
This identifies a top end expenditure impact of around £500,000 per weekly frequency offered.
A routes expenditure is then scored as follows:
• 0 – a route scores 0 if its expenditure generated is less than 20% of the calculated maximum;
• 1 – a route scores 1 if its expenditure generated is between 21% and 40% of the calculated maximum;
• 2 – a route scores 2 if its expenditure generated is between 41% and 60% of the calculated maximum;

York Aviation
Tourism – Strategically Important Routes • 3 – a route scores 3 if its expenditure generated is
between 61% and 80% of the calculated maximum;
• 4 – a route scores 4 if its expenditure generated is greater than 80% of the calculated maximum.
As previously discussed, only a single score is calculated for tourism impact as the three quantitative indicators are transformations of each other.
As with the growth sectors, there is an extent to which the importance of a route cannot be purely reflected in its expenditure impact. There are routes that might have particular importance in terms of improving brand awareness and penetration in existing core markets or there may be others that will assist in supporting long term strategic aspirations to enter emerging markets.
Particularly in the latter case, the actual numbers of visitors from such destinations may be quite small in the short run but image and brand awareness at the destination is important.
Based on discussions with VisitScotland and research undertaken by Scottish Enterprise with its tourism sector team, a set of strategically important emerging markets has been developed. At the time of this report, these are China, India, Japan, Malaysia, Middle East and Russia. Over time, as well as further strengthening international relationships, opportunities for route development will be considered as they arise, provided they are beneficial to Scotland’s tourism development.
As before, if a route serves a relevant market it receives a qualitative ‘flag’ within the Appraisal, indicating to decision makers that there may be additional considerations regarding this routes from a tourism perspective that need further investigation.
43

York Aviation
8. Regeneration & Social Impacts
44

York Aviation
Overview & Indicators The regeneration and social impact element of the appraisal
framework seeks to articulate the impact that a route will have on local prosperity and quality of life. In the case of all indicators, they are considered at the airport level and the results remain the same across all geographic scopes.
Regeneration Impact – Direct Employment, GVA & Income
We focus on the regeneration impact in terms of the direct impact on local employment around the origin airport and the corresponding GVA and Income impact. This is assumed to be equal to the total employment created by the operating airline in running the new route if staff are to be hired locally. The source of this information is the potential operating airline.
We have excluded other potential direct impacts at the origin airport as, given the fixed costs associated with airport operations, it is unlikely that a single route will significantly increase employment at an airport more generally.
The GVA and Income impacts associated with the new route have then been calculated on the basis of information within the Scottish Input Output Tables. It uses the employment effect multiplier to calculate back to a GVA and Income impact.
While we would not expect the great majority of services to have an adverse impact in terms of direct impacts on other airlines at either the same airport or elsewhere, if there is strong evidence to suggest that this is likely this impact should be netted off the jobs created by the new service. In the absence of specific information on job losses the displacement factors within the Scottish Enterprise guidance on economic impact assessment (Additionality & Economic Impact Assessment Guidance Note - November 2008) could be used.
The indicator has been scored on the basis of the maximum number of direct airline jobs created by an RDF route. This was 13 created by the original Glasgow to Dubai Emirates service. The indicator is then scored on the basis of the percentage of the maximum achieved by the route:
• 0 – no additional employment;
• 1 – less than three jobs created;
• 2 – between three and seven jobs created;
• 3 – between seven and 10 jobs created;
• 4 – more than 10 jobs created.
Social Impact – Increased Connectivity
The quality of life impact of air services and their ability to provide a social function again relates to their ability to offer connectivity to the outside world. They are important in making a location an attractive place to live and work, to enable cultural social interactions, in providing access to emergency and specialist services, leisure travel and in connecting friends and families.
This element was included within the original Route Development Fund appraisal framework primarily to reflect the social value of connections for services to/from the Highlands & Islands. However, it is also an issue in relation to Aberdeen that has been raised by a range of stakeholders. The high skill nature of the economy in the area means that talent attraction is a significant issue and the ability to travel for leisure is seen as a major issue.
45

York Aviation
Overview & Indicators In common with the Business Competitiveness impact of a new
service on for instance FDI or Trade, the social impact of an air service relates primarily to the additional connectivity that a service provides to its base airports.
However, in this case the economic value of the destination is less important. We are considering purely the extent to which a service increases peoples’ ability to travel to all destinations, even where that travel is purely for leisure purposes.
We have therefore identified two simple measures to reflect this issue:
• the percentage increase in weekly direct frequencies from the origin airport resulting from the new service;
• the percentage increase in weekly valid indirect connection from the origin airport resulting from the new service.
The latter is designed to reflect the particular importance of new hub services in providing broad ranging connectivity.
Clearly the results for these measures will be more favourable where there connectivity is currently more limited. This is intuitively correct. A new service from a large well connected airport will make very little difference in terms of social benefits in the surrounding area, whereas a new service from a small, remote airport with few connections will make a considerably larger difference.
These indicators are calculated on the basis of the current schedules for the relevant airport available in the OAG database. A valid indirect connection is based on the same definition as for the indirect BCI indicator, i.e. the connecting service at the hub airport must be operated by the same airline or an alliance partner and the connecting time must be between one and three hours.
The scoring for these two indicators is again based on a maximum impact from a notional high impact route from a Highlands & Islands type airport. This reflects the fact that social impacts from new routes are likely to be substantially greater in the more remote areas of Scotland where services are currently limited.
The percentage increase in direct frequencies is scored based on an additional daily service being added to the current average number of weekly departures from Inverness, Kirkwall, Stornoway, Shetland and Benbecula. This is around 86 flights per week. An additional seven flights per week results in a top end increase of 8%. A route is then scored as follows:
• 0 – percentage increase less than 1.6%;
• 1 – percentage increase of between 1.6% and 3.2%;
• 2 – percentage increase of between 3.2% and 4.8%;
• 3 – percentage increase of between 4.8% and 6.4%;
• 4 – percentage increase of greater than 6.4%.
The percentage increase in indirect frequencies is based on the resulting increase in valid indirect frequencies from Inverness resulting from the addition of a double daily service to Amsterdam operated by KLM. Currently, Inverness offers 77 valid indirect connections. A new double daily KLM service would offer 819 valid indirect connections a week. This results in a 964% increase in valid indirect connections, which defines the top end score.
46

York Aviation
Overview & Indicators A route is then scored as follows:
• 0 – percentage increase less than 192%;
• 1 – percentage increase of between 192% and 385%;
• 2 – percentage increase of between 385% and 578%;
• 3 – percentage increase of between 578% and 771%;
• 4 – percentage increase of greater than 771%.
In addition, services can include a qualitative ‘flag’ where they serve destinations that are particularly important for visiting, friends and relatives travel (VFR). Again, this is designed to provide a decision maker with additional information with regard to the route’s social impact which might mean it needs additional consideration. This information would be collected from stakeholders.
47

York Aviation
9. Local Environmental Impacts
48

York Aviation
Overview & Indicators The carbon impact of a new air service is included within the
TEE assessment described above. However, there are additional local environmental impacts from new services that should be considered as well, particularly: • the impact of the new service on noise levels for residents; • the impact on local air quality.
It should be noted that some methodologies have been developed to try to monetise these impacts, primarily in relation to Heathrow. However, these require highly detailed inputs to be developed that are clearly disproportional to the appraisals being undertaken here. We would also suggest that transferring the existing results away from Heathrow could prove difficult given the very particular circumstances in London.
Developing a measure for noise is relatively simple and is described below. The issue of air quality is substantially more complex. The primary issue is that local air quality issues at airports are often as much to do with ground transport and other issues as aircraft. Distinguishing the impact from this background noise is very difficult.
These measures consider the local environmental impact in Scotland. The impact in the context of the UK or Europe is considered to be minimal as it could reasonably be argued that the aircraft would operate somewhere else in the UK or Europe in any event .
Noise Impact The noise impact indicator is based on the following data:
• Aircraft Quota Count (QC) – this a noise scoring system developed at Heathrow to aid in managing that airport’s noise impact on the surrounding area by linking airport charges to noise. It gives each aircraft type a score of between 0 and 16 for take-off and landing based on the decibels emitted. The average take off and landing QC score of the operating aircraft is used as a base assessment of the noisiness of the aircraft;
• Population within the Airport’s 57dba footprint – this acts
as a basis for the number of people affected by the noise from the new service. We have access to existing information on this issue but will seek to update the base data from public documents produced by the airports;
• Percentage increase in total frequencies – this acts as a measure of intensity. A new service at an already busy airport is likely to less noticeable than one at a quiet airport.
The product of multiplying these three factors together is the Noise Impact Rating for the service. The higher this rating the greater the noise impact of the new route.
The noise rating of a route has been scored on the basis of a notional high impact route and a notional low impact route. In this case the high impact is assumed to be Boeing 747 – 400 operating a daily service from Glasgow Airport. The average QC for a Boeing 747-400 is 3, around 30,250 people live within Glasgow’s 57dba footprint and a daily service would represent a 1.2% increase in total frequencies. This gives a top end noise rating of 1,073. The low impact is defined by a typical modern short haul aircraft, a Boeing 737-800. The average QC for a Boeing 737-800 is 0.75, around 30,250 people live within Glasgow’s 57dba footprint and a daily service would represent a 1.2% increase in total frequencies. This gives a low end noise rating of 268.
A route is then scored as follows:
• 0 – if its noise rating is higher than 871;
• 1 – if its noise rating is less than 871 but greater than 671;
• 2 – if its noise rating is less than 671 but greater than 469;
• 3 – if its noise rating is less than 469 but greater than 268;
• 4 – if its noise rating is less than 268.
49

York Aviation
Overview & Indicators Local Air Quality
As described above, there are substantial difficulties in developing an effective measure to reflect the air quality impact of a new route. However, clearly the issue is of importance.
We have therefore defined a simple measure based on the aircraft type to be used. The NOX rating for the aircraft’s LTO cycle is derived from the CORINAIR database and acts as proxy for its air quality impact. This is scored on a range based on the highest NOX emitting aircraft likely to be used from a Scottish airport, which is assumed to be a Boeing 747-400, and a typical modern short haul aircraft, assumed to be a Boeing 737-800. This is then converted to a score of between 0 and 4 to be consistent with the other indicators as follows:
• 0 – if its NOX rating is higher than 45;
• 1 – if its NOX rating is less than 45 but greater than 32;
• 2 – if its NOX rating is less than 32 but greater than 20;
• 3 – if its NOX rating is less than 20 but greater than 8;
• 4 – if its NOX rating is less than 8.
50

York Aviation
10. Risk Assessment
51

York Aviation
Risk Assessment Recent appraisal guidance has emphasised that the risks to the
delivery of the identified economic benefits should be considered as part of the appraisal process. Clearly, this is sensible. For instance, if a route proposal offers potentially very high economic benefits but for a variety of reasons the chances of the route actually delivering these benefits are low, then clearly decision makers need to be aware of this trade-off.
Ideally, guidance suggests risks should be reflected in some form of risk weight that can be applied to monetised and/or quantified benefits. However, following discussions with stakeholders our view that is that this is impractical in this case for a number of reasons:
• there are substantial risks in relation to the start up of any air route and seeking to reflect all of these in a risk weight would be both difficult and potentially introduce a significant degree of spurious accuracy;
• the data available from which to make an assessment of either the route economics or the financial health of the airline as a whole is highly limited;
• airline decision making is highly complex and includes the consideration of the allocation of scarce resources between markets, some of which are not even known to the appraiser.
For these reasons a short qualitative assessment of risk is more appropriate, focussing on areas such as:
• strength of forecast demand and route economics;
• airline financials, previous behaviour and reputation;
• potential impacts on other routes, airports and airlines.
A route proposition is then ranked as either high, medium or low risk.
52

York Aviation
11. Decision Making with the Appraisal Framework
53

York Aviation
Decision Making with the Appraisal Framework The Appraisal Framework set out within this Technical Report
provides a detailed overview of the potential socio-economic effects of a route proposition. It presents evidence across a range of issues and indicates whether a route’s performance is in broad terms either good or bad. The results are presented in individual route reports. It does not, however, and is not intended to, define a decision making process for stakeholders to follow. It does not decide whether a route passes or fails the appraisal and we do not believe that it is appropriate for it to do so.
The decision as to whether a route should be supported is not simple and is not mechanistic. Circumstances and priorities change constantly. The right decision one day is not necessarily the right decision the next. An appraisal framework or process that ties decision makers to particular decision criteria or pass/fail scores will always struggle to keep up with the changing dynamics of the market in which stakeholders are operating. What is required is a process that gives confidence to all involved, including Scotland’s airports and potential airline customers, that appropriate and fair decisions will be made on a consistent basis. This is what the defined Appraisal Framework offers.
The Appraisal Framework sets out in a clear fashion the parameters and the evidence base upon which decisions will be made and presents this evidence on a consistent basis. It does not seek to place particular weight on any single element within the Framework or say that one result is more important than another. This is an issue best weighed up by those making the decision at a given point in time.
This approach does, however, mean that a forum for making decisions with representation from the relevant public sector stakeholders is required. Such a forum needs a full understanding of the appraisal framework and therefore the meanings of the results presented and needs to appropriately document its decisions, including the reasoning for the decision based on the appraisal information presented. This will be particularly important in the future should a mechanism for providing financial support be found. On this basis there may be some argument for the inclusion of independent expert support on the forum to assist members in interpreting results. This support should focus particularly on:
• bringing specialised air transport knowledge to the process, focussing mainly around interpreting the level of risk associated with any proposal, particularly in relation to demand forecasts;
• considering the interplay between different elements within the Framework and levels of expectation in relation to particular routes or options.
54

York Aviation
12. Recommendations for Future Development
55

York Aviation
Recommendations for Future Development Our recommendations for the future development of the
economic appraisal framework can be broadly divided in to two areas:
• improvements to the indicators defined and the mechanics of the appraisal;
• improvements to the calibration of the appraisal framework.
In relation to the first point, there are a number of issues that require further development:
• passenger demand forecasts are currently being prepared on a route by route basis using a market intelligence and judgement based approach. Ultimately, if a significant number of routes are to be considered there may be an argument for the development of a Scotland specific route forecasting passenger allocation model that can statistically model competitive interactions and give greater confidence as to the impacts of new routes on other services;
• there is also an argument to suggest that the appraisals should be undertaken using independent demand forecasts separate from those produced as part of any route development activities. During the development of the UK wide guidance on the appraisal of route development funds, the Department for Transport became concerned as regards the potential for a form of optimism bias in demand forecasts prepared by those directly involved in route negotiation. The final guidance produced therefore recommended that separate forecasts be used for appraisal. This is potentially important in testing the validity of the forecasts and ensuring that benefits can actually be delivered;
• some further consideration should be given to the identification of air fares for the TEE appraisal. This is a key metric and while web searches should give a reasonable ‘feel’, more flexible access to MIDT data using systems such as AirportIS or ADI could allow detailed analysis for the appraisal process;
• if an appropriate mechanism can be found for delivering financial support, then there is a strong case for including Benefit Cost Ratios (BCRs) in the outputs from the TEE appraisal in addition to the NPVs specified already. These would enable a greater focus on value for money from public sector funding;
• further consideration and potentially research in to the impact of new routes on inbound visitor trip length is also a potential area for future development which would ultimately enable a better assessment of the inbound tourism impact of a route to be made;
• the information base on which a number of the main indicators are based changes all the time, most obviously the airport schedules that help to define the BCI and other connectivity based analysis. This base data for these indicators will need to be updated on a regular basis.
The initial process of calibration has defined a basic scale for each of the scored indicators and the test appraisals suggest that these deliver reasonable results. However, as more routes are tested and a better understanding is developed of what constitutes either good or bad for any given indicator it would seem sensible to revisit the calibration to ensure that it is producing rational results.
56

York Aviation
Appendix A: References
57

York Aviation
References The Economic and Social Benefits of Air Transport 2008 – Air Transport Action Group (2008)
The Social and Economic Impact of Air Transport in Europe – York Aviation for ACI EUROPE (2004)
Aviation’s Contribution to the UK Economy – Oxford Economics Forecasting (2006)
Evaluation of the Scottish Air Route Development Fund – Scott Wilson Kirkpatrick for Scottish Enterprise, Scottish Government, VisitScotland and Highlands & Islands Enterprise (2009)
Social Benefits of Low Fares Airlines in Europe – York Aviation for the European Low Fares Airline Association (2007)
No Frills Carriers: Revolution or Evolution? – Civil Aviation Authority CAP770 (2006)
Connecting for growth: the role of Britain’s hub airport in economic recovery – Frontier Economics (2011)
The Importance of Transport in Business’ Location Decisions - The Transport Research Institute and Employment Research Institute at Napier University, Edinburgh (2003)
Economic Benefits from Air Transport in the UK – Oxford Economics (2011)
The Economic Impact of Edinburgh Airport – York Aviation for Scottish Enterprise and BAA Edinburgh (2009)
Glasgow Economic Impact Assessment – York Aviation for BAA Glasgow and partners (2010)
The Economic Impact of Aberdeen Airport – York Aviation for BAA Aberdeen (2010)
Scottish Transport Appraisal Guidance – Transport Scotland (2008)
Transport Analysis Guidance – WebTAG – Department for Transport
CAA Passenger Survey 2009 – Civil Aviation Authority (2010)
Additionality & Economic Impact Assessment – Scottish Enterprise (2008)
Development of an Appraisal Framework for Route Development Funds in the UK – York Aviation for the Department for Transport (2003)
Interim Route Development Fund: Economic Appraisal Framework (Main Report) – York Aviation for Highlands & Islands Enterprise, Scottish Enterprise and Scottish Executive (2003)
Carbon Valuation in UK Policy Appraisal – Department for Energy and Climate Change (2009)
The World According to GaWC 2010 (GaWC Research Bulletin No. 369) – PJ Taylor, M Hoyler, K Pain & S Vinciguerra (2011)
58