appraisal of real property report 202121 prepared for
TRANSCRIPT

APPRAISAL OF REAL PROPERTY
Valuation & Cost Studies on a
Multifamily Residential Site
Located at 1174-1185 Hillsboro Mile in
Hillsboro Beach, Broward County, Florida
Report 202121
PREPARED FOR
Mr. Mac Serda, ICMA-CM
Town Manager
The Town of Hillsboro Beach, Florida
1210 Hillsboro Mile
Hillsboro Beach, FL 33062
PREPARED BY
Atlantic Blue Consulting, Inc.
2000 North Bayshore Dr. #1103
Miami, Florida 33137
Phone: (305) 776-6131

ATLANTIC BLUE CONSULTING, INC. REAL ESTATE ADVISORY & VALUATION SERVICES
2000 NORTH BAYSHORE DR. #1103, MIAMI, FLORIDA 33137 PHONE (305) 776-6131
August 27, 2021
Mr. Mac Serda, ICMA-CM
Town Manager
The Town of Hillsboro Beach
1120 Hillsboro Mile
Hillsboro Beach, FL 33062
Re: Appraisal of Real Property
Valuation and Cost Studies on a Multifamily Residential Site
Located on 11.768 acres at
1174-1185 Hillsboro Mile in
Hillsboro Beach, Broward County, Florida
Dear Mr. Serda:
At your request, an appraisal of the Fee Simple interest in the above-referenced real property has been
completed, considering two potential development scenarios outlined in the table below:
High-Rise Scenario: Estimating the Prospective (Hypothetical) Market Value of the subject property, if
developed according to plans for the property by Arquitectonica (ARQ) dated July 29, 2021; they include a
proposed 15-story high-rise residential condominium development located to the east of Hillsboro Mile/State
Road A1A (SR A1A), with 112 total residential units, ground floor lobby and amenity spaces, and a
subterranean garage, plus nine proposed two-story residential units in detached “villas” each with a two car
garage, plus an “amenity” building with 9,294 square feet, located to the west of SR A1A and overlooking the
Intracoastal Waterway. This value would represent the Prospective (Hypothetical) Market Value if this
proposed development were completed as of the current valuation date.
Low-Rise Scenario: Estimating the Prospective Market Value of the subject property, if improved with a
multifamily residential development that is consistent with its highest and best use. This value would also
represent the Prospective Market Value of the property if this multifamily residential development were
complete as of the current valuation date. The highest and best use considers a development to the property
that is legally permissible (via zoning and other restrictions), physically possible based on an overview of the
site, and also represents a use that is financially feasible and maximizes the productivity (value) of the
property. Based on market conditions and the appraiser’s interpretation of the zoning code of the Town of
Hillsboro Beach, multifamily residential uses are allowed for development at the property, with a maximum
building coverage of 35% of the site area in three story buildings. Given the subject site’s size this allows for
a maximum gross building area of 538,263 square feet; with 10% to 15% of the gross building area used for
common elements, this leaves approximately 475,000 square feet of building area available for units’ living
space. The maximum density allows for up to 188 dwelling units to the property, providing for an average
unit size of 2,527 square feet under this Low-Rise Scenario.
The development costs for the project described in each of these two scenarios was also estimated as of the
current valuation date using the Marshall Valuation Service (Marshall), an authoritative guide for developing such
costs for buildings and other improvements. When the cost of the site is added to the total building and site costs
for development under each Scenario, the result can be compared to the estimated Prospective Market Value under
each of these Scenarios; the difference exhibits that potential entrepreneurial profit to a developer under each
Development Scenario.

ATLANTIC BLUE CONSULTING, INC. REAL ESTATE ADVISORY & VALUATION SERVICES
2000 NORTH BAYSHORE DR. #1103, MIAMI, FLORIDA 33137 PHONE (305) 776-6131
The reader should carefully consider that these estimates of value and cost are subject to the
Assumptions and Limiting Conditions, Extraordinary Assumptions and Hypothetical Conditions set forth
in this report. The intended use of the appraisal is for internal decision-making by you, the Client, in negotiations
with potential developers seeking development approvals for this property. No other use of this report is intended
by the appraiser.
A physical inspection of the subject property was conducted from Hillsboro Mile (State Road A1A) by the
undersigned on the effective (current) date of valuation. The accompanying report includes pertinent data secured
in an investigation, exhibits and the details of the processes used to arrive at the conclusions of value and cost. The
analyses have been prepared in accordance with the Uniform Standards of Professional Appraisal Practice
(USPAP) and the requirements of the Client, Mr. Mac Serda, Town Manager for the Town of Hillsboro Beach,
Florida.
As a result of the examination and study made herein by the appraiser, the estimates of Prospective
(Hypothetical) Market Values of the fee simple interest in the appraised property, and estimated costs from
Marshall, if completed under each of the Development Scenarios, and subject to economic conditions prevailing as
of August 8, 2021 (the current valuation date), are presented below, along with the development (building and site)
costs and land cost, and the resulting entrepreneurial profit:
Respectfully submitted,
ATLANTIC BLUE CONSULTING, INC.
J Guthrie Mlinar, MAI, SRA
President
Cert. Gen. RZ1916
Development Scenario High-Rise Low-Rise
Prospective Market Value If Completed $390,880,000 $276,120,000
Less Development Costs
Land Cost $30,000,000 $30,000,000
Building & Site Improvement Cost $255,460,000 $157,660,000
Total Development Cost $285,460,000 $187,660,000
Entrepreneurial Profit $105,420,000 $88,460,000
Profit as a Percentage of Total Costs 37% 47%

MULTIFAMILY RESIDENTIAL SITE, 1174-1185 HILLSBORO MILE, HILLSBORO BEACH, FL
202121 REPORT
ATLANTIC BLUE CONSULTING, INC. REAL ESTATE ADVISORY & VALUATION SERVICES
SUMMARY OF FACTS AND CONCLUSIONS
Property Type: Vacant multifamily residential development site
Location: Two parcels under the same ownership with a total of 11.768 acres
straddling either side of Hillsboro Mile/State Road A1A (SR A1A)
in the 1100 block of that roadway in the Town of Hillsboro Beach in
Broward County County, Florida.
Property Addresses: 1174-1185 Hillsboro Mile, Hillsboro Beach, Florida, 33062
Property Site Size (Gross)
Parcel A (Western Parcel): 234,316 square feet or 5.379acres
Parcel B (Eastern Parcel): 278,316 square feet or 6.389 acres
Total Subject Site Size: 512,632 square feet or 11.768 acres
Interest Appraised: Fee simple
Owner of Record: Hillsboro Mile Property Owner LLC

MULTIFAMILY RESIDENTIAL SITE, 1174-1185 HILLSBORO MILE, HILLSBORO BEACH, FL
202121 REPORT
ATLANTIC BLUE CONSULTING, INC. REAL ESTATE ADVISORY & VALUATION SERVICES
Summary of Facts and Conclusions (continued)
Purpose of the Appraisal: To estimate the property’s Prospective (Hypothetical) Market
Values If Completed under two proposed or potential Development
Scenarios, and to estimate the building, site and other costs to
construct each development as outlined in this report.
Client/Intended User: Mr. Mac Serda, Town Manager for the Town of Hillsboro Beach,
Florida (the Client)
Intended Use: For the Client’s for internal decision-making in negotiations with
potential developers seeking development approvals for this
property. No other use of this report is intended by the appraiser.
Real Estate Assessment & Taxes (2020):
Assessor’s Market Value: $35,300,000 (vacant land)
Assessed Value: $35,300,000
Total Taxes: $624,067.73
Date of Property Inspection: August 8, 2021
Effective (Current) Date of Valuation: August 8, 2021
Date of Report: August 27, 2021
Value & Cost Conclusions
Estimated Marketing Time: 12 months
Development Scenario High-Rise Low-Rise
Prospective Market Value If Completed $390,880,000 $276,120,000
Less Development Costs
Land Cost $30,000,000 $30,000,000
Building & Site Improvement Cost $255,460,000 $157,660,000
Total Development Cost $285,460,000 $187,660,000
Entrepreneurial Profit $105,420,000 $88,460,000
Profit as a Percentage of Total Costs 37% 47%

MULTIFAMILY RESIDENTIAL SITE, 1174-1185 HILLSBORO MILE, HILLSBORO BEACH, FL
202121 REPORT
ATLANTIC BLUE CONSULTING, INC. REAL ESTATE ADVISORY & VALUATION SERVICES
TABLE OF CONTENTS
CERTIFICATE ............................................................................................................................................... 1
ASSUMPTIONS AND LIMITING CONDITIONS ....................................................................................... 2
HYPOTHETICAL CONDITIONS ................................................................................................................. 3
EXTRAORDINARY ASSUMPTIONS........................................................................................................... 3
SECTION I INTRODUCTION ...................................................................................................................... 5
IDENTIFICATION OF THE PROPERTY ............................................................................................... 6 SCOPE OF WORK .................................................................................................................................. 6 DEFINITIONS OF VALUE AND INTEREST APPRAISED................................................................... 8 EXPOSURE TIME AND MARKETING PERIOD .................................................................................. 8 PROPERTY HISTORY ........................................................................................................................... 9 REGIONAL ANALYSIS ......................................................................................................................... 9 NEIGHBORHOOD ANALYSIS ............................................................................................................ 13
SECTION II DESCRIPTIVE DATA............................................................................................................ 16
CURRENT PROPERTY DESCRIPTION .............................................................................................. 17 ZONING ANALYSIS ............................................................................................................................ 20 PROPOSED PROPERTY DEVELOPMENT DESCRIPTIONS ............................................................. 20 PROPERTY TAXES AND ASSESSMENTS ......................................................................................... 26 HIGHEST AND BEST USE .................................................................................................................. 26
SECTION III VALUATION & COST ......................................................................................................... 30
VALUATION PROCESS ...................................................................................................................... 31 PROPERTY VALUATION ................................................................................................................... 31 COST ANALYSIS ................................................................................................................................. 53 POTENTIAL PROFIT ANALYSIS ....................................................................................................... 60
ADDENDA
Exhibit A Subject Property Photographs
Exhibit B Broward County Regional Analysis
Exhibit C High-Rise Scenario Architectural Plans
Exhibit D Engagement Letter
Exhibit E Appraiser’s Qualifications

MULTIFAMILY RESIDENTIAL SITE, 1174-1185 HILLSBORO MILE, HILLSBORO BEACH, FL
202121 REPORT
ATLANTIC BLUE CONSULTING, INC. CERTIFICATE
1
CERTIFICATE
The appraiser certifies that, to the best of his knowledge and belief,
the statements of fact contained in this report are true and correct.
the reported analyses, opinions, and conclusions are limited only by the reported assumptions and
limiting conditions, and are my personal, impartial, and unbiased professional analyses, opinions, and
conclusions.
I have no present or prospective interest in the property that is the subject of this report, and no
personal interest with respect to the parties involved.
I have not performed any other services, as an appraiser or in any other capacity, regarding the
property that is the subject of this report within the three-year period immediately preceding
acceptance of this assignment.
I have no bias with respect to the property that is the subject of this report or to the parties involved
with this assignment.
My engagement in this assignment was not contingent upon developing or reporting predetermined
results.
My compensation for completing this assignment is not contingent upon the development or reporting
of a predetermined value or direction in value that favors the cause of the client, the amount of the
value opinion, the attainment of a stipulated result, or the occurrence of a subsequent event directly
related to the intended use of this appraisal.
the reported analyses, opinions, and conclusions were developed, and this report has been prepared, in
conformity with the Uniform Standards of Professional Appraisal Practice (USPAP) of the Appraisal
Foundation, and the requirements of the Code of Professional Ethics and the Standards of Professional
Practice of the Appraisal Institute and with the requirements of the State of Florida for state-certified
appraisers.
the use of this report is subject to the requirements of the Appraisal Institute relating to review by its
duly authorized representatives.
J Guthrie Mlinar has made a personal inspection of the property that is the subject of this report.
no one provided significant real property appraisal assistance to the persons signing this certification.
the undersigned has completed the requirements of the continuing education program of the Appraisal
Institute.
ATLANTIC BLUE CONSULTING, INC.
J Guthrie Mlinar, MAI, SRA
President
Cert. Gen. RZ1916

MULTIFAMILY RESIDENTIAL SITE, 1174-1185 HILLSBORO MILE, HILLSBORO BEACH, FL
202121 REPORT
ATLANTIC BLUE CONSULTING, INC. ASSUMPTION AND LIMITING CONDITIONS
2
ASSUMPTIONS AND LIMITING CONDITIONS
The appraisal is subject to the following assumptions and limiting conditions:
1. No survey of the subject property was undertaken.
2. The subject property is free and clear of all liens except as herein described. No responsibility is assumed
by the appraisers for matters, which are of a legal nature, nor is any opinion on the title rendered herewith.
Good and marketable title is assumed.
3. The information contained herein has been gathered from sources deemed to be reliable, including
architectural plans, a site survey, and building sizes and dimensions, etc. No responsibility can be taken by
the appraiser for their accuracy. Correctness of estimates, opinions, dimensions, sketches and other exhibits
which have been furnished and have been used in this report are not guaranteed. The value estimate
rendered herein is considered reliable and valid only as of the date of the appraisal, due to rapid changes in
the external factors that can significantly affect the property value.
4. This study is to be used in whole and not in part. No part of it shall be used in conjunction with any other
appraisal. Publication of this report or any portion thereof without the written consent of the appraiser is
not permitted.
5. The appraiser herein, by reason of this report, is not required to give testimony in court with reference to
the property appraised unless notice and proper arrangements have been previously made therefore.
6. The value estimate assumes responsible ownership and competent management. The appraiser assumes no
responsibility for any hidden or in apparent conditions of the property, subsoil, or structures, which would
render it more or less valuable. No responsibility is assumed for engineering, which might be required to
discover such factors.
7. Neither all nor any part of the contents of this report shall be conveyed to the public through advertising,
public relations, news, sales or other media without the written consent and approval of the author,
particularly as to valuation conclusions, the identity of the appraisers or firm with which they are
connected, or any reference to the Appraisal Institute.
8. Any exhibits in the report are intended to assist the reader in visualizing the property and its surroundings.
The drawings are not intended as surveys and no responsibility is assumed for their cartographic accuracy.
Any drawings are not intended to be exact in size, scale, or detail. Areas and dimensions of the property
may or may not have been physically measured. If furnished by the principal or from plot plans or surveys
furnished by the principal, or from public records, it is assumed that they are reasonably accurate. No
responsibility is assumed for discrepancies, which may become evident from a licensed survey of the
property.
9. The Americans with Disabilities Act (ADA) became effective January 26, 1992 sets strict and specific
standards for handicapped access to and within most commercial and industrial buildings. Determination of
compliance with these standards is beyond appraisal expertise and, thus this compliance has not been
attempted by the appraisers. We recommend an architectural inspection of the property to determine
compliance or requirements for compliance. It is possible that a compliance survey of the property together
with a detailed analysis of the requirements of the ADA could reveal that the property is not in compliance
with one or more of the requirements of the act. If so, this fact could have a negative effect upon the value
of the property.
10. Information on the property, including its size and physical condition, were based on county tax records, a
personal inspection, aerial photographs and materials supplied by the Client and are assumed to be correct.
The property is assumed to be free of any adverse environmental conditions, but a Phase I environmental
assessment of the property is recommended by a professional engineer for proper determination.

MULTIFAMILY RESIDENTIAL SITE, 1174-1185 HILLSBORO MILE, HILLSBORO BEACH, FL
202121 REPORT
ATLANTIC BLUE CONSULTING, INC. ASSUMPTION AND LIMITING CONDITIONS
3
HYPOTHETICAL CONDITIONS
1. In the High-Rise Development Scenario outlined in this report, the property’s Prospective
Market Value and development costs are estimated for this project, if completed as of the
current valuation date. It includes a proposed 15-story high-rise residential condominium
development located to the east of Hillsboro Mile/State Road A1A (SR A1A), with 112 total
residential units, ground floor lobby and amenity spaces, and a subterranean garage. Zoning
of the subject property currently does not permit development of more than three stories, thus
it is a Hypothetical Condition that this high-rise development can be allowed at this location
under this Development Scenario.
2. The subject property is within “The Enclave at Hillsboro Beach” plat as recorded in Plat Book
154, Page 31 of the Broward County records. A restrictive plat note found on page 2 of this
plat states that “This plat is restricted to 6 detached single-family homes on Parcel A, and 6
detached single-family homes on Parcel B”. This effectively limits the subject property’s
development to 12 single-family homes. This deed restriction can be amended by approval of
the Broward County Board of County Commissioners. For the purposes of this valuation and
cost study, it is also a Hypothetical Condition that this deed restriction has been removed,
allowing for the proposed or potential development outlined in each of the two Development
Scenarios set for this report.
The reader should note that if either or both of these Hypothetical Conditions were to
change or not occur, the value and cost estimates presented herein under each Development
Scenario may significantly change.
EXTRAORDINARY ASSUMPTIONS
1. In the Low-Rise Development Scenario outlined for the subject property in this report, this
Development Scenario assumes that the subject property would be appraised at its highest
and best use. This highest and best use considers a development to the property that is legally
permissible (via zoning), physically possible based on an overview of the site, and also
represents a use that is financially feasible and maximizes the productivity (value) of the
property. Based on market conditions and the appraiser’s interpretation of the zoning code of
the Town of Hillsboro Beach, multifamily residential uses are allowed for development at the
property, with a maximum building coverage of 35% of the site area in buildings of up to
three stories in height. Given the subject site’s size, it is an Extraordinary Assumption that
this allows for a maximum gross building area of 538,263 square feet; with 10% to 15% of
the gross building area used for common elements, this leaves approximately 475,000 square
feet of building area available for units’ living space. The maximum density allows for up to
188 dwelling units to the property, providing for an average unit size of 2,527 square feet
under this Low-Rise Scenario.
2. In both Development Scenarios, a luxury multifamily residential condominium development
would occur. With average unit pricing that is estimated to be from over $1,700,000 to over
$3,700,000 (depending on which Scenario is considered), this would promulgate the highest
quality of interior and exterior finish the proposed development under either scenario. Thus,

MULTIFAMILY RESIDENTIAL SITE, 1174-1185 HILLSBORO MILE, HILLSBORO BEACH, FL
202121 REPORT
ATLANTIC BLUE CONSULTING, INC. ASSUMPTION AND LIMITING CONDITIONS
4
it is an Extraordinary Assumption that the proposed multifamily residential development
under both Development Scenarios presented in this report would have ultra-luxury interior
and exterior furnishings commensurate with those at the newest nearby luxury condominium
developments in Broward and southern Palm Beach County cited as comparable properties in
the Valuation section of this report.
The removal of either of these Extraordinary Assumptions may have a significant effect on the
value and cost estimates provided in this report.

MULTIFAMILY RESIDENTIAL SITE, 1174-1185 HILLSBORO MILE, HILLSBORO BEACH, FL
202121 REPORT
ATLANTIC BLUE CONSULTING, INC. SECTION I INTRODUCTION 5
SECTION I INTRODUCTION

MULTIFAMILY RESIDENTIAL SITE, 1174-1185 HILLSBORO MILE, HILLSBORO BEACH, FL
202121 REPORT
ATLANTIC BLUE CONSULTING, INC. SECTION I INTRODUCTION
6
IDENTIFICATION OF THE PROPERTY
The subject of this report contains 11.768 acres of vacant land on two parcels that
straddle either side of Hillsboro Mile/State Road A1A in the 1100 block of that roadway in
Hillsboro Beach, Broward County, Florida. Parcel A is located between SR A1A and the
Intracoastal Waterway, and has 5.379 acres of land. Parcel B of the has 6.111 acres situated
between SR A1A and the Atlantic Ocean beach. These parcels are identified by the Broward
County Property Appraiser on 12 separate tax folios summarized below:
The street addresses of this property are 1174-1185 Hillsboro Mile, Hillsboro Beach,
Florida, 33062.
SCOPE OF WORK
The Uniform Standards of Professional Appraisal Practice (USPAP) define the scope of
the work as the type and extent of research and analysis in an assignment. The scope of this
analysis was to inspect the property, consider market characteristics and trends, collect and
analyze pertinent data, develop conclusions and estimates of the property's market value under
two Development Scenarios, and write a report that presents these findings to the Client.
The assignment includes consideration of the traditional approaches to value. However,
the Prospective Market Values of the subject property, if completed with the potential or
proposed Development Scenarios cited herein, require the estimate of the net present value of
the sellout of the individual residential condominium units that would be present. This is
effectively the Subdivision Development Method of estimating market value; and includes
methodology from both the Sales Comparison and Income Approaches to value.

MULTIFAMILY RESIDENTIAL SITE, 1174-1185 HILLSBORO MILE, HILLSBORO BEACH, FL
202121 REPORT
ATLANTIC BLUE CONSULTING, INC. SECTION I INTRODUCTION
7
In the Sales Development Method, a sales comparison analysis is undertaken to estimate
the “retail” value of each individual condo unit. It uses comparable sales in an analysis using
the methodology from the Sales Comparison Approach to estimate these values. These
comparable property sales are researched from the market and their prices are analyzed against
the subject units. A sellout or absorption period for disposition of the units is estimated from
recent trends at this location in the market. Closing costs from the sale of units are deducted
from the revenues from unit sales, along with holding costs including taxes, marketing costs,
etc. for the remaining unsold units during the sellout period. Risk is deducted from the net
proceeds after these costs are considered, providing for a net cash flow from unit sales.
As this sellout period is anticipated to occur over several periods, these net cash flows
must be discounted to present value. Discount rates (internal rates of return) were obtained from
analyzing their risk relative to that incorporated in the subject’s sellout. An appropriate discount
rate was selected for application to the sellout of the subject units to provide for a result net
present (market) values, if completed under each of the two Development Scenarios.
The primary source of development (building, site and indirect) costs for the project
outlined in each Scenario was the Marshall Valuation Service, an authoritative guide for
developing such costs for buildings and other improvements. Other ancillary costs were
obtained from market sources. When the cost of the land is added to each total, the result can be
compared to the estimated Prospective Market Value If Completed under each Development
Scenario; the difference exhibits that potential entrepreneurial profit to a developer under each
Development Scenario.
This report was produced in a manner that presents the pertinent data, which has been
collected and analyzed. It is the written result of the appraiser’s findings and analyses in
developing a conclusion about the property's market values and costs under each Development
Scenario and presents the appraiser’s reasoning in a manner intended to comply with the
Client’s requirements.

MULTIFAMILY RESIDENTIAL SITE, 1174-1185 HILLSBORO MILE, HILLSBORO BEACH, FL
202121 REPORT
ATLANTIC BLUE CONSULTING, INC. SECTION I INTRODUCTION
8
DEFINITIONS OF VALUE AND INTEREST APPRAISED
According to the Code of Federal Regulations, Title XI of the Financial Institutions
Reform, Recovery and Enforcement Act of 1989 (“FIRREA”), market value is defined as
follows:
Market Value
The most probable price, which a property should bring in competitive and open market under
all conditions requisite to a fair sale, the buyer and seller each acting prudently and
knowledgeably, and assuming the price is not affected by undue stimulus. Implicit in this
definition is the consummation of a sale as of a specified date and the passing of title from seller
to buyer under conditions whereby:
1. Buyer and seller are typically motivated.
2. Both parties are well informed or well advised, and acting in what they consider their own best
interests;
3. A reasonable time is allowed for exposure on the open market.
4. Payment is made in terms of cash in U.S. dollars or in terms of financial arrangements
comparable thereto; and
5. The price represents a normal consideration for the property sold unaffected by special or
creative financing or sales concessions granted by anyone associated with the sale.
Fee Simple Interest
Absolute ownership unencumbered by any other interest or estate, subject only to the limitations
imposed governmental powers of taxation, eminent domain, police power, and escheat.
Source: Appraisal Institute, The Dictionary of Real Estate Appraisal, 5th Edition, (Chicago, 2010)
EXPOSURE TIME AND MARKETING PERIOD
Exposure time is that time the property is assumed to have been on the market before the
assumption of a sale on the date of appraisal. Marketing time is that time, at any price, that the
property would take to sell from the date of appraisal forward, i.e., after the date of appraisal.
The relationship between price and marketing time is straightforward and normally, the lower
the price, the less time to market. With a reasonable listing price and aggressive marketing, it is
the appraiser’s opinion that the subject’s exposure and marketing times would both be no more
than twelve months.

MULTIFAMILY RESIDENTIAL SITE, 1174-1185 HILLSBORO MILE, HILLSBORO BEACH, FL
202121 REPORT
ATLANTIC BLUE CONSULTING, INC. SECTION I INTRODUCTION
9
PROPERTY HISTORY
On December 21, 2016, the subject property was acquired by Dezer Hillsboro, LLC
from Enclave at Hillsboro, LLC, for a price of $28.5 million. Media reports at the time of the
sale indicate that the buyer purchased the sale after gaining court approval for the sale as the
seller had previously experienced some financial difficulties. Four years later, or on
December 4, 2020, Dezer Hillsboro, LLC sold the subject to Hillsboro Mile Property Owner,
LLC, for a price of $30 million. The address of the buyer in the 2020 sale of the property
matches the corporate office address for The Related Group, a local developer. It is the
appraiser’s understanding that this was not a true “arm’s-length” sale of the property as
Related and Dezer are planning a development of the subject property.
No other sales or transfers of the subject property have occurred during the past five
years, and the subject has not be offered for sale or placed under contract during that period.
REGIONAL ANALYSIS
The subject property is located in the Town of Hillsboro Beach, which is located on the
barrier island between the Atlantic Ocean and the Intracoastal Waterway in northern Broward
County, Florida, north of the Hillsboro Inlet waterway. Broward County is the central and
second-most populous of a tri-county region (South Florida) whose population surpassed 6.2
million persons in 2019. A summary analysis of the economic and other trends affecting this
regional market is included in the Addenda of this report. Some of the data regarding the
Coronavirus Pandemic that began affecting the U.S. medically, economically and socially in
March 2020 is not yet available or fully complete.

MULTIFAMILY RESIDENTIAL SITE, 1174-1185 HILLSBORO MILE, HILLSBORO BEACH, FL
202121 REPORT
ATLANTIC BLUE CONSULTING, INC. SECTION I INTRODUCTION
10
Impact of the Coronavirus Pandemic
The Coronavirus first appeared in China in early December 2019 and subsequently
spread worldwide into a pandemic by March 2020. The first U.S. case was recorded in
Washington state on January 21, 2020, and the virus has since spread to all 50 states. As of
April 8, 2020, more than 400,000 cases had been reported in the U.S., a number that had
increased to more than 2.3 million cases by late June 2020. While the mortality rate from
infection is relatively low in the U.S. (less than 2% to 3% of all cases), it has spread very
quickly and requires hospitalization for treatment of the Covid-19 disease it produces for 5% to
20% of all cases, threatening to overwhelm health care delivery systems across the country.
As a result, state and local governments closed schools and many businesses throughout
the country in an effort to control the spread of the Coronavirus. In Broward County, schools,
restaurants and bars were closed in mid-March 2020, although restaurants were allowed to
continue with take-out and delivery services. As of March 25, 2020, all non-essential

MULTIFAMILY RESIDENTIAL SITE, 1174-1185 HILLSBORO MILE, HILLSBORO BEACH, FL
202121 REPORT
ATLANTIC BLUE CONSULTING, INC. SECTION I INTRODUCTION
11
businesses in the county were closed with residents urged to stay at home. The Federal
Government passed the first of two Pandemic relief acts providing $350 billion in federally-
guaranteed loans for small businesses.
Beyond the adverse public health aspects of this pandemic, the closure of businesses and
“stay-at-home” restrictions brought economic and other activities in Broward County and
throughout much of the U.S. to a virtual halt. While food and drug stores were allowed to
remain open, other “non-essential” businesses have closed and shed or furloughed employees
under these stay-at-home restrictions. In the first full week of April 2020 more than 15 million
Americans filed for unemployment; by June 2020 more than 45 million Americans had applied
for unemployment claims with an unemployment rate of more than 13%.
By May 2020, the stay-at-home orders and closing of non-essential businesses appeared
to be working to lower the increase in new cases particularly in heavily-hit locations particularly
in larger metropolitan areas. There were just over 1,500 new daily Coronavirus cases in Florida
in early April 2020. With shut-downs and “stay-at-home” orders, this number fell to less than
half that number of new daily cases by June 1st. This “flattening of the curve” of new cases
induced governments to plan for a re-opening of non-essential businesses in a phased approach;
this plan was made by some authorities despite not meeting CDC guidelines that are
recommended to be in place for a safe re-opening of these businesses. Various municipalities
and other governments began a first phase of re-opening in May 2020, allowing certain non-
essential businesses to reopen but under strict capacity and safety rules in place. Restaurants,
barber shops, salons and retailers were allowed to open under these circumstances.
The re-opening of restaurants and other businesses in Broward County and other parts of
Florida resulted in some complacency among government officials who may be re-opening their
economies in haste; this has also resulted in similar complacency among some members of the
general public and some businesses who have relaxed social distancing measures and the
wearing of protective masks and other advised precautions that are urged by health officials for
persons venturing out in public. Under these conditions, an unfortunate uptick in the number of
daily new Coronavirus cases began to occur. Additional testing capacity for the Coronavirus,
and the effects of some less responsible re-openings and personal behavior among some

MULTIFAMILY RESIDENTIAL SITE, 1174-1185 HILLSBORO MILE, HILLSBORO BEACH, FL
202121 REPORT
ATLANTIC BLUE CONSULTING, INC. SECTION I INTRODUCTION
12
residents and governmental officials, led to a sharp uptick in the number of new daily reported
cases of this virus, reaching more than 13,000 statewide in mid-July 2020.
A second surge in new cases nationwide peaked at 67,000 in August 2020 before falling
to less than half that total in early September. The next month, however, a new surge in cases
began to appear across the U.S., bumping this figure up to almost 100,000 new cases daily with
every state reporting an increase. By December 2020, the new case totals continued to climb to
more than 180,000 per day. At that time, more than 16 million cases of Coronavirus had been
recorded nationwide, with the death toll from the Covid-19 disease it creates approaching
300,000. To date (July 2021), more than 600,000 American have died from Covid-19.
Despite these unfortunate numbers, many governmental officials continued to relax
restrictions that were put in place to combat the virus’s spread, including increased indoor
dining capacity, re-opening some entertainment venues. However, some officials and many in
the general public questioned whether or not this re-opening was done in haste. This caused
some potential patrons to become fearful of going out to stores, restaurants and businesses.
However, two vaccines by Pfizer and Moderna were produced in December 2020 to
combat the Coronavirus and Covid-19. The first immunization in the U.S. occurred on
December 14, 2020, with a roll-out of the vaccines introduced in stages. The first priority was
given to health care workers and others on the “front lines” combating the disease and first
responders. A third vaccine by Johnson & Johnson was introduced in March 2021. The
accelerating rate of vaccinations in Broward County allowed officials to announce that vaccines
for those 65 and older were available early that month, with additional age groups following.
By early April 2021, all Broward County residents 16 and older were eligible to receive the
vaccine, with testing providing for vaccines that were made available to those aged 12 to 15
rolled out in May 2021.
By August 2021 more than half of Floridians and 53% of Broward County residents had
been fully vaccinated (the Pfizer and Moderna vaccines require two doses), and more than half
of the county’s residents had received at least one dose. In mid-May 2021, the CDC relaxed its
guidelines stating that all Americans who have been fully vaccinated could resume their normal,
pre-Pandemic activities without wearing a facial mask or practicing social distancing; a “fully-

MULTIFAMILY RESIDENTIAL SITE, 1174-1185 HILLSBORO MILE, HILLSBORO BEACH, FL
202121 REPORT
ATLANTIC BLUE CONSULTING, INC. SECTION I INTRODUCTION
13
vaccinated” individual is anyone who received their final dose of the vaccine and allowed two
weeks to pass in order to maximize the vaccine’s efficacy.
Unfortunately, there is a sizeable proportion of the population that is resisting
vaccinations but have resumed normal activities. This has caused a new surge in Covid-19
cases since July 2021 at levels not seen for six months. Hospitals are once again filling up, this
time with those unvaccinated individuals who have contracted the disease with a larger
proportion of patients now falling between 20 and 45 years old.
In conclusion, employment and income growth continued in Broward County through
2019 after the recovery from the effects of the Great Recession from 2008-2010, with rising
visitation in this popular tourist destination. This fueled demand for different types of real estate
in this market including residential, commercial, industrial and hospitality. However, the
outbreak of the Coronavirus Pandemic in March 2020 caused a severe retreat in the previously-
occurring economic activity in the region. Businesses were forced to close through May of that
year, causing a sharp rise in unemployment. Most business activity has been allowed to resume,
providing for a reduction in unemployment but this is sometimes at limited levels and
vaccination resistance among some people and a sharp rise in new cases has resumed since July
2021, filling hospitals once again with some in the general public once again limiting their
activities in the near term. While the county’s underlying economic fundamentals and
infrastructure have a solid base, a full recovery is not expected until the underlying adverse
effects on the social, health and economic caused by the Pandemic can be resolved.
NEIGHBORHOOD ANALYSIS
According to the Appraisal of Real Estate, 13th Edition, a neighborhood is a group of
complimentary land uses. Social, economic, governmental and environmental forces influence
property values in the vicinity of the subject property, which, in turn, directly affect the value of
the subject property itself. The area of influence is the area within which the forces affect all
surrounding properties in the same way. The boundaries of the neighborhood are drawn by
observing the extent to which the four forces affect all properties in the same way.

MULTIFAMILY RESIDENTIAL SITE, 1174-1185 HILLSBORO MILE, HILLSBORO BEACH, FL
202121 REPORT
ATLANTIC BLUE CONSULTING, INC. SECTION I INTRODUCTION
14
The subject is located in the Town of Hillsboro Beach in northern Broward County.
Hillsboro Beach is solely located on the barrier island between the Atlantic Ocean and the
Intracoastal Waterway north of the Hillsboro Inlet waterway across from beachfront areas of
Pompano Beach to the south, and south of beachfront areas of Deerfield Beach to the north. It
has a population of approximately 2,000 with a single roadway, Hillsboro Mile/State Road A1A
(SR A1A) running along the spine of this narrow stretch of barrier island. State Road A1A runs
through beachfront communities in Broward, Miami-Dade and Palm Beach Counties, and it
connects to East Hillsboro Boulevard in Deerfield Beach to the north and East Atlantic Avenue
to the south in Pompano Beach. Both East Hillsboro Boulevard and East Atlantic Avenue cross
the Intracoastal Waterway for connections to U.S. Highway 1 and Interstate 95 to the west on
mainland areas of Broward County.
Most land uses in Hillsboro Beach are single- and multifamily residential, with a few
resort (small hotel and private club) and recreational uses also included. Through its zoning
restrictions, the Town of Hillsboro Beach has sought to limit building heights in order to avoid
the development of high-rise “condo canyons” of buildings found along the oceanfront in

MULTIFAMILY RESIDENTIAL SITE, 1174-1185 HILLSBORO MILE, HILLSBORO BEACH, FL
202121 REPORT
ATLANTIC BLUE CONSULTING, INC. SECTION I INTRODUCTION
15
Pompano Beach, Fort Lauderdale, and areas of Miami-Dade County to the south. The highest
multifamily residential development density allowed in Hillsboro Beach in 32 units per acre.
Development in Hillsboro Beach primarily occurred from the 1940s through the early 1970s,
but with some infill and redevelopment activity occurring since 2000. Single-family homes in
this market may carry price tags with eight figures, particularly for newer mansions that have
replaced some of the older single-family homes that were originally built in this market. The
estimated median household income in Hillsboro Beach in 2019 was $75,973, or more than
$16,000 greater than the statewide figure. However, the median resident age in Hillsboro Beach
was 67.4 years or 25 years greater than the statewide median, indicating a large number or
retired residents and/or senior citizens.
There are no supporting commercial/retail uses in Hillsboro Beach, but such uses can be
found along East Hillsboro Boulevard in Deerfield Beach to the north and areas along East
Atlantic Avenue in Pompano Beach to the south.
In conclusion, Hillsboro Beach is an affluent residential oceanfront community on the
barrier island of northern Broward County. Although it has been primarily built out since the
1970s, new infill and redevelopment activity continues to occur due to its attractive oceanfront
location. These are favorable long-term trends for development and investment activity in this
market.
MULTIFAMILY RESIDENTIAL SITE, 1174-1185 HILLSBORO MILE, HILLSBORO BEACH, FL
202121 REPORT
ATLANTIC BLUE CONSULTING, INC. SECTION II DESCRIPTIVE DATA
16
SECTION II DESCRIPTIVE DATA

MULTIFAMILY RESIDENTIAL SITE, 1174-1185 HILLSBORO MILE, HILLSBORO BEACH, FL
202121 REPORT
ATLANTIC BLUE CONSULTING, INC. SECTION II DESCRIPTIVE DATA
17
CURRENT PROPERTY DESCRIPTION
The subject property includes vacant two parcels (A and B) of land straddling either
site of Hillsboro Mile/State Road A1A (SR A1A) in Hillsboro Beach. Parcel A is located to
the west of SR A1A and fronts to the Intracoastal Waterway to the west, while Parcel B is
located east of SR A1A and has frontage to the Atlantic Ocean beach to the east. Details of
each of these two parcels, and that for the composite subject property, are presented in the
tables below:
Parcel A
Parcel B
Gross Site Area - Sq.Ft. 234,316
Gross Site Area - Acres 5.379
Net/Upland Site Area - Sq.Ft. 222,214
Net/Upland Site Area - Acres 5.101
Primary Street Frontage State Road A1A/Hillsboro Mile
Water Frontage Intracoastal Waterway
Adjacent Land Uses - North Low-rise residential condominiums
Adjacent Land Uses - South Low-rise residential condominiums
Adjacent Land Uses - East State Road A1A/Hillsboro Mile
Adjacent Land Uses - West Intracoastal Waterway
Physical Characteristics - Western Intracoastal Frontage Parcel (A)
Source: Site inspection, survey
Gross Site Area - Sq.Ft. 278,316
Gross Site Area - Acres 6.389
Net/Upland Site Area - Sq.Ft. 266,214
Net/Upland Site Area - Acres 6.111
Primary Street Frontage State Road A1A/Hillsboro Mile
Water Frontage Atlantic Ocean
Adjacent Land Uses - North Low-rise residential condominiums
Adjacent Land Uses - South Low-rise residential condominiums
Adjacent Land Uses - East Atlantic Ocean beach
Adjacent Land Uses - West State Road A1A/Hillsboro Mile
Physical Characteristics - Eastern O ceanfront Parcel (B)
Source: Site inspection, survey

MULTIFAMILY RESIDENTIAL SITE, 1174-1185 HILLSBORO MILE, HILLSBORO BEACH, FL
202121 REPORT
ATLANTIC BLUE CONSULTING, INC. SECTION II DESCRIPTIVE DATA
18
Composite Subject Property
The survey used in obtaining site sizes and other information on the subject property
is from an ALTA land title survey by Schwebke Shiskin & Associates dated July 14, 2021,
and is assumed to be accurate. There were no significant easements or encroachments
exhibited on the parcels that would substantially limit development of the property. The
Coastal Construction Line runs north/south through Parcel B approximately 196 to 210 feet
east of the right-of-way for SR A1A. The Easterly Building Line from Map Book 2, Page 46
of the Broward County records, also runs north/south approximately 95 feet east of the
Coastal Construction Line (CCL). The CCL is not a building setback line but special
permission is required to development seaward of the CCL from the Florida Department of
Environmental Protection. In general, development seaward of the CCL may be granted if
other nearby buildings also encroach past the CCL (but not in all circumstances).
Gross Site Area - Sq.Ft. 512,632
Gross Site Area - Acres 11.768
Net/Upland Site Area - Sq.Ft. 488,428
Net/Upland Site Area - Acres 11.213
Zoning Classification RM-16
Zoning Authority Town of Hillsboro Beach
Adjacent Land Uses - North Low-rise residential condominiums
Adjacent Land Uses - South Low-rise residential condominiums
Adjacent Land Uses - East Atlantic Ocean
Adjacent Land Uses - West Intracoastal Waterway
Flood Panel Map: 12011C0187H
Panel Map Date: August 18, 2014
Flood Zone: AE & VE
Flood Area Description: Special flood hazard areas, elevation 5 to 12 feet
Utilities Provider
Water/Sewer Hillsboro Beach Water Dept.
Electricity Florida Power & Light
Natural Gas People's Gas
Telecommunications Private contractor
Trash Removal Private contractor
Topography At road grade
Vehicular Access At abutting roadway
Drainage Appeared adequate
Easements None noted; see comments below
Encroachments None noted; see comments below
Deed Restrictions None noted; see comments below
Source: Site inspection, FEMA, survey, Town of Hillsboro Beach, Broward County
Comparative Features
Physical Characteristics - Composite Subject Site

MULTIFAMILY RESIDENTIAL SITE, 1174-1185 HILLSBORO MILE, HILLSBORO BEACH, FL
202121 REPORT
ATLANTIC BLUE CONSULTING, INC. SECTION II DESCRIPTIVE DATA
19
A 1993 agreement with Broward County created a conservation area on Parcel B
nearest the Atlantic Ocean comprising 102,526 square feet of land (subject to increased
building height approval). This limits the developable area of Parcel B to 175,790 square
feet or 4.04 acres nearest to SR A1A. The boundary of this conservation area appears to
include the areas seaward of the Easterly Building Line along with existing dunes situated
near the CCL.
The subject property is within “The Enclave at Hillsboro Beach” plat as recorded in
Plat Book 154, Page 31 of the Broward County records. A restrictive plat note found on
page 2 of this plat states that “This plat is restricted to 6 detached single-family homes on
Parcel A, and 6 detached single-family homes on Parcel B”. This effectively limits the
subject property’s development to 12 single-family homes. This deed restriction can be
amended by approval of the Broward County Board of County Commissioners. For the
purposes of this valuation and cost study, it is also a Hypothetical Condition that this deed
restriction has been removed, allowing for the development outlined in each of the two
Development Scenarios set for this report.
The survey for Parcel A includes some areas of submerged lands below water
adjacent to the Intracoastal Waterway and west of an existing concrete dock/seawall on the
property. Most of the upland areas of Parcel A are generally level and at street grade, but
with some depressed areas at the northwest end of Parcel A sloping downward toward the
Intracoastal Waterway. This survey also indicates a submerged land lease area to the west of
the western boundary of Parcel A below the waters of the Intracoastal Waterway. It is
unknown whether this submerged land lease is currently active, and its area is not included
with the surveyed areas of Parcel A; as such, this submerged land area is not considered a
part of the subject property in this appraisal and cost study.
Parcel B has greater undulation to its topography, with a high berm of approximately
six feet or more above street grade and lining most of its frontage along SR A1A. There is an
opening in the berm near the southern end of the western boundary of Parcel B. East of this
berm, the topography of Parcel B falls again to near street grade before rising by as much as
approximately six feet again, particularly in the northern areas of Parcel B and forming dunes
with vegetation near where the site survey indicates the CCL is located. Beach and dune

MULTIFAMILY RESIDENTIAL SITE, 1174-1185 HILLSBORO MILE, HILLSBORO BEACH, FL
202121 REPORT
ATLANTIC BLUE CONSULTING, INC. SECTION II DESCRIPTIVE DATA
20
erosion is a primary concern when considering buildings to be allowed seaward of the CCL,
thus the CCL is more likely forms a barrier to development to the east of that line at the
subject property.
No adverse environmental conditions were observed by the appraiser, but an
environmental assessment by a qualified engineer is recommended as the appraiser is not
qualified to make such assessments on the property.
ZONING ANALYSIS
As noted above, the subject property is zoned RM-16 by the Town of Hillsboro Beach
which allows for single- and multifamily residential uses up to a maximum density of 16
dwelling units per acre. General development restrictions under this zoning designation are
presented below:
PROPOSED PROPERTY DEVELOPMENT DESCRIPTIONS
The purpose of this appraisal is to estimate the property’s Prospective (Hypothetical)
Market Values under two potential Development Scenarios, and to estimate the building and
other costs to construct each development. The first is the High-Rise Scenario, in which the
Zoning Designation RM-16
Allowed Uses Single- and multifamily residential
Minimum Lot Width 100 feet
Minimum Lot Depth 100 feet
Minimum Lot Size (Sq.Ft.) 25,000
Maximum Building Height 35 feet
Maximum Building Ground Coverage 35%
Maximum Recreational/Green Coverage 15%
Maximum Residential Use Density 16 units/acre
Minimum Plot Area 2,900 sq.ft ./unit
Yard Setbacks:
Front Street 85 feet from center line of SR A1A
Between Buildings 15 feet
Rear 15 feet
Minimum On-Site Parking 1 space/unit
Minimum Multifamily Unit Size (Sq.Ft.)
1-Bedroom 1,000
2-Bedroom 1,300
3-Bedroom 1,600

MULTIFAMILY RESIDENTIAL SITE, 1174-1185 HILLSBORO MILE, HILLSBORO BEACH, FL
202121 REPORT
ATLANTIC BLUE CONSULTING, INC. SECTION II DESCRIPTIVE DATA
21
property would be developed according to plans by Arquitectonica (ARQ) dated July 29, 2021;
they include a proposed 15-story high-rise residential condominium development located on
Parcel B to the east of Hillsboro Mile/State Road A1A (SR A1A) with 112 total residential
units, ground floor lobby and amenity spaces, and a subterranean garage, plus nine proposed
two-story residential units in detached “villas” each with a two car garage, plus an “amenity”
building with 9,294 square feet, located to the west of SR A1A on Parcel B and overlooking the
Intracoastal Waterway. The second valuation scenario considers a proposed multifamily
residential development consistent with the property’s highest and best use and as of the current
valuation date. This development is based on market conditions and the appraiser’s
interpretation of the zoning code of the Town of Hillsboro Beach; it would include 188
multifamily residential units in buildings of no more than three stories, consistent with the
development allowed under the property’s RM-16 zoning. Details of these two proposed
development Scenarios for the subject property are described below.
High-Rise Scenario
Under this scenario, the property would be developed according to architectural plans
from Arquitectonica (ARQ) dated July 29, 2021, which are presented in the Addenda of this
report. This development would include 112 one-level (flat) units in a 15-story tower on Parcel
B to the east of SR A1A, above a subterranean garage. Residential units would be located on
Floors 2 through 15, with a ground floor lobby and common areas.

MULTIFAMILY RESIDENTIAL SITE, 1174-1185 HILLSBORO MILE, HILLSBORO BEACH, FL
202121 REPORT
ATLANTIC BLUE CONSULTING, INC. SECTION II DESCRIPTIVE DATA
22
Residential units on each floor would include four 2-bedroom units ranging in size from
2,765 to 2,790 square feet, and four 4-bedroom units ranging in size from 4,710 to 5,520 square
feet in living area. All of the units on each floor would have east-facing views of the Atlantic
Ocean, while the 4-bedroom units would also feature west-facing views of the evening sunsets.
The total square footage of interior living space for these 112 residential units would be 442,400
square feet for an average unit size of 3,950 square feet.
The eight 15th
-floor “penthouse” units in the tower will also feature a rooftop pool and
pool deck. According to these plans by ARQ, the breakdown of gross building area for this
tower would be as follows:

MULTIFAMILY RESIDENTIAL SITE, 1174-1185 HILLSBORO MILE, HILLSBORO BEACH, FL
202121 REPORT
ATLANTIC BLUE CONSULTING, INC. SECTION II DESCRIPTIVE DATA
23
The ground floor will feature a front approach driveway with five open parking spaces,
an exterior deck with a swimming pool, a lap pool and a spa pool, terraces and a covered central
breezeway. The subterranean garage for this tower would have 187,036 square feet of gross
building area and contain 232 parking spaces.
Across SR A1A to the west, Parcel A is proposed for development with nine detached
two-story “villa” residential units which will feature views overlooking the Intracoastal
Waterway. Eight of the villa units will have 3,580 square feet of living space, with the
southern-most villa having 5,280 square feet. Each villa unit will also feature a two-car garage
with 420 square feet, and its own ground level pool as well as a rooftop deck with pool.
Tower Gross Sq.Ft.
Residential Floors 2-15 487,718
Lobby Etc. 29,977
Total 517,695
Garage 187,036

MULTIFAMILY RESIDENTIAL SITE, 1174-1185 HILLSBORO MILE, HILLSBORO BEACH, FL
202121 REPORT
ATLANTIC BLUE CONSULTING, INC. SECTION II DESCRIPTIVE DATA
24
The total living area of the nine villa units will be 33,920 square feet for an average unit
size of 3,769 square feet. At the north end of Parcel A will be a common amenity building with
a gross building area of 9,284 square feet, accompanied by 15 open parking spaces and a
rooftop pool. Parcel A will also have two tennis courts and a tennis pavilion, plus driveway
access to the various building improvements. A seawall will be constructed along the site’s
water frontage to the Intracoastal Waterway.
Details of the common amenity package for these improvements or the unit’s interior
finish is not provided; however, with its prime Hillsboro Beach location and ocean frontage, the
tower units are expected to exhibit ultra-luxury interior finish similar to that for the recently-
completed Sabbia Beach development in Pompano Beach, the proposed oceanfront Solemar
condominium project (also in Pompano Beach), and the other comparable sale properties cited
in the Valuation section of this report. This includes a full and high-end kitchen appliance
package, top-grade kitchen cabinetry and countertops, high-quality bathroom fixtures, vanities
and tile, and private balconies for each unit. Similar ultra-luxury finish is assumed for the nine
villa units along the Intracoastal Waterway, along with interior upper-floor access, ground floor
terraces, and balconies. As such, it is an Extraordinary Assumption that the proposed
multifamily residential development under this Development Scenarios would have ultra-luxury
interior and exterior furnishings commensurate with those at the newest nearby luxury
condominium developments in Broward and southern Palm Beach County cited in the
Valuation section of this report. However, most new condominium developments in this market
feature “developer finish”, meaning that only the flooring in the kitchens and baths are installed
by the developer; the unit buyer is responsible for selection and installation of flooring in other
parts of the unit.
Low-Rise Scenario
There are no development or architectural plans provided under this second
Development Scenario. It assumes that the property would be developed according to its
highest and best use, as described in the Highest and Best Use section of this report. According
to that analysis, 35% of the site’s 512,632 square feet can be covered by building improvements,

MULTIFAMILY RESIDENTIAL SITE, 1174-1185 HILLSBORO MILE, HILLSBORO BEACH, FL
202121 REPORT
ATLANTIC BLUE CONSULTING, INC. SECTION II DESCRIPTIVE DATA
25
or 179,421 square feet of the site area. With up to three stories of building area, this allows for a
maximum gross building area of 538,263 square feet, as calculated below:
With 10% to 15% of the gross building area used for common elements, this leaves
approximately 475,000 square feet of building area available for units’ living space. The
balance of gross building area in this scenario would include common amenities for the
residents such as a clubroom, fitness center, etc., plus common interior unit access hallways and
elevator lobbies, fire staircases, maintenance closets, etc.
The maximum density allowed by zoning is 16 dwelling units per acre, providing for a
maximum of 188 dwelling units to the property. With 475,000 square feet of living space for
the dwelling units, this equates to an average unit size of 2,527 square feet under this Low-Rise
Scenario. Subterranean garages could be built for the units built on Parcels A and B up to two
units per acre plus some surface guest parking. The project’s exterior amenities would likely
include a pool and whirlpool for residents. Other site improvements would be commensurate
with those for the High-Rise Scenario including access driveways and the seawall for Parcel A,
but the larger number of units under this Low-Rise Scenario spread among low-rise buildings is
likely to eliminate the possibility of tennis courts or other exterior amenities in these
circumstances.
Under each Development Scenario, the prime location of the property remains the same,
thus similar ultra-luxury interior unit finish would also be included with the residential units and
common areas under this Low-Rise Scenario. This includes high-grade kitchen appliances,
cabinetry and countertops, best-quality bathroom fixtures, vanities and tile, and developer finish,
commensurate with the comparable sales cited for the subject in this scenario in the Valuation
section of this report.
Maximum Building Coverage 35% of Site
Maximum Building Height 3 Stories
Total Site Sq.Ft. 512,632
Maximum Building Coverage 35%
Maximum Ground Floor Building Area (Sq.Ft.) 179,421
Number of Allowable Floors 3
Maximum Building Sq.Ft. 538,263

MULTIFAMILY RESIDENTIAL SITE, 1174-1185 HILLSBORO MILE, HILLSBORO BEACH, FL
202121 REPORT
ATLANTIC BLUE CONSULTING, INC. SECTION II DESCRIPTIVE DATA
26
PROPERTY TAXES AND ASSESSMENTS
The subject property is assessed under the jurisdiction of Broward County, Florida. The
assessment for the property is established each year as of January 1st by the County Property
Appraiser's Office at 100% of "Just Value". Just Value has been equated to Market Value less
closing costs. While the State of Florida requires real estate to be assessed at 100% of Just
Value, in reality, the ratio of the assessed value to sales price is generally below 100 %.
The tax due is computed according to annual millage rates established by the various
taxing authorities. Taxes are payable in November with a 4% discount and become delinquent
on the following April 1st. Millage rates are the amount paid per $1,000 of assessed value. As
of the current valuation date, the 2020 tax year is the most recent year for which finalized
assessed valuation and tax information would be available.
The total assessed values and taxes for the appraised property’s folios are summarized as
follows:
HIGHEST AND BEST USE
According to The Dictionary of Real Estate Appraisal, published by the Appraisal
Institute, the highest and best use may be defined as:
1 That reasonable and probable use that supports the highest present value of vacant land or improved
property, as defined, as of the date of appraisal.
2 The reasonably probable and legal use of land or sites as though vacant, found to be physically possible,
appropriately supported, financially feasible, and that results in the highest present land value.
Folio No. Land Assessor's Assessed 2020
48-43-08-13- Assessment Market Value Value Taxes
0010 $2,016,250 $2,016,250 $2,016,250 $35,702.35
0012 $2,077,980 $2,077,980 $2,077,980 $35,795.42
0013 $2,139,750 $2,139,750 $2,139,750 $37,889.20
0014 $2,201,480 $2,201,480 $2,201,480 $38,982.28
0015 $2,263,200 $2,263,200 $2,263,200 $40,075.14
0016 $2,324,980 $2,324,980 $2,324,980 $41,169.14
0020 $3,765,750 $3,765,750 $3,765,750 $66,681.28
0021 $3,726,530 $3,726,530 $3,726,530 $65,986.79
0022 $3,711,400 $3,711,400 $3,711,400 $65,718.87
0023 $3,698,390 $3,698,390 $3,698,390 $65,488.51
0024 $3,692,740 $3,692,740 $3,692,740 $65,388.44
0030 $3,681,550 $3,681,550 $3,681,550 $65,190.31
Totals $35,300,000 $35,300,000 $35,300,000 $624,067.73

MULTIFAMILY RESIDENTIAL SITE, 1174-1185 HILLSBORO MILE, HILLSBORO BEACH, FL
202121 REPORT
ATLANTIC BLUE CONSULTING, INC. SECTION II DESCRIPTIVE DATA
27
3 The most profitable use. Implied in these definitions is that the determination of highest and best use
takes into account the contribution of a specific use to the community and community development goals
as well as the benefits of that use to individual property owners. Hence, in certain situations the highest
and best use of land may be for parks, green belts, preservation, conservation, wildlife habitats, and the
like."
Highest and best use is analyzed under two separate applications or scenarios: (1)
highest and best use of the site as though vacant and (2) highest and best use of the property as
improved. The highest and best use of the site as though vacant is based on the theory that land
will be put to its maximally productive use and this use will determine the highest site value. It
is the basis for valuing the site. Highest and best use of the property as improved determines
what use or type of occupancy will create the highest value for the entire property, given any
existing improvements. It is the basis for comparable selection in both the sales comparison and
income capitalization approaches to value. As the property is currently unimproved, this
analysis only considers the property’s highest and best use as vacant.
The appraiser has evaluated the property’s highest and best use. Highest and best use
must meet four criteria. The use must be (1) legally permissible, (2) physically possible, (3)
financially feasible, and (4) maximally productive.
Legally Permissible
The subject property is zoned RM-16 which allows for single- or multifamily residential
development of up to 16 units per acre in buildings of no more than three stories. Given the
site’s size, this allows for a maximum development of 188 residential units at the property.
However, the property is within the “The Enclave at Hillsboro Beach” plat as recorded in Plat
Book 154, Page 31 of the Broward County records. A restrictive plat note found on page 2 of
this plat limits development of the appraised subject to 12 single-family homes. This restriction
can be amended by approval of the Broward County Board of County Commissioners. For the
purposes of this value and cost study, it is a Hypothetical Condition that this deed restriction has
been removed, allowing for development according to zoning (up to 16 units per acre or up to a
maximum of 188 residential units).

MULTIFAMILY RESIDENTIAL SITE, 1174-1185 HILLSBORO MILE, HILLSBORO BEACH, FL
202121 REPORT
ATLANTIC BLUE CONSULTING, INC. SECTION II DESCRIPTIVE DATA
28
Other zoning restrictions include a maximum building area coverage of 35% of the site.
With a total site size of 512,632 square feet, building improvements can cover a maximum of
179,421 square feet of the subject’s site area.
Physically Possible
The subject’s two parcels have a width and depth to provide for reasonable development
according to zoning. The Coastal Construction Line runs north/south through Parcel B
approximately 196 to 210 feet east of the right-of-way for SR A1A. The Easterly Building Line
from Map Book 2, Page 46 of the Broward County records also runs north/south approximately
95 feet east of the Coastal Construction Line (CCL). Although not a setback line, special
permission is required from the Florida Department of Environmental Protection to
development seaward of the CCL. In general, development seaward of the CCL may be granted
if other nearby buildings also encroach past the CCL (but not in all circumstances).
A 1993 agreement with Broward County created a conservation area on Parcel B nearest
the Atlantic Ocean comprising 102,526 square feet of land (subject to increased building height
approval). This limits the developable area of Parcel B to 175,790 square feet or 4.04 acres
nearest to SR A1A.
Otherwise, no easements or encroachments are apparent that would significantly limit
development, and all primary utility connections appear to be available. Parcel A is generally
level and at street grade, but a survey of this site indicates an area at the northwest end of this
parcel that slopes downward toward the shoreline of the Intracoastal Waterway. Parcel B
features dunes with vegetation running generally along the CCL, and a raised berm along its
frontage to SR A1A with a “valley” running in between. Conservation and concerns regarding
beach and dune erosion affecting development at the CCL, and the presence of a conservation
area nearest the Atlantic Ocean shoreline, may provide for some limitations of development of
Parcel B in areas of this parcel that are seaward of the CCL.
Financially Feasible & Maximally Productive
Up to 188 multifamily residential units are possible at the subject, in three-story
buildings. Among the possible uses are luxury rental apartments or for-sale condominiums.
Luxury rental projects have not been development in oceanfront locations in South Florida

MULTIFAMILY RESIDENTIAL SITE, 1174-1185 HILLSBORO MILE, HILLSBORO BEACH, FL
202121 REPORT
ATLANTIC BLUE CONSULTING, INC. SECTION II DESCRIPTIVE DATA
29
(including Broward, Miami-Dade and Palm Beach Counties) since the 1990s. The amount of
rent that can be charged for the best-quality luxury rental projects in South Florida typically
provides for a value result of no more than $500,000 per unit for luxury multifamily rental
apartment development. In the Valuation section of this report, it is noted that the retail sale
price of the subject’s units under the Low-Rise Scenario is $1,731,936 per unit (upon
completion), with a net present value for these units of $1,468,723 per unit. This indicates that
the property’s value is maximized when the property is developed with luxury for-sale
condominiums.
From this analysis, the highest and best use of the subject property is for development of
188 multifamily residential units in three-story buildings, with the units to be sold to individual
condo unit buyers. This is synonymous to the Low-Rise Scenario of development for the
subject property outlined in this report. Although the number of units planned in the alternative
High-Rise Scenario of development conforms to the maximum density allowed under the
property’s zoning, it will feature a 15-story tower; this exceeds the maximum building height
currently allowed by zoning, thus development under the High-Rise Scenario would require a
zoning change or variance in order to proceed. Thus, it is a Hypothetical Condition that this
high-rise development can be allowed at the subject property under this High-Rise Scenario.

MULTIFAMILY RESIDENTIAL SITE, 1174-1185 HILLSBORO MILE, HILLSBORO BEACH, FL
202121 REPORT
ATLANTIC BLUE CONSULTING, INC. SECTION III VALUATION 30
SECTION III VALUATION & COST

MULTIFAMILY RESIDENTIAL SITE, 1174-1185 HILLSBORO MILE, HILLSBORO BEACH, FL
202121 REPORT
ATLANTIC BLUE CONSULTING, INC. SECTION III VALUATION 31
VALUATION PROCESS
There are three recognized approaches considered in the valuation of real property; the
Cost Approach, the Income Approach, and the Sales Comparison Approach. The type and age
of any improvements to a property, and the quantity of available data affect the applicability of
each approach in a specific appraisal situation. However, the Prospective Market Values of the
subject property, if completed under either Development Scenario cited herein, require the
estimate of the net present value of the sellout of the individual residential condominium units
that would be present. This is effectively the Subdivision Development Method of estimating
market value; and includes methodology from both the Sales Comparison and Income
Approaches to value.
In this methodology, a sales comparison analysis is undertaken to estimate the “retail”
value of each individual condo unit using comparable sales. A sellout or absorption period for
disposition of the units is estimated from recent trends at this location in the market. Closing
and holding costs from the sale of units are deducted from the revenues from unit sales, and risk
is deducted from the net proceeds after these costs are considered, providing for a net cash flow
from unit sales. These net cash flows are then discounted to present value.
PROPERTY VALUATION
The Sales Comparison methodology includes an analysis of what buyers in the area are
paying for similar units. The retail price of each residential unit is derived from sales of
comparable properties in a similar time period as the current valuation date. It is necessary to
evaluate factors such as market conditions (including date of sale), location, site condition,
zoning, visibility, accessibility and other factors when making the comparison.
Under both the High-Rise and Low-Rise Scenarios, the subject units would be marketed
as luxury residential condominiums in an exclusive location fronting to the Atlantic Ocean
beach and the Intracoastal Waterway in Hillsboro Beach. As such, there is some overlap in the
comparable sales that would be used in estimating the retail price that would be paid for units in
the tower building in the High-Rise Scenario and for the condo units in the Low-Rise Scenario.
For this reason, a presentation and analysis of the comparable sales is provided from which the
most-comparable sales can be derived in determining value.

MULTIFAMILY RESIDENTIAL SITE, 1174-1185 HILLSBORO MILE, HILLSBORO BEACH, FL
202121 REPORT
ATLANTIC BLUE CONSULTING, INC. SECTION III VALUATION 32
Comparable Sales – Luxury “Flat” Condominiums
These include units with a single level within a luxury condominium project, with sales
typically occurring since the beginning of 2020. Units were selected from buildings that are no
more than five years old from locations with ocean and/or Intracoastal Waterway frontage in
northern Broward County (to the north of Sunrise Boulevard in Fort Lauderdale) and southern
Palm Beach County (south of the Town of Palm Beach). A description of each is presented
below.
Sabbia Beach Condominium
730 North Ocean Boulevard
Pompano Beach, FL
No. Units: 69
Year Built: 2019
No. of Stories: 19
Parking: Garage (2 spaces/unit)
Unit Features: Full kitchen appliance package,
washer & dryer, smart home, balconies
Project Amenities: Pool, Spa/Hot Tub,
Clubroom, Fitness Center, Business Center,
Doorman Security
This luxury condominium has an oceanfront location in Pompano Beach. It features 2-, 3- and 4-
bedroom standard residences ranging in size from 1,760 to 3,589 square feet.

MULTIFAMILY RESIDENTIAL SITE, 1174-1185 HILLSBORO MILE, HILLSBORO BEACH, FL
202121 REPORT
ATLANTIC BLUE CONSULTING, INC. SECTION III VALUATION 33
Solemar Condominium
1116 North Ocean Boulevard
Pompano Beach, FL
No. Units: 105
Year Built: Proposed/New
No. of Stories: 20
Parking: Garage (2 spaces/unit)
Unit Features: Full kitchen appliance package,
washer & dryer, smart home, balconies
Project Amenities: 2 Pools, Spa/Hot Tub,
Clubroom, Fitness Center with Spa Treatment
Rooms, Wine Salon, Outdoor Pavilion with Bar,
Doorman Security
This luxury condominium is proposed for an oceanfront location in Pompano Beach, with unit pre-sales
occurring. It features 2- and 3-bedroom standard residences ranging in size from 2,004 to 2,589 square
feet, and is being developed by the Related Group.
1200 The Ocean Condominium
1200 Hillsboro Mile
Hillsboro Beach, FL
No. Units: 29
Year Built: 2016
No. of Stories: 3
Parking: Garage (1 space/unit)
Unit Features: Full kitchen appliance package,
washer & dryer, smart home, balconies
Project Amenities: 2 Pools, Clubroom, Fitness
Center; 18 units on the oceanfront east of SR
A1A and 11 units on the Intracoastal west of SR
A1A
This luxury condominium is the newest development in Hillsboro Beach and features and oceanfront
building with 18 units and an 11-unit building across SR A1A along the Intracoastal Waterway to the
west. It features 3-bedroom residences ranging in size from 1,825 to 2,374 square feet. Only six units
in the oceanfront building have direct east-facing views of the Atlantic Ocean, with the other 12 units in
that building have oblique side views of the ocean (facing north and south) from their balconies.

MULTIFAMILY RESIDENTIAL SITE, 1174-1185 HILLSBORO MILE, HILLSBORO BEACH, FL
202121 REPORT
ATLANTIC BLUE CONSULTING, INC. SECTION III VALUATION 34
3550 South Ocean Condominiums
3550 South Ocean Boulevard
South Palm Beach, FL
No. Units: 30
Year Built: 2019
No. of Stories: 8
Parking: Garage (2 space/unit)
Unit Features: Full kitchen appliance package,
washer & dryer, smart home, balconies
Project Amenities: Pool, Fitness Center,
Doorman Security
This luxury condominium has an oceanfront location in Palm Beach County. Only the “A” and “B”
lines in the building offer east-facing ocean views from the building, with the other units having an
oblique or partially-blocked ocean view. The standard 3-bedroom units at this property range in size
from 2,606 to 3,390 square feet.
Auberge Beach Condominiums
2200 North Ocean Boulevard
Fort Lauderdale, FL
No. Units: 171
Year Built: 2018
No. of Stories: 17-24
Parking: Garage (2 space/unit)
Unit Features: Full kitchen appliance package,
washer & dryer, smart home, balconies
Project Amenities: Multiple Pools, Whirlpool,
3 Clubrooms, Fitness Center, Spa, Restaurant &
Bar, Wine Room, Cigar Lounge, Golf
Simulator, Store, Private Pool Lounges,
Doorman Security
This luxury condominium has an oceanfront location and an impressive array of common amenities for
residents that include a restaurant and bar, several clubrooms, a spa, wine room, store, etc. It features a
variety of unit floor plans ranging in size from 1,350 to 4,636 square feet.

MULTIFAMILY RESIDENTIAL SITE, 1174-1185 HILLSBORO MILE, HILLSBORO BEACH, FL
202121 REPORT
ATLANTIC BLUE CONSULTING, INC. SECTION III VALUATION 35
3200 South Ocean Boulevard
Highland Beach, FL
No. Units: 19
Year Built: 2016
No. of Stories: 7
Parking: Garage (2 space/unit)
Unit Features: Full kitchen appliance package,
washer & dryer, smart home, balconies
Project Amenities: Rooftop Pool, Clubroom,
Fitness Center, Beach Club, Doorman Security
This luxury boutique condominium is situated along the Intracoastal Waterway in southern Palm Beach
County. It has 3 bedroom units ranging in size from 2,754 to 3,662 square feet, many of which also
have some views of the ocean across SR A1A to the east.
33 Intracoastal Condominiums
2895 N.E. 33 Court
Fort Lauderdale, FL
No. Units: 11
Year Built: 2018
No. of Stories: 5
Parking: Garage (2 space/unit)
Unit Features: Full kitchen appliance package,
washer & dryer, smart home, balconies
Project Amenities: Pool, Clubroom, Boat Dock
This luxury boutique condominium is located on the mainland areas of northeastern Fort Lauderdale on
a point lot with two frontages (east and north) along the Intracoastal Waterway. It has 3 bedroom units
ranging in size from 1,878 to 2,126 square feet, each as a corner unit, plus two 5th floor penthouse units.

MULTIFAMILY RESIDENTIAL SITE, 1174-1185 HILLSBORO MILE, HILLSBORO BEACH, FL
202121 REPORT
ATLANTIC BLUE CONSULTING, INC. SECTION III VALUATION 36
High-Rise Scenario - Valuation of Tower Units
In this Scenario, the average unit size of the 112 tower units will be 3,950 square feet,
located within a 15-story building on beachfront Parcel B of the subject property. From the
comparable properties, recent sales of units at these projects are noted in the table below:

MULTIFAMILY RESIDENTIAL SITE, 1174-1185 HILLSBORO MILE, HILLSBORO BEACH, FL
202121 REPORT
ATLANTIC BLUE CONSULTING, INC. SECTION III VALUATION 37
The sales from Sabbia Beach and Solemar are most comparable to the subject. Units at
Sabbia Beach recently sold for prices ranging from $771 to $931 per square foot of living space,
with a lower-floor (4th floor) unit having a lower sale price of $611 per square foot. At the
proposed Solemar project, pre-sale prices have recently ranged from $815 per square foot for a
lower (4th floor) unit, with a current asking price per square foot of $975 for a unit near the top
floor of this project. Both of these properties are located in Pompano Beach, which does not
have the exclusive address of Hillsboro Beach. As such, the prices paid for units at these two
projects likely set the base of the range of average sale prices that the tower units in the High-
Rise Scenario could likely command in this market.
P ro pe rty & S ize Unit S a le
M o de l/ Unit Type (S F ) Type S a le P ric e P ric e / S F D a te
S ubje c t P ric ing
Hills bo ro Hig h-R is e 3 ,9 5 0 Va rie s C urre nt
C OM P A R A B LE R EC EN T S A LE P R IC ES
Sabbia Beach # 1505 1,955 3/3 $ 1,590,000 $ 813 7/10/2021
Sabbia Beach # 1203 1,880 2/3 $ 1,450,000 $ 771 5/14/2021
Sabbia Beach # 1102 2,525 3/4 $ 2,050,000 $ 812 5/2/2021
Sabbia Beach # 1503 1,880 2/3 $ 1,749,800 $ 931 4/20/2021
Sabbia Beach # 401 1,760 2/3 $ 1,075,000 $ 611 4/19/2021
Sabbia Beach # 1202 2,525 3/4 $ 2,300,000 $ 911 4/1/2021
Sabbia Beach # 1804 3,751 4/5.5 $ 3,100,000 $ 826 2/18/2021
So lemar P o mpano # 406 2,589 3/3.5 $ 2,109,900 $ 815 P ending
So lemar P o mpano # 1803 2,004 2/2.5 $ 1,952,900 $ 975 As king
1200 The Ocean Hills bo ro # 1204 1,825 3/3 $ 975,000 $ 534 6/2/2021
1200 The Ocean Hills bo ro # 1303 1,881 3/3 $ 930,000 $ 494 2/16/2021
1200 The Ocean Hills bo ro # 1302 2,105 3/3 $ 1,070,000 $ 508 2/8/2021
3550 So uth Ocean So . P a lm # 4B 2,982 3/4 $ 3,120,000 $ 1,046 6/29/2021
3550 So uth Ocean So . P a lm # 2C 2,743 3/3 $ 1,499,503 $ 547 5/24/2021
3550 So uth Ocean So . P a lm # 3C 2,743 3/3 $ 1,666,800 $ 608 5/24/2021
3550 So uth Ocean So . P a lm # 3A 3,390 3/4 $ 4,200,000 $ 1,239 3/9/2021
3550 So uth Ocean So . P a lm # 2A 3,390 3/4 $ 4,000,000 $ 1,180 2/15/21
Auberge Beach # S1801 3,301 4/5 $ 4,700,000 $ 1,424 12/1/2020
Auberge Beach # N804 2,508 3/4 $ 3,275,000 $ 1,306 9/14/2020
3200 So uth Ocean # 601 2,754 3/4 $ 2,500,000 $ 908 4/1/2021
3200 So uth Ocean # 603 2,754 3/4 $ 2,900,000 $ 1,053 3/31/2021
33 Intraco as ta l Co ndo s # 3C 2,068 3/3 $ 935,000 $ 452 3/3/2019
33 Intraco as ta l Co ndo s # 3B 2,000 3/4 $ 1,070,000 $ 535 11/5/2018
33 Intraco as ta l Co ndo s # 2A 2,126 3/4 $ 1,350,000 $ 635 11/4/2018
33 Intraco as ta l Co ndo s # 2B 1,878 3/4 $ 1,525,000 $ 812 11/4/2018

MULTIFAMILY RESIDENTIAL SITE, 1174-1185 HILLSBORO MILE, HILLSBORO BEACH, FL
202121 REPORT
ATLANTIC BLUE CONSULTING, INC. SECTION III VALUATION 38
While 1200 The Ocean represents sales of the newest condominiums in an oceanfront
project in Hillsboro Beach, the recent sales of units at this property feature oblique side views of
the ocean rather than direct views from the units, and locations on lower floor levels. As such,
the prices per square foot that were paid for these units were lower, ranging from $494 to $534
per square foot of living area.
Auberge Beach is a similar larger-scale luxury condominium in this market, but offers a
much-wider array of common amenities than that proposed for the High-Rise Scenario at the
subject. This includes three clubrooms, a spa, an on-site restaurant and bar, and other elements.
This property is also nearer to major retail, entertainment and transportation hubs in Broward
County than the subject or the other comparable projects cited in the preceding table. Thus,
prices that were recently paid for units at Auberge Beach were higher, ranging from $1,306 to
$1,424 per square foot of living space. This likely sets the maximum range of sale prices per
square foot that the subject’s tower units could generate in the High-Rise Scenario.
The other comparable properties feature smaller boutique buildings or those that front
the Intracoastal Waterway rather than the Atlantic Ocean beach. As such, less reliance was
placed on their indicated sale prices in estimating the retail sale price of units in the proposed
tower in the High-Rise Scenario for the subject property. Based on this analysis, the average
sale price per square foot for units in that proposed tower structure in this Scenario is estimated
to be $950 per square foot. This represents an average, thus units on lower floors would likely
command a lower price per square foot, with a higher price per square foot likely for units on
upper floors. The 15th floor units at the subject would each feature an added rooftop deck with
its own private swimming pool. For this location in the tower building in this Development
Scenario, and for this added living space and amenity, these eight units would have a higher
average price per square foot of $1,100.
Low-Rise Scenario - Valuation of Standard Units
In this Scenario, 188 units would be built in three-story buildings with an average unit
size of 2,527 square feet. However, as previously noted Parcel B has the CCL running
north/south through it with significant vegetation on this oceanfront site. It is likely that this will
limit the beach/ocean views of any units on lower floors of buildings constructed on this parcel.

MULTIFAMILY RESIDENTIAL SITE, 1174-1185 HILLSBORO MILE, HILLSBORO BEACH, FL
202121 REPORT
ATLANTIC BLUE CONSULTING, INC. SECTION III VALUATION 39
Furthermore, there is a conservation area on seaward areas of this parcel limiting its
development area to 4.04 acres nearest SR A1A; Parcel A has a size of 5.379 acres, calculating
to a total developable area of 9.419 acres. Thus, the developable area of Parcel B is 42% of the
total developable area of the subject. With three-story structural height limits promulgated
throughout the property, approximately 80 units in this Development Scenario could be built on
Parcel B, with the balance of 108 units developed on Parcel A. It is estimated that
approximately half of those 108 units on Parcel A could have a direct view of the Intracoastal
Waterway, with the balance of 54 units having an obstructed or oblique view (at best) of this
waterway.
As low-rise units, the sale of Unit 401 on the lower (4th) floor at Sabbia Beach and Unit
406 at Solemar, the lower price indications from $611 to $815 per square foot provide an
indication of values for the 80 units on beachfront Parcel B of the subject. This supports an
average price per square foot of $750 for these 80 units, and considers that some of those units
on Parcel B may have views of the ocean and beach that are obstructed by dunes and vegetation
along the CCL on Parcel B.
For the remaining 108 units on Parcel A in this Development Scenario, the sales from
3200 South Ocean and 33 Intracoastal provide a good indication as these units sold in projects
that front to the Intracoastal Waterway. The higher prices for units on the 6th floor of 3200
South Ocean, ranging from $908 to $1,053 per square foot of living space, reflect their superior
views on higher floors that allow for Intracoastal views and some ocean views across SR A1A to
the east. At 1200 The Ocean, units with obstructed ocean views in this low-rise project sold for
prices ranging from $494 to $534 per square foot; however, these unit sales occurred in an
oceanfront building. Unit sales at 33 Intracoastal recently ranged from $452 to $812 per square
foot of living space, but with a predominant range from $452 to $635 per square foot. This
project fronts the Intracoastal Waterway in Fort Lauderdale, but is located on the mainland
(west) side of the Intracoastal. While this location is closer to shopping and entertainment areas
of east central Broward County, it lacks the walking distance to the Atlantic Ocean beach of the
units in this Low-Rise Scenario that would be placed on Parcel A of the appraised property.
Based on this analysis, the estimated 54 units that would likely have direct Intracoastal
Waterway views from Parcel A in this Development Scenario would have an average retail price

MULTIFAMILY RESIDENTIAL SITE, 1174-1185 HILLSBORO MILE, HILLSBORO BEACH, FL
202121 REPORT
ATLANTIC BLUE CONSULTING, INC. SECTION III VALUATION 40
of $700 per square foot. For the remaining 54 units on Parcel A in this Low-Rise Scenario that
would likely have (at best) an obstructed or oblique view of the Intracoastal Waterway, an
average sale price of $575 per square foot is estimated.
Comparable Sales – Luxury “Villa” Condominiums
These include units in the High-Rise Scenario that are located on Parcel A fronting the
Intracoastal Waterway. These will be detached single-family dwelling units with two levels and
a rooftop deck and pool, and featuring direct Intracoastal Waterway views. In order to estimate
the retail price for these units, recent sales of newer detached homes along the Intracoastal
Waterway were obtained, along with recent sales of newer townhomes with this locational
feature; recent sales of similar detached ground floor units that are part of a larger luxury
multifamily residential development in this market were not available. A description of each is
presented below.
2800 N.E. 29 Street
Lighthouse Point, FL
Property Type: Semi-detached townhome
Year Built: 2021
Bedrooms/Baths: 4/5
Living Area: 4,097 Sq.Ft.
Parking: 2-Car Garage
Property Features: Full kitchen appliance
package, washer & dryer, smart home, balcony,
patio, pool, pool deck with outdoor kitchen,
whirlpool, boat dock

MULTIFAMILY RESIDENTIAL SITE, 1174-1185 HILLSBORO MILE, HILLSBORO BEACH, FL
202121 REPORT
ATLANTIC BLUE CONSULTING, INC. SECTION III VALUATION 41
2305 North Riverside Drive
Pompano Beach, FL
Property Type: Detached single-family home
Year Built: 2020
Bedrooms/Baths: 6/8
Living Area: 5,989 Sq.Ft.
Parking: 2-Car Garage
Property Features: Full kitchen appliance
package, washer & dryer, smart home, elevator,
balcony, patio, pool, pool deck, whirlpool, boat
dock, end-cap lot
1713 North Riverside Drive
Pompano Beach, FL
Property Type: Detached single-family home
Year Built: 2020
Bedrooms/Baths: 4/5
Living Area: 3,454 Sq.Ft.
Parking: 2-Car Garage
Property Features: Full kitchen appliance
package, washer & dryer, smart home, balcony,
patio, pool, pool deck, whirlpool, boat dock
149 S.E. 18 Avenue
Deerfield Beach, FL
Property Type: Detached single-family home
Year Built: 2021
Bedrooms/Baths: 5/5.5
Living Area: 4,765 Sq.Ft.
Parking: 2-Car Garage
Property Features: Full kitchen appliance
package, washer & dryer, smart home, balcony,
patio, pool, pool deck, whirlpool, boat dock

MULTIFAMILY RESIDENTIAL SITE, 1174-1185 HILLSBORO MILE, HILLSBORO BEACH, FL
202121 REPORT
ATLANTIC BLUE CONSULTING, INC. SECTION III VALUATION 42
136 & 138 MacFarlane Drive
Delray Beach, FL
Property Type: Semi- & attached townhomes
Year Built: 2016
Bedrooms/Baths: 3/5 and 4/5
Living Area: 4,486 to 4,568 Sq.Ft.
Parking: 2-Car Garage
Property Features: Full kitchen appliance
package, washer & dryer, smart home, balcony,
patio, pool, pool deck, rooftop deck
High-Rise Scenario - Valuation of Detached Villa Units
In this Scenario, Parcel A of the subject property will be developed with nine detached
single-family villa units ranging in size from 3,580 to 5,280 square feet of living space. The
average unit size of the nine villa units will be 3,769 square feet of living space. From the
comparable properties, recent sales of units at these projects are noted in the table below:

MULTIFAMILY RESIDENTIAL SITE, 1174-1185 HILLSBORO MILE, HILLSBORO BEACH, FL
202121 REPORT
ATLANTIC BLUE CONSULTING, INC. SECTION III VALUATION 43
The sales from Pompano Beach and Deerfield Beach represent detached single-family
dwelling units similar to the configuration of the subject’s proposed villa units in this
Development Scenario. Each has a location along the Intracoastal Waterway with sale prices
ranging from $713 to $1,077 per square foot. None of these properties would be subject to a
common condominium owners’ association; by contrast, none would have the common
amenities that would be available to the subject’s villa unit owners under the High-Rise Scenario
set forth in this report.
The sale from Lighthouse Point and the sale from 138 MacFarlane Drive in Delray
Beach are semi-detached townhomes, meaning that they are attached to another dwelling unit on
just one side. These two properties sold for similar prices per square foot or from $830 to $964
per square foot. From this analysis, the average sale price for the villa units in the High-Rise
Scenario is estimated to be $900 per square foot of living area.
Estimate of Aggregate of Retail Values (ARV) for Each Development Scenario
High-Rise Scenario
In this Scenario, there will be 112 units in the tower building on Parcel B, and nine villa
units on Parcel A. The units in the tower building were estimated to have an average price per
square foot of $950, except for the eight premium penthouse units which will feature a rooftop
deck and pool; those eight penthouse units will have a higher average price per square foot of
$1,100. Among the nine villa units, an average price of $900 per square foot has been
P ro pe rty & S ize Unit S a le
M o de l/ Unit Type (S F ) Type S a le P ric e P ric e / S f D a te
S ubje c t P ric ing
Hills bo ro Villa s 3 ,7 6 9 3 / 2 C urre nt
C OM P A R A B LE R EC EN T S A LE P R IC ES
2800 NE 29 St. Lightho us e P t. 4,097 4/5 - TH $ 3,950,000 $ 964 5/26/2021
2305 N Rivers ide Dr. P o mpano 5,989 6/8 - SFR $ 6,450,000 $ 1,077 6/1/2021
1713 N. Rivers ide Dr. P o mpano 3,454 4/5 - SFR $ 2,462,500 $ 713 5/4/2021
149 SE 18 Ave. Deerfie ld Beach 4,765 5/5.5 SFR $ 4,515,000 $ 948 4/2/2021
136 MacFarlane Dr. Delray Beach 4,486 3/5 - TH $ 3,550,000 $ 791 4/5/2021
138 MacFarlane Dr. Delray Beach 4,568 4/5 - TH $ 3,790,000 $ 830 11/13/2020

MULTIFAMILY RESIDENTIAL SITE, 1174-1185 HILLSBORO MILE, HILLSBORO BEACH, FL
202121 REPORT
ATLANTIC BLUE CONSULTING, INC. SECTION III VALUATION 44
estimated. Using these figures, a total retail sellout of the subject under the High-Rise Scenario
is estimated to be $455,548,000 (rounded), as calculated below:
This figure represents the Aggregate of Retail Value (ARV) for the units at the subject
under this Development Scenario, which equates to an average retail price per unit of
$3,764,860. These ARV indications are not synonymous with Market Value. The previous
sales comparison analysis was undertaken to estimate the “retail” value of each individual unit in
this Development Scenario using an analysis of comparable sales. A sellout period for
disposition of the lots must also be estimated, with holding costs from the sale of lots deducted
from the revenues from lot sales including taxes, marketing costs, etc. for the remaining unsold
lots during the sellout period. A risk factor is deducted from the net proceeds after these costs
are considered, providing for a net cash flow and a net present value (Market Value) from unit
sales in this High-Rise Scenario.
Low-Rise Scenario
In the Low-Rise Scenario, the 80 units on beachfront Parcel B were estimated to have an
average price of $750 per square foot of living area. The 54 units that would likely have direct
Intracoastal Waterway views from Parcel A in this Development Scenario would have an
average retail price of $700 per square foot. For the remaining 54 units on Parcel A in this Low-
Rise Scenario that would likely have (at best) an obstructed or oblique view of the Intracoastal
Waterway, an average sale price of $575 per square foot is estimated. From these figures, the
ARV for the subject property, considering the Low-Rise Scenario, would be as follows:
Unit No. of SF Per Total Retail Total Retail
Type Units Unit Sq.Ft. Price/SF Sellout
Standard Tower 104 3,950 410,800 $950 $390,260,000
Penthouse 8 3,950 31,600 $1,100 $34,760,000
Villas 9 3,769 33,920 $900 $30,528,000
Totals 121 476,320 $455,548,000
Averages 3,937 $3,764,860

MULTIFAMILY RESIDENTIAL SITE, 1174-1185 HILLSBORO MILE, HILLSBORO BEACH, FL
202121 REPORT
ATLANTIC BLUE CONSULTING, INC. SECTION III VALUATION 45
This provides an ARV estimate of $325,603,950 in this Low-Rise Scenario, for an
average price per unit of $1,731,936.
In both Development Scenarios, a luxury multifamily residential condominium
development would occur. With average unit pricing that would be from over $1,700,000 to
over $3,700,000, this would promulgate the highest quality of interior and exterior finish the
proposed development under either scenario. Thus, it is an Extraordinary Assumption that the
proposed multifamily residential development under both Development Scenarios presented in
this report would have ultra-luxury interior and exterior furnishings commensurate with those at
the newest nearby luxury condominium developments in Broward and southern Palm Beach
County, or similar to those cited above in this section of the report.
Sales (Absorption) Rates for Luxury Multifamily Condominium Projects
The Broward County housing market is demonstrating a period of expansion with a rate
of development that appears to be meeting future demand by new home buyers. Although
demand is not as deep as Miami-Dade County, the luxury oceanfront condominium market in
Broward County has experienced healthy absorption of new units developed in this market.
Typically, units at new projects are pre-sold to buyers when the development is proposed or
under construction. At these new projects, the developer will often have a temporary sales office
that is staffed full time with brokers whose attention is solely placed on their particular
development.
Many lenders require a developer to pre-sell 50% of the proposed units before they will
provide funding for construction. Pre-sales of units continues after construction begins until the
project is completed. Upon completion of construction and the issuing of a Certificate of
Occupancy, the closing and transfer of ownership for pre-sold units may begin.
Unit No. of SF Per Total Retail Total Retail
Type Units Unit Sq.Ft. Price/SF Sellout
Beachfront 80 2,527 202,160 $750 $151,620,000
Intracoastal 54 2,527 136,458 $700 $95,520,600
West of A1A 54 2,527 136,458 $575 $78,463,350
Totals 188 475,076 $325,603,950
Averages 2,527 $1,731,936

MULTIFAMILY RESIDENTIAL SITE, 1174-1185 HILLSBORO MILE, HILLSBORO BEACH, FL
202121 REPORT
ATLANTIC BLUE CONSULTING, INC. SECTION III VALUATION 46
Due to the production of legal paperwork and other items necessary for closing a sale of
a condo unit, and the time required to complete a unit closing between the developer and a new
unit buyer, not all units can be closed in a week or a month. In addition, some buyers may need
to obtain financing, a process that can take 30 days or more (although most buyers of homes
priced $1.0 million or more in this market pay cash). This is noted among the closings that
occurred at Sabbia Beach and Auberge Beach once these two projects were completed. The rate
of unit closings after completion of construction of these projects is summarized in the tables
below, based on quarter-year (three month) periods from the date the first units were closed:
In the first three months after completion, 78% of the units at Sabbia Beach were sold
and closed to their new owners. This project had 69 units thus a faster closing of a larger
percentage of its pre-sold units was possible. At Auberge Beach, 33% of the units closed in the
first three months after that project was completed, with 81% sold and closed before the end of
the first six months at that 171-unit project, with approximately 70% sold and closed within five
months after completion. It is worth noting that the range of unit retail sale prices at each of
these two projects is similar to (or supporting) the average unit sale price estimated for the
subject under its Low-Rise and High-Rise Scenarios.
After the first six months of closing, the remaining unsold units were sold and closed at
varying rates. After the initial flurry of closings of pre-sold units and units sold just after
Project Name Sabbia Beach
Location 730 North Ocean Blvd.
Pompano Beach
Total Units 69
Price Range $900,000-$3,000,000+
Closings Start 10/31/2019
Quarter Year No. 1 2 3 4
No. of Closings 54 7 1 4
Project Name Auberge Beach
Location 2200 North Ocean Blvd.
Fort Lauderdale
Total Units 171
Price Range $1,400,000-$6,000,000+
Closings Start 9/7/2018
Quarter Year No. 1 2 3 4 5
No. of Closings 57 81 17 2 1

MULTIFAMILY RESIDENTIAL SITE, 1174-1185 HILLSBORO MILE, HILLSBORO BEACH, FL
202121 REPORT
ATLANTIC BLUE CONSULTING, INC. SECTION III VALUATION 47
completion, the rate of sales is often dependent on the number of units remaining to be sold and
the continuance of marketing efforts that occur by a developer after a project is completed.
Often, when the inventory of unsold units falls over time, a developer may close an on-site sales
office and remove the marketing team, turning the brokerage responsibilities for the remaining
unsold units to an independent local broker. That broker may have other listings to market, thus
marketing efforts for the remaining unsold units at a given project may not receive the same
attention as they did when pre-sales and post-completion sales were occurring.
These rates of sales, upon completion of the subject under each of its two Development
Scenarios, will be considered in estimating the sellout period for each.
Estimate of Sales and Carrying Costs During Sellout
During the sellout period for a multi-unit project such as those outlined in the High-Rise
and Low-Rise Scenarios of this report, additional costs that must be considered that are also
known as indirect or soft costs. They include the closing costs on the sale of each unit, and the
holding costs for the remaining unsold inventory of units until sellout is completed. Closing
costs include commissions to brokers on the sale of units, and administrative costs including title
search and policy expenses at the time of sale. Holding costs include marketing costs and
property taxes for the remaining unsold units until sellout is completed.
The holding costs are derived from industry standards and actual costs to be paid.
Residential brokerage commissions are estimated to be 6.0% of each lot’s sale price, however,
lower commissions to in-house brokers of 3.0% is often negotiated by the developer for pre-
sales and units sold just after completion. Marketing for the remaining unsold lots at the subject
is anticipated to continue by the owner, at a rate of 0.5% of the unsold units’ cumulative value.
After the pre-sold units and immediate sales of units post completion, marketing responsibilities
are transferred over to an outside independent broker.
Administrative and closing costs range from 0% to 3.0% for most residential units sold
in this market. While closings costs are occasionally paid by the buyer, sellers have been
regularly paying for many closing costs to unit buyers as a sales incentive for purchasers in the

MULTIFAMILY RESIDENTIAL SITE, 1174-1185 HILLSBORO MILE, HILLSBORO BEACH, FL
202121 REPORT
ATLANTIC BLUE CONSULTING, INC. SECTION III VALUATION 48
market. Therefore, administrative and closing costs for the subject are estimated to be 1.5% of
retail sale prices on the lots sold.
The owner of the lots will be liable for their property taxes until they are sold. Total
taxes on the land are currently $624,067.73. This figure equates to $5,158 per unit, which
assigned as a quarterly expense to each unsold unit; taxes on properties with assessed
improvements typically do not occur before one year after completion. This amount will
increase each November by 3% when new assessments and taxes are presented for each year by
the county appraiser and treasurer. Monthly homeowner’s association (HOA) dues on the
unsold units that continue to be held by the developer during the sellout period are estimated to
be $1.00 per square foot for each unit.
Most developers try to target risk as a percentage of the sellout value. Standard returns
sought by these parties for residential projects tend to range from 10% to 25% of the total gross
revenue. With a typical level of risk assigned to the subject under either Development Scenario,
risk of 15% is estimated. However, there is substantially reduced risk on units that were pre-
sold; as such, a lower 5% risk rate is assigned to the units that were pre-sold prior to completion
or those sold shortly after completion occurred.
The discount rate is a rate of return on investment in the physical components of land
and buildings. It is also a rate of return on capital used to discount future payments to present
value. The discount rate provides for the cost of debt borrowing and the costs of equity
borrowing. The rate can be derived via a simple band of investment technique which provides
only for a return on (i.e. interest) only since principal (both debt and equity) will be returned as
the subject lots are sold.
A debt rate of approximately 5.0% is presently indicated based on the availability of debt
capital in the market. Equity capital should be sufficiently attracted at a minimum 12.5% rate,
based the increased risk in investment of new luxury multifamily residential development along
the oceanfront in Broward County and the returns on alternative investments in the market.
Although a yield rate or discount rate cannot be directly calculated, in theory, underwriters have
traditionally estimated it with a band of investment technique. Employing the mortgage equity
band of investment technique, a discount rate can be estimated as follows:

MULTIFAMILY RESIDENTIAL SITE, 1174-1185 HILLSBORO MILE, HILLSBORO BEACH, FL
202121 REPORT
ATLANTIC BLUE CONSULTING, INC. SECTION III VALUATION 49
In theory, the yield or discount rate is a composition of numerous sub-rates. The
discount rate incorporates four elements of risk: compensation, time preference, management,
and liquidity preference:
Risk is the possibility of decline in income value of real estate. Compensation is
required to offset the chance that income projections will not be realized.
Time preference is represented by the "riskless" rate of return on long term, low risk
investments. It represents the opportunity cost of placing funds in a nearly risk free
investment.
Management is the time, effort and expertise required to oversee an investment. More
complex properties require greater compensation.
Liquidity preference is the compensation for owning a relatively illiquid asset such as
real estate.
A range for each of the elements of compensation are examined as follows:
These two methods produced a narrow range of discount rate indications. Considering
the risk involved in this type of project, its size, location and other factors, a discount rate of
about 8.0% appears appropriate for application to the sellout of the subject units.
Debt: 65% x 5.0% = 3.25%
Equity: 35% x 12.5% = 4.38%
Discount Rate = 7.63%
Low Range High Range
Risk 2.0% 3.0%
Time Preference 2.0% 3.0%
Management 1.0% 1.5%
Liquidity Preference 1.0% 1.5%
Total 6.0% 9.0%

MULTIFAMILY RESIDENTIAL SITE, 1174-1185 HILLSBORO MILE, HILLSBORO BEACH, FL
202121 REPORT
ATLANTIC BLUE CONSULTING, INC. SECTION III VALUATION 50
Estimate of Net Present Value (Prospective Market Value If Completed)
All of the components are now known in order to estimate the Discounted Net Present
Value under each Development Scenario, which is synonymous with the Prospective Market
Value If Completed as of the current valuation date. It considers the units under each Scenario
and their ARV (retail prices) of each unit over the sellout period which is assumed to begin
September 1, 2021 or the first calendar month following the current valuation date.
High-Rise Scenario
Considering the total of 121 units at the subject under this Development Scenario, and
the rate of closings and sales of units noted after completion of the comparable Sabbia Beach
and Auberge Beach projects, it is estimated that 70 units could be closed in the first quarter-
year period after completion of the subject, with another 37 units sold and closed the
following quarter. The remaining sellout would occur more slowly, similar to the rate noted
at the comparable properties cited above, but with attentive marketing the remaining 14
unsold units could be sold and closed in the following 12-month period. After the first six
months of unit closings, the average retail price of the remaining unsold units can be
estimated to increase by 0.75% per quarter (or 3.0% annually).
The 3.0% in-house brokerage commission rate would apply to the pre-sold and units
sold immediately after completion, with a 6.0% commission rate on the remaining inventory
thereafter. Similarly, marketing costs of 0.5% of the value of the unsold units would apply in
the first six months; these expenses would transfer to the additional previous brokerage
commission rate of 6.0% on sales thereafter. Administrative and closing costs of 1.5% of
sale price of each unit are assessed. Taxes and HOA dues on the remaining unsold inventory
in each quarter-year period follow those that were previously described in this section of the
report. As shown in the following table, the Discounted Net Present Value of the 121 units that
would comprise the subject property under this High-Rise Scenario, if completed as of the
current valuation date of July 2, 2019, is estimated as follows:

MULTIFAMILY RESIDENTIAL SITE, 1174-1185 HILLSBORO MILE, HILLSBORO BEACH, FL
202121 REPORT
ATLANTIC BLUE CONSULTING, INC. SECTION III VALUATION 51
The resulting Prospective Market Value indication from the discounted sellout in this
High-Rise Scenario for the property, as of the currently valuation date, is $390,880,000
(rounded), or approximately $3,230,413 per unit.
Low-Rise Scenario
This Low-Rise Scenario assumes 188 units would be complete at the subject as of the
current valuation date. Using the rate of closings and sales of units noted after completion of
the comparable Sabbia Beach and Auberge Beach projects, it is estimated that 85 units could
be closed in the first quarter-year period after completion of the subject in this Development
Total Units 121
Total Pre-Sale Contracts 97
Total Sellout/Aggregate of Retail Values (ARV) $455,548,000
ARV per Unit $3,764,860
Current Property Tax/Unit (Q uarterly Total) $1,289
Estimated Q uarterly HO A Dues Per Unit $11,810
SELLO UT SCHEDULE
Quarter Year No. 1 2 3 4 5 6
Starting Month/Year Sep-21 Dec-21 Mar-22 Jun-22 Sep-22 Dec-22
Units Sold at Start of This Period 97 51 14 10 6 3
Sold/Pre-Sold Unit Closings This Period 70 37 4 4 3 3
Units Sold But Not Closed at End of Period 27 14 10 6 3 0
Total Units Remaining in Inventory 51 14 10 6 3 0
ARV/Unit - Unsold Units $3,764,860 $3,764,860 $3,793,097 $3,821,545 $3,850,206 $3,879,083
Unit Price Appreciation Per Period 0.00% 0.00% 0.75% 0.75% 0.75% 0.75%
TO TAL SELLO UT REVENUES
Contracted Sale Units Expected to Close $263,540,200 $139,299,820 $15,172,386 $15,286,179 $11,550,619 $11,637,248
LESS: SELLO UT EXPENSES
Commissions on Pre-Sold Units 3.0% $7,906,206 $4,178,995 $0 $0 $0 $0
Commissions on Additional Unit Sales 6.0% $0 $0 $910,343 $917,171 $693,037 $698,235
Marketing Costs (% of Unsold Unit Values) 0.5% $960,039 $263,540 $0 $0 $0 $0
Admin. & Closing Costs on Unit Sales 1.5% $3,953,103 $2,089,497 $227,586 $229,293 $173,259 $174,559
Taxes on Remaining Unsold Unis (1) $65,739 $18,587 $13,277 $7,966 $3,983 $0
HOA Dues on Remaining Unit Inventory (2) $602,310 $165,340 $118,100 $70,860 $35,430 $0
Total Sellout Expenses $13,487,397 $6,715,959 $1,269,306 $1,225,290 $905,709 $872,794
NET SALE PRO CEEDS FRO M UNIT SALES $250,052,803 $132,583,861 $13,903,080 $14,060,889 $10,644,910 $10,764,454
Risk/Opportunity Cost on Pre-Sold Units 5.0% $13,177,010 $6,964,991 $0 $0 $0 $0
Risk/Opportunity Cost on Remaining Units 15.0% $0 $0 $2,275,858 $2,292,927 $1,732,593 $1,745,587
LESS: TOTAL RISK ASSESSED $13,177,010 $6,964,991 $2,275,858 $2,292,927 $1,732,593 $1,745,587
NET CASH FLO W $236,875,793 $125,618,870 $11,627,222 $11,767,962 $8,912,317 $9,018,867
PRESENT VALUE FACTOR 8.0% 0.980392 0.961169 0.942322 0.923845 0.905731 0.887971
NET PRESENT VALUE $232,231,132 $120,740,964 $10,956,587 $10,871,773 $8,072,162 $8,008,492
TO TAL NET PRESENT (MARKET) VALUE $390,881,110
RO UNDED $390,880,000
PER UNIT $3,230,413

MULTIFAMILY RESIDENTIAL SITE, 1174-1185 HILLSBORO MILE, HILLSBORO BEACH, FL
202121 REPORT
ATLANTIC BLUE CONSULTING, INC. SECTION III VALUATION 52
Scenario, with another 75 units sold and closed the following quarter. The remaining sellout
would occur more slowly, similar to the rate noted at the comparable properties cited above,
but with attentive marketing the remaining 28 unsold units could be sold and closed in the
subsequent 12-month period. After the first six months of unit closings, the average price of
the remaining unsold units can be estimated to increase by 0.75% per quarter (3.0%
annually).
The same computations used for brokerage commissions, marketing costs,
administrative and closing costs were used, along with the taxes and HOA dues on the
remaining unsold inventory of units. This produces the following Discounted Net Present
Value of the subject in this Low-Rise Scenario with its 188 units, if completed as of the current
valuation date of July 2, 2019:

MULTIFAMILY RESIDENTIAL SITE, 1174-1185 HILLSBORO MILE, HILLSBORO BEACH, FL
202121 REPORT
ATLANTIC BLUE CONSULTING, INC. SECTION III VALUATION 53
The resulting Prospective Market Value indication from the discounted sellout in this
Low-Rise Scenario for the property, if development were completed as of the currently
valuation date, is $276,120,000 (rounded), or approximately $1,468,733 per unit.
COST ANALYSIS
An analysis of the development costs to build the subject building and site improvements
under each Development Scenario was undertaken to justify the feasibility of development, i.e.,
provide a basis for profitability for such development under each Scenario. The primary source
Total Units 188
Total Pre-Sale Contracts 150
Total Sellout/Aggregate of Retail Values (ARV) $325,603,950
ARV per Unit $1,731,936
Current Property Tax/Unit (Q uarterly Total) $1,289
Estimated Q uarterly HO A Dues Per Unit $7,581
SELLO UT SCHEDULE
Quarter Year No. 1 2 3 4 5 6
Starting Month/Year Sep-21 Dec-21 Mar-22 Jun-22 Sep-22 Dec-22
Units Sold at Start of This Period 150 103 28 20 13 6
Sold/Pre-Sold Unit Closings This Period 85 75 8 7 7 6
Units Sold But Not Closed at End of Period 65 28 20 13 6 0
Total Units Remaining in Inventory 103 28 20 13 6 0
ARV/Lot - Pending Sales Expected to Close $0 $0 $0 $0 $0 $0
ARV/Unit - Unsold Units $1,731,936 $1,731,936 $1,744,926 $1,758,012 $1,771,198 $1,784,482
Unit Price Appreciation Per Period 0.00% 0.00% 0.75% 0.75% 0.75% 0.75%
TO TAL SELLO UT REVENUES
Contracted Sale Units Expected to Close $147,214,560 $129,895,200 $13,959,404 $12,306,087 $12,398,383 $10,706,889
LESS: SELLO UT EXPENSES
Commissions on Pre-Sold Units 3.0% $4,416,437 $3,896,856 $0 $0 $0 $0
Commissions on Additional Unit Sales 6.0% $0 $0 $837,564 $738,365 $743,903 $642,413
Marketing Costs (% of Unsold Unit Values) 0.5% $891,947 $242,471 $0 $0 $0 $0
Admin. & Closing Costs on Unit Sales 1.5% $2,208,218 $1,948,428 $209,391 $184,591 $185,976 $160,603
Taxes on Remaining Unsold Unis (1) $132,767 $37,175 $26,553 $17,260 $7,966 $0
HOA Dues on Remaining Unit Inventory (2) $780,843 $212,268 $151,620 $98,553 $45,486 $0
Total Sellout Expenses $8,430,212 $6,337,198 $1,225,128 $1,038,769 $983,331 $803,016
NET SALE PRO CEEDS FRO M UNIT SALES $138,784,348 $123,558,002 $12,734,276 $11,267,318 $11,415,052 $9,903,873
Risk/Opportunity Cost on Pre-Sold Units 5.0% $7,360,728 $6,494,760 $0 $0 $0 $0
Risk/Opportunity Cost on Remaining Units 15.0% $0 $0 $2,093,911 $1,845,913 $1,859,757 $1,606,033
LESS: TOTAL RISK ASSESSED $7,360,728 $6,494,760 $2,093,911 $1,845,913 $1,859,757 $1,606,033
NET CASH FLO W $131,423,620 $117,063,242 $10,640,365 $9,421,405 $9,555,295 $8,297,840
PRESENT VALUE FACTOR 8.0% 0.980392 0.961169 0.942322 0.923845 0.905731 0.887971
NET PRESENT VALUE $128,846,666 $112,517,559 $10,026,650 $8,703,918 $8,654,527 $7,368,241
TO TAL NET PRESENT (MARKET) VALUE $276,117,561
RO UNDED $276,120,000
PER UNIT $1,468,723

MULTIFAMILY RESIDENTIAL SITE, 1174-1185 HILLSBORO MILE, HILLSBORO BEACH, FL
202121 REPORT
ATLANTIC BLUE CONSULTING, INC. SECTION III VALUATION 54
of development costs for each project was the Marshall Valuation Service (Marshall), an
authoritative guide for developing such costs for buildings and other improvements. Other
ancillary costs were obtained from market sources. When the cost of the site is added to each
total, the result can be compared to the estimated Prospective Market Value under each
Development Scenario; the difference exhibits that potential entrepreneurial profit to a developer
under each Development Scenario.
It is important to note the reasoning for the use of the data from Marshall for application
to the proposed building and site improvements in each Scenario. For ultra-luxury multifamily
residential developments such as those proposed or possible at the subject, the actual costs may
vary based on the contractor used (construction bids will vary from contractor to contractor on
the same project), additional unforeseen indirect costs, etc. Additionally, the Coronavirus
Pandemic caused a halt in economic activity, which is resuming as of August 2021. This caused
a temporary surge in prices for labor and some materials as there was pent-up demand or a
temporary lag in production and delivery. In order to avoid these or other variances that may
occur from project to project or developer to developer, data from Marshall provides the best
“apples-to-apples” comparison of market-oriented costs to the building and site costs for the
development of the subject under each of the two Development Scenarios presented herein.
The cost of land is also an expense that must be incurred and used as a test of
profitability for a proposed development. On December 21, 2016, the subject property was
acquired by Dezer Hillsboro, LLC from Enclave at Hillsboro, LLC, for a price of $28.5 million.
Four years later, or on December 4, 2020, Dezer Hillsboro, LLC sold the subject to Hillsboro
Mile Property Owner, LLC, for a price of $30 million. The address of the buyer in the 2020 sale
of the property matches the corporate office address for The Related Group, a local developer. It
is the appraiser’s understanding that this was not a true “arm’s-length” sale of the property as
Related and Dezer are planning a development of the subject property. Nonetheless, this $30
million represents the current land cost to for the development of the subject under either
Development Scenario.

MULTIFAMILY RESIDENTIAL SITE, 1174-1185 HILLSBORO MILE, HILLSBORO BEACH, FL
202121 REPORT
ATLANTIC BLUE CONSULTING, INC. SECTION III VALUATION 55
High-Rise Scenario
Costs in Marshall include all direct building and site improvement costs for various types
of structures, and some indirect costs but excluding taxes, marketing costs, financing costs and
other local fees. Cost data for Luxury Apartments from this source was used for the tower
building improvements on Parcel B including the living area of the dwelling units plus common
space for lobbies, amenities, common corridors, etc. provided by the plans by ARQ. The costs
for the nine detached villa units was acquired from data for luxury single-family homes from
this source, with the costs for the amenity building on Parcel A pulled from costs for
Clubhouses. In each case, the base cost per square foot was obtained for the best-quality type of
each structure type from Marshall; this is consistent with the ultra-luxury features and finish
planned for the property’s development consistent with an average retail sale price of
$3,764,860 per unit.
These base costs were adjusted for various factors such as the developer finish for the
dwelling units (not including finished flooring in living, dining and bedroom areas) consistent in
this market, and for fire safety/sprinkler systems. Various appropriate multipliers were applied
from the Marshall data resulting in a total base cost for the building improvements at this
property.
To this total, the cost of unit balconies, the built-in two-car garages for the villa units,
and the rooftop pools and built-up rooftop decks for the top-floor tower units, the villas and the
amenity building were added along with exterior common deck areas and for impact glass and
other hurricane protection for properties in Palm Beach County. These costs were estimated
based on historic costs at such properties and from data indicated by Marshall. The addition of
these items provided for total costs for the subject’s building structures.
Site costs were obtained from Yard and Subdivision costs noted in Marshall and using
the green coverage and other areas from the plans by ARQ (when available). These include
costs to rebuild the seawall along the Intracoastal Waterway; this can be quite costly, and it
includes providing an inlet in the northwest corner of Parcel A. Personal property, including a
high-end kitchen appliance package for the unit kitchens and the amenity building, is also
provided along with furnishings for the common and operational areas including the tower

MULTIFAMILY RESIDENTIAL SITE, 1174-1185 HILLSBORO MILE, HILLSBORO BEACH, FL
202121 REPORT
ATLANTIC BLUE CONSULTING, INC. SECTION III VALUATION 56
building lobbies, the amenities building, fitness equipment, pool furniture, and office and
maintenance equipment for staff working for the condominium association.
Finally, additional indirect cost items not included with Marshall were estimated.
Altogether, this calculates to a total estimated construction costs for the site and building
improvements proposed under the High-Rise Scenario of $255,460,000 (rounded):

MULTIFAMILY RESIDENTIAL SITE, 1174-1185 HILLSBORO MILE, HILLSBORO BEACH, FL
202121 REPORT
ATLANTIC BLUE CONSULTING, INC. SECTION III VALUATION 57
Gro s s B uild ing A re a to Hig h-R is e R e s ide nt ia l (S F ) 5 17 ,6 9 5
Gro s s B uild ing A re a o f Hig h-R is e Ga ra g e (S F ) 18 7 ,0 3 6
N um be r o f Hig h-R is e Units 112
Gro s s B uild ing A re a to Villa Units (S F ) 3 3 ,9 2 0
N um be r o f Villa Units 9
C o m po ne nt A m e nity B ldg . Ga ra g e Villa Units Luxury A pts .
C la s s / Type C la s s C / Exc e lle nt C la s s A -B C la s s C / VI C la s s A / Go o d
S e c t io n/ P a g e N o . 11/ 3 0 11/ 19 12 / 2 7 11/ 15
D a ta D a te N o v . 2 0 2 0 N o v . 2 0 2 0 A ug . 2 0 2 0 N o v . 2 0 2 0
Bas e Co s t P er SF $ 206.00 $ 112.00 $ 510.00 $ 283.00
Adjus t fo r Lack o f F inis hed Flo o ring $ 0.00 $ 0.00 ($ 20.00) ($ 20.00)
Adjus t fo r Sprinkle r Sys tem $ 4.00 $ 2.00 $ 4.25 $ 2.00
A djus te d B a s e C o s t P e r S F $ 2 10 .0 0 $ 114 .0 0 $ 4 9 4 .2 5 $ 2 6 5 .0 0
Adjus tments :
Area Multiplie r (Avg.) 1.000 1.000 1.000 1.000
Sto ry Height Multiplie r 1.000 0.973 1.000 1.000
Building Height Multiplie r 1.000 1.000 1.000 1.060
Current Multiplie r 1.11 1.11 1.10 1.11
Lo cal Multiplie r 0.91 0.91 0.91 0.91
A djus te d B a s e C o s t $ 2 12 .0 0 $ 112 .0 0 $ 4 9 5 .0 0 $ 2 8 4 .0 0
SF o f Building Area 9,294 187,036 33,920 517,695
To ta l B a s e C o s t - P e r C o m po ne nt $ 1,9 7 0 ,3 2 8 $ 2 0 ,9 4 8 ,0 3 2 $ 16 ,7 9 0 ,4 0 0 $ 14 7 ,0 2 5 ,3 8 0
To ta l B a s e C o s t - A ll B uild ing s $ 18 6 ,7 3 4 ,14 0
Add:
$ 2,800,000
Ro o fto p P o o ls & Built-Up Ro o f Decks (P entho us es , Villas & Amenity Bldg.) $ 2,700,000
Exterio r Co mmo n Area Decks $ 1,000,000
Villa Garages $ 250,000
Hurricane P ro tec tio n/Impact Windo ws $ 12,100,000
To ta l D ire c t C o s ts - B uild ing S truc ture s $ 2 0 5 ,5 8 4 ,14 0
To ta l S ite Impro vements
Villa Unit P a tio s $ 150,000
Gro und Level Swimming P o o ls - High Ris e $ 200,000
Gro und Level Swimming P o o ls - Villa Units & Amenity Building $ 500,000
Tennis Co urts & P avilio n $ 400,000
Intraco as ta l Do cks & Seawall $ 5,000,000
P aved Driveways & Exterio r P arking $ 2,000,000
Beach Acces s P a thway $ 250,000
Tro pica l Lands caping $ 2,000,000
Lands caping Irriga tio n Sys tem $ 400,000
To ta l S ite Im pro v e m e nts $ 10 ,9 0 0 ,0 0 0
To ta l P ers o na l P ro perty
Res identia l Unit & Amenity Building Appliances $ 1,225,000
Lo bby, Recrea tio n/Gym, P o o l, Office & Maintenance $ 500,000
To ta l P e rs o na l P ro pe rty $ 1,7 2 5 ,0 0 0
To ta l D ire c t C o s ts $ 2 18 ,2 0 9 ,14 0
Additio na l Indirec t Co s ts
Taxes During Co ns truc tio n $ 1,250,000
Impact/Tap Fees $ 3,500,000
Marke ting $ 5,000,000
A ddit io na l Indire c t C o s t To ta l $ 9 ,7 5 0 ,0 0 0
Financ ing Co s ts
Inte res t Res erve $ 25,000,000
Financ ing Fees $ 2,500,000
F ina nc ing C o s t To ta l $ 2 7 ,5 0 0 ,0 0 0
To ta l D ire c t & Indire c t C o s t Via M a rs ha ll $ 2 5 5 ,4 5 9 ,14 0
R o unde d $ 2 5 5 ,4 6 0 ,0 0 0
P e r Unit $ 2 ,111,2 3 3
High-Ris e Unit Balco nies

MULTIFAMILY RESIDENTIAL SITE, 1174-1185 HILLSBORO MILE, HILLSBORO BEACH, FL
202121 REPORT
ATLANTIC BLUE CONSULTING, INC. SECTION III VALUATION 58
Low-Rise Scenario
The costs from Marshall are also primarily used to estimate the building and site costs
for the appraised subject considering the improvements that may occur in this Development
Scenario. The average retail price per unit in the Low-Rise Scenario is estimated to be
$1,731,936, thus the highest-quality luxury multifamily residential (low-rise) building costs
were used in this analysis. The gross building area for the building improvements could be
calculated from the subject’s site size and the zoning restrictions that are in place for this
property. It includes the living areas for the dwelling units plus common areas that would
include a clubroom, fitness center, and other common amenities for residential as well as space
for lobbies, common corridors, etc. However, the square footage of the garage that would
accompanying this low-rise development is unknown; therefore, these costs were provided as a
lump sum figure based on those from the High-Rise Scenario but considering a garage with 376
spaces (2 per dwelling unit) rather than 232 spaces.
The cost of unit patios or balconies was added to that total, along with the cost of
hurricane protection elements. Elevator costs were also added as Marshall’s Section 12 base
costs for low-rise multifamily residential buildings did not include the cost of elevators.
Site costs were similar to those for the development in the High-Rise Scenario, although
there would likely be only one or two swimming pools with pool decks (one on each Parcel) in
the Low-Rise Scenario. The seawall costs would be the same under both Development
Scenarios. Personal property costs include a high-end kitchen appliance package for the
dwelling units and the property’s common clubroom, along with furniture and equipment for
reduced lobby areas and the number of pools requiring pool furniture.
Additional indirect costs were also included including taxes, marketing, impact fees
and financing costs. This provides for cumulative building and site costs for the property
under the Low-Rise Scenario of $157,660,000 (rounded), as presented below: (rounded):

MULTIFAMILY RESIDENTIAL SITE, 1174-1185 HILLSBORO MILE, HILLSBORO BEACH, FL
202121 REPORT
ATLANTIC BLUE CONSULTING, INC. SECTION III VALUATION 59
Gro s s B uild ing A re a to Lo w-R is e R e s ide nt ia l (S F ) 5 3 8 ,2 6 3
Gro s s B uild ing A re a o f Hig h-R is e Ga ra g e (S F ) N / A
N um be r o f Lo w-R is e Units 18 8
N o . o f Ga ra g e P a rking S pa c e s (2 pe r Unit ) 3 7 6
C o m po ne nt Ga ra g e ; Luxury M F R
C la s s / Type Lum p S um C la s s C / Exc e lle nt
S e c t io n/ P a g e N o . B a s e d o n 12 / 16
D a ta D a te Hig h-R is e C o s t A ug . 2 0 2 0
Bas e Co s t P er SF $ 149.00
Adjus t fo r Lack o f F inis hed Flo o ring ($ 20.00)
Adjus t fo r Sprinkle r Sys tem $ 2.00
A djus te d B a s e C o s t P e r S F $ 13 1.0 0
Adjus tments :
Area Multiplie r (Avg.) 1.000
Sto ry Height Multiplie r 1.000
Building Height Multiplie r 1.000
Current Multiplie r 1.10
Lo cal Multiplie r 0.91
A djus te d B a s e C o s t $ 13 1.0 0
SF o f Building Area 538,263
To ta l B a s e C o s t - P e r C o m po ne nt $ 3 0 ,0 0 0 ,0 0 0 $ 7 0 ,5 12 ,4 5 3
To ta l B a s e C o s t - A ll B uild ing s $ 10 0 ,5 12 ,4 5 3
Add:
$ 4,700,000
Eleva to rs $ 200,000
Hurricane P ro tec tio n/Impact Windo ws $ 15,000,000
To ta l D ire c t C o s ts - B uild ing S truc ture $ 12 0 ,4 12 ,4 5 3
To ta l S ite Impro vements
Co mmo n Swimming P o o l & P o o l Deck $ 100,000
Intraco as ta l Do cks & Seawall $ 5,000,000
P aved Driveways & Exterio r P arking $ 2,000,000
Beach Acces s P a thway $ 250,000
Tro pica l Lands caping $ 2,000,000
Lands caping Irriga tio n Sys tem $ 400,000
To ta l S ite Im pro v e m e nts $ 9 ,7 5 0 ,0 0 0
To ta l P ers o na l P ro perty
Res identia l Unit & Amenity Building Appliances $ 1,900,000
Lo bby, Recrea tio n/Gym, P o o l, Office & Maintenance $ 350,000
To ta l P e rs o na l P ro pe rty $ 2 ,2 5 0 ,0 0 0
To ta l D ire c t C o s ts $ 13 2 ,4 12 ,4 5 3
Additio na l Indirec t Co s ts
Taxes During Co ns truc tio n $ 1,250,000
Impact/Tap Fees $ 3,500,000
Marke ting $ 4,000,000
A ddit io na l Indire c t C o s t To ta l $ 8 ,7 5 0 ,0 0 0
Financ ing Co s ts
Inte res t Res erve $ 15,000,000
Financ ing Fees $ 1,500,000
F ina nc ing C o s t To ta l $ 16 ,5 0 0 ,0 0 0
To ta l D ire c t & Indire c t C o s t Via M a rs ha ll $ 15 7 ,6 6 2 ,4 5 3
R o unde d $ 15 7 ,6 6 0 ,0 0 0
P e r Unit $ 1,3 0 2 ,9 9 5
Unit P a tio s & Balco nies

MULTIFAMILY RESIDENTIAL SITE, 1174-1185 HILLSBORO MILE, HILLSBORO BEACH, FL
202121 REPORT
ATLANTIC BLUE CONSULTING, INC. SECTION III VALUATION 60
POTENTIAL PROFIT ANALYSIS
A net present (market) value, also known as the Prospective Market Value for each of
the two Development Scenarios, was estimated if each development were completed as of the
current valuation date of August 8, 2021. Development costs under each Scenario were
primarily provided by the Marshall Valuation Service, an authoritative guide for developing
such costs for buildings and other improvements. Other ancillary costs were obtained from
market sources, and the developers’ cost of the site was also obtained. These resulting costs
can be compared to the estimated Prospective Market Value (if completed) under each
Development Scenario; the difference exhibits that potential entrepreneurial profit to a developer
under each Development Scenario, and is illustrated in the table below:
The entrepreneurial profit, as a percentage of total development costs, is estimated to be
37% in the High-Rise Scenario, and 47% in the Low-Rise Scenario. This provides for ample
financially feasibility for development of the subject under either Scenario. However, a greater
total amount of profit may be realized under the High-Rise Scenario; this entrepreneurial profit
estimate is $16,960,000 greater than that estimated in the Low-Rise Scenario.
Development Scenario High-Rise Low-Rise
Prospective Market Value If Completed $390,880,000 $276,120,000
Less Development Costs
Land Cost $30,000,000 $30,000,000
Building & Site Improvement Cost $255,460,000 $157,660,000
Total Development Cost $285,460,000 $187,660,000
Entrepreneurial Profit $105,420,000 $88,460,000
Profit as a Percentage of Total Costs 37% 47%

A D D E N D A

EXHIBIT A
Exhibit A
Subject Property Photographs
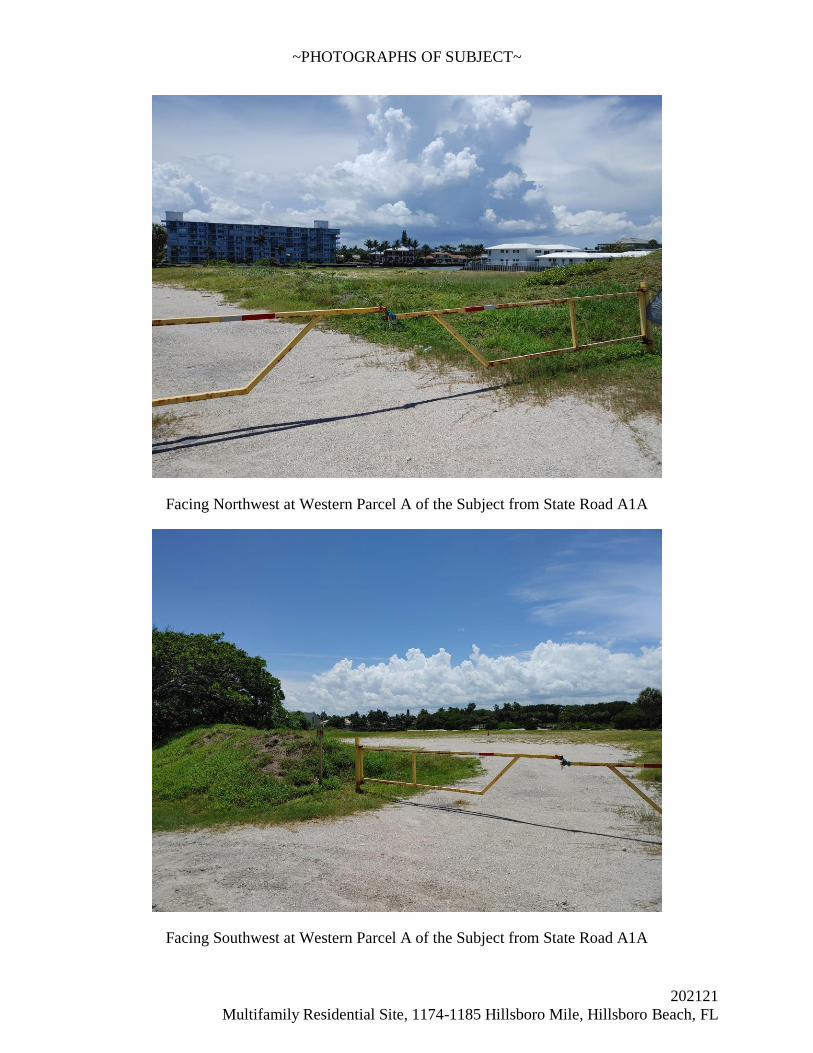
~PHOTOGRAPHS OF SUBJECT~
202121
Multifamily Residential Site, 1174-1185 Hillsboro Mile, Hillsboro Beach, FL
Facing Northwest at Western Parcel A of the Subject from State Road A1A
Facing Southwest at Western Parcel A of the Subject from State Road A1A

~PHOTOGRAPHS OF SUBJECT~
202121
Multifamily Residential Site, 1174-1185 Hillsboro Mile, Hillsboro Beach, FL
Facing Northeast at Eastern Parcel B of the Subject from State Road A1A
Facing Southeast at Eastern Parcel B of the Subject from State Road A1A

~PHOTOGRAPHS OF SUBJECT~
202121
Multifamily Residential Site, 1174-1185 Hillsboro Mile, Hillsboro Beach, FL
View of the Center Interior of Eastern Parcel B Toward the Coastal Construction Line

EXHIBIT B
Exhibit B
Broward County Regional Analysis

BROWARD COUNTY REGIONAL ANALYSIS OVERVIEW
Overview
Broward County, on Florida's southeastern coast, encompasses 1,197 square miles with 23
miles of Atlantic Ocean beachfront and 300 miles of navigable waterways. The county includes 31
incorporated municipalities, of which Fort Lauderdale is the largest, followed by Pembroke Pines,
Hollywood and Pompano Beach. Broward is bounded on the west by Florida’s Everglades
(occupying 2/3 of the county) and the Atlantic Ocean to the east. It is part of the tri-county South
Florida region which includes Palm Beach County to the north and Miami-Dade County to the
south, with a total combined regional population exceeding 6.2 million as of 2019.
The following regional analysis provides much of the data occurring during the past decade
until the onset of the Coronavirus Pandemic in Broward County in March 2020. In some areas of
the underlying economy, the adverse effects of the Pandemic on social, medical and economic
conditions are known and reported by third-party sources. Otherwise, a broader description of the
Pandemic and its effects are presented below:
Transportation
Four interstate highways along with Florida’s Turnpike are integrated into the local street
network of Broward County. The County is dissected north/south by Interstate 95 (I-95) and
Florida's Turnpike. Other major north-south thoroughfares include A1A, Federal Highway (US 1),
State Road 7 (SR 7/US 441), and University Drive (State Road 817). In addition, Interstate 75 (I-
75) provides a link from its interchange with Interstate 595 (I-595) and the Sawgrass Expressway
into Miami-Dade County and access across the peninsula to the west coast of Florida. The
Sawgrass Expressway, a 23-mile toll road, traverses the western edge of Broward County from the
I-75/I-595 interchange northward to Coral Springs and then eastward to Deerfield Beach east of
Florida’s Turnpike. In addition, I-595 provides east/west corridor access from I-75 and the
Sawgrass Expressway on the west to Port Everglades and Fort Lauderdale/Hollywood International
Airport and US 1 to the east.
The Tri-Rail commuter rail system links Miami-Dade, Broward and Palm Beach Counties.
Stations are located as far north as Okeechobee Boulevard (in Palm Beach County) and extend to
Miami International Airport. Florida East Coast Industries started the Brightline, a high-speed rail
service along its rail right-of-way with connections that will eventually carry passengers between

Miami and Orlando in just over three hours. The route and stations are now operating between the
downtown areas Miami and West Palm Beach, with a stop in downtown Fort Lauderdale. New
stations were recently announced for Boca Raton, Port Miami and Aventura, while Disney recently
negotiated a further expansion of this rail line to its Central Florida theme parks. Brightline shut
down operations in 2020 due to the Coronavirus Pandemic, but continues to work on new stations
and expansion indicating its intent to return in the Fall of 2021 as economic activity is anticipated to
return to normal levels.
The Seaboard Coastline and Florida East Coast Railroads provide freight service in the
County. Greyhound and Trailways provide intra- and intercity bus service for passenger and freight
traffic. The Broward County Transit Authority provides public bus service throughout the county
and has recently introduced limited stop services along the busy US 1 and US 441 routes.
The Fort Lauderdale/Hollywood International Airport (FLL) was the 18th busiest airport in
the U.S. in passenger traffic in 2019. That year, there were more than 350 daily departures to 84
U.S. cities and 33 countries. In 2019, FLL generated over 255,000 direct and indirect jobs and had
an annual economic impact of $37.5 billion. Passenger traffic growth at FLL was strong through
2019, as noted in the following table:
With the onset of the Coronavirus Pandemic in March 2020 in Broward County, these
numbers tumbled to just over 100,000 passengers handled at FLL in April of that year. With more
Americans getting vaccinated in the first months of 2021, it is expected that passenger numbers will
slowly recover at FLL. Although passenger totals for the first four months of 2021 remain lower
than the same period in 2020, that period in 2020 included the months of January and February or
before the Pandemic began to adversely affect these figures.
International Total
Passengers % of Passengers %
Period (000s) Total (000s) Change
2014 4,660 18.9% 24,648
2015 5,500 20.4% 26,941 9.3%
2016 6,055 20.7% 29,205 8.4%
2017 7,183 22.1% 32,511 11.3%
2018 8,608 23.9% 35,963 10.6%
2019 8,844 24.1% 36,748 2.2%
2020 3,122 18.9% 16,484 -55.1%
YTD Apr. 2019 973 7.4% 13,107
YTD Apr. 2020 1,940 22.6% 8,570 -34.6%
YTD Apr. 2021 3,131 39.7% 7,885 -8.0%

Located just west of Federal Highway (US 1) and south of I-575, the airport is in the center
of a unique multi-modal transportation complex. The combination of two railroads on either side,
the Airport, a deep-water seaport (the Port of Everglades, just two miles north and east from the
airport), and the highway system network (including I-95 and I-595 linking to Florida’s Turnpike)
provide easy access to Miami, West Palm Beach and other destinations in South and Central
Florida.
Port Everglades, the largest seaport on Florida's lower east coast (2,190 acres including 448
acres of submerged land), is located at the adjoining city limits of Fort Lauderdale, Hollywood, and
Dania Beach. Port Everglades generated more than $32 billion worth of economic activity in 2019,
and generated more than 230,000 jobs statewide. The port generated the highest revenues of any
seaport in Florida at more than $170 million, up from just over $153 million in fiscal year 2015.
The seaport handled nearly 6.8 million TEUs (20-foot equivalent units, the standard measurement
for containers) in fiscal year 2019 and while the number of TEUs handled rose from about that
figure in fiscal year 2015, the Pandemic adversely affected the total TEUs handled in 2020,
dropping that number to just over 5.7 million for fiscal year 2020.
Port Everglade’s cruise port handled nearly 3.9 million passengers in fiscal year 2019, up
from 3.78 million in fiscal year 2015. However, this total plummeted by zero passengers by April
2020 due to the onset of the Coronavirus Pandemic in Broward County the previous month. Since
then and through September 2020, there were only 1,644 passengers handled in July 2020. For all
of fiscal year 2020, almost 2.54 million passengers were noted at this cruiseport facility.
Port Everglades has a $1.6 billion expansion underway that are expected to be completed by
2025. This includes a $471 million cargo berth expansion, deepening the port’s navigation channels
from 42 to 48-50 feet, addition a cruise port parking garage, two new logistical centers with more
than 300,000 square feet, and petroleum slip improvements.
Population
Data pertaining to population growth in Broward County, the State of Florida and the United
States are summarized in the following table.

Year Broward County Florida
2000 1,623,106 15,982,813
2010 1,748,146 18,804,564
2019 Est. 1,952,778 21,477,737
According to the U.S. Census Bureau, Broward County’s population grew by 11.7% from
2010 to 2019, which is slower than the statewide growth rate of 14.2% during this period but still
quite healthy. Future growth is also limited by natural boundaries that include the Atlantic Ocean to
the east and the environmentally-protected Everglades to the west of U.S. Highway 27 and the
Sawgrass Expressway. Over the last decade, development growth in Broward County began to
reach its western-most boundary, creating a “barrier-to-entry” market for future development that
will continue to limit population growth.
Economic Fundamentals
The Broward County economy has historically depended on tourism, retirees and
construction. During the 1980s, the County began to develop a manufacturing base (non-
construction) which diversified the local economic structure. During the last three decades,
Broward County’s employment has shifted significantly toward services of businesses and residents
while also meeting the increasing demand for education and health services. Manufacturing has
followed the national and statewide trend of declining employment while the population-driven
construction industry continued to show significant long term strength. The largest employment
gains in Broward County’s private sectors from 2000-2010 were in the professional and business
services sector. As of 2019, the largest employment sectors in Broward County were office and
Administrative Support, Sales, Food Preparation and Serving, Transportation and Material Making,
Healthcare, and Business and Financial Services.

Source: Florida Research & Economic Information Database Application
Tourism continues to play a major role in Broward County’s economy, and-generated tax
revenues totaling $86.9 million in 2018, a 33.5% increase over the previous year. According to the
Greater Fort Lauderdale Convention and Visitors Bureau, hotel revenues were 1.3 billion that
year, with over 8.88 million overnight stays. The Greater Fort Lauderdale/Broward County
Convention Center, located adjacent to Port Everglades, is currently undergoing a $1 billion
expansion to 1.2 million square feet that will include a 350,000-square foot exhibit hall, a 65,000-
square foot ballroom, 50,000 square feet of meeting space, and an 800-room convention center
headquarter hotel under the Omni flag.
The regional hospitality market experienced a very strong February 2020 performance that
was enhanced by the staging of the Super Bowl in neighboring Miami-Dade County. However,

with the onset of the Coronavirus Pandemic in March 2020, the hotel/hospitality industry was
perhaps the hardest hit among all economic and employment sectors in Broward County. Total
employment in the county’s hospitality industry fell from nearly 100,000 in February 2020 to just
over half that total in May 2020. Since some re-openings have occurred, this figure has climbed but
still remains much lower at just over 68,000 employed in September 2020. Hotel occupancy in
September 2020 was down nearly 25% from the same period last year, with rates falling by more
than 9% and RevPAR (Revenues Per Available Room) down more than 30% during this period.
The Great Recession that occurred in 2008-2010, and its accompanying housing market
crash, hit the county very hard and unemployment rates hovered over 9%. Statistics since 2012
show significant improvement with rates dropping to 5.1% in 2015 and 3.0% by 2019. The decline
came despite an increase in job seekers as the long term unemployed rejoin the ranks. In Broward
County nearly 130,000 new positions were added in 2019.
With the outbreak of the Coronavirus in the U.S. in mid-March 2020, businesses closed and
unemployment soared upward on all levels (U.S., Florida and locally). These trends in the
unemployment rate are presented in the next table:
Date
Unemployment
Rate
Florida
Unemployment
Rate
Broward County
February 2020 2.8% 2.9%
May 2020 13.5% 15.2%
May 2021 4.9% 5.2%
Since unemployment peaked in the Spring of 2020, some businesses have been allowed
to re-open and hire employees back, while others found work elsewhere. This eased the
unemployment rate back into single digits near the end of 2020, but still above rates seen over
the past several years.
Broward County’s economy is concentrated in the service sectors proportionate to the
national economy. Employment projections indicate the most rapid growth is expected in the
services industry. Services and trade should continue to serve as the backbone of the Broward
County economy. Business firms find that Florida, in general, and Broward County, in
particular, offer a favorable business climate. Florida's corporate income tax rate is ranked one of
the lowest in the nation, and the state has no city or state personal income tax . The local tax
structure places the county in a position of competitive strength when compared with other markets

in the nation. Officials have the authority to provide many business incentives. Below is a list of
major private-sector employers in Broward County in 2019.
Rank Employer Employees Product/Service
1 Nova Southeastern University 6,234 Higher Education
2 First Service Residential 5,400 Real Estate Management
3 HEICO 4,532 Aviation Equipment
4 Spirit Airlines 3,790 Airline
5 American Express 3,500 Financial Services & Travel
6 AutoNation 3,000 Automotive Retailer
7 Mednax 2,636 Healthcare Services
8 UKG 1,800 Computer Software
9 The Castle Group 1,790 Real Estate
10 JM Family Enterprises 1,719 Automotive Retailer Source: Greater Fort Lauderdale Alliance
The largest number of public sector employees in the county can be found at the Broward
County Schools (34,218), Broward County government (12,787), and the Memorial Healthcare
System (11,200).
The median household income for Broward County for 2019 was estimated to be $48,240.
Conclusion
Broward County is at the center of a tri-county regional market whose population passed 6.2
million persons in 2019. Employment and income growth continued in this market after the
recovery from the effects of the Great Recession from 2008-2010, with rising visitation in this
popular tourist destination. This fueled demand for different types of real estate in this market
including residential, commercial, industrial and hospitality.
However, the outbreak of the Coronavirus Pandemic in March 2020 caused a severe retreat
in the previously-occurring economic activity in the region including Broward County. Businesses
were forced to close through May of that year, causing a sharp rise in unemployment. Most
business activity has been allowed to resume, providing for a reduction in unemployment but
hospitality businesses such as hotels, restaurants, air and cruise lines were especially hard hit.
While the county’s underlying economic fundamentals and infrastructure have a solid base, a full
recovery is not expected until the underlying adverse effects on the social, health and economic
caused by the Pandemic can be extensively resolved.

EXHIBIT C
Exhibit C
High-Rise Scenario Architectural Plans by ARQ

EXHIBIT C
Architectural Plans considered in this report are from Arquitectonica, a Miami-based
architectural firm, and are dated July 29, 2021. They include an ALTA site survey by
Schebke Shiskin dated dated July 14, 2021. Both were relied upon in the analysis of the
subject considering its High-Rise Scenario of development as outlined in this report. A
copy of these architectural plans and the survey are included in the appraiser’s workfile
for this report as their inclusion in the Addenda of this report was obstructed by the
presence of embedded Signatures in their accompanying PDF file format. The
appraiser has retained a copy of these architectural plans and their accompanying
survey in case the reader of this report requires them in order to understand the
context of the hypothetical High-Rise development contemplated in the analysis
contained herein.

EXHIBIT D
Exhibit D
Engagement Letter

ATLANTIC BLUE CONSULTING, INC. REAL ESTATE ADVISORY & VALUATION SERVICES
July 29, 2021
Mr. Mac Serda, lCMA-CM Town Manager The Town of Hillsboro Beach, FL 1210 Hillsboro Mile Hillsboro Beach, Florida 33062
Dear Mr. Serda:
This letter will serve as my proposal to perform appraisal services and prepare an appraisal of the fee simple interest on the real property referenced as follows:
Description: Approximately 10.4 acres of land straddling State Road AlA, and located at 11 74-1184 Hillsboro Mile in Hillsboro Beach,
Broward County, Florida
Property Tax Folio Numbers (Broward County Property Appraiser): 48-43-08-13-0010 48-43-08-13-0020 48-43-08-13-0012 48-43-08-13-0021 48-43-08-13-0013 48-43-08-13-0022 48-43-08-13-0014 48-43-08-13-0023 48-43-08-13-0015 48-43-08-13-0024 48-43-08-13-0016 48-43-08-13-0030
[ will prepare a PDF copy of an appraisal report that sets forth the analysis, findings and conclusions of Hypothetical Market Value as of the current valuation date, under the valuation Scenarios set forth as fo !lows:
Scenario 1:
Scenario 2:
Hypothetical Market Value of a low-rise (two- to three-story) multifamily residential deve lopment to this property, at its highest and best use. This value assumes that deve lopment of these improvements is complete. Hypothetical Market Value of a high-rise (15 story) multifamily development, if complete. [f developed as a "for-sale" condominium project, this hypothetica l value will represent the net present value of the sellout of the individual residential condominium units.
2000 NORTH BA YSHORE DIUVE # 11 03, MIAM I, FL 33 137 •PHONE (305) 776-6 131

A TLAN11C BLUE CONSULTING, INC. REAL ESTATE ADVISORY & VALUATION SERVICES
Additional scope of work includes estimating the difference between Hypothetical Market Value and cost of the project described in each of the two valuation Scenarios above, including the costs of land, site and building improvement costs. This difference represents the anticipated profit for a speculative developer of the described project in each of these two valuation Scenarios.
Please carefully note that this valuation may not include an "as is" valuation of the property at its highest and best use, as the property is vacant land subject to zoning and other restrictions that currently may or may not allow for development under either hypothetical valuation Scenario stated above.
I understand that the intended use of the appraisal is for in-house decision making by you, the client, in negotiations with potential developers seeking development approvals for this property. The analysis will consider the physical aspects of the property and assess its competitive position in the market. l will employ the traditional valuation techniques considered appropriate to this valuation problem. The analyses and report will be descriptive in the presentation of data and analysis in order to provide the value estimates therein, and conform to the Uniform Standards of Professional Appraisal Practice (USPAP), the Supplemental Standards issued by the Appraisal Institute. [request that the following items (more may be required later) be made available for review at the earliest convenience:
l. The number of residential units and square footage of building area contemplated for development under both valuation Scenarios noted above;
2. Any preliminary site plans for development of the property under either scenario noted above; 3. A survey of the appraised property; 4. Any environmental studies conducted on the property.
I anticipate completion of the assignment within 30 days ofthe receipt of the materials requested above. The total fee will be $6,000 which will be due upon delivery of the written report. The fee for court testimony is based on $250 per hour, including testimony and preparation time. This proposal is submitted based on my current schedule of commitments. It may be necessary to alter the completion date unless the assignment is authorized in the near future. You may authorize this assignment by signing and returning a copy ofthis letter. I thank you for contacting me and I look forward to working with you.
Sincerely,
ATLANTIC BLUE CONSULTING, fNC.
~ J Guthrie (Jay) Mlinar, MAl, SRA President State-Certified General Appraiser RZ1916
Agreed and Accepted The Town of Hillsboro Beach
SigJtattrrL,h . MAf .. ............... . Name /;://,',...~ ;t1. 5=e)),4-
Title /1~c,W-
Date:

EXHIBIT E
Exhibit E
Appraiser’s Qualifications
QUALIFICATIONS
J GUTHRIE (JAY) MLINAR, MAI, SRA
Atlantic Blue Consulting, Inc.
Academic
B.B.A., Southern Methodist University, Dallas, Texas, 1983
Experience
2021-Present: President, Atlantic Blue Consulting, Inc.
2012-2020: Managing Director (since 2019), Blazejack & Co., Miami, FL
1995-2012: Appraiser, Clobus, McLemore & Duke, Inc., Fort Lauderdale, FL
1994-1995: Appraiser, Investors Research Associates, Miami, FL
1993-1994: Appraiser, Cushman & Wakefield, Miami, FL
1991-1993: Appraiser, Bach Thoreen McDermott, Inc., Houston, TX
1988-1991: Appraiser, Georgia Federal Bank, Atlanta, GA
1983-1988: Appraiser, Porcher, Bond, Wilk, Allison, Inc., Dallas TX
1982-1983: Salesperson, Helena Underwood Realtors, Dallas, TX
Mr. Mlinar has been active as a real estate appraiser/analyst on a full-time basis
since 1983. During this period, his real estate experience included highest and best
use and market rent analyses, market studies, consulting and evaluation of
professional and medical office buildings, hotels/motels, apartments, residential and
commercial condominiums, warehouses, vacant land, single-family homes, retail
stores, restaurants, shopping centers, mixed-use projects, golf courses, self-storage
facilities, full-service marinas and special purpose properties.
Since 1993, these assignments were primarily concentrated in South Florida, but
with extensive work also completed on properties located throughout the state and
across the U.S. During his career, Mr. Mlinar has completed appraisals, analyses
and consulting on properties located in 21 states, the U.S. Virgin Islands, and in
Uruguay. Since 2012, Mr. Mlinar most recently worked for Blazejack & Company,
initially as a consultant and was appointed Managing Director of the firm in 2019.
At the end of 2020, Thomas Blazejack retired, and handed the real estate advisory
and valuation functions of Blazejack & Company to Mr. Mlinar, who now provides
those services to their clients under his firm, Atlantic Blue Consulting, Inc.
Designations and Licenses
MAI Member, Appraisal Institute, currently certified
SRA Member, Appraisal Institute, currently certified
Florida State-Certified General Real Estate Appraiser RZ1916
Florida Licensed Real Estate Salesperson SL654868