applying vulnerability assessment tools to plan for climate … · 2014-07-01 · applying...
TRANSCRIPT

Applying Vulnerability Assessment Tools to Plan for Climate Adaptation: Case Studies in the North Pacific LCC
Report to the North Pacific Landscape Conservation Cooperative by Julia L. Michalak, John C. Withey,
and Joshua J. Lawler
March 2014
Introduction
The central objective of this project was to answer two questions: 1) how downscaled climate datasets,
modeled vegetation changes, and information on estimated species sensitivities can be used to develop
climate change adaptation strategies, and 2) how model results and datasets can be made more useful
for informing the management of species and landscapes. To answer these questions, we identified
enthusiastic partners working in two very different complex landscapes within the North Pacific
Landscape Conservation Cooperative (NPLCC): 1) the British Columbia Park system, specifically the mid-
coast region, and 2) the National Wildlife Refuge system in the Willamette Valley, OR. The issues and
concerns of each group were very different both with regard to the types of climate impacts expected,
the ecological systems of concern, and the degree of familiarity with climate adaptation planning. In
addition to these two landscapes, we conducted similar workshops in two landscapes in the Great
Northern LCC: the Columbia Plateau and the Pioneer Mountains - Craters of the Moon. In this report, we
draw on our experiences with these four landscapes to develop a set of “lessons learned” from this
process. Specifically, we will present a list of recommendations for refinement of the Pacific Northwest
Climate Change Vulnerability Assessment (PNWCCVA) data products and key information needs that are
not currently met by these products.
The Case Study Landscapes and Workshops
British Columbia Parks
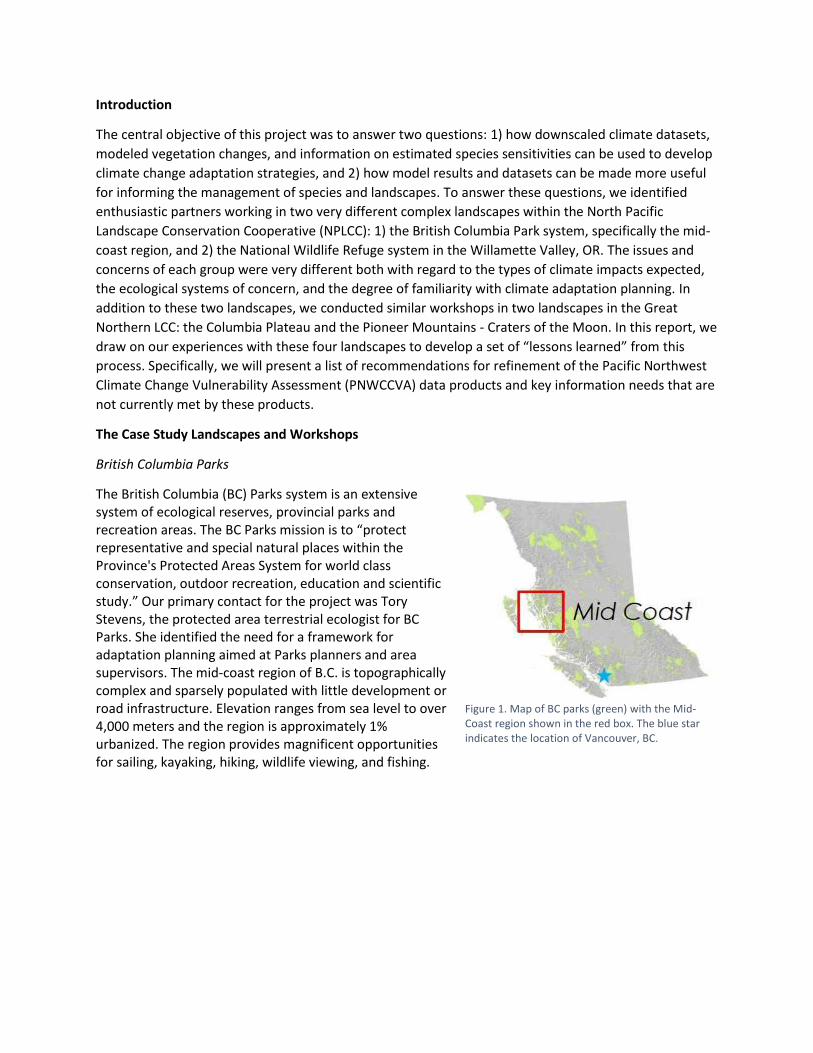
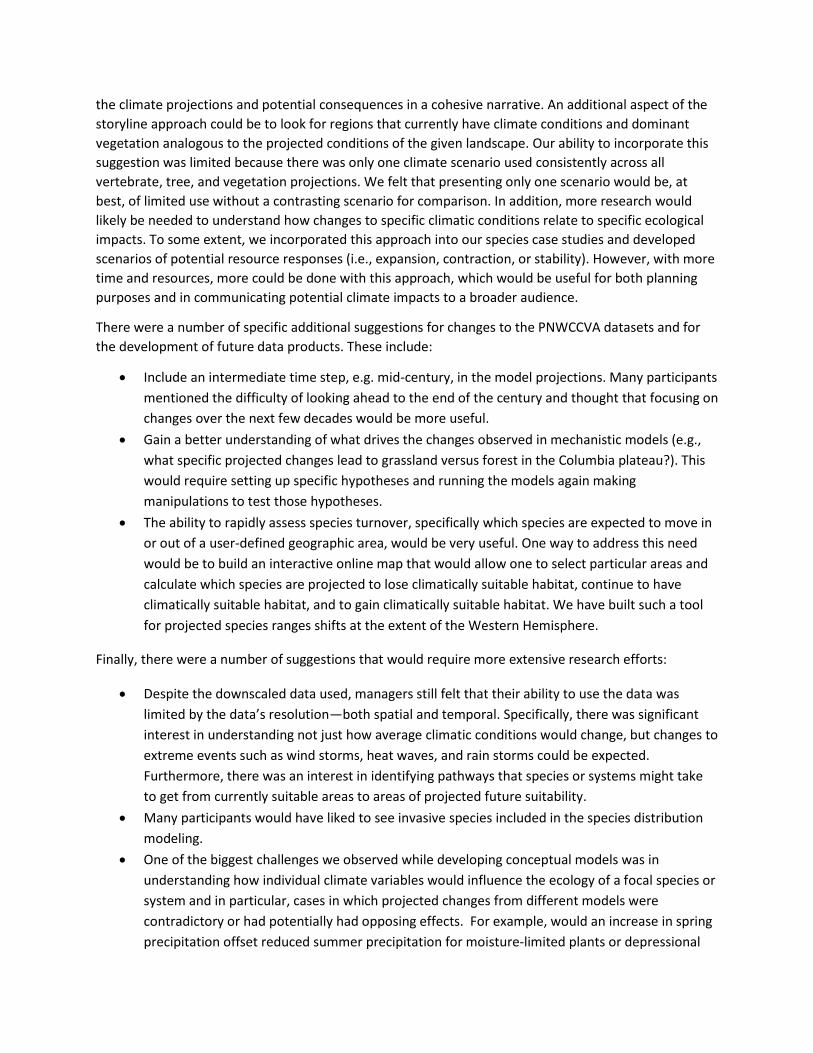
The British Columbia (BC) Parks system is an extensive system of ecological reserves, provincial parks and recreation areas. The BC Parks mission is to “protect representative and special natural places within the Province's Protected Areas System for world class conservation, outdoor recreation, education and scientific study.” Our primary contact for the project was Tory Stevens, the protected area terrestrial ecologist for BC Parks. She identified the need for a framework for adaptation planning aimed at Parks planners and area supervisors. The mid-coast region of B.C. is topographically complex and sparsely populated with little development or road infrastructure. Elevation ranges from sea level to over 4,000 meters and the region is approximately 1% urbanized. The region provides magnificent opportunities for sailing, kayaking, hiking, wildlife viewing, and fishing.
Figure 1. Map of BC parks (green) with the Mid-Coast region shown in the red box. The blue star indicates the location of Vancouver, BC.
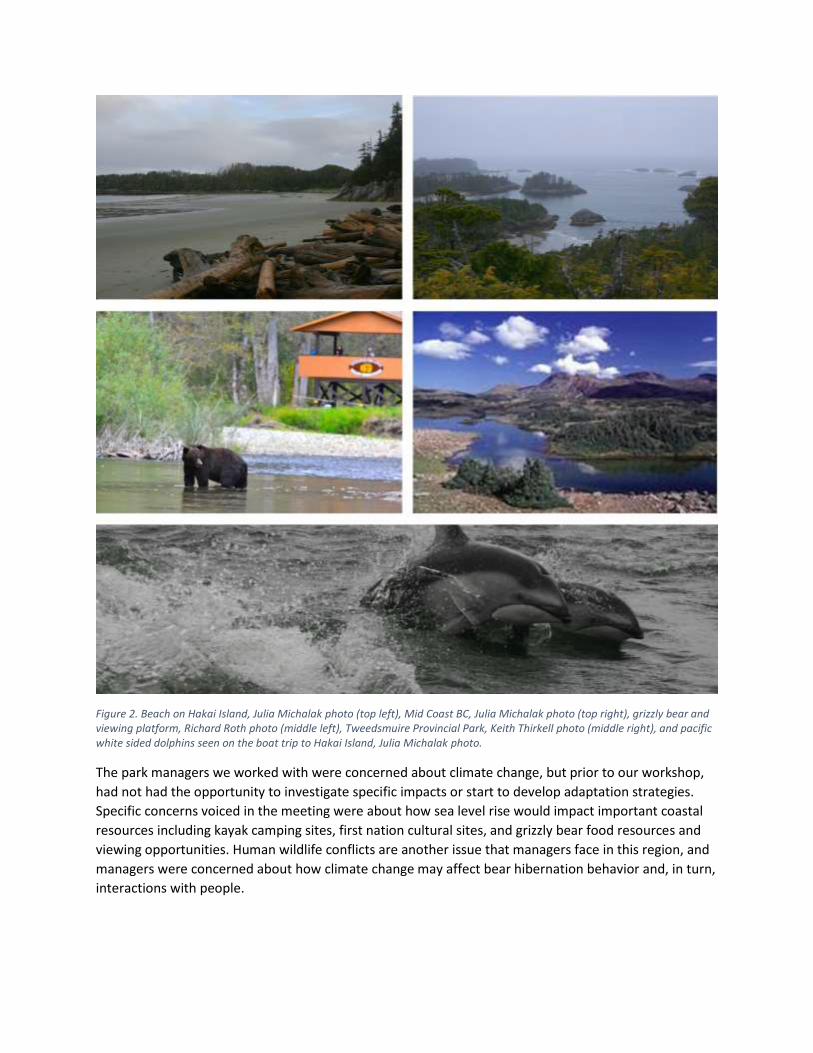
Figure 2. Beach on Hakai Island, Julia Michalak photo (top left), Mid Coast BC, Julia Michalak photo (top right), grizzly bear and viewing platform, Richard Roth photo (middle left), Tweedsmuire Provincial Park, Keith Thirkell photo (middle right), and pacific white sided dolphins seen on the boat trip to Hakai Island, Julia Michalak photo.
The park managers we worked with were concerned about climate change, but prior to our workshop,
had not had the opportunity to investigate specific impacts or start to develop adaptation strategies.
Specific concerns voiced in the meeting were about how sea level rise would impact important coastal
resources including kayak camping sites, first nation cultural sites, and grizzly bear food resources and
viewing opportunities. Human wildlife conflicts are another issue that managers face in this region, and
managers were concerned about how climate change may affect bear hibernation behavior and, in turn,
interactions with people.
List of BC Parks Workshop Participants:
Participant Agency/Organization
Josh Lawler University of Washington Julia Michalak University of Washington Tory Stevens BC Parks, Protected Area Terrestrial Ecologist Steven Hodgson BC Parks, Area Supervisor, Mid Coast Region Bob Fuhrer BC Parks John Sampson Coastal Guardians Watchmen Network
The Willamette Valley
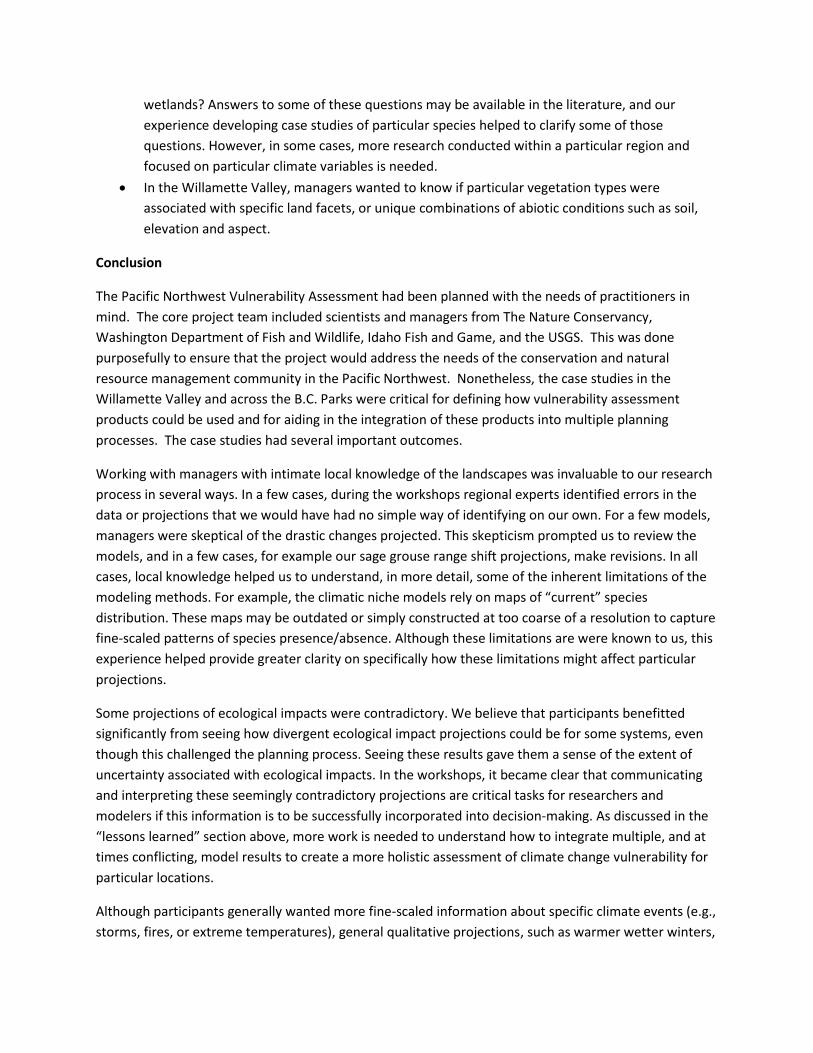
In the Willamette Valley (Oregon), the Fish
and Wildlife Service is coordinating the
Willamette Valley Conservation Study, which
is focused on protecting rare species and
habitats in the valley, connecting people with
nature, and managing human-wildlife
conflicts. One potential avenue for species
conservation in the Valley is to expand the
existing National Wildlife Refuge System. The
Service and their partners were interested in
knowing what data and methods are
available for incorporating climate change
into planning spatial conservation priorities.
Our primary contact was David Patte, the
climate change coordinator for the US Fish
and US Wildlife Pacific Region.
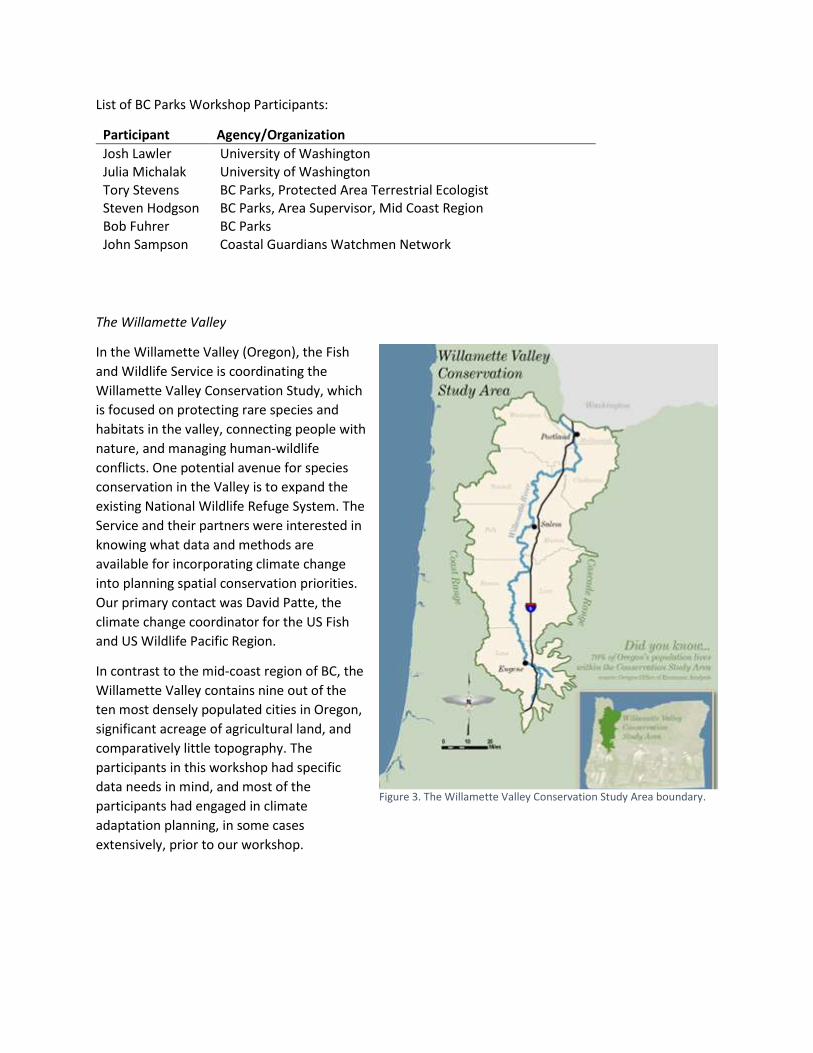
In contrast to the mid-coast region of BC, the
Willamette Valley contains nine out of the
ten most densely populated cities in Oregon,
significant acreage of agricultural land, and
comparatively little topography. The
participants in this workshop had specific
data needs in mind, and most of the
participants had engaged in climate
adaptation planning, in some cases
extensively, prior to our workshop.
Figure 3. The Willamette Valley Conservation Study Area boundary.
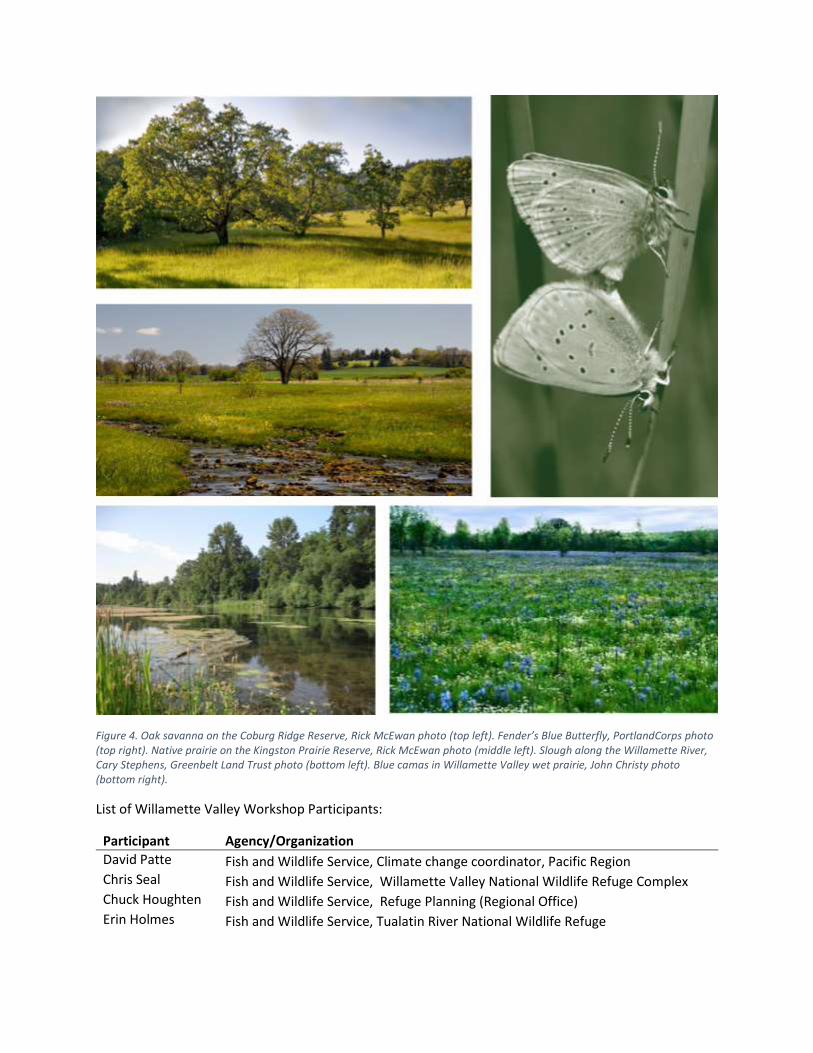
Figure 4. Oak savanna on the Coburg Ridge Reserve, Rick McEwan photo (top left). Fender’s Blue Butterfly, PortlandCorps photo (top right). Native prairie on the Kingston Prairie Reserve, Rick McEwan photo (middle left). Slough along the Willamette River, Cary Stephens, Greenbelt Land Trust photo (bottom left). Blue camas in Willamette Valley wet prairie, John Christy photo (bottom right).
List of Willamette Valley Workshop Participants:
Participant Agency/Organization
David Patte Fish and Wildlife Service, Climate change coordinator, Pacific Region Chris Seal Fish and Wildlife Service, Willamette Valley National Wildlife Refuge Complex Chuck Houghten Fish and Wildlife Service, Refuge Planning (Regional Office) Erin Holmes Fish and Wildlife Service, Tualatin River National Wildlife Refuge

Participant Agency/Organization
Jim Houk Fish and Wildlife Service, Willamette Valley Conservation Study Refuges (Regional Office)
Kate Freund Fish and Wildlife Service Kevin O'Hara Fish and Wildlife Service, Refuge Planning (Regional Office) Mary Mahaffy Fish and Wildlife Service Rowan Baker Fish and Wildlife Service Sam Lohr Fish and Wildlife Service, Columbia River Program Office Fisheries Scott McCarthy Fish and Wildlife Service, Refuge Planning (Regional Office) Sharon Selvaggio Fish and Wildlife Service, Willamette Valley National Wildlife Refuge Complex Stephen Zylstra Fish and Wildlife Service Steve Caicco Fish and Wildlife Service, Refuge Planning (Regional Office) Tom Miewald Fish and Wildlife Service Patrick Crist NatureServe Andrea Hanson Oregon Department of Fish and Wildlife Holly Michael Oregon Department of Fish and Wildlife Jonathon Soll Oregon Metro Lori Hennings Oregon Metro Jimmy Kagan Oregon State University Michael Schindel The Nature Conservancy Steve Buttrick The Nature Conservancy Joshua Lawler University of Washington John Withey University of Washington Julia Michalak University of Washington
Workshop Planning and Approach
For each case study, we worked with one main contact or a small group of contacts to identify what
information, activities, and outcomes would be most useful for each group and to identify an
appropriate set of participants to invite. We developed the agenda for the workshops in collaboration
with our contacts. About a week prior to the workshop, we sent a short 1-2-page handout to
participants to provide them with an overview of some of the data and information we would present at
the workshop along with the workshop agenda. The workshop agendas are attached. Handouts and
example presentations are included as separate files.
After the workshops, we continued collaborating with our contacts to identify what information to
include in the reports.
How can downscaled climate datasets, modeled vegetation changes, and information on estimated
species’ sensitivities be used to develop climate change adaptation strategies?
To address the question of how PNWCCVA data products could be used to develop climate adaptation
strategies, we presented information tailored to each landscape and worked with participants during
the workshops to develop conceptual models of climate impacts on species and systems of interest.
After the workshops, we used the information and discussions from the workshop to develop a report

tailored to the needs of each group. For example, for the British Columbia Parks planners, we developed
a general guidance document to help highlight potential ways climate change might impact park
management at multiple spatial and temporal scales. We then provided guidance for initiating a climate
adaptation planning process by providing a general outline of steps, links to data resources, and
guidance for how these data resources could be used. For the Willamette Valley group, we created a
report that summarized projected climate changes, provided planning guidance, and included
conceptual models that were presented or produced at the workshops. We also completed an in-depth
case study of climate vulnerability and adaptation for one priority conservation species – Oregon white
oak (Quercus garryana) – to illustrate how PNWCCVA products could be interpreted and applied to a
specific conservation target. These reports are included with our submission.
How model results and datasets can be made more useful for informing the management of species and
landscapes?
To answer this question, we presented results and datasets to workshop participants and solicited
questions, comments and feedback at multiple points. The workshops began with informal and
interactive presentations, allowing participants to ask questions and initiate discussions of particular
results or data types. While constructing conceptual models, we provided participants with summaries,
tables and maps of relevant results. At the end of each workshop, we had an open discussion about
what more was needed and how the datasets could be made more useful. Finally, we had participants
fill out a short questionnaire, which asked them to recommend ways to improve the data products as
well as identify any data or knowledge gaps. Throughout the process, especially over the course of all
four workshops, we observed general trends and challenges that managers faced while grappling with
the information presented.
Lessons Learned
The volume and variety of data and results that we presented were a challenge for participants to take-
in and process within a one-day workshop. Several participants told us they needed more time to review
the data types presented and wanted a summary description of the data types as well as a discussion of
their strengths and weaknesses. We provided this summary as an appendix in each of the reports.
However, a larger associated challenge was to understand how different projected changes (i.e.,
changes in different aspects of climate, project species range shifts, or vegetation changes) fit together.
Additionally, the variability in both climate change projections and modeled ecological response across
multiple climate scenarios added to the complexity of interpreting these results. For example, the
mechanistic vegetation projections (from the Lund Potsdam Jena model) varied widely depending on the
climate scenario used and did not always agree with climate niche (also known as statistical or climate
envelope) projections for particular vegetation systems. To address this issue, we developed a checklist
of questions to help managers integrate the different data types into a more coherent evaluation of
ecological vulnerability. This checklist is presented in the Willamette Valley report with the case study of
Oregon white oak used as an example to illustrate its application. We also developed a short guidance
piece on how to select climate scenarios as an approach to addressing uncertainty in climate
projections, which we included in the appendices of both reports.
An alternative suggestion for addressing the volume and complexity of information was to develop a set
of “storylines” for specific climate scenarios in a given landscape. To construct a storyline, the changes in
individual climatic variables would be folded in with species and vegetation shifts – communicating both
the climate projections and potential consequences in a cohesive narrative. An additional aspect of the
storyline approach could be to look for regions that currently have climate conditions and dominant
vegetation analogous to the projected conditions of the given landscape. Our ability to incorporate this
suggestion was limited because there was only one climate scenario used consistently across all
vertebrate, tree, and vegetation projections. We felt that presenting only one scenario would be, at
best, of limited use without a contrasting scenario for comparison. In addition, more research would
likely be needed to understand how changes to specific climatic conditions relate to specific ecological
impacts. To some extent, we incorporated this approach into our species case studies and developed
scenarios of potential resource responses (i.e., expansion, contraction, or stability). However, with more
time and resources, more could be done with this approach, which would be useful for both planning
purposes and in communicating potential climate impacts to a broader audience.
There were a number of specific additional suggestions for changes to the PNWCCVA datasets and for
the development of future data products. These include:
Include an intermediate time step, e.g. mid-century, in the model projections. Many participants
mentioned the difficulty of looking ahead to the end of the century and thought that focusing on
changes over the next few decades would be more useful.
Gain a better understanding of what drives the changes observed in mechanistic models (e.g.,
what specific projected changes lead to grassland versus forest in the Columbia plateau?). This
would require setting up specific hypotheses and running the models again making
manipulations to test those hypotheses.
The ability to rapidly assess species turnover, specifically which species are expected to move in
or out of a user-defined geographic area, would be very useful. One way to address this need
would be to build an interactive online map that would allow one to select particular areas and
calculate which species are projected to lose climatically suitable habitat, continue to have
climatically suitable habitat, and to gain climatically suitable habitat. We have built such a tool
for projected species ranges shifts at the extent of the Western Hemisphere.
Finally, there were a number of suggestions that would require more extensive research efforts:
Despite the downscaled data used, managers still felt that their ability to use the data was
limited by the data’s resolution—both spatial and temporal. Specifically, there was significant
interest in understanding not just how average climatic conditions would change, but changes to
extreme events such as wind storms, heat waves, and rain storms could be expected.
Furthermore, there was an interest in identifying pathways that species or systems might take
to get from currently suitable areas to areas of projected future suitability.
Many participants would have liked to see invasive species included in the species distribution
modeling.
One of the biggest challenges we observed while developing conceptual models was in
understanding how individual climate variables would influence the ecology of a focal species or
system and in particular, cases in which projected changes from different models were
contradictory or had potentially had opposing effects. For example, would an increase in spring
precipitation offset reduced summer precipitation for moisture-limited plants or depressional
wetlands? Answers to some of these questions may be available in the literature, and our
experience developing case studies of particular species helped to clarify some of those
questions. However, in some cases, more research conducted within a particular region and
focused on particular climate variables is needed.
In the Willamette Valley, managers wanted to know if particular vegetation types were
associated with specific land facets, or unique combinations of abiotic conditions such as soil,
elevation and aspect.
Conclusion
The Pacific Northwest Vulnerability Assessment had been planned with the needs of practitioners in
mind. The core project team included scientists and managers from The Nature Conservancy,
Washington Department of Fish and Wildlife, Idaho Fish and Game, and the USGS. This was done
purposefully to ensure that the project would address the needs of the conservation and natural
resource management community in the Pacific Northwest. Nonetheless, the case studies in the
Willamette Valley and across the B.C. Parks were critical for defining how vulnerability assessment
products could be used and for aiding in the integration of these products into multiple planning
processes. The case studies had several important outcomes.
Working with managers with intimate local knowledge of the landscapes was invaluable to our research
process in several ways. In a few cases, during the workshops regional experts identified errors in the
data or projections that we would have had no simple way of identifying on our own. For a few models,
managers were skeptical of the drastic changes projected. This skepticism prompted us to review the
models, and in a few cases, for example our sage grouse range shift projections, make revisions. In all
cases, local knowledge helped us to understand, in more detail, some of the inherent limitations of the
modeling methods. For example, the climatic niche models rely on maps of “current” species
distribution. These maps may be outdated or simply constructed at too coarse of a resolution to capture
fine-scaled patterns of species presence/absence. Although these limitations are were known to us, this
experience helped provide greater clarity on specifically how these limitations might affect particular
projections.
Some projections of ecological impacts were contradictory. We believe that participants benefitted
significantly from seeing how divergent ecological impact projections could be for some systems, even
though this challenged the planning process. Seeing these results gave them a sense of the extent of
uncertainty associated with ecological impacts. In the workshops, it became clear that communicating
and interpreting these seemingly contradictory projections are critical tasks for researchers and
modelers if this information is to be successfully incorporated into decision-making. As discussed in the
“lessons learned” section above, more work is needed to understand how to integrate multiple, and at
times conflicting, model results to create a more holistic assessment of climate change vulnerability for
particular locations.
Although participants generally wanted more fine-scaled information about specific climate events (e.g.,
storms, fires, or extreme temperatures), general qualitative projections, such as warmer wetter winters,

and hotter drier summers, were very useful in getting participants to start thinking about potential
climate impacts. These simplified projections, combined with a general sense of the extent to which
vegetation or focal species may shift in the region, helped participants develop a sense of potential
climate impacts and areas of uncertainty.
Overall, we believe that these workshops were invaluable, not only to our research process but also as
communication tools to share data directly with land managers. We found that workshop participants
greatly appreciated “seeing the data.” Many, though by no means all, participants were familiar with the
general climate change projections we presented. However, they appreciated being able to see the data
results directly and we believe that sharing these data helped managers gain a better understanding of
the strengths and limitations of the models. Such an understanding is a critical first step towards
informed decision-making. We still have much to learn about how to most effectively have
conversations such as these with managers. These first workshops helped us learn how to initiate and
guide that conversation. We believe that if workshops such as these became more common, they have
the potential to be a powerful tool for integrating research and management practice.
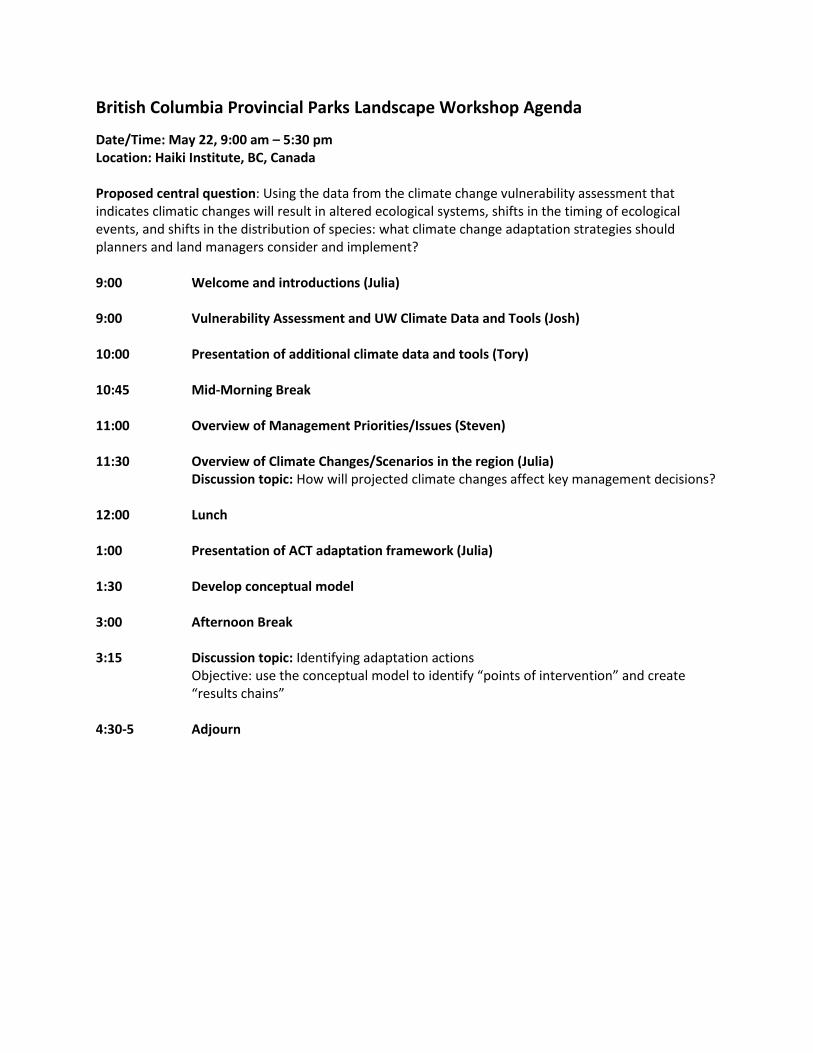
British Columbia Provincial Parks Landscape Workshop Agenda
Date/Time: May 22, 9:00 am – 5:30 pm Location: Haiki Institute, BC, Canada Proposed central question: Using the data from the climate change vulnerability assessment that indicates climatic changes will result in altered ecological systems, shifts in the timing of ecological events, and shifts in the distribution of species: what climate change adaptation strategies should planners and land managers consider and implement? 9:00 Welcome and introductions (Julia) 9:00 Vulnerability Assessment and UW Climate Data and Tools (Josh) 10:00 Presentation of additional climate data and tools (Tory) 10:45 Mid-Morning Break 11:00 Overview of Management Priorities/Issues (Steven) 11:30 Overview of Climate Changes/Scenarios in the region (Julia)
Discussion topic: How will projected climate changes affect key management decisions? 12:00 Lunch 1:00 Presentation of ACT adaptation framework (Julia) 1:30 Develop conceptual model 3:00 Afternoon Break 3:15 Discussion topic: Identifying adaptation actions Objective: use the conceptual model to identify “points of intervention” and create
“results chains” 4:30-5 Adjourn

UW Willamette Valley Climate Adaptation Workshop
Final Agenda
Date/Time: August 22, 8:30 am – 4:30 pm Location: FWS Regional Office, 911 NE 11th Ave, Portland 97232; 3rd Floor Conference Room [Note: Security measures require non-federal employees to be escorted by federal employees. Kevin and Leslie Bliss-Ketchum will meet folks at the security desk starting at 8:10AM. We will have coffee at the 3rd floor conference room.]
Audience: We are seeking to convene a technical working group to meet the goals and objectives,
described below.
Goals: 1) Use results of contemporary projections of climatic variables and plant, animal, and ecosystem
responses to climate change in the Willamette Valley to inform the Willamette Valley Conservation
Study, and other Conservation Opportunity Areas analyses (e.g., The Nature Conservancy and Oregon
Department of Fish and Wildlife); 2) Solicit feedback to make climate change datasets and products
more useful to resource managers and conservation practitioners in the Willamette Valley specifically,
and the Pacific Northwest generally.
Objectives: At the end of the day participants should have an understanding of the concepts outlined
below; and will have provided initial input on how we can incorporate this new information for
conservation planning in the Valley. We are focused on the following habitats/ecosystems: oak
woodlands, oak savanna/upland prairies, wet prairies, wetlands, and riparian forest/shrublands. Focal
species for each of these systems have also been identified.
The University of Washington Climate Vulnerability Assessment for the Willamette Valley will provide
the following new information scaled to the Valley (see Appendix 1 for more information)
Climate trends and predicted future climate impacts to the valley o 20+ climate variables such as temp., precip., growing degree days, etc.
Two vegetation models and two vertebrate species bioclimatic envelope models o How they are developed o What they tell us and don’t tell us o Strengths and weakness of the four approaches
Land facet analysis

o What this analysis is o How it was developed o What it tells us and doesn’t tell us o Strengths and weakness
Application of these models and analyses to spatial conservation planning o Applicability for identifying areas to protect (COAs, Refuges, corridors, etc)
e.g., temporal corridors, climate refugia, etc. o Applicability in a threat analysis
e.g., as a component of the cost layer in a Marxan analysis, etc.
Agenda:
8:15 Arrivals/Coffee 8:30 Welcome and Introductions (David Patte, FWS and Josh Lawler, University of
Washington) 8:45 Overview of UW Vulnerability Project (University of Washington)
Review goals/outcomes for workshop
Review planned follow up from workshop 9:00 Updates on Willamette Valley Conservation Planning Efforts Jim Houk, USFWS, on the Willamette Valley Conservation Study Michael Shindel, TNC, on the COA Mapping Project Holly Michael, ODFW, on the State’s COAs for the Valley 9:30 Presentation/Discussion: Overview of Climate Change Impacts in the Region
(University of Washington)
Major expected climate trends in the region
Alternative climate futures (scenarios) 10:30 Break 10:45 Continued Presentation/Discussion of Climate Impacts and Modeling results
Species sensitivity database
Species, vegetation, and system range shifts models
Explanation of each model/Uses/Limitations 11:30 Break out groups
Review expected climate impacts on ecosystems of interest and areas of interest (existing protected areas, priority restoration areas, existing high quality habitat locations, etc.)
Review expected climate impacts on management actions (land protection, habitat restoration, etc.)

12:30 Lunch 1:00 Presentation/Discussion (University of Washington)
Land Facet Analysis
Incorporating Climate Change and Land Facets into Spatial Planning 2:00 Afternoon Working Session:
Discuss a process and recommendations for incorporating climate change in identifying spatial priorities for conservation targets
[Potentially divide by habitat and/or species type (oak woodland, upland prairie, Fender’s Blue Butterfly, etc.)]
3:00 Afternoon Break 3:15 Afternoon Discussion Session 4:15 Wrap-up/Discussion of Next Steps 4:30 Adjourn

Appendix 1 (to the Willamette Valley Agenda)
University of Washington Climate Vulnerability Assessment
Seven Analyses and Modeling Efforts are Underway (a powerpoint summary is also available)
1) Climate sensitivity database – Michael Case. This provides species and habitat sensitivity information
and scoring. See the following website for more info or the attachment for a list of species that have
been completed. If we’d like to initiate more analyses, we need to contact Michael and facilitate a
session/workshop with the appropriate species experts. http://courses.washington.edu/ccdb/drupal/
2) Historic climate trends (1961-1999) and downscaled regional modeling (2070-2099) [CCSM3,
CGCM3.1(T47), GISS-ER, MIROC3.2(medres), UKMO-HadCM3] Emissions scenarios: A2, A1B
Spatial resolution: 30 arc-seconds (~1 km2)]. This will provide a number of derived climate variables and
bioclimate variables that will be new to managers such as historic vs projected Chilling degree days,
Growing degree days, Number of frost-free days, beginning and end of frost-free period, Precipitation as
snow, Potential evapotranspiration, etc.
3) Process-based vegetation model – Sarah Shafer USGS; due in August. Represents vegetation as plant
functional types, such as Needleleaf evergreen trees, Broadleaf evergreen and deciduous trees, C3 and
C4 perennial grasses, etc. Simulates: Plant responses to changes in atmospheric CO2 concentrations,
Changes in fire disturbance and mortality, etc.
4) Correlative veg models – Michael Case/Lawler (18 completed, May 2012—more to be processed this
summer). Correlates vegetation distributions with climate and bioclimate data using NatureServe
macrogroups Example: Willamette valley upland prairie and savanna
5) Vertebrate species distribution-- Jesse Langdon and Josh Lawler (Initial climate envelope range shifts
completed (May 2012). Additional analysis on going) Correlative models of species range shift based on
shifts in climate suitability-- will account for habitat and land cover changes.
6) Mechanistic Vertebrate Species Distributions – Chad Wilsey and Josh Lawler (possibly 1 species to be
completed by end of summer). We can suggest adding our surrogate species, but we all want to be sure
these would be in addition to, not replacements to the following list of planned species: Greater Sage-
grouse, Pygmy rabbit, Towsend ground squirrel complex, Wolverine, Mountain goat, Lynx, Northern
Goshawk, Boreal toad, Western rattlesnake, Clark’s Nutcracker, Ord’s kangaroo rat, Fisher, Columbia
spotted frog, Black Rosy Finch, White-headed woodpecker
7) Land facet analysis – Carrie Schloss and Josh Lawler. (TNC- M. Schindell worked with Carrie.)
(Completed) Modeling geophysical setting of WV. This study used several different methodologies
including simple overlays, cluster analysis with the K-means algorithm, cluster analysis with fuzzy C-
means algorithm, and a hybrid approach that created general categories using simple overlays and then
identified clusters within these broad categories. The resulting land facet maps were compared to see
how robust land facets are to different identification methods.