applying the results of tracking and modeling to mitigate the effects of roadways on wide-ranging
TRANSCRIPT

1
Securing permeable roadways for wide-ranging wildlife in the Black River Valley
Applying the results of winter tracking and spatial modeling to mitigate barrier effects on priority roadways in a habitat linkage with ecoregional importance.
August, 2012
Gustave Goodwin – Writer Kurt Rinehart – Principal Investigator, modeling and analysis
Alissa Rafferty – Field Assessment Coordinator Michelle Brown – Science Advisor Craig Cheeseman – GIS analysis
2
Acknowledgements Principal funding was provided by the US Fish and Wildlife Service and New Hampshire Fish and Game Department through the Competitive State Wildlife Grants Program, under the terms of the State and Federal assistance grant U2-‐4-‐R entitled "Staying Connected in the Northern Appalachians: Mitigating Fragmentation and Climate Change Impacts on Wildlife through Functional Habitat Linkages," and by the Wildlife Conservation Society’s Wildlife Action Opportunities Fund, established with support from the Doris Duke Charitable Foundation. The content and opinions expressed herein are those of the authors and do not necessarily reflect the position or the policy of these funders, and no official endorsement should be inferred. Many thanks to Ed Franz with the New York Department of Transportation for his guidance on where to focus the winter tracking work described in this paper. In addition, we would like to recognize our Staying Connected partners in the Adirondack-Tug Hill linkage (the geographic focus of this report): The Tug Hill Commission, Tug Hill Tomorrow Land Trust and the Wildlife Conservation Society. Please cite this document as: The Nature Conservancy, Adirondack Chapter. Securing permeable roadways for wide-ranging wildlife in the Black River Valley. 2012.

3
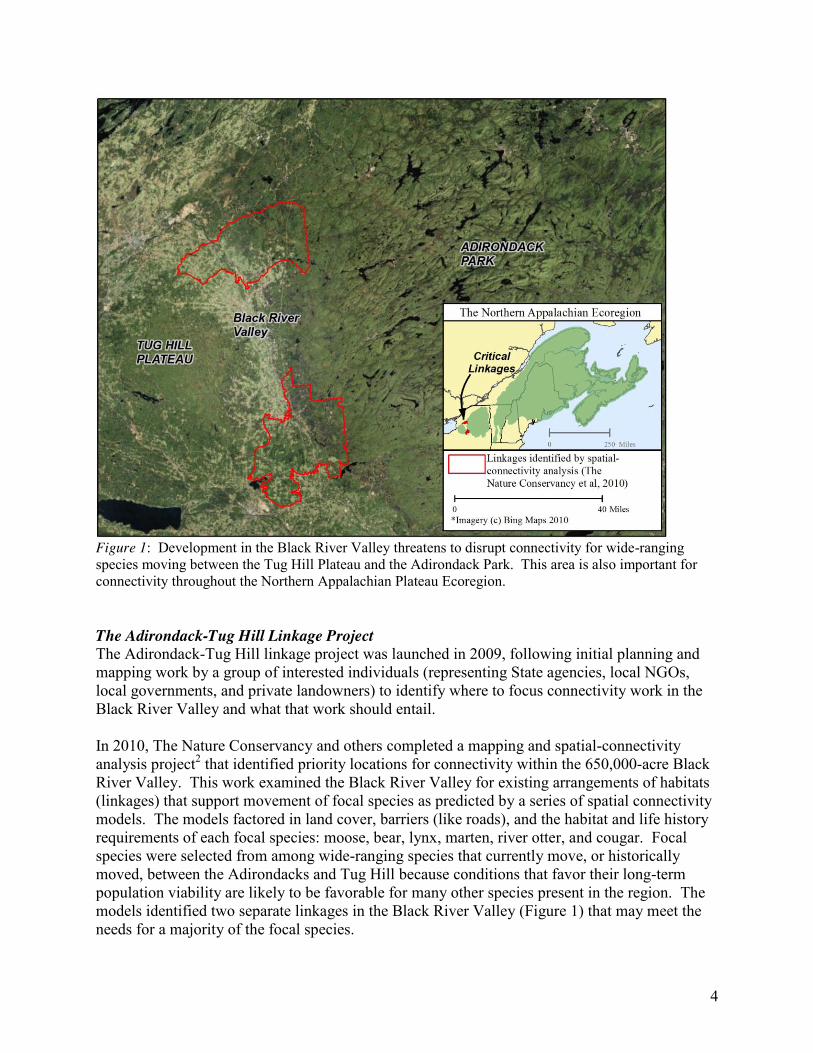
PROJECT BACKGROUND AND OVERVIEW The Northern Appalachians The Northern Appalachians encompasses one of the largest, most-intact temperate deciduous forests remaining on the planet (Fig 1). By measure of forest cover, it is the most intact ecoregion in eastern North America. Large blocks of contiguous, relatively wild forest remain in the region despite a long history of human settlement and resource use. These large forest blocks form the core of the ecoregion and are vital to its ability to support biodiversity and important ecosystem functions. Species like lynx, marten, moose, bear, and bobcat thrive in portions of the Northern Appalachians. Some species are naturally extending their range, dispersing across a patchwork landscape and returning to areas where they were once extirpated. Moose migrating from Ontario and Vermont established stable resident populations in the Adirondacks—populations that, in turn, may be dispersing westward to the Tug Hill Plateau. Despite failed introductions in the Adirondacks, there have been confirmed lynx sightings in northern New Hampshire and Vermont. But, at the same time these important species are poised for rebound, the threats of habitat loss and fragmentation loom large. Increased demand for ex-urban residential development recently reversed a long-standing trend of reforestation. For the first time since the mid-19th century the ecoregion is losing forest cover faster than it is being regained (Wildlands and Woodlands, 2010). Habitat degradation and fragmentation threatens to chip away unprotected forests, making them unsuitable for wildlife, and to undermine critical ecological connections between our protected core forests. Development and associated transportation infrastructure could have negative impacts on the ability of parts of the ecoregion to support viable, resilient populations of wildlife such as moose, bear, lynx, bobcat, and marten. These species require large patches of quality habitat and the ability to move between them. This movement is essential for long-term population viability. It promotes genetic diversity and allows populations to adapt and respond to environmental changes ranging in magnitude from localized habitat loss to global climate change. The Black River Valley The Black River Valley lies between the Tug Hill Plateau and the Adirondack Park—the two largest core habitat blocks in the western part of the Northern Appalachian region (Fig 1). There is a strong tradition of land conservation in this area, but it has primarily focused on protecting core habitat in the Tug Hill plateau and the Adirondacks rather than the Black River Valley’s 650,000 acres of forests, farms, and residential communities. Mapping and modeling work by Two Countries, One Forest,1 The Nature Conservancy,2 and others has identified the Black River Valley as a regionally important linkage (Figure 1). Loss of connectivity in the Black River Valley would disrupt wildlife movement between the Tug Hill Plateau and the Adirondacks, resulting in a less resilient landscape and less resilient animal populations.
4
Figure 1: Development in the Black River Valley threatens to disrupt connectivity for wide-ranging species moving between the Tug Hill Plateau and the Adirondack Park. This area is also important for connectivity throughout the Northern Appalachian Plateau Ecoregion. The Adirondack-Tug Hill Linkage Project The Adirondack-Tug Hill linkage project was launched in 2009, following initial planning and mapping work by a group of interested individuals (representing State agencies, local NGOs, local governments, and private landowners) to identify where to focus connectivity work in the Black River Valley and what that work should entail. In 2010, The Nature Conservancy and others completed a mapping and spatial-connectivity analysis project2 that identified priority locations for connectivity within the 650,000-acre Black River Valley. This work examined the Black River Valley for existing arrangements of habitats (linkages) that support movement of focal species as predicted by a series of spatial connectivity models. The models factored in land cover, barriers (like roads), and the habitat and life history requirements of each focal species: moose, bear, lynx, marten, river otter, and cougar. Focal species were selected from among wide-ranging species that currently move, or historically moved, between the Adirondacks and Tug Hill because conditions that favor their long-term population viability are likely to be favorable for many other species present in the region. The models identified two separate linkages in the Black River Valley (Figure 1) that may meet the needs for a majority of the focal species.
5
The mapping project also informed the development of a strategic plan for securing connectivity in the Black River Valley. Project partners elected to focus on the southern linkage (totaling 163,000 acres) as it is primarily forested. The high amount of natural cover in this linkage (89%) allows a conservation strategy based upon maintaining existing habitat patches, rather than costly habitat restoration, and minimizing barrier effects between patches.2 Implementation efforts—lead by The Tug Hill Commission, Tug Hill Tomorrow, Wildlife Conservation Society, and The Nature Conservancy—have focused on land protection, informing local land use planning to steer new development away from important wildlife movement areas, and reducing the impacts of roads as barriers to animal movement. The work described in the remainder of this paper focuses on barrier mitigation work. This initial work helped catalyze Staying Connected: a regional initiative to secure connectivity across the Northern Appalachians that has raised $1.2 million in funds for connectivity projects in the Black River Valley and other priority linkages. Advancing Barrier Mitigation in the Linkage Roadways and related infrastructure are a significant barrier for wildlife movement and a source of mortality for many species. Addressing these barrier effects requires incorporating the needs of wildlife into the design of new roads and mitigating the effects of the existing road network. The extent of the roads in the Black River Valley and the scarcity of resources that can be allocated to barrier mitigation projects require a strategy guided by the best available science. To advance the barrier mitigation strategy, The Nature Conservancy implemented a field study of select roadways to develop data, tools, and strategies that can be used to mitigate the negative impacts of barriers, particularly roads, on habitat connectivity in the Black River Valley. The specific objectives of this project were:
1. Identify high probability wildlife crossing locations on priority road segments using field-collected animal track data.
2. Evaluate the importance of variables such as road infrastructure, land use, and topography on crossing probabilities to inform mitigation efforts.
3. Develop a model prototype that can be used as a rapid assessment tool throughout the
linkage to identify priorities on other road segments. 4. Examine metrics to track changes to connectivity over time using remote datasets.
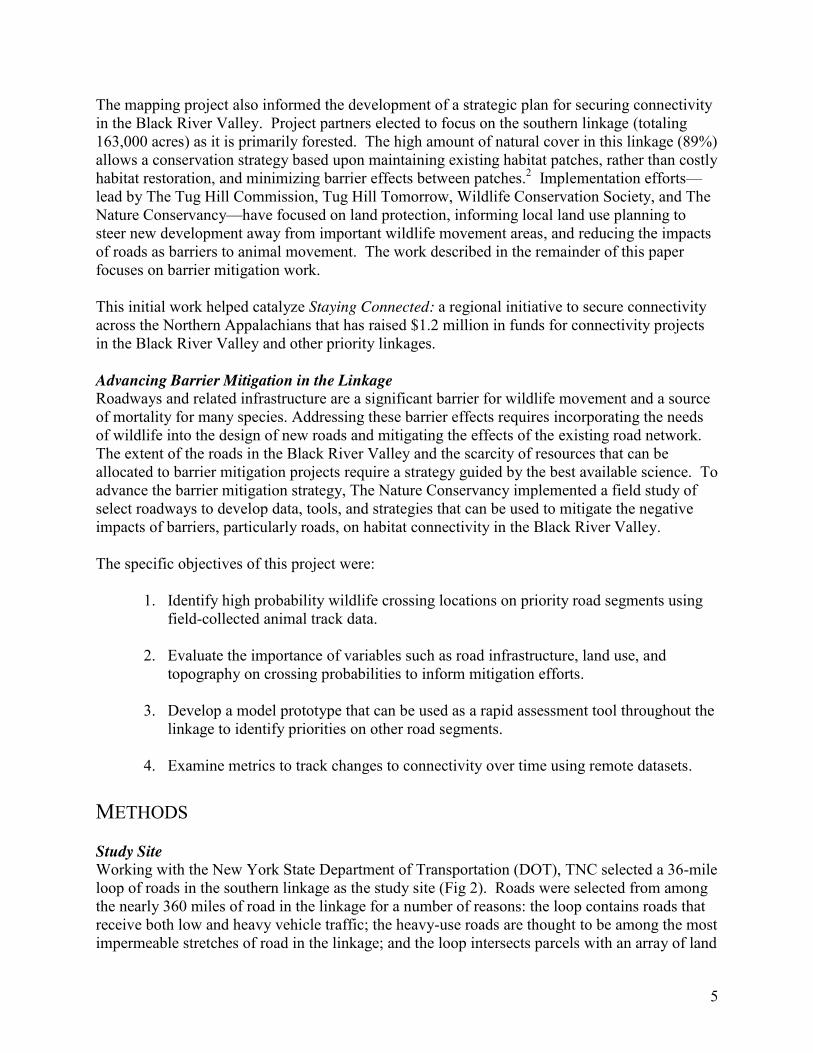
METHODS Study Site Working with the New York State Department of Transportation (DOT), TNC selected a 36-mile loop of roads in the southern linkage as the study site (Fig 2). Roads were selected from among the nearly 360 miles of road in the linkage for a number of reasons: the loop contains roads that receive both low and heavy vehicle traffic; the heavy-use roads are thought to be among the most impermeable stretches of road in the linkage; and the loop intersects parcels with an array of land
6
uses, including residential, agricultural, and conservation lands. The amount of roads to be included in the study was limited by the extent of road that a two-person team could thoroughly survey in two days.
Figure 2: Location of study roads within the Black River Valley’s southern linkage. Data Collection and Development Wildlife movement along the study roads was obtained by winter tracking. Track data were collected from January 2011 until March 2011 by two TNC technicians trained in track identification and data collection. Tracks were detected by visually searching along the roadways while driving slowly along the edge of the pavement. When tracks were detected, the vehicle was stopped and the tracks were inspected on foot. If the tracks were made by one of the preselected target species (coyote, red fox, deer, fisher, mink, otter, weasel species, turkey, moose, marten, bear, bobcat, or lynx) observations, including location and time, species (or taxonomic group), number of sets of tracks observed, and type of event (crossing, turn away, travel parallel to road) were recorded using a GPS-enabled portable computer. Remote cameras were used to validate species movement. In April 2011, technicians returned to the study site to collect data describing the physical infrastructure of the study roads. This included the location and length of guard rails and fences, width of the roadway, the location, size, and condition of culverts and bridges, as well as
7
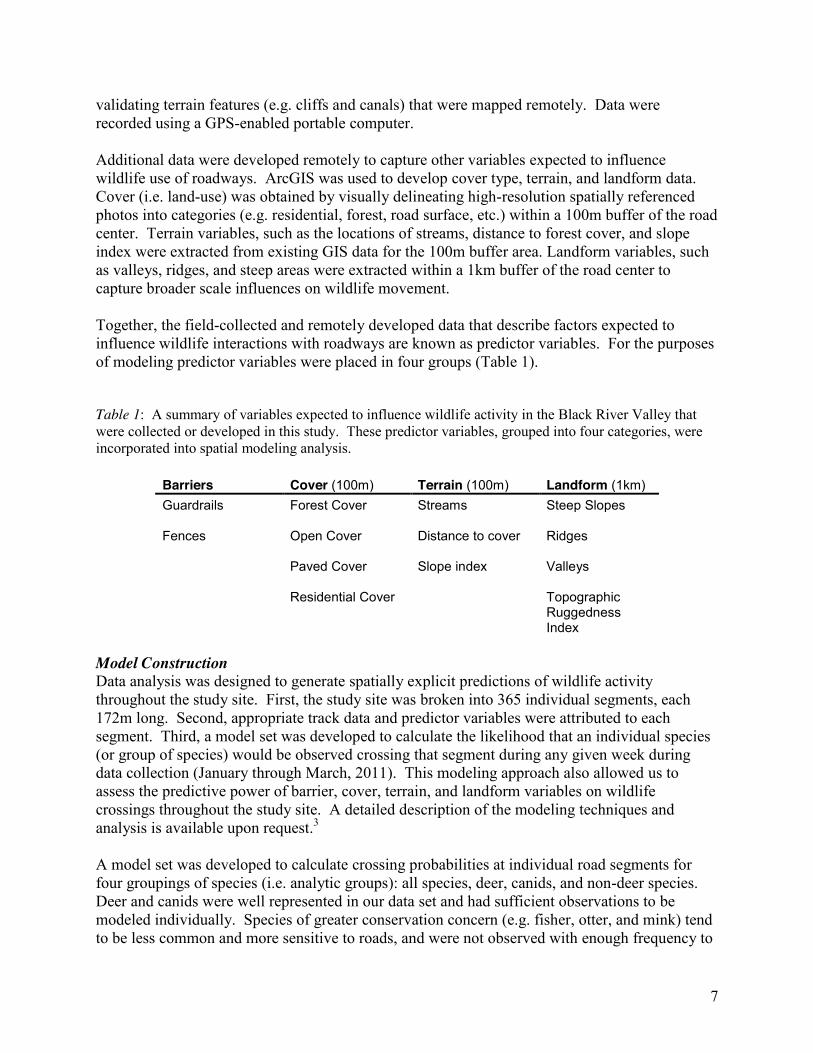
validating terrain features (e.g. cliffs and canals) that were mapped remotely. Data were recorded using a GPS-enabled portable computer. Additional data were developed remotely to capture other variables expected to influence wildlife use of roadways. ArcGIS was used to develop cover type, terrain, and landform data. Cover (i.e. land-use) was obtained by visually delineating high-resolution spatially referenced photos into categories (e.g. residential, forest, road surface, etc.) within a 100m buffer of the road center. Terrain variables, such as the locations of streams, distance to forest cover, and slope index were extracted from existing GIS data for the 100m buffer area. Landform variables, such as valleys, ridges, and steep areas were extracted within a 1km buffer of the road center to capture broader scale influences on wildlife movement. Together, the field-collected and remotely developed data that describe factors expected to influence wildlife interactions with roadways are known as predictor variables. For the purposes of modeling predictor variables were placed in four groups (Table 1). Table 1: A summary of variables expected to influence wildlife activity in the Black River Valley that were collected or developed in this study. These predictor variables, grouped into four categories, were incorporated into spatial modeling analysis.
Barriers Cover (100m) Terrain (100m) Landform (1km) Guardrails Forest Cover Streams Steep Slopes
Fences Open Cover Distance to cover Ridges
Paved Cover Slope index Valleys
Residential Cover
Topographic Ruggedness Index
Model Construction Data analysis was designed to generate spatially explicit predictions of wildlife activity throughout the study site. First, the study site was broken into 365 individual segments, each 172m long. Second, appropriate track data and predictor variables were attributed to each segment. Third, a model set was developed to calculate the likelihood that an individual species (or group of species) would be observed crossing that segment during any given week during data collection (January through March, 2011). This modeling approach also allowed us to assess the predictive power of barrier, cover, terrain, and landform variables on wildlife crossings throughout the study site. A detailed description of the modeling techniques and analysis is available upon request.3 A model set was developed to calculate crossing probabilities at individual road segments for four groupings of species (i.e. analytic groups): all species, deer, canids, and non-deer species. Deer and canids were well represented in our data set and had sufficient observations to be modeled individually. Species of greater conservation concern (e.g. fisher, otter, and mink) tend to be less common and more sensitive to roads, and were not observed with enough frequency to
8
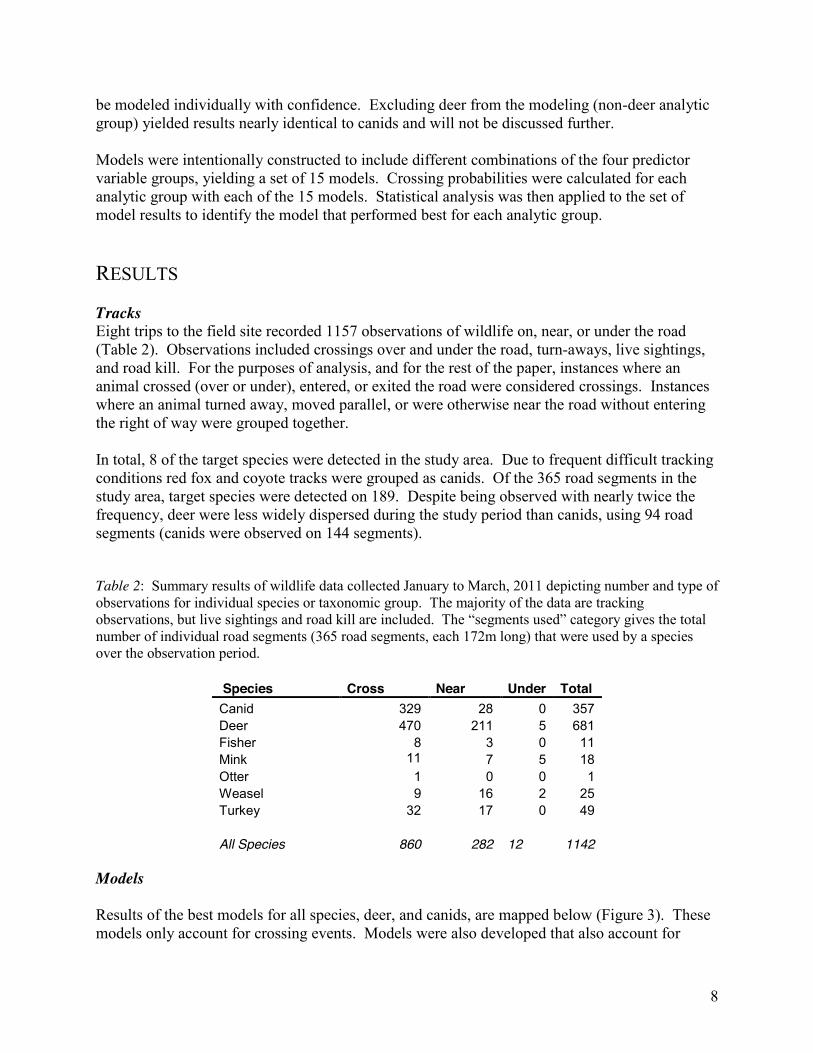
be modeled individually with confidence. Excluding deer from the modeling (non-deer analytic group) yielded results nearly identical to canids and will not be discussed further. Models were intentionally constructed to include different combinations of the four predictor variable groups, yielding a set of 15 models. Crossing probabilities were calculated for each analytic group with each of the 15 models. Statistical analysis was then applied to the set of model results to identify the model that performed best for each analytic group. RESULTS Tracks Eight trips to the field site recorded 1157 observations of wildlife on, near, or under the road (Table 2). Observations included crossings over and under the road, turn-aways, live sightings, and road kill. For the purposes of analysis, and for the rest of the paper, instances where an animal crossed (over or under), entered, or exited the road were considered crossings. Instances where an animal turned away, moved parallel, or were otherwise near the road without entering the right of way were grouped together. In total, 8 of the target species were detected in the study area. Due to frequent difficult tracking conditions red fox and coyote tracks were grouped as canids. Of the 365 road segments in the study area, target species were detected on 189. Despite being observed with nearly twice the frequency, deer were less widely dispersed during the study period than canids, using 94 road segments (canids were observed on 144 segments). Table 2: Summary results of wildlife data collected January to March, 2011 depicting number and type of observations for individual species or taxonomic group. The majority of the data are tracking observations, but live sightings and road kill are included. The “segments used” category gives the total number of individual road segments (365 road segments, each 172m long) that were used by a species over the observation period.
Species Cross Near Under Total Canid 329 28 0 357 Deer 470 211 5 681 Fisher 8 3 0 11 Mink 11 7 5 18 Otter 1 0 0 1 Weasel 9 16 2 25 Turkey 32 17 0 49 All Species 860 282 12 1142
Models Results of the best models for all species, deer, and canids, are mapped below (Figure 3). These models only account for crossing events. Models were also developed that also account for
9
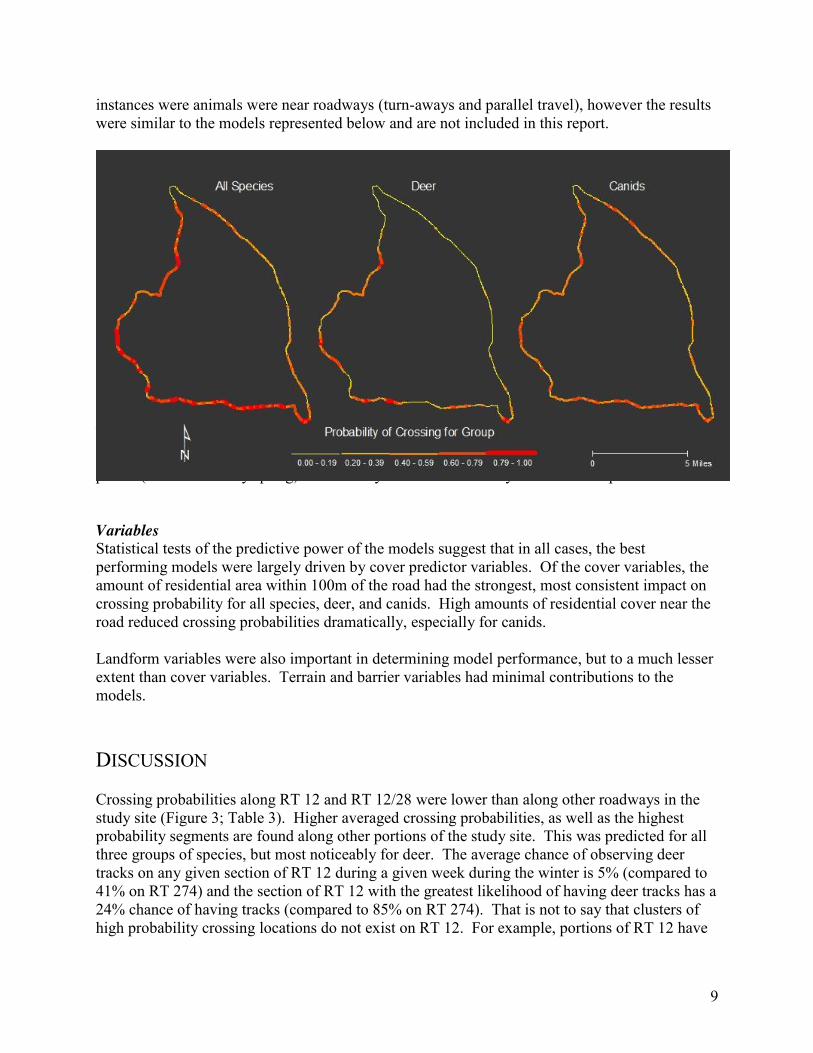
instances were animals were near roadways (turn-aways and parallel travel), however the results were similar to the models represented below and are not included in this report.
Figure 3: Crossing probabilities at individual road segments for all species, canids, and deer as predicted by the best performing model for each analytic group. The crossing probability specifically represents the probability that tracks from a given species, or group of species would be observed crossing a particular 172m road segment in any given week during the observation period (winter and early spring). Data are symbolized identically in all three maps. Variables Statistical tests of the predictive power of the models suggest that in all cases, the best performing models were largely driven by cover predictor variables. Of the cover variables, the amount of residential area within 100m of the road had the strongest, most consistent impact on crossing probability for all species, deer, and canids. High amounts of residential cover near the road reduced crossing probabilities dramatically, especially for canids. Landform variables were also important in determining model performance, but to a much lesser extent than cover variables. Terrain and barrier variables had minimal contributions to the models.
DISCUSSION Crossing probabilities along RT 12 and RT 12/28 were lower than along other roadways in the study site (Figure 3; Table 3). Higher averaged crossing probabilities, as well as the highest probability segments are found along other portions of the study site. This was predicted for all three groups of species, but most noticeably for deer. The average chance of observing deer tracks on any given section of RT 12 during a given week during the winter is 5% (compared to 41% on RT 274) and the section of RT 12 with the greatest likelihood of having deer tracks has a 24% chance of having tracks (compared to 85% on RT 274). That is not to say that clusters of high probability crossing locations do not exist on RT 12. For example, portions of RT 12 have
10
crossing probabilities for canids (up to 65% chance) that are above average for other roads in the study site. Table 3: Average (mean), minimum, and maximum crossing probabilities (represented as percent chance) generated by the leading models for All Species, Deer, and Canid for roads in the study site.
Road Name All Species Deer Canid
Mean Min Max Mean Min Max Mean Min Max
Fuller Rd 68% 12% 88% 35% 2% 80% 53% 6% 74%
RT 274 69% 3% 88% 41% 1% 85% 52% 1% 75%
RT 46 58% 0% 91% 35% 0% 82% 41% 0% 68%
RT 12 34% 0% 77% 5% 0% 24% 34% 0% 65%
RT 12/28 37% 1% 68% 13% 0% 46% 27% 1% 45%
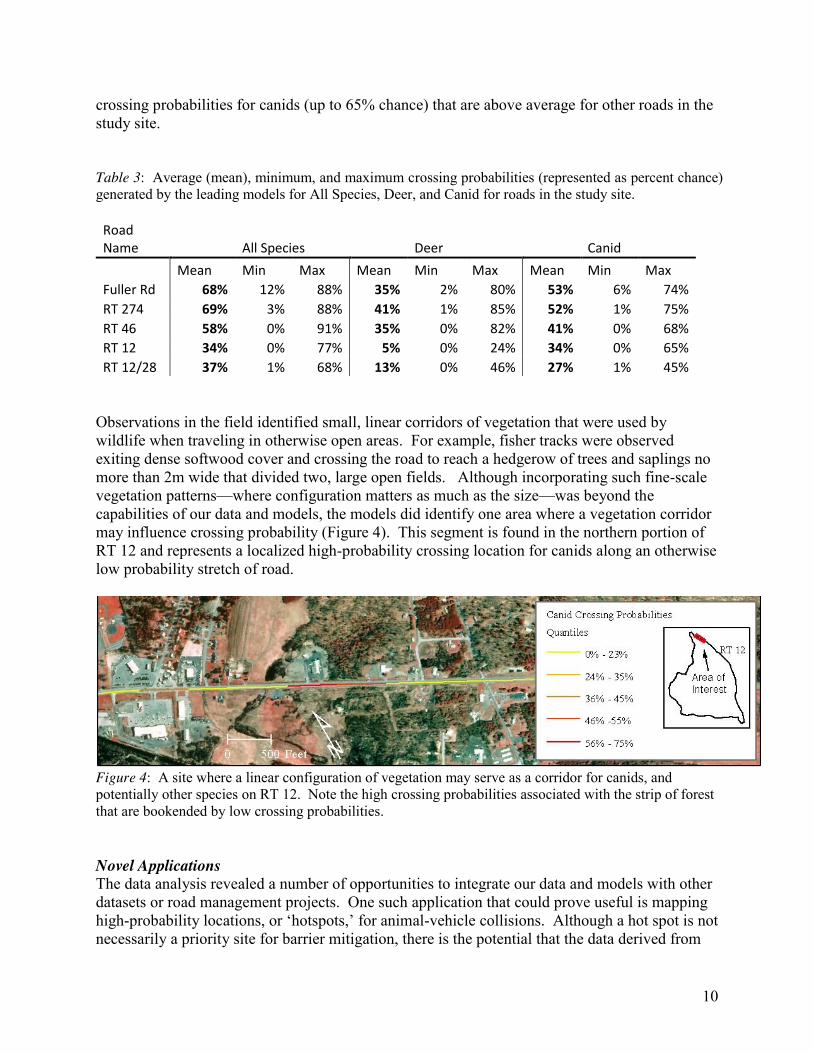
Observations in the field identified small, linear corridors of vegetation that were used by wildlife when traveling in otherwise open areas. For example, fisher tracks were observed exiting dense softwood cover and crossing the road to reach a hedgerow of trees and saplings no more than 2m wide that divided two, large open fields. Although incorporating such fine-scale vegetation patterns—where configuration matters as much as the size—was beyond the capabilities of our data and models, the models did identify one area where a vegetation corridor may influence crossing probability (Figure 4). This segment is found in the northern portion of RT 12 and represents a localized high-probability crossing location for canids along an otherwise low probability stretch of road.
Figure 4: A site where a linear configuration of vegetation may serve as a corridor for canids, and potentially other species on RT 12. Note the high crossing probabilities associated with the strip of forest that are bookended by low crossing probabilities. Novel Applications The data analysis revealed a number of opportunities to integrate our data and models with other datasets or road management projects. One such application that could prove useful is mapping high-probability locations, or ‘hotspots,’ for animal-vehicle collisions. Although a hot spot is not necessarily a priority site for barrier mitigation, there is the potential that the data derived from
11
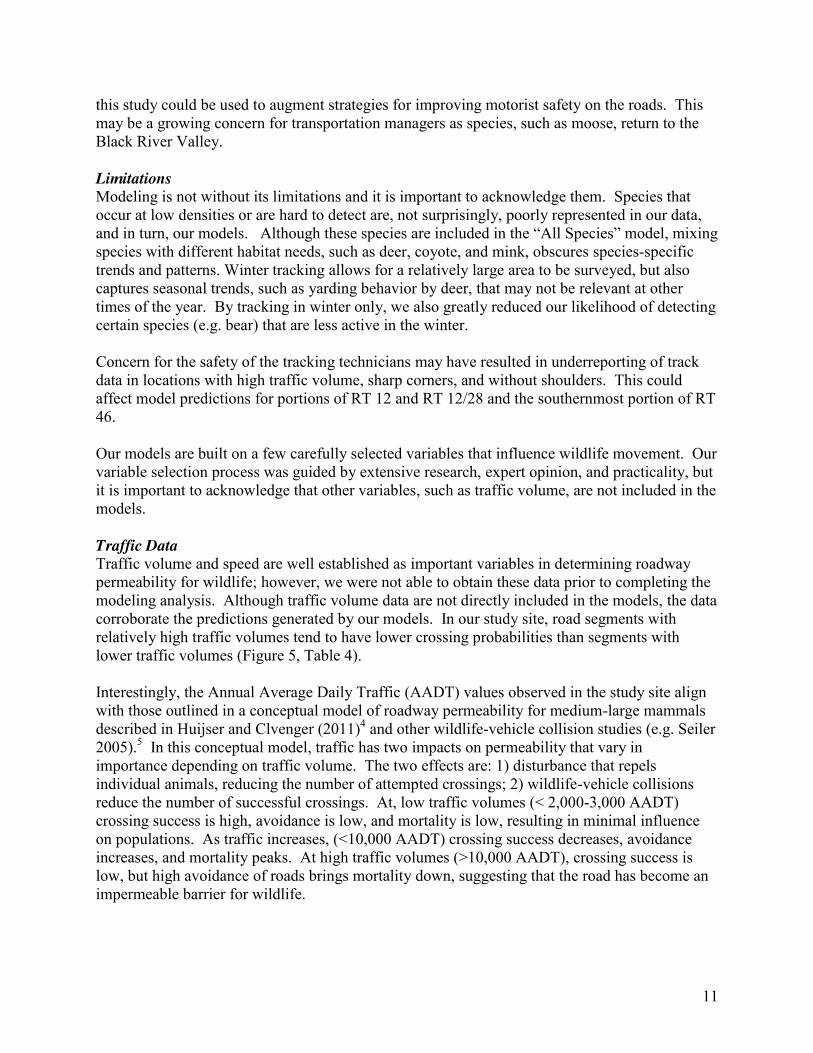
this study could be used to augment strategies for improving motorist safety on the roads. This may be a growing concern for transportation managers as species, such as moose, return to the Black River Valley. Limitations Modeling is not without its limitations and it is important to acknowledge them. Species that occur at low densities or are hard to detect are, not surprisingly, poorly represented in our data, and in turn, our models. Although these species are included in the “All Species” model, mixing species with different habitat needs, such as deer, coyote, and mink, obscures species-specific trends and patterns. Winter tracking allows for a relatively large area to be surveyed, but also captures seasonal trends, such as yarding behavior by deer, that may not be relevant at other times of the year. By tracking in winter only, we also greatly reduced our likelihood of detecting certain species (e.g. bear) that are less active in the winter. Concern for the safety of the tracking technicians may have resulted in underreporting of track data in locations with high traffic volume, sharp corners, and without shoulders. This could affect model predictions for portions of RT 12 and RT 12/28 and the southernmost portion of RT 46. Our models are built on a few carefully selected variables that influence wildlife movement. Our variable selection process was guided by extensive research, expert opinion, and practicality, but it is important to acknowledge that other variables, such as traffic volume, are not included in the models.
Traffic Data Traffic volume and speed are well established as important variables in determining roadway permeability for wildlife; however, we were not able to obtain these data prior to completing the modeling analysis. Although traffic volume data are not directly included in the models, the data corroborate the predictions generated by our models. In our study site, road segments with relatively high traffic volumes tend to have lower crossing probabilities than segments with lower traffic volumes (Figure 5, Table 4). Interestingly, the Annual Average Daily Traffic (AADT) values observed in the study site align with those outlined in a conceptual model of roadway permeability for medium-large mammals described in Huijser and Clvenger (2011)4 and other wildlife-vehicle collision studies (e.g. Seiler 2005).5 In this conceptual model, traffic has two impacts on permeability that vary in importance depending on traffic volume. The two effects are: 1) disturbance that repels individual animals, reducing the number of attempted crossings; 2) wildlife-vehicle collisions reduce the number of successful crossings. At, low traffic volumes (< 2,000-3,000 AADT) crossing success is high, avoidance is low, and mortality is low, resulting in minimal influence on populations. As traffic increases, (<10,000 AADT) crossing success decreases, avoidance increases, and mortality peaks. At high traffic volumes (>10,000 AADT), crossing success is low, but high avoidance of roads brings mortality down, suggesting that the road has become an impermeable barrier for wildlife.
12
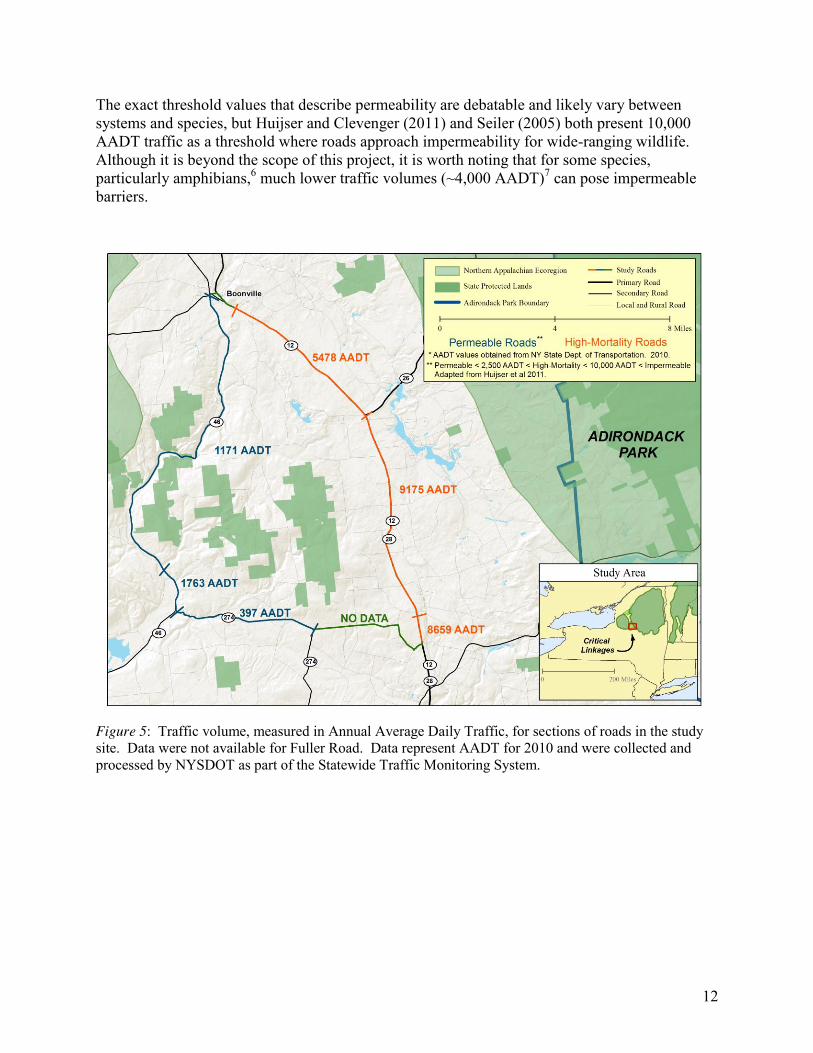
The exact threshold values that describe permeability are debatable and likely vary between systems and species, but Huijser and Clevenger (2011) and Seiler (2005) both present 10,000 AADT traffic as a threshold where roads approach impermeability for wide-ranging wildlife. Although it is beyond the scope of this project, it is worth noting that for some species, particularly amphibians,6 much lower traffic volumes (~4,000 AADT)7 can pose impermeable barriers.
Figure 5: Traffic volume, measured in Annual Average Daily Traffic, for sections of roads in the study site. Data were not available for Fuller Road. Data represent AADT for 2010 and were collected and processed by NYSDOT as part of the Statewide Traffic Monitoring System.
13
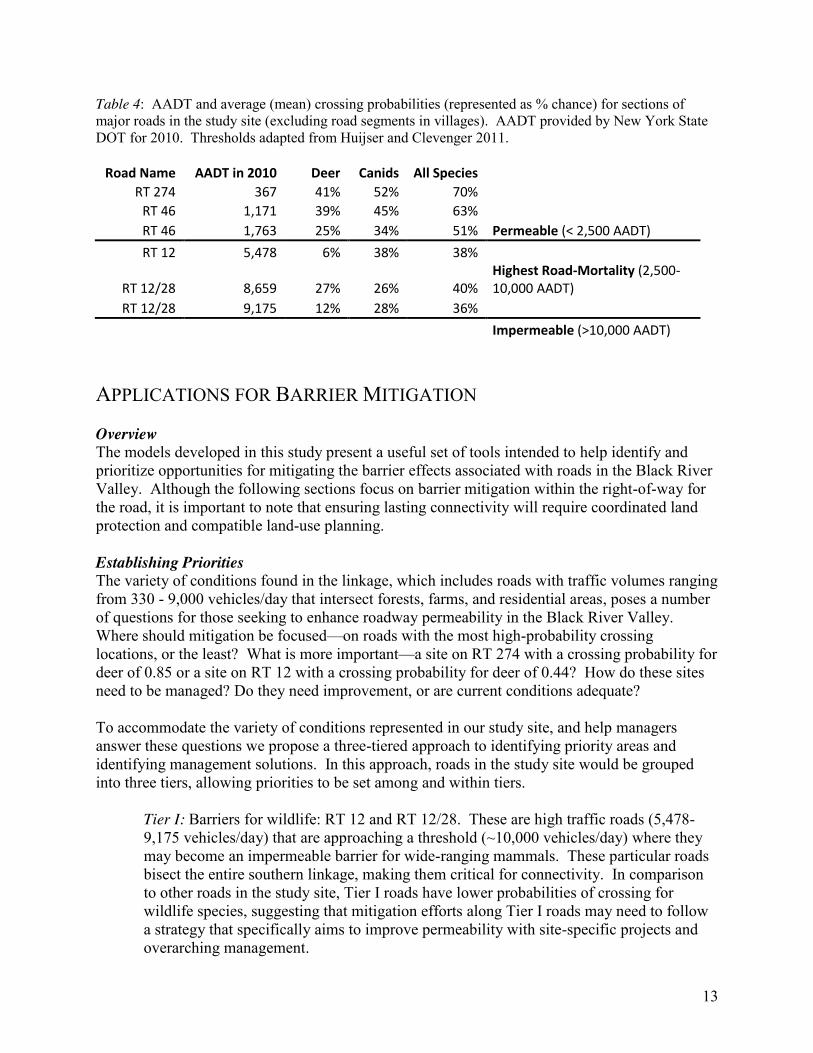
Table 4: AADT and average (mean) crossing probabilities (represented as % chance) for sections of major roads in the study site (excluding road segments in villages). AADT provided by New York State DOT for 2010. Thresholds adapted from Huijser and Clevenger 2011.
Road Name AADT in 2010 Deer Canids All Species
RT 274 367 41% 52% 70%
RT 46 1,171 39% 45% 63%
RT 46 1,763 25% 34% 51% Permeable (< 2,500 AADT) RT 12 5,478 6% 38% 38%
RT 12/28 8,659 27% 26% 40% Highest Road-Mortality (2,500-10,000 AADT)
RT 12/28 9,175 12% 28% 36%
Impermeable (>10,000 AADT)
APPLICATIONS FOR BARRIER MITIGATION Overview The models developed in this study present a useful set of tools intended to help identify and prioritize opportunities for mitigating the barrier effects associated with roads in the Black River Valley. Although the following sections focus on barrier mitigation within the right-of-way for the road, it is important to note that ensuring lasting connectivity will require coordinated land protection and compatible land-use planning. Establishing Priorities The variety of conditions found in the linkage, which includes roads with traffic volumes ranging from 330 - 9,000 vehicles/day that intersect forests, farms, and residential areas, poses a number of questions for those seeking to enhance roadway permeability in the Black River Valley. Where should mitigation be focused—on roads with the most high-probability crossing locations, or the least? What is more important—a site on RT 274 with a crossing probability for deer of 0.85 or a site on RT 12 with a crossing probability for deer of 0.44? How do these sites need to be managed? Do they need improvement, or are current conditions adequate? To accommodate the variety of conditions represented in our study site, and help managers answer these questions we propose a three-tiered approach to identifying priority areas and identifying management solutions. In this approach, roads in the study site would be grouped into three tiers, allowing priorities to be set among and within tiers.
Tier I: Barriers for wildlife: RT 12 and RT 12/28. These are high traffic roads (5,478-9,175 vehicles/day) that are approaching a threshold (~10,000 vehicles/day) where they may become an impermeable barrier for wide-ranging mammals. These particular roads bisect the entire southern linkage, making them critical for connectivity. In comparison to other roads in the study site, Tier I roads have lower probabilities of crossing for wildlife species, suggesting that mitigation efforts along Tier I roads may need to follow a strategy that specifically aims to improve permeability with site-specific projects and overarching management.
14
Tier II: Moderate impediments to wildlife: RT 46. These roads have moderate-low traffic volumes that are approaching a threshold (~2,500 vehicles/day) where increased traffic volumes can lead to increases in the frequency of road-related mortality and its impacts on wildlife populations. Currently, Tier II roads may be permeable, although in comparison to the lowest traffic roads (Tier III), they have slightly reduced probabilities of crossing for wildlife. At a minimum, management for Tier II roads should strive to maintain current conditions, but also be prepared to capitalize upon opportunities to improve permeability when feasible.
Tier III: Minimal impediments to wildlife: RT 274, Fuller Rd, and assorted town roads. These roads have the lowest traffic volumes and highest probabilities of wildlife crossing in the study site. Compared to Tier I and Tier II roads, wildlife on Tier III roads move more freely across the roadway and with reduced risk of vehicle-collision. Management for Tier III roads should maintain current conditions.
To make the most of limited resources, mitigation efforts should focus on areas where wildlife are most likely to cross roads—these areas are most likely to present conflicts between wildlife and traffic and where investing in mitigation is likely to have the greatest benefit. Although additional field work may be warranted to validate high-probability crossing locations for extensive mitigation projects, the crossing probabilities generated by our models allow for initial prioritization of specific sites within each Tier. It is worth noting that wildlife crossing probabilities may be just one of the variables under consideration when determining priority areas for barrier mitigation. Other variables may include habitat, land ownership status and relations, and the ability of mitigation at the site to meet multiple transportation management objectives. Managing for Connectivity A variety of techniques have been applied reduce the risk of animal-vehicle collisions,8 falling loosely into three categories: 1) including influencing motorist behavior with signs and warning signals; 2) influencing wildlife behavior with sound, light, food, and fencing; and 3) physically separating wildlife from the roadway with fences, barriers, and crossing structures. However, only a handful of these techniques have proven both effective and compatible with a connectivity agenda. For example, repelling wildlife by using reflectors and noisemakers may reduce collisions, but clearly is not desirable for connectivity as it makes the road a greater barrier to animals. Crossing structures and associated fencing, on the other hand, offer the potential for reducing road-related mortality while still enabling wildlife to cross over, or under, roads. For the purposes of this paper, overpasses or underpasses refer to structures specifically designed or managed to enhance wildlife movement. Low Cost-Short Term Solutions Although many connectivity projects capitalize upon new road construction or upgrades, our fieldwork indicates a number of opportunities may currently exist independently of the maintenance and replacement cycle. The use of drainage culverts as underpasses by wildlife is well documented in the scientific literature.4,9,10 In our study site, we observed the use of
15
culverts as underpasses by mink and weasel and bridges as underpasses for deer. A number of techniques are available to enhance the capacity of existing culverts to serve as underpasses without the cost associated with constructing new culverts.
An inventory of existing culverts in the site suggests potential for a strategy that selectively manages existing infrastructure to serve as wildlife underpasses. Our field technicians cataloged 221 culverts, bridges, or other similar structures in the study site. Of these, 166 were constructed with opening heights larger than 0.5m, the minimum recommended size for fisher, marten, and other small-medium sized carnivores.4,9 Roughly 40 culverts had an opening height greater than 1m, the minimum recommended size for larger carnivores such as coyote or bobcat.4 Only 9 culverts had opening heights that could accommodate large wildlife like deer, bear, and moose.4
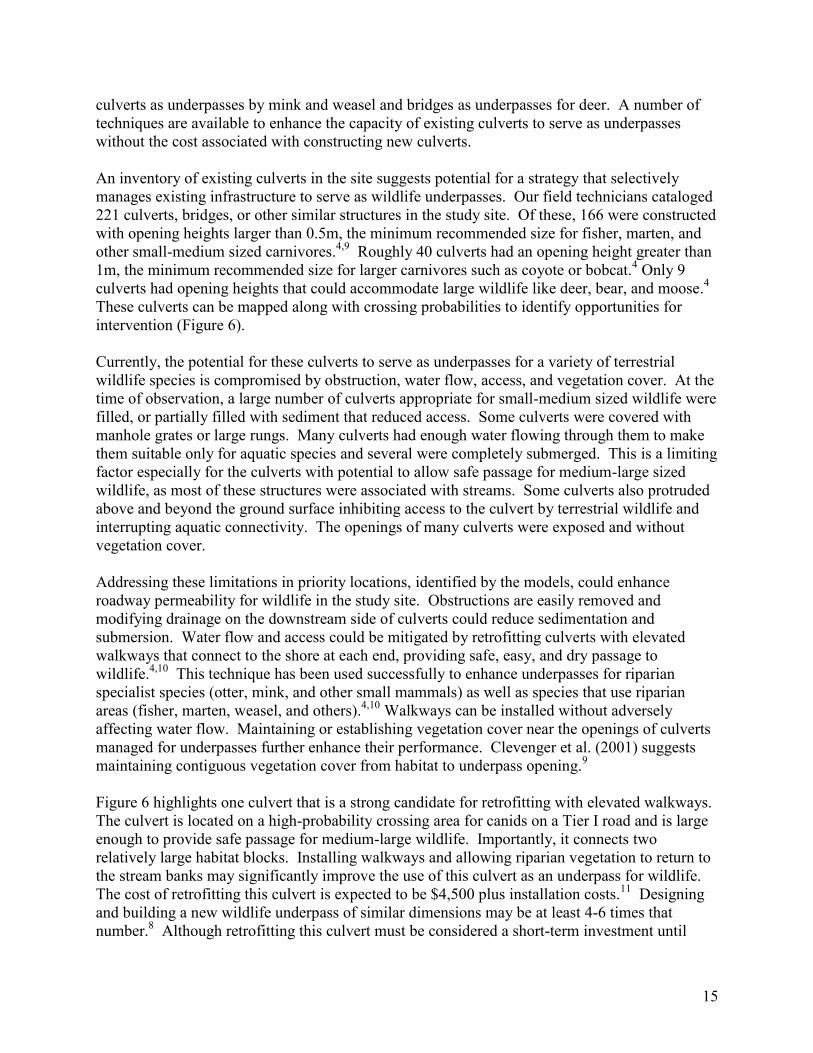
These culverts can be mapped along with crossing probabilities to identify opportunities for intervention (Figure 6). Currently, the potential for these culverts to serve as underpasses for a variety of terrestrial wildlife species is compromised by obstruction, water flow, access, and vegetation cover. At the time of observation, a large number of culverts appropriate for small-medium sized wildlife were filled, or partially filled with sediment that reduced access. Some culverts were covered with manhole grates or large rungs. Many culverts had enough water flowing through them to make them suitable only for aquatic species and several were completely submerged. This is a limiting factor especially for the culverts with potential to allow safe passage for medium-large sized wildlife, as most of these structures were associated with streams. Some culverts also protruded above and beyond the ground surface inhibiting access to the culvert by terrestrial wildlife and interrupting aquatic connectivity. The openings of many culverts were exposed and without vegetation cover.
Addressing these limitations in priority locations, identified by the models, could enhance roadway permeability for wildlife in the study site. Obstructions are easily removed and modifying drainage on the downstream side of culverts could reduce sedimentation and submersion. Water flow and access could be mitigated by retrofitting culverts with elevated walkways that connect to the shore at each end, providing safe, easy, and dry passage to wildlife.4,10 This technique has been used successfully to enhance underpasses for riparian specialist species (otter, mink, and other small mammals) as well as species that use riparian areas (fisher, marten, weasel, and others).4,10 Walkways can be installed without adversely affecting water flow. Maintaining or establishing vegetation cover near the openings of culverts managed for underpasses further enhance their performance. Clevenger et al. (2001) suggests maintaining contiguous vegetation cover from habitat to underpass opening.9 Figure 6 highlights one culvert that is a strong candidate for retrofitting with elevated walkways. The culvert is located on a high-probability crossing area for canids on a Tier I road and is large enough to provide safe passage for medium-large wildlife. Importantly, it connects two relatively large habitat blocks. Installing walkways and allowing riparian vegetation to return to the stream banks may significantly improve the use of this culvert as an underpass for wildlife. The cost of retrofitting this culvert is expected to be $4,500 plus installation costs.11 Designing and building a new wildlife underpass of similar dimensions may be at least 4-6 times that number.8 Although retrofitting this culvert must be considered a short-term investment until

16
habitat on both sides of the road is secured, that does not mean this is not a worthwhile opportunity. With the structure in place, land managers can wait for opportunity to secure the habitat through land-use planning, easement, or other protection.
17
Figure 6: Culverts along RT 12 that may have potential to serve as underpasses for medium to large wildlife. 0.9m-2.9m is the recommended opening size for medium-large wildlife such as coyote and bobcat; 3.0m-7.0m is the recommended opening size for large wildlife such as moose, bear, and deer.
18
Long Term Solutions Planning ahead in recognition of opportunities presented by maintenance and replacement of roads and related infrastructure vastly improves the options available for improving roadway permeability and enhancing connectivity. Perhaps most importantly, the information supplied by the models may help transportation planners avoid conflicts with wildlife resulting from new road construction or expansion. When these conflicts cannot be avoided, the models may help identify opportunities to mitigate mortality and barrier effects through the installation of crossing structures. Most major projects that make extensive use of crossing structures take place during new road construction or upgrades—capitalizing on economic advantages and opportunities to effectively design and locate crossing structures that meet the needs for wildlife and humans. Structures associated with new road construction or maintenance can be designed to meet the needs of traffic and wildlife. It may also be reasonable, especially along Tier I roads, to install new structures, solely designed to provide safe crossing for wildlife. An overview of design and spacing recommendations for crossing structures is available in Huijser and Clevenger (2011)4 and in a forthcoming TNC publication that addresses roadway permeability in the Northeast. Looking ahead: planning for connectivity in the Black River Valley Linkage Although the models described in this paper only provide tangible information for the 36 miles of roads that constitute the study site, The Nature Conservancy is in the process of further developing and refining the models for broader application. These efforts are twofold. First, TNC is drawing upon similar projects conducted in other priority linkages to acquire more data about wildlife movement that can be used to test and strengthen the predictive power of the models. Second, TNC is exploring the feasibility of using readily available cover data to model wildlife crossing probabilities throughout the linkage. Although the existing data is much coarser than the manually derived data used in this project, and would produce coarser results, it could serve as a rapid assessment tool for the remaining 330 miles of unsurveyed roads in the linkage. Priority areas identified by the rapid assessment could be candidates for further investigation, including wildlife tracking or development of fine-scale cover data to refine model outputs. A linkage-wide application would greatly improve the utility of the models to inform conservation and transportation planning. Understanding how all the roads in the linkage function together as barriers for wildlife movement enables opportunities to plan across the road network and coordinate with strategies for conserving crucial habitat throughout the linkage. CLOSING THOUGHTS The models developed in this study present a useful set of tools intended to help identify and prioritize opportunities for mitigating the barrier effects associated with roads in the Black River Valley. They provide relatively high-resolution, spatially explicit predictions of wildlife movement near crucial roads in the linkage that can inform planning efforts at multiple scales. The data are delivered in a tangible, easily accessible format that can be integrated with a variety
19
of other datasets and incorporated into any number of transportation, development, and conservation projects. Although the model predictions are currently limited to the 36-mile loop of roads targeted in this study, ongoing efforts to further develop and test the models should serve to increase their potential to guide planning across linkages in the Black River Valley and perhaps other important linkages in the eco-region. Additionally, the models provide a record of the current wildlife movement patterns that can be used as a baseline for tracking changes in roadway permeability through time. The models may also have applications as predictive tools to examine the effects of various development scenarios on wildlife movement in the study site.
It is important to restate that barrier mitigation is one component of a broad strategy for securing connectivity for wildlife in the Black River Valley that also includes land protection and land use planning. This report focuses primarily on roadways, a substantial barrier for wildlife in the study site, but this does not imply that barrier mitigation projects should be considered independent of land protection and planning projects. In fact, our models, which are largely driven by land-cover, underscore the connection between habitat and roadway permeability. However, for the sake of clarity and for identifying opportunities to make the roads themselves more permeable for wildlife, this study emphasizes options that exist within the right-of-way with the assumption that investments in structures and management to facilitate animal movement across roadways will have a greater return if coupled with investments protecting adjacent habitat. CITATIONS 1. Trombulak, S.C., M.G. Anderson, R.F. Baldwin, K. Beazley, J.C. Ray, C. Reining, G. Woolmer, C. Bettigole, G. Forbes, and L. Gratton. 2008. The Northern Appalachian/Acadian Ecoregion: Priority Locations for Conservation Action. Two Countries, One Forest Special Report No. 1. 2. Brown, M., C. Cheeseman, L. Garret, T. Dunham, D. Bryant. M. Glennon, and R. Long. 2010. Adirondack—Tug Hill Connectivity Project Planning Phase—Final Report. 3. Rinehart, K. 2011. Wildlife on Roads. Working document prepared for The Adirondack Chapter of The Nature Conservancy. 4. Huijser, M.P. and A.P Clevenger. 2011. Wildlife Crossing Structure Handbook: Design and Evaluation in North America. Final Report. Number FHWA-CFK/TD-11-003. 5. Seiler, A. 2005. Predicting locations of moose-vehicle collisions in Sweden. Journal of Applied Ecology 42: 371-382. 6. Gibbs, J.P., D.J. Leopold, and P.K. Ducey. 2011. Effects on New York State Roadways on Amphibians and Reptiles: A research and adaptive mitigation project. Prepared for New York Metropolitan Transportation Council. 7. Seiler, A. 2003. The toll of the automobile: Wildlife and roads in Sweden. Doctoral Thesis. Swedish University of Agricultural Sciences.
20
8. Huijser, M.P., P. McGowen, J. Fuller, A. Hardy, A. Kociolek, A.P. Clevenger, D. Smith, and R. Ament. 2008. Wildlife-Vehicle Collision Reduction Study: Report to Congress. Report no. FHWA-HRT-08-034. 9. Clevenger, A.P., B. Chruszcz, and K. Gunson. 2001. Drainage Culverts as Habitat Linkages and Factors Affecting Passage by Mammals. Journal of Applied Ecology 38:1340-1349. 10. Foresman, K.R. 2004. Small mammal use of modified culverts on the Lolo South project of Western Montana--an update. Pg 342-343 in 2003 Proceedings of the International Conference on Ecology and Transportation, edited by C. Leroy Irwin, Paul Garrett, and K.P. McDermott. Raleigh, NC: Center for Transportation and the Environment, North Carolina State University, 2003. 11. Clyde Bennett of Roscoe Culvert, Billings, Montana. Personal Communication. 2012.