applying cellular automata for simulating and assessing...
TRANSCRIPT

(IJACSA) International Journal of Advanced Computer Science and Applications,
Vol. 5, No. 2, 2014
1 | P a g e
www.ijacsa.thesai.org
Applying Cellular Automata for Simulating and
Assessing Urban Growth Scenario Based in Nairobi,
Kenya
Kenneth Mubea,
Remote Sensing Research Group
(RSRG),
University of Bonn,
Bonn, Germany
Roland Goetzke,
Remote Sensing Research Group
(RSRG),
University of Bonn,
Bonn, Germany
Gunter Menz,
Center for Remote Sensing of Land
Surfaces (ZFL),
University of Bonn,
Bonn, Germany
Abstract—This research explores urban growth based
scenarios for the city of Nairobi using a cellular automata urban
growth model (UGM). African cities have experienced rapid
urbanization over the last decade due to increased population
growth and high economic activities. We used multi-temporal
Landsat imageries for 1976, 1986, 2000 and 2010 to investigate
urban land-use changes in Nairobi. Our UGM used data from
urban land-use of 1986 and 2010, road data, slope data and
exclusion layer. Monte-Carlo technique was used for model
calibration and Multi Resolution Validation (MRV) technique for
validation. Simulation of urban land-use was done up to the year
2030 when Kenya plans to attain Vision 2030. Three scenarios
were explored in the urban modelling process; unmanaged
growth with no restriction on environmental areas, managed
growth with moderate protection, and a managed growth with
maximum protection on forest, agricultural areas, and urban
green. Thus alternative scenario development using UGM is
useful for planning purposes so as to ensure sustainable
development is achieved. UGM provides quantitative, visual,
spatial and temporal information which aid policy and decision
makers can make informed decisions.
Keywords—Urban Growth; Scenarios; Nairobi; Cellular
automata; Simulation; sustainable development
I. INTRODUCTION
Sustainable planning is crucial for future development of cities. Over the last decade there has been large rural urban migration in African cities as people search for employment and better amenities. This has led to a strain on the existing amenities and infrastructure [1]. There has been emergence of slums in cities in Africa such as Nairobi because of unsuitable land-use planning [2]. Undesirable consequences have been noted such as pollution, depletion of natural resources, inadequate transportation systems, urban sprawl among other negative environmental and social effects. Thus there is need for an integrated urban planning paradigm in order to identify and anticipate urban dynamics effectively.
Integration of remote sensing and urban growth modelling has been the frontier edge of urban research. Remote sensing provides spatially consistent data sets that cover large areas with both high spatial detail and high temporal frequency [1]. Such data sets are useful in land-use monitoring and simulation. As urbanisation occurs, changes in land-use
increase thus taking up the natural resource base such as forests and agricultural land. This in turn leads to fragmentation and land degradation [3].
Models based on cellular automata (CA) have been used over the last decades in simulating urban development growth and patterns [4]. Early models were based on demographic trends and were not successful in simulating contemporary urban growth [5], [6], [7], and [8]. However, land-use modelling using CA utilise biophysical factors making it possible to simulate various patterns and intensities of urban growth [4]. Land-use change models have been used as decision support tools in urban planning in order to inform planners and decision makers [9]. For an urban model to be used in an area of interest it needs to be localised and this involves calibration. This is done in order to make it adapt to the endogenous characteristics of the particular environment for simulation [4]. Urban models aid in making informed decisions on land-use planning in the context of future development. Sustainable development is thus possible once various simulations of land-use scenarios have been obtained and this helps in understanding the consequences of different driving forces [10].
The “eXtendable Unified Land-use modelling platform” (XULU) was developed as a generic modelling framework at the University of Bonn, Germany [11]. It is able to handle several model types simultaneously such as statistic dynamic or agent based models of urban growth as well land-use change. We adopted the Urban Growth Model (UGM) on the modelling framework XULU for Nairobi. UGM was first developed and applied in the German federal state of North-Rhine Westphalia [12]. UGM is based on the modelling algorithm of the SLEUTH model [13] which uses the concept of cellular automata. Calibration of UGM involved five model parameters similar to SLEUTH model so as to make it adapt to Nairobi [4], [14].
Urban growth modelling based on cellular automata has been used mostly in cities in North America and European cities. Cities in Africa are different to the counterpart cities in the western world in various ways. Major cities in Africa are characterised by high rural urban migration which result on a strain on local urban transport systems, traffic congestion, development of informal settlements [1].
(IJACSA) International Journal of Advanced Computer Science and Applications,
Vol. 5, No. 2, 2014
2 | P a g e
www.ijacsa.thesai.org
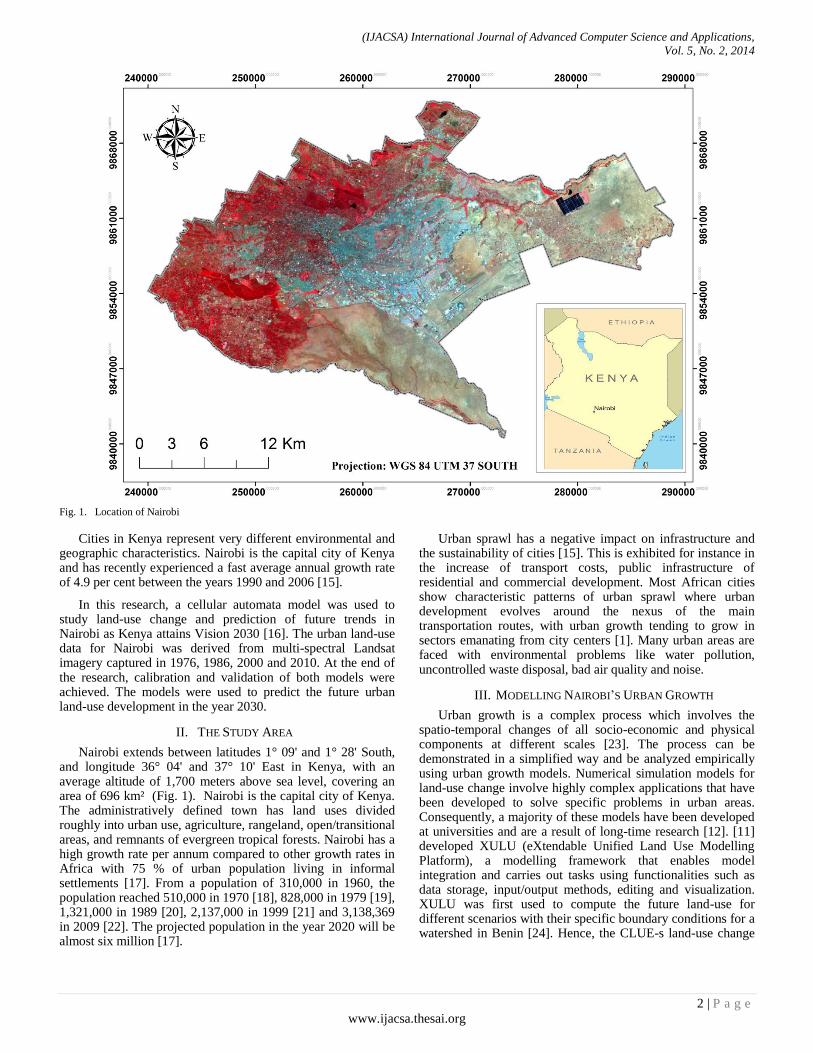
Fig. 1. Location of Nairobi
Cities in Kenya represent very different environmental and geographic characteristics. Nairobi is the capital city of Kenya and has recently experienced a fast average annual growth rate of 4.9 per cent between the years 1990 and 2006 [15].
In this research, a cellular automata model was used to study land-use change and prediction of future trends in Nairobi as Kenya attains Vision 2030 [16]. The urban land-use data for Nairobi was derived from multi-spectral Landsat imagery captured in 1976, 1986, 2000 and 2010. At the end of the research, calibration and validation of both models were achieved. The models were used to predict the future urban land-use development in the year 2030.
II. THE STUDY AREA
Nairobi extends between latitudes 1° 09' and 1° 28' South, and longitude 36° 04' and 37° 10' East in Kenya, with an average altitude of 1,700 meters above sea level, covering an area of 696 km² (Fig. 1). Nairobi is the capital city of Kenya. The administratively defined town has land uses divided roughly into urban use, agriculture, rangeland, open/transitional areas, and remnants of evergreen tropical forests. Nairobi has a high growth rate per annum compared to other growth rates in Africa with 75 % of urban population living in informal settlements [17]. From a population of 310,000 in 1960, the population reached 510,000 in 1970 [18], 828,000 in 1979 [19], 1,321,000 in 1989 [20], 2,137,000 in 1999 [21] and 3,138,369 in 2009 [22]. The projected population in the year 2020 will be almost six million [17].
Urban sprawl has a negative impact on infrastructure and the sustainability of cities [15]. This is exhibited for instance in the increase of transport costs, public infrastructure of residential and commercial development. Most African cities show characteristic patterns of urban sprawl where urban development evolves around the nexus of the main transportation routes, with urban growth tending to grow in sectors emanating from city centers [1]. Many urban areas are faced with environmental problems like water pollution, uncontrolled waste disposal, bad air quality and noise.
III. MODELLING NAIROBI’S URBAN GROWTH
Urban growth is a complex process which involves the spatio-temporal changes of all socio-economic and physical components at different scales [23]. The process can be demonstrated in a simplified way and be analyzed empirically using urban growth models. Numerical simulation models for land-use change involve highly complex applications that have been developed to solve specific problems in urban areas. Consequently, a majority of these models have been developed at universities and are a result of long-time research [12]. [11] developed XULU (eXtendable Unified Land Use Modelling Platform), a modelling framework that enables model integration and carries out tasks using functionalities such as data storage, input/output methods, editing and visualization. XULU was first used to compute the future land-use for different scenarios with their specific boundary conditions for a watershed in Benin [24]. Hence, the CLUE-s land-use change

(IJACSA) International Journal of Advanced Computer Science and Applications,
Vol. 5, No. 2, 2014
3 | P a g e
www.ijacsa.thesai.org
model, developed by [25] was implemented in the XULU modelling framework.
A majority of urban growth models are restricted to simulate changes of one land-use category, which is urban, and that typically just in one direction, which is growth [12]. SLEUTH is such a model and is an acronym for “Slope, Land use, Exclusion, Urban, Transport, Hill shade”, as its main input parameters. SLEUTH is a cellular automaton (CA) based urban growth and land-use change model [13]. The model was initially applied in the United States of America but has also been applied in other regions of the world such as in Europe [26], South America [27] and Southeast Asia [28]. SLEUTH consists of two components, an urban growth model based on the Clarke Urban Growth Model (UGM) described in [13] and a so-called Land cover Deltatron Model [29] to simulate other land-use changes induces by urban growth. In most of the studies using SLEUTH described in the scientific literature only the UGM component of SLEUTH is applied.
UGM has been implemented in the modelling platform XULU in a modified way [12]. UGM now only needs four spatial input parameters namely a map of urban land-use, transportation, slope and exclusion. The exclusion layer determines, which areas in the research area cannot be changed (e.g. water bodies or protected areas) or, if not excluded, are by a certain degree resistant against urbanization. The transportation layer represents the road network in a research area. While SLEUTH needs at least four urban land-use data sets to calculate a set of calibration coefficients [4], the modified UGM in XULU only needs a map for the starting year of the calibration phase and a reference map at the end year. The simulated urban area of the end year is compared to the reference map with the Multiple Resolution Validation (MRV) as described in [30].
Calibration is the most crucial step in any modelling application [14]. In the calibration phase of UGM a brute-force method is used in order to determine five calibration parameters. These parameters control the transition rules that are implemented in the model and include: dispersion, breed, spread, slope resistance and road gravity. Dispersion determines the dispersiveness of the outward distribution and controls the number of pixels that are selected randomly for possible urbanization. Breed refers to the probability that a newly generated settlement starts its own growth. Spread controls how much existing settlements radiate. Slope resistance influences the likelihood of growth on steep slopes. Road gravity influences the creation of new centers along roads.
A number of Monte-Carlo iterations are performed in the brute-force calibration to obtain the best set of the five calibration parameters. This consequently translates to four different kinds of urban growth: spontaneous growth, diffusive (new spreading centers), organic (infill and edge growth) and road influenced growth. Because testing all possible parameter combinations in Monte-Carlo iterations in a brute-force way would be way too time consuming, calibration is performed in sequential phases ranging from a coarse to a fine calibration [4].
UGM’s underlying simulation technique is CA. A CA is a discrete dynamic system in which space is divided into regular spatial cells, and time progresses in discrete steps [31]. Each cell in the system has one of a finite number of states. The state of each cell is updated according to local rules, that is, the state of a cell at a given time depends on its own state and the states of its neighbors at the previous time step [32]. Cellular automata are seen not only as a framework for dynamic spatial modelling but as a paradigm for thinking about complex spatio-temporal phenomena and an experimental laboratory for testing ideas [33]. A cellular automaton consists of five basic elements namely cell space, cell state, cell neighborhood, transition rules and time.
The number and location of the randomly selected cells is controlled by the growth parameters. Depending on the type of growth different properties of the selected cells are investigated. For the diffusive growth (new spreading centers) e.g. this would be the existence of non-built-up cells in the direct proximity of a selected built-up cell and the slope of these cells. Depending on the specified parameters and transition rules the CA computes, if a cell is available for change or not. The CA knows only two states: 1 = urban/built-up and 0 = non- urban/non-built-up.
XULU is a stand-alone JAVA application and serves as a modelling framework whose functionalities include input, output, editing and visualization. XULU offers a model independent graphical user interface. The core program comprises the fields of data management, input/output routines for data import and export, data structure, memory management and data visualization [11]. The user has to load the necessary data objects into the data pool and allocate them to the individual model resources. Several plug-ins of land-use modelling are implemented in XULU include: spatial data types for raster and vector data, I/O routines for shape files and different raster types (e.g. ASCII and GeoTIFF) and a layer-based visualization for raster and vector maps [11]. Additionally land-use change models are loaded as plug-ins. Models that are implemented so far include CLUE-s and the Urban Growth Model UGM [12].
Model calibration is required in order to ensure that a model simulates the reality fully. Diverse model users have different ways of assessing land-use models. Whereas there is a group of model users who wish to make predictions as accurate as possible, another group emphasizes on the ability of a model to support the general knowledge of processes and mechanisms of land-use change [34].
The method of multiple resolution validation (MRV) was used in a comparison of land-use models in which the tests were conducted in seven laboratories with 13 applications, 9 different models and in 12 study areas [35]. Typically maps are compared pixel-wise and every pixel is calculated as an error, where the model map does not exactly fit with the reference map. In MRV method four neighboring pixels are averaged stepwise. The amount of correct pixels increases in every step, until in the last step when the whole research area is inside of one big pixel and both location agreement and location disagreement approach 0 [12]. The MRV technique was incorporated in UGM.

(IJACSA) International Journal of Advanced Computer Science and Applications,
Vol. 5, No. 2, 2014
4 | P a g e
www.ijacsa.thesai.org
In order to evaluate model results with the technique described above, three datasets are necessary: a reference map of time 1, a reference map of time 2 and a simulation map of time 2. The reference map of time 1 is the initial point for modelling, that is, land-use map of 1986 and at the same time serves as a Null-model, which is the assumption that no change has taken place. Therefore, the reference maps of t1 and t2 are compared. To evaluate the model result, the simulation map of t2 is compared with the reference map of t2.
IV. SCENARIOS OF URBAN GROWTH
The use of scenarios to address land-use changes have become useful tools in the assessment of land-use dynamics [36]. This approach is required to anticipate the consequences of various development scenarios. However scenarios are not predictions but rather they are an approach to help manage decisions based on the interpretation of qualitative descriptions of alternative futures translated into quantitative scenarios [37]. There is need for such scenarios to be integrated in land legislation. Several policies and strategies have been formulated by various national and regional governments in order to minimize the negative impacts caused by improper urban developments [38]. However, such policies are not well defined in the context of Kenya. Thus, exploring various scenarios by predicting future urban land-use patterns under different ‘‘what-if’’ conditions can help in the management of urban expansion and change as well as in the development of alternative plans before irreversible transformations occur [39]. This paradigm can help Kenya to manage its resources sustainably.
The Government of Kenya formulated Kenya Vision 2030 [16]. This was an attempt at maximum protection of natural resources so as to ensure sustainable development is attained in the year 2030. Cities in Kenya have undergone rapid urbanization as people migrate into cities in search of employment and better amenities. Thus this gave us the motivation to investigate scenarios of urban growth in Nairobi. Currently there are a few studies on scenario-based urban growth simulation in Nairobi. Nevertheless, [1] used SLEUTH to model urban growth in Nairobi.
In order to test the usefulness of the urban growth modelling and to provide a coherent and alternate framework for the policy makers, we explored three scenarios in the modelling process. First scenario depicts an unmanaged growth with no restriction on environmental areas, such as forest, agriculture and wetland. Thus urban growth continues with the historical trend of land transition and permits future urban growth allocation without any constraint. The second scenario assumes a managed growth with moderate protection. Here the exclusion layer included government buildings and forest cover. Cities in Kenya have undergone rapid urbanization due to high rural to urban migration as people search for employment and social amenities [2]. There has been significant effect to preserve forest cover in Kenya under the Forest Act, 2005 [40]. The third scenario simulates a managed growth with maximum protection on forest, government
reserved areas, government buildings, military bases, airports, and urban green. Government reserved areas include parks, cemeteries.
V. ANALYSIS
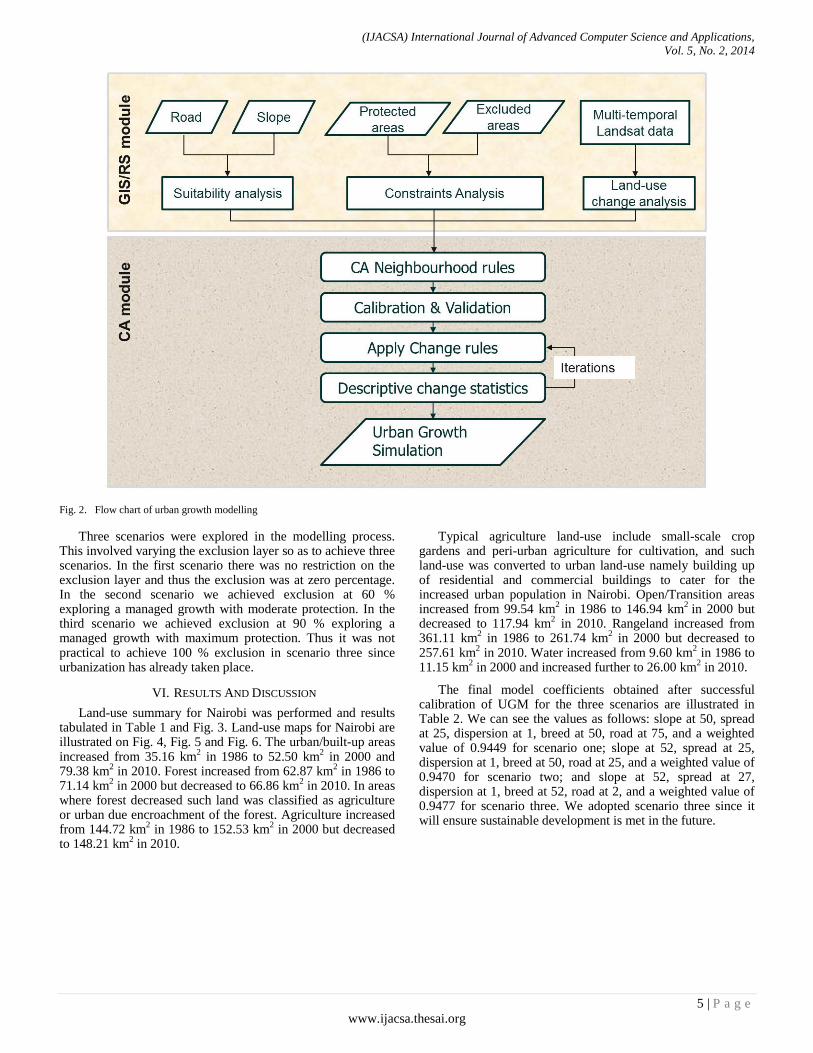
Scenarios based urban growth modelling of Nairobi involved datasets preparation, land-use change analysis and modelling using UGM. Fig. 2 shows the flow chart of the major steps applied in this research.
A. Data
Modelling of Nakuru utilized urban extents extracted from land-use maps for 1986 and 2010 as inputs. Other layers used included slope, areas excluded from development and road network. The road layer included three weight values of 100, 50 and 25 [26]. A weight value of 100 was assigned to class A roads (International trunk roads), 50 was assigned to class B and C roads (National Trunk Roads), and 25 was assigned to local streets (Minor roads). The road classification in Kenya is explained in [41]. Thus a road with a value of 100 has the highest potential of attracting urban growth compared to a local street with a value of 25.
B. Land-use change analysis
Land-use classification of Nairobi consisted of six land-use classes; namely urban, forest, agriculture, open/transitional areas, water and rangeland. Urban land-use included built-up areas within the research area. Forest included evergreen forest, mixed forests with high densities of trees, little or under-storey vegetation. Open/transitional areas included bare land, exposed areas, quarries and transitional areas. Water included rivers and reservoirs. The sewage treatment plant in Ruai was also captured under water class. Rangeland included bush land and ground layer covered by grass and sparsely disturbed scrub species.
Image pre-processing steps for the optical datasets were radiometric correction and geometric correction. Support vector machine (SVM) classification was applied to all the data sets and its performance assessed using error matrices. Recently SVM has been found to perform better compared to maximum likelihood classifier [42]. Post-classification refinements were enforced to diminish categorization errors as a result of the similarities in spectral signatures of certain classes. Spatial modeler and additional rule based procedures were adopted to overcome these classification challenges and differentiate between classes.
C. Modelling using UGM
Model calibration of UGM involved running the model using default parameters of slope, breed, dispersion, road and spread. The default parameter values were 1, 50 and 100. Model calibration was done iteratively in four sequences from coarse to fine calibration as the parameters were varied using Monte Carlo technique. The MRV method was used to achieve the optimal parameterization for the UGM during the calibration phase as well as for the validation of the model results.
(IJACSA) International Journal of Advanced Computer Science and Applications,
Vol. 5, No. 2, 2014
5 | P a g e
www.ijacsa.thesai.org
Fig. 2. Flow chart of urban growth modelling
Three scenarios were explored in the modelling process. This involved varying the exclusion layer so as to achieve three scenarios. In the first scenario there was no restriction on the exclusion layer and thus the exclusion was at zero percentage. In the second scenario we achieved exclusion at 60 % exploring a managed growth with moderate protection. In the third scenario we achieved exclusion at 90 % exploring a managed growth with maximum protection. Thus it was not practical to achieve 100 % exclusion in scenario three since urbanization has already taken place.
VI. RESULTS AND DISCUSSION
Land-use summary for Nairobi was performed and results tabulated in Table 1 and Fig. 3. Land-use maps for Nairobi are illustrated on Fig. 4, Fig. 5 and Fig. 6. The urban/built-up areas increased from 35.16 km
2 in 1986 to 52.50 km
2 in 2000 and
79.38 km2 in 2010. Forest increased from 62.87 km
2 in 1986 to
71.14 km2 in 2000 but decreased to 66.86 km
2 in 2010. In areas
where forest decreased such land was classified as agriculture or urban due encroachment of the forest. Agriculture increased from 144.72 km
2 in 1986 to 152.53 km
2 in 2000 but decreased
to 148.21 km2 in 2010.
Typical agriculture land-use include small-scale crop gardens and peri-urban agriculture for cultivation, and such land-use was converted to urban land-use namely building up of residential and commercial buildings to cater for the increased urban population in Nairobi. Open/Transition areas increased from 99.54 km
2 in 1986 to 146.94 km
2 in 2000 but
decreased to 117.94 km2 in 2010. Rangeland increased from
361.11 km2 in 1986 to 261.74 km
2 in 2000 but decreased to
257.61 km2 in 2010. Water increased from 9.60 km
2 in 1986 to
11.15 km2 in 2000 and increased further to 26.00 km
2 in 2010.
The final model coefficients obtained after successful calibration of UGM for the three scenarios are illustrated in Table 2. We can see the values as follows: slope at 50, spread at 25, dispersion at 1, breed at 50, road at 75, and a weighted value of 0.9449 for scenario one; slope at 52, spread at 25, dispersion at 1, breed at 50, road at 25, and a weighted value of 0.9470 for scenario two; and slope at 52, spread at 27, dispersion at 1, breed at 52, road at 2, and a weighted value of 0.9477 for scenario three. We adopted scenario three since it will ensure sustainable development is met in the future.

(IJACSA) International Journal of Advanced Computer Science and Applications,
Vol. 5, No. 2, 2014
6 | P a g e
www.ijacsa.thesai.org
TABLE I. LAND-USE SUMMARY AND ERROR ESTIMATES FOR NAIROBI
Year 1986 2000 2010
Land-use classes Area (km2) % Area (km2) % Area (km2) %
Urban 35.16 4.9 52.50 7.4 79.38 11.1
Forest 62.87 8.8 71.14 10.0 66.86 9.4
Agriculture 144.72 20.3 152.53 21.4 148.21 20.8
Open/transition areas 99.54 14.0 146.94 20.6 117.94 16.5
Rangeland 361.11 50.6 261.74 36.7 257.61 36.1
Water 9.60 1.3 11.15 1.6 26.00 3.6
Total 696 100 696 100 696 100
Overall Accuracy (%) 92.64 90.9 91.87
Fig. 3. Land-use estimates for Nairobi
0
50
100
150
200
250
300
350
400
Are
a (K
m2)
Land-use classes
Land-use estimates for Nairobi
1986
2000
2010

(IJACSA) International Journal of Advanced Computer Science and Applications,
Vol. 5, No. 2, 2014
7 | P a g e
www.ijacsa.thesai.org
Fig. 4. Land-use map for Nairobi in 1986
Fig. 5. Land-use map for Nairobi in 2000

(IJACSA) International Journal of Advanced Computer Science and Applications,
Vol. 5, No. 2, 2014
8 | P a g e
www.ijacsa.thesai.org
Fig. 6. Land-use map for Nairobi in 2010
TABLE II. BEST MODEL PARAMETERS OBTAINED IN THE THREE SCENARIOS
Model parameters
Scenario Slope Spread Dispersion Breed Road Weighted value
1 50 25 1 50 75 0.9449
2 52 25 1 50 25 0.9470
3 52 27 1 52 2 0.9477
An evaluation of the three scenarios was conducted as shown in Table 3. The simulated urban growth values of scenario one, two and three were 82.87 km
2, 76.61 km
2, and
73.14 km2 in 2010 and 141.72 km
2, 127.96 km
2, and 118.35
km2 in 2030 respectively. The urban growth simulation maps
for all scenarios are illustrated in Fig. 7, Fig. 8, Fig. 9, Fig. 10, Fig. 11 and Fig. 12.
We conducted two map comparisons in Erdas imagine 2011 model maker for scenario three for the city of Nairobi. According to [35] there are three possible two-map comparisons namely observed change, prediction change and prediction error as described above in urban growth modelling of Nairobi. Observed change compares the reference map of time 1 and the reference map of time bearing in mind the dynamics of the landscape. Prediction change compares between the reference map of time 1 and the prediction map of time 2 and thus revealing the behavior of the model. Prediction error compares between the reference map of time 2 and the prediction map of time 2 and thus ascertains the accuracy of the
prediction. In our case time 1 referred to as the year 1986 and time 2 as the year 2010.
The observed change in urban land-use between 1986 and 2010 is illustrated on Fig. 13. Here we have observed built gain of 65.25 km
2, observed built persistence 17.80 km
2, observed
non-built persistence of 607.19 km2 and observed built loss of
3.41 km2 obtained from the observed map of the year 2010.
The predicted change in urban land-use between 1986 and 2010 is illustrated on Fig. 14. Here we have predicted built persistence of 73.79 km
2 and predicted non-built persistence of
620.51 km2 obtained from the predicted map of the year 2010.
The predicted error in urban land-use between 1986 and 2010 is illustrated on Fig. 15. Here we have: non-built observed and built predicted of 57.95 km
2; and built observed and built
predicted of 40.99 km2 obtained using the observed map of the
year 2010 and the predicted map of the year 2010. Our UGM for Nairobi predicts the year 2010 accurately since our gain of built is larger than the loss of built by16.96 km
2.

(IJACSA) International Journal of Advanced Computer Science and Applications,
Vol. 5, No. 2, 2014
9 | P a g e
www.ijacsa.thesai.org
TABLE III. MODEL EVALUATION FOR NAIROBI
Year 2010 2030
Scenario 1 2 3 1 2 3
Actual Urban (km2) 79.38 79.38 79.38
Simulated Urban (km2) 82.87 76.61 73.14 141.72 127.96 118.35
Fig. 7. Urban growth simulation in Nairobi in scenario one (2010)
Fig. 8. Urban growth simulation in Nairobi in scenario one (2030)

(IJACSA) International Journal of Advanced Computer Science and Applications,
Vol. 5, No. 2, 2014
10 | P a g e
www.ijacsa.thesai.org
Fig. 9. Urban growth simulation in Nairobi in scenario two (2010)
Fig. 10. Urban growth simulation in Nairobi in scenario two (2030)

(IJACSA) International Journal of Advanced Computer Science and Applications,
Vol. 5, No. 2, 2014
11 | P a g e
www.ijacsa.thesai.org
Fig. 11. Urban growth simulation in Nairobi in scenario three (2010)
Fig. 12. Urban growth simulation in Nairobi in scenario three (2030)

(IJACSA) International Journal of Advanced Computer Science and Applications,
Vol. 5, No. 2, 2014
12 | P a g e
www.ijacsa.thesai.org
In order for an urban growth model to be resourceful to various stakeholders such as policy makers and urban planners, simulation of urban growth has to be performed after calibration. Scenarios three was selected as the best plausible cause for urban planning management with maximum protection on resources. Thus the likelihood of new settlements or built-up areas in Nairobi was obtained at a weighted value of 0.9477 as per scenario three. This indicates that new urban growth is most likely to be caused by breed (at 52), i.e. probability that a newly generated settlement starts its own growth, then followed by slope (at 52) influenced growth and spread (at 27), and finally followed by road and dispersion as least likely factors for new urban growth. Thus, this implies that new areas are developed for residential and commercial uses, which lie in proximity to roads. Such growth could be as a result of high rural urban migration witnessed in Nairobi as new people move immigrate in search for employment, social amenities and business opportunities.
VII. CONCLUSION
We used Nairobi, Kenya’s capital city as an example of a fast expanding African city to analyze the dynamics of land-use changes between 1986 and 2010, and to simulate urban growth into 2030 using cellular automata. Land-use change analyzed demonstrated that substantial changes have taken place as a result of rapid urban growth. Urban land-use maps from image classification were used alongside other datasets in modelling urban growth in Nairobi using UGM. The Monte Carlo iterative method was applied in the UGM calibration. Three scenarios were explored in the urban modelling process; unmanaged growth with no restriction on environmental areas, managed growth with moderate protection, and a managed growth with maximum protection on forest, agricultural areas, and urban green. Scenario three was selected as a plausible paradigm to ensure sustainable development is achieved.
Kenya plans to achieve Vision 2030 in the year 2030 and this can be guided using scenario based urban growth. Thus to achieve the economic and social strategy there is need for land-use scenarios as we conducted in this research in order to cater for anticipated urban growth in the future. Urban growth modelling is vital for guiding decision making for resource management.
Simulated urban growth results for the year 2030 using scenario three indicate that there is the need for tactical planning so as to address rapid urban growth in Nairobi. Therefore cellular automata are a valuable approach for regional modelling of big African cities such as Nairobi. Hence it is noble to explore the use of UGM in other cities in Africa and its performance documented accordingly
ACKNOWLEDGMENT
The authors express their gratitude to the initiators of XULU and especially M. Schmitz, H. P. Thamm, Th. Bode and A. B. Cremers. Additionally the authors are grateful to German Academic Exchange Service (DAAD) and National Council for Science and Technology (NCST in Nairobi, Kenya) for providing the stipend to facilitate this research. Likewise the authors acknowledge the contribution of the anonymous reviewers for their useful comments.
References
[1] C. N. Mundia and M. Aniya, "Modeling urban growth of Nairobi city using cellular Automata and Geographical information systems," Geographical Review of Japan, vol. 80, no. 12, pp. 777-788, 2007.
[2] C. N. Mundia and M Aniya, "Analysis of land use changes and urban expansion of Nairobi city using remote sensing and GIS," International Journal of Remote Sensing, vol. 26, no. 13, pp. 2831-2849, 2005
[3] C. N. Mundia and M. Aniya, "Dynamics of land use/cover changes and degradation of Nairobi city, Kenya," Land Degradation and Development, vol. 17, pp. 97-108, 2006.
[4] E. Silva and K. C. Clarke, "Calibration of the SLEUTH urban growth model for Lisbon and Porto, Portugal," Computers, Environment and Urban Systems, vol. 26, no. 6, pp. 525–552, 2002.
[5] G. Orcutt, M. Greenberger, A. Rivlin, and J. Korbels, Micro analysis of social economic systems: A simulation study. New York: Harper and Row Publishers, 1961.
[6] F. Wu, "GIS based simulation as an exploratory analysis for space: time processes," The Journal of Geographic Systems, vol. 1, no. 3, pp. 199-218, 1999.
[7] N. Oreskes, K. Sharader-Freschete, and K. Belitz, "Verification, validation, and confirmation of numerical models in earth sciences," Science, vol. 263, pp. 641-646, 1994.
[8] M. Wegener, "Operational urban models: State of the art," Journal of the American Planning Association, vol. 60, no. 1, pp. 17-30, 1994.
[9] A. Hill and C. Lindner, "Simulation informal urban growth in Dar es Salaam, Tanzania - A CA-based land-use simulation model supporting strategic urban planning," in Modeling and Simulating Urban Processes. Munster: LIT-Verlag, 2011, pp. 77-98.
[10] P. Verburg, P. Schot, M. Dijst, and A. Veldkamp, "Land use change modelling: current practice and research priorities," GeoJournal, vol. 61, no. 4, pp. 309-324, 2004.
[11] M. Schmitz, T. Bode, H. P. Thamm, and A. B. Cremers, "XULU - A generic JAVA-based platform to simulate land use and land cover change ( LUCC )," in MODSIM 2007 International Congress on Modelling and Simulation, 2007, pp. 2645–2649.
[12] R. Goetzke and M. Judex, "Simulation of urban land-use change in North Rhine- Westphalia ( Germany ) with the Java-based modelling plat- form Xulu," in Modeling and Simulating Urban Processes. Munster: LIT-Verlag, 2011, pp. 99–116.
[13] K. Clarke, S. Hoppen, and L. Gaydos, "A self-modifying cellular automaton model of historical urbanization in the San Francisco Bay area," Environment and Planning B: Planning and Design, vol. 24, no. 2, pp. 247-261, 1997.
[14] K. Clarke, S. Hoppen, and L. Gaydos, "Methods and techniques for rigorous calibration of cellular automaton model of urban growth," in Third International Conference/Workshop on Integrating GIS and Environmental Modeling, Santa Fe, 1996.
[15] UN-HABITAT, "State of the World Cities 2010/2011," Bridging the Urban Divide, 2010.
[16] Government of Kenya, Kenya Vision 2030, 2007.
[17] UN-HABITAT, Regional Urban Sector Profile Study (RUSPS), 2005.
[18] Republic of Kenya, Kenya population census 1969, 1970.
[19] Republic of Kenya, Kenya population census 1979, 1981.
[20] Republic of Kenya, Kenya population census 1989, 1994.
[21] Republic of Kenya, Economic survey 2000, 2000.
[22] Republic of Kenya, Economic survey 2010, 2010.
[23] J. Han, X. Cao, and H. Imura, "Application of an integrated system dynamics and cellular automata model for urban growth assessment: A case study of Shanghai, China," Landscape and Urban Planning, vol. 91, no. 3, pp. 133–141, 2009.
[24] G. Menz et al., "Land use and land cover modeling in Central Benin," in Impacts of Global Change on the Hydrological Cycle in West and Northwest Africa. Heidelberg: Springer, 2010, pp. 70-73.
[25] P. H. Verburg et al., "Modelling the Spatial Dynamics of Regional Land Use: The CLUE-s Model," Environmental Management, pp. 391-405, 2002.

(IJACSA) International Journal of Advanced Computer Science and Applications,
Vol. 5, No. 2, 2014
13 | P a g e
www.ijacsa.thesai.org
[26] E. Silva and K. Clarke, "Complexity, Emergence and Cellular Urban Models: Lessons Learned from Applying Sleuth to Two Portuguese Metropolitan Areas," European Planning Studies, vol. 13, no. 1, pp. 93-115, 2005.
[27] S. Leão, I. Bishop, and D. Evans, "Spatial-temporal model for demand and allocation of waste landfills in growing urban regions," Computers, Environment and Urban Systems, vol. 28, pp. 353–385, 2004.
[28] L. Lebel, D. Thaitakoo, S. Sangawongse, and D. Huaisai, "Views of Chiang Mai: The Contribution of Remote-Sensing to Urban Governance and Sustainability," in Applied Remote Sensing for Urban Planning, Governance and Sustainability. Berlin: Springer, 2007, pp. 221-247.
[29] J. T. Candau and K. C. Clarke, "Probabalistic Land Cover Transition Modeling Using Deltatrons," in Proceedings of Urban and Regional Information Systems Association (URISA) 38th Annual Conference, Orlando, 2000.
[30] R. G. Pontius Jr, E. Shusas, and M. McEachern, "Detecting important categorical land changes while accounting for persistence," Agriculture, Ecosystems and Environment, vol. 101, no. 2-3, pp. 251-268, 2004.
[31] Y. Liu, Modelling Urban Development with Geographical Information Systems and Cellular Automata, 1st ed. Florida: CRC Press, 2008.
[32] S. Wolfram, "Universality and complexity in cellular automata," Physica, vol. 10D, pp. 1-35, 1984.
[33] R. M. Itami, "Simulating spatial dynamics: cellular automata theory," Landscape and Urban Planning, vol. 30, no. 1-2, pp. 27-47, 1994.
[34] R. G. Pontius Jr and J. Malanson, "Comparison of the structure and accuracy of two land change models," International Journal of Geographical Information Science, vol. 19, no. 2, pp. 243-265, 2005.
[35] R. G. Pontius Jr et al., "Comparing the input, output, and validation maps for several models of land change," Annals of Regional Science, vol. 42, no. 1, pp. 11-47, 2008.
[36] P. H. Verburg, C J Schulp, N Witte, and A Veldkamp, "Downscaling of land use change scenarios to assess the dynamics of European landscapes," Agriculture, Ecosystems and Environment, vol. 114, no. 1, pp. 39-56, 2006.
[37] L. O. Petrov, C. Lavalle, and M. Kasanko, "Urban land use scenarios for a tourist region in Europe: Applying the MOLAND model to Algarve, Portugal," Landscape and Urban Planning, vol. 92, no. 1, pp. 10-23, 2009.
[38] Q. Zhang, Y. Ban, J. Liu, and Y. Hu, "Simulation and analysis of urban growth scenarios for the Greater Shanghai Area, China," Computers, Environment and Urban Systems, vol. 35, no. 2, pp. 126-139, 2011.
[39] T. M. Conway and R. G. Lathrop, "Modeling the ecological consequences of land-use policies in an urbanizing region," Environmental management, vol. 35, no. 3, pp. 278-291, 2005.
[40] Laws of Kenya, Forests Act, 2012.
[41] W. S. Wasike, "Road infrastructure policies in Kenya: historical trends and current challenges.," Development, p. 41, 2001.
[42] K. Mubea and G. Menz, "Monitoring Land-Use Change in Nakuru (Kenya) Using Multi-Sensor Satellite Data," Advances in Remote Sensing, vol. 1, no. 3, pp. 74–84, 2012.