applying blended research methods to school-based ... · mathematics (stem) intervention to improve...
TRANSCRIPT
Applying Blended Research Methods to School-based Intervention Evaluation
Laurie F. Ruberg Karen Chen Judy Martin
Center for Educational Technologies, Wheeling Jesuit University Abstract This paper discusses a mixed method analysis of qualitative and quantitative data using a theory-based evaluation framework. The focus is a science, technology, engineering, and mathematics (STEM) intervention to improve teaching and learning at low-performing schools. Data sources include teacher reports, surveys, student artifacts, interviews, and school reports. The meta-analysis integrates survey data from all schools with interpretive case study analysis of a cluster-based randomly selected subset of 20 percent of the schools. Results show to what extent the intervention achieved its goals for teacher growth, increased use of technology, expanded family involvement in school activities, and increases in student interest, motivation, and achievement in STEM-related areas. The analysis provides recommendations for improving the intervention project and replication efforts. Introduction The purpose of the evaluation was to assess the outcome data associated with implementation of a federally funded intervention designed to improve science, technology, engineering, and mathematics (STEM) education in grades 4-9 at high-need, low-performing schools. Schools apply to participate in this project as a team of four teachers and one administrator. Schools are selected through a national application process that gives priority to ethnically diverse, underachieving, and economically challenged schools. This study examined the findings at the close of the first three years of this school improvement project. The goal of this program, referred to as NES, is to increase:
1. Participation and professional growth of educators in science. 2. Assistance for and technology use by educators in schools with high
populations of underserved students. 3. Family involvement in children’s learning. 4. Student interest and participation in science, technology, engineering,
mathematics, and geography. 5. Student knowledge about careers in science, technology, engineering,
mathematics, and geography. 6. Student ability to apply science, technology, engineering, mathematics, and
geography concepts and skills in meaningful ways. In this paper we conduct a meta-analysis of the qualitative and quantitative data using a theory-based evaluation framework. The meta-analysis integrates survey data from all schools with case study reports from a cluster-based, randomly selected subset of 20 percent of the schools to determine to what extent the intervention achieved its goals for
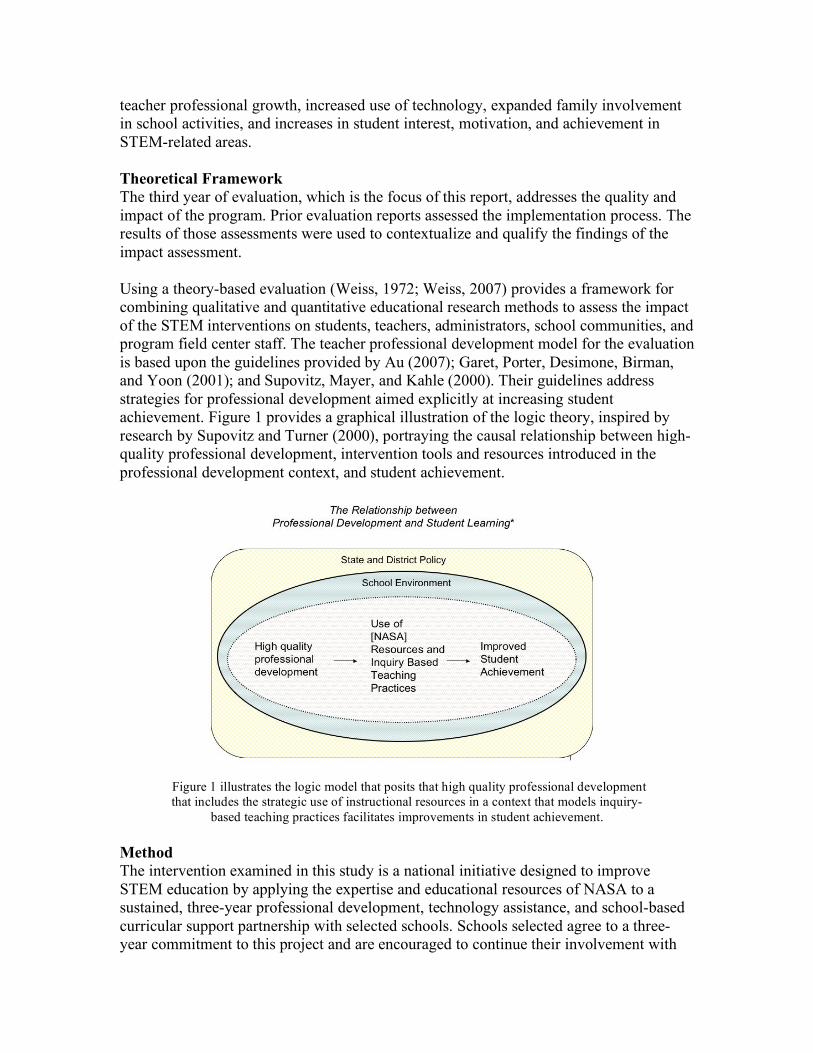
teacher professional growth, increased use of technology, expanded family involvement in school activities, and increases in student interest, motivation, and achievement in STEM-related areas. Theoretical Framework The third year of evaluation, which is the focus of this report, addresses the quality and impact of the program. Prior evaluation reports assessed the implementation process. The results of those assessments were used to contextualize and qualify the findings of the impact assessment. Using a theory-based evaluation (Weiss, 1972; Weiss, 2007) provides a framework for combining qualitative and quantitative educational research methods to assess the impact of the STEM interventions on students, teachers, administrators, school communities, and program field center staff. The teacher professional development model for the evaluation is based upon the guidelines provided by Au (2007); Garet, Porter, Desimone, Birman, and Yoon (2001); and Supovitz, Mayer, and Kahle (2000). Their guidelines address strategies for professional development aimed explicitly at increasing student achievement. Figure 1 provides a graphical illustration of the logic theory, inspired by research by Supovitz and Turner (2000), portraying the causal relationship between high-quality professional development, intervention tools and resources introduced in the professional development context, and student achievement.
Figure 1 illustrates the logic model that posits that high quality professional development that includes the strategic use of instructional resources in a context that models inquiry-
based teaching practices facilitates improvements in student achievement. Method The intervention examined in this study is a national initiative designed to improve STEM education by applying the expertise and educational resources of NASA to a sustained, three-year professional development, technology assistance, and school-based curricular support partnership with selected schools. Schools selected agree to a three-year commitment to this project and are encouraged to continue their involvement with
this federal agency’s education outreach program and regional center education programs after their official funding cycle. Thus, data are received from those who guide and conduct the implementation of the program, the teachers (and administrators) who receive the direct program training, and students who mostly indirectly receive benefits from the program via their teachers. Survey and qualitative data were also collected from each of the program implementation staff members located at the regional coordinating sites. Using the professional development theoretical framework as a guide, the researchers integrated other data sources into the evaluation analysis to triangulate the survey findings and to construct a more coherent picture of teaching practices and student learning. The data sources include 30 cluster-based, randomly selected case study school reports; student demographics; tracking of teacher and student participation in professional development and STEM-related learning opportunities; tracking of technology tools used; and information regarding student performance and achievement. A rubric template was created to conduct a meta-analysis across case study schools (Borman, 2006) in terms of the six anticipated outcomes with particular focus on teaching strategies, technology integration, and measures of student interest and achievement. A copy of the rubric that was used to integrate the qualitative and quantitative data across the six project goals is attached as Appendix A. Results of the meta-analysis across cases using the rubric template (as shown in Appendix A) provided a way to compare and contrast the in-depth school cases and highlight successful practices, outstanding achievements, school-specific challenges, and trends evidenced across all cases. A quantitative analysis of the rubric scores for all cases and comparisons across cohort groups helped the researchers identify the most and least successful school interventions. This meta-analysis also yielded new hypotheses, which could be tested with qualitative and quantitative data already collected. Further data and analysis will be provided in the extended paper. Data The case study reports examine all of the qualitative and qualitative data collected from schools, intervention coordinators, and school communities on a school-based level. Eighty-five percent of the 149 schools involved in this evaluation are classified as high-poverty schools. An average of 78 percent of the schools serve a student population with a high percentage of minority students. Table 1 provides a list of the primary data sources integrated into the case study analysis. The 29 case study schools were randomly selected on a stratified design basis with one case selected from each of the 10 regional centers for each of the three cohort groups. When comparing school cases, the researchers considered the how long schools had been in the program (reflected by their cohort group) and the possibility of different ways of experiencing the program based on regional location, regional center staff differences, regional center capacity differences, and school area socioeconomic, geographic, and population differences. Conducting the case study analyses provided a way to explore the

issues that emerged from the survey data in greater detail in a school-specific context. Each of the case study reports was presented within a basic theoretical template that included a brief description of specific challenges and strengths at each school, a demographic summary of the student body, a highlight of successes and challenges that each school experienced in its implementation of the intervention, and a detailed examination of the extent to which each school achieved the six NES program goals. Table 1 Summary of Data Sources Used in Meta-analysis
Assessment Instrument
Sample Population Date Collected Desired Outcomes/Goals
Teacher Involvement survey
706 teachers from 143 schools
Pre/Post – fall, 2005 to spring 2006
All 6 outcomes/ goals
Team Lead survey 143 teachers from 143 schools
Annually – fall 2005 and 2006
All 6 outcomes/ goals
Teaching, Learning and Computing (TLC) survey
335 in spring 2005; 553 in spring 2006
Annually Measures teacher attitudes, beliefs, and practices regarding instruction and technology
School demographic profiles1
Student population demographics for each participating school
Upon acceptance into the program and subsequently on an annual basis
Goal 2, working with underserved and ethnically diverse student populations
Student Interest survey
13,590 students (grades 4-9) from 121 schools in fall 2005; 7,447 from 87 schools
Pre/Post fall and spring annually
Outcomes 4, 5, and 6 from student perspective
Field Center Staff survey and interviews
10 project coordinators, each located at one of the NASA field centers
Annually All 6 outcomes/goals
Case Study report 30 randomly selected cases representing one school per NASA regional center per year over the 3-year period
The case study reports cover the first 3-years of the program and include 10/year from each of the 3 cohort groups: 2003, 2004, and 2005
All 6 outcomes/ goals – integrates all of the above listed data on a school case-based level
1 School demographic profiles are based on data posted by National Center for Education Statistics (http://nces.ed.gov), except in cases where state report card data were different and more current, and in those instances, the state-level demographic data were used.
Results The report provides evidence to show the following achievements in terms of the six goals listed above:
(1) Teachers gave high ratings to the NES project for offering opportunities for professional growth in science, math, and technology to support student learning. Surveys showed yearly and continuous gains in teachers’ confidence in their abilities to teach science and math. Consistent with this finding, team leaders reported that participation in NES promoted knowledge gains in STEM. All but two percent of NES teachers reported increased use of inquiry teaching strategies. Integration of NASA materials into the curriculum increased with teacher involvement in the project. (2) Demographic profiles showed that the participating schools included a large representation of ethnically diverse and underserved students, a stipulation for the NES technology assistance goal. Survey data showed that teachers at these schools were integrating educational technologies, especially to support independent student work, classroom presentations, and extended research for information and development of ideas. (3) The family involvement survey showed an increase in families reporting an interest in STEM activities at their child’s school. Families reported being more aware of the school’s reaching out to them to participate in STEM learning opportunities. (4) Student surveys correlated positively—and in many questions significantly—with how often NES teachers use NASA materials in their teaching and how much students like math, science, and geography. (5) Some of the most encouraging results come from the careers section. Students in grades 7-9 showed significant increases in predicted success in careers requiring math and scientific abilities. Further, some jobs related to science—computer specialist, doctor, teacher (grades 4-6), engineer—increased in likeability. (6) The NASA Digital Learning Network and Challenge activity assessments showed gains in student abilities to apply STEM concepts and skills. Schools that reported successful implementation of the program described student improvements in classroom activities and improved grade level scores on annual achievement tests. The NES opportunities for teacher and student engagement in STEM simulations and authentic scientific investigations have been successfully integrated by many of the schools with mechanisms for ongoing support outside of NES.
Here are challenges that emerged from the data analysis:
• Many schools experienced a great influx of English language learners. As a result, those schools needed to give greater attention to reading and language issues instead of integrating science and math instruction.

• Since the NES population has a high percentage of underserved students and includes many underperforming schools, many NES teachers reported having to use NASA materials in after-school programs because the school day was highly regimented and did not allow for the integration of new material.
• Field center support for NES sites was not distributed equally. Schools in remote areas did not have equal access to NASA aerospace educator support. Schools close to NASA field centers received more frequent and sustained support.
• School needs, interests, and capabilities to integrate technology were as diverse as the schools themselves. While teacher attitudes toward technology continued to be high or even increased for the 2003 cohort, having the technical skills to integrate and use technology within the classroom context continued to be a challenge for many teachers.
Here is a summary of NES accomplishments:
• The development, prototyping, and implementation of the web-based digital portfolio system provided a way to build a community of sharing and to document how NES activities were being implemented at the school level. The Team Lead survey showed increased use of this tool from the 2003 to 2004 and 2005 cohort schools.
• The team leads report showed that the NES project was improving its ability to help team leads involve the whole faculty in the implementation of the NES program at the rate of 90 percent for the 2003 cohort, 96 percent for 2004, and 98 percent for the 2005 cohort.
• All of the 2004 cohort schools were represented at the 2006 sustainability conference, which focuses on keeping the program going once the funding cycle ends. Survey data showed that at least 93 percent of the NES schools had sought community partners while receiving their NES funding, and 90 percent (2003), 84 percent (2004), and 85 percent (2005) of the cohorts had sought additional funding to leverage, expand, and sustain NES.
• NASA, Space Grant, and higher education science and education partnerships that are focused on integrating STEM inquiry activities continued at 2003 schools. NES staff communications with the 2003 alumni schools facilitated these ongoing collaborations and involvement in continued STEM learning opportunities at the school level.
Discussion The blending of quantitative and qualitative data and analysis with randomly selected cases studies and a cross-case meta-analysis offered a way to conduct an in-depth analysis of this three-year intervention. Having a clearly defined theoretical framework that allowed mixed methods of data collection ensured that the blending of data sources was logically coherent. The analysis showed that the intervention goals were achieved in varying degrees; success varied based on school capacities, school commitment to the program, school climate, and access to sustained and consistent field center support. Having NES help school teams build partnerships with STEM reform efforts under way in their community (and state) helped several schools build coherent strategies to sustain the school improvement plan initiated by the NES project.

Significance of Study This evaluation research study was timely and relevant for several reasons. The gap between high-performing teachers and low-performing students continues to increase. This evaluation addressed this situation by assessing the outcome data associated with the implementation of a theoretically based intervention designed to help teachers and students situated at high-need, low-performing schools. One of the key questions addressed in this evaluation report was how could the federal dollars applied to this extended intervention program for STEM improvement be used more effectively. The meta-analysis provided recommendations for improving program implementation and replication efforts.
References Au, W. (2007). "High-stakes testing and curricular control: A qualitative metasynthesis."
Educational Researcher, 36(5), 258-2627. Babu, S., & Mendro, R. (2003). Teacher accountability: HLM-based teacher
effectiveness indices in the investigation of teacher effects in a state assessment program. AERA annual meeting.
Borman, K. M., Clarke, C., Cotner, B., & Lee, R. (2006). Cross-case analysis. In (Eds.) J. L. Green, G. Camilli, & P. B. Elmore. Handbook of Complementary Methods in Education Research. Mahwah, NJ: Lawrence Erlbaum Associates, Inc.: 123-139.
Chen, H.-T., & Rossi, P. H. (1983). Evaluating with sense: The theory-driven approach. Evaluation Review, 7(3), 283-302.
Garet, M. S., Porter, A. C., Desimone, L., Birman, B. F., & Yoon, K.S. (2001). What makes professional development effective? Results from a national sample of teachers. American Educational Research Journal, 38(4), 915-945.
Chatterji, M. (2004) Evidence on “what works”: An argument for extended-term mixed-method (ETMM) evaluation designs. Educational Researcher, 33(9), 3-13.
Committee on Science Learning Kindergarten Through Eighth Grade, R. A. Duschl, H. A. Schweingruber, & A. W. Shouse (Eds.). (2007). Taking science to school: Learning and teaching science in grades K-8. Washington, DC: The National Academies Press.
Craig, C. J. (2006). Why is dissemination so difficult? The nature of teacher knowledge and the spread of curriculum reform. American Educational Research Journal, 43(2), 257-293.
Darling-Hammond, L., & McLaughlin, M. W. (1995). Policies that support professional development in an era of reform. Phi Delta Kappan, 76.
Davis, H., Palak, D., Martin, J., & Ruberg, L. (2006). NASA Explorer Schools evaluation brief 4: Evidence that the model is working. Center for Educational Technologies: http://www3.cet.edu/nes (user name: nes; password: pdfeval).
Garet, M. S., Porter, A. C., Desimone, L., Birman, B. F., & Yoon, K.S. (2001). What makes professional development effective? Results from a national sample of teachers. American Educational Research Journal, 38(4), 915-945.
Hernandez, V., Reese, D., McGee, S., Kirby, J., & Martin, J. (2005). NASA Explorer Schools evaluation brief 3. Center for Educational Technologies: http://www.cet.edu/research/evals.html
Hoy, W. K., C. J. Tarter, et al. (2006). Academic optimism of schools: A force for student achievement. American Educational Research Journal, 43(3), 425-448.
Supovitz, J. A., Mayer, D. P., & Kahle, J. B. (2000). Promoting inquiry-based instructional practice: The longitudinal impact of professional development in the context of systemic reform. Educational Policy, 14(3), 331-356.
Rogers, P. J. (2007). Theory-based evaluation: Reflections ten years on. New Directions for Evaluation, 114, 63-67.
Ruberg, L., Martin, J., & Chen, C-H. (2007) NASA Explorer Schools evaluation brief 5: Analysis of project impact. Center for Educational Technologies.
Supovitz, J. A., & Turner, H. M. (2000). The effects of professional development on science teaching practices and classroom culture. Journal of Research in Science Teaching, 37(9), 963-980.
Supovitz, J. A., & Turner, H. M. (2000). The effects of professional development on science teaching practices and classroom culture. Journal of Research in Science Teaching, 37(9), 963-980.
Weiss, C. H. (1972). Evaluation research: Methods of assessing program effectiveness. Englewood Cliffs, NJ: John Hopkins Press.
Weiss, C. H. (2007). Theory-based evaluation: Past, present, and future. New Directions for Evaluation, 114, 68-81.

Appendix A
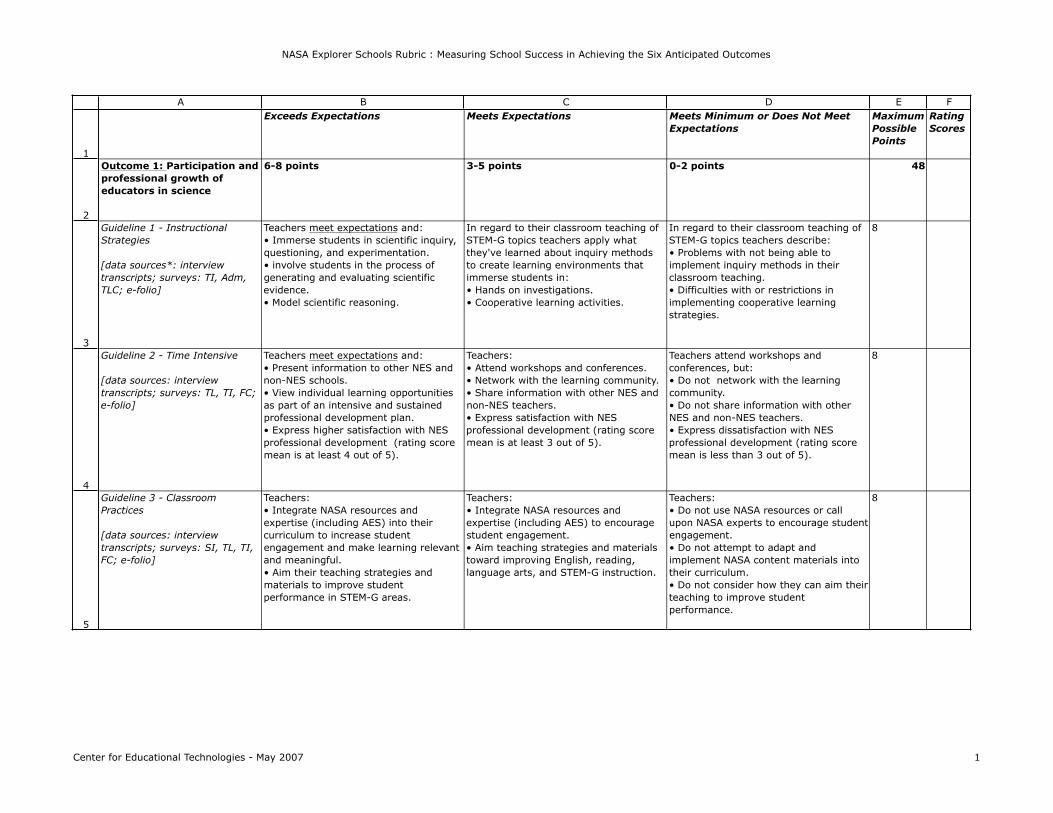
NASA Explorer Schools Rubric : Measuring School Success in Achieving the Six Anticipated Outcomes
1
2
3
4
5
A B C D E FExceeds Expectations Meets Expectations Meets Minimum or Does Not Meet
ExpectationsMaximum Possible Points
Rating Scores
Outcome 1: Participation and professional growth of educators in science
6-8 points 3-5 points 0-2 points 48
Guideline 1 - Instructional Strategies
[data sources*: interview transcripts; surveys: TI, Adm, TLC; e-folio]
Teachers meet expectations and: • Immerse students in scientific inquiry, questioning, and experimentation. • involve students in the process of generating and evaluating scientific evidence.• Model scientific reasoning.
In regard to their classroom teaching of STEM-G topics teachers apply what they've learned about inquiry methods to create learning environments that immerse students in: • Hands on investigations.• Cooperative learning activities.
In regard to their classroom teaching of STEM-G topics teachers describe: • Problems with not being able to implement inquiry methods in their classroom teaching. • Difficulties with or restrictions in implementing cooperative learning strategies.
8
Guideline 2 - Time Intensive
[data sources: interview transcripts; surveys: TL, TI, FC; e-folio]
Teachers meet expectations and:• Present information to other NES and non-NES schools.• View individual learning opportunities as part of an intensive and sustained professional development plan.• Express higher satisfaction with NES professional development (rating score mean is at least 4 out of 5).
Teachers:• Attend workshops and conferences.• Network with the learning community.• Share information with other NES and non-NES teachers.• Express satisfaction with NES professional development (rating score mean is at least 3 out of 5).
Teachers attend workshops and conferences, but: • Do not network with the learning community.• Do not share information with other NES and non-NES teachers.• Express dissatisfaction with NES professional development (rating score mean is less than 3 out of 5).
8
Guideline 3 - Classroom Practices
[data sources: interview transcripts; surveys: SI, TL, TI, FC; e-folio]
Teachers: • Integrate NASA resources and expertise (including AES) into their curriculum to increase student engagement and make learning relevant and meaningful. • Aim their teaching strategies and materials to improve student performance in STEM-G areas.
Teachers: • Integrate NASA resources and expertise (including AES) to encourage student engagement. • Aim teaching strategies and materials toward improving English, reading, language arts, and STEM-G instruction.
Teachers: • Do not use NASA resources or call upon NASA experts to encourage student engagement. • Do not attempt to adapt and implement NASA content materials into their curriculum.• Do not consider how they can aim their teaching to improve student performance.
8
Center for Educational Technologies - May 2007 1
NASA Explorer Schools Rubric : Measuring School Success in Achieving the Six Anticipated Outcomes
1
A B C D E FExceeds Expectations Meets Expectations Meets Minimum or Does Not Meet
ExpectationsMaximum Possible Points
Rating Scores
6
7
8
9
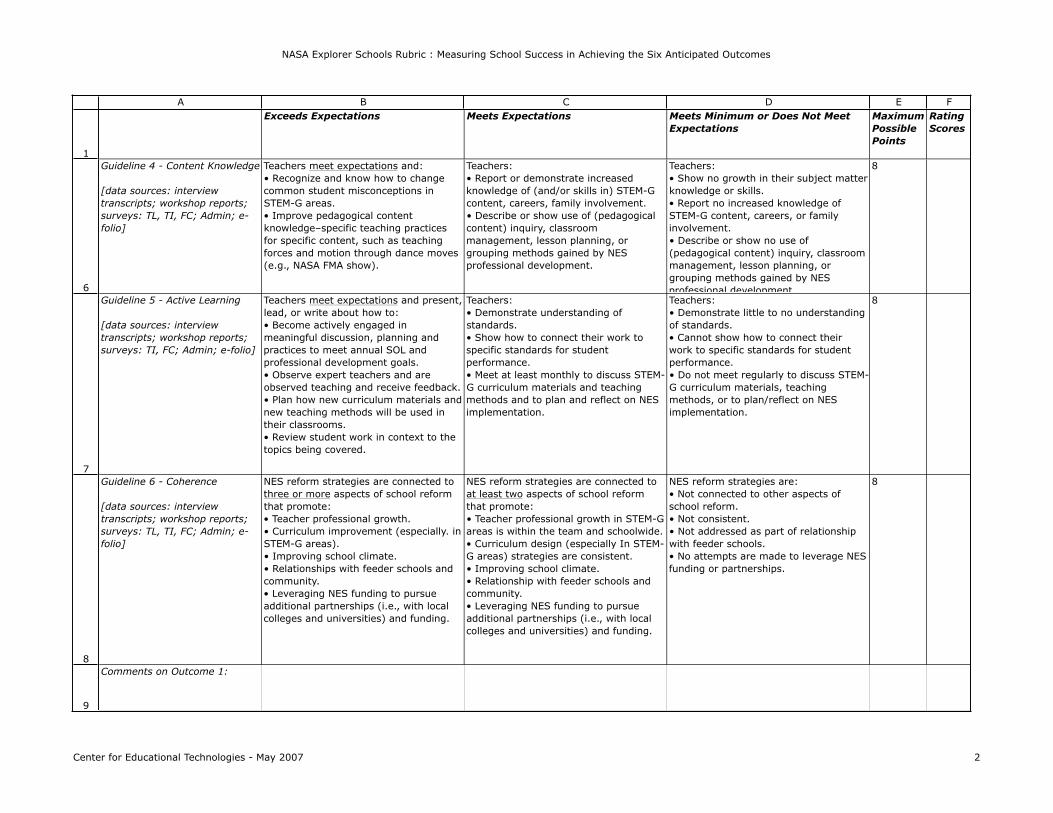
Guideline 4 - Content Knowledge
[data sources: interview transcripts; workshop reports; surveys: TL, TI, FC; Admin; e-folio]
Teachers meet expectations and: • Recognize and know how to change common student misconceptions in STEM-G areas.• Improve pedagogical content knowledge–specific teaching practices for specific content, such as teaching forces and motion through dance moves (e.g., NASA FMA show).
Teachers: • Report or demonstrate increased knowledge of (and/or skills in) STEM-G content, careers, family involvement. • Describe or show use of (pedagogical content) inquiry, classroom management, lesson planning, or grouping methods gained by NES professional development.
Teachers: • Show no growth in their subject matter knowledge or skills.• Report no increased knowledge of STEM-G content, careers, or family involvement.• Describe or show no use of (pedagogical content) inquiry, classroom management, lesson planning, or grouping methods gained by NES professional development.
8
Guideline 5 - Active Learning
[data sources: interview transcripts; workshop reports; surveys: TI, FC; Admin; e-folio]
Teachers meet expectations and present, lead, or write about how to: • Become actively engaged in meaningful discussion, planning and practices to meet annual SOL and professional development goals. • Observe expert teachers and are observed teaching and receive feedback.• Plan how new curriculum materials and new teaching methods will be used in their classrooms.• Review student work in context to the topics being covered.
Teachers: • Demonstrate understanding of standards. • Show how to connect their work to specific standards for student performance. • Meet at least monthly to discuss STEM-G curriculum materials and teaching methods and to plan and reflect on NES implementation.
Teachers:• Demonstrate little to no understanding of standards.• Cannot show how to connect their work to specific standards for student performance.• Do not meet regularly to discuss STEM-G curriculum materials, teaching methods, or to plan/reflect on NES implementation.
8
Guideline 6 - Coherence
[data sources: interview transcripts; workshop reports; surveys: TL, TI, FC; Admin; e-folio]
NES reform strategies are connected to three or more aspects of school reform that promote:• Teacher professional growth. • Curriculum improvement (especially. in STEM-G areas).• Improving school climate. • Relationships with feeder schools and community. • Leveraging NES funding to pursue additional partnerships (i.e., with local colleges and universities) and funding.
NES reform strategies are connected to at least two aspects of school reform that promote:• Teacher professional growth in STEM-G areas is within the team and schoolwide. • Curriculum design (especially In STEM-G areas) strategies are consistent.• Improving school climate. • Relationship with feeder schools and community. • Leveraging NES funding to pursue additional partnerships (i.e., with local colleges and universities) and funding.
NES reform strategies are:• Not connected to other aspects of school reform.• Not consistent.• Not addressed as part of relationship with feeder schools.• No attempts are made to leverage NES funding or partnerships.
8
Comments on Outcome 1:
Center for Educational Technologies - May 2007 2
NASA Explorer Schools Rubric : Measuring School Success in Achieving the Six Anticipated Outcomes
1
A B C D E FExceeds Expectations Meets Expectations Meets Minimum or Does Not Meet
ExpectationsMaximum Possible Points
Rating Scores
10
11
12
13
14
15
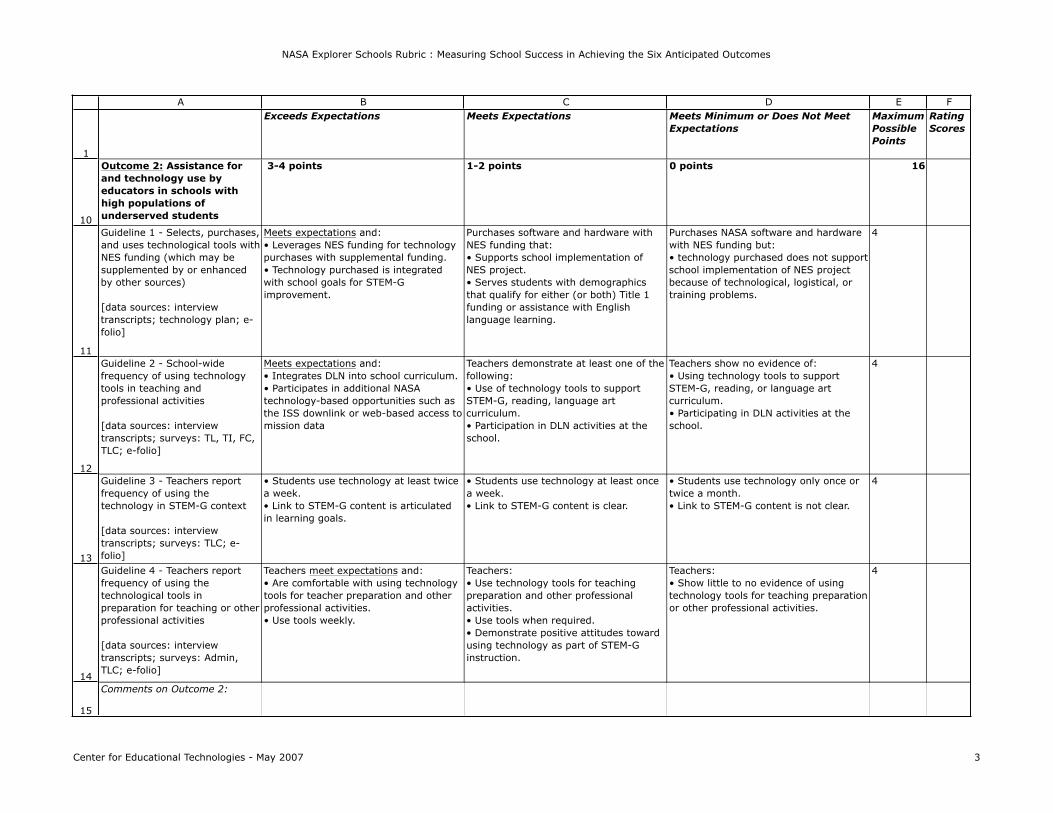
Outcome 2: Assistance for and technology use by educators in schools with high populations of underserved students
3-4 points 1-2 points 0 points 16
Guideline 1 - Selects, purchases, and uses technological tools with NES funding (which may be supplemented by or enhanced by other sources)
[data sources: interview transcripts; technology plan; e-folio]
Meets expectations and:• Leverages NES funding for technology purchases with supplemental funding.• Technology purchased is integrated with school goals for STEM-G improvement.
Purchases software and hardware with NES funding that:• Supports school implementation of NES project.• Serves students with demographics that qualify for either (or both) Title 1 funding or assistance with English language learning.
Purchases NASA software and hardware with NES funding but:• technology purchased does not support school implementation of NES project because of technological, logistical, or training problems.
4
Guideline 2 - School-wide frequency of using technology tools in teaching and professional activities
[data sources: interview transcripts; surveys: TL, TI, FC, TLC; e-folio]
Meets expectations and: • Integrates DLN into school curriculum. • Participates in additional NASA technology-based opportunities such as the ISS downlink or web-based access to mission data
Teachers demonstrate at least one of the following:• Use of technology tools to support STEM-G, reading, language art curriculum. • Participation in DLN activities at the school.
Teachers show no evidence of: • Using technology tools to support STEM-G, reading, or language art curriculum. • Participating in DLN activities at the school.
4
Guideline 3 - Teachers report frequency of using the technology in STEM-G context
[data sources: interview transcripts; surveys: TLC; e-folio]
• Students use technology at least twice a week. • Link to STEM-G content is articulated in learning goals.
• Students use technology at least once a week.• Link to STEM-G content is clear.
• Students use technology only once or twice a month. • Link to STEM-G content is not clear.
4
Guideline 4 - Teachers report frequency of using the technological tools in preparation for teaching or other professional activities
[data sources: interview transcripts; surveys: Admin, TLC; e-folio]
Teachers meet expectations and:• Are comfortable with using technology tools for teacher preparation and other professional activities. • Use tools weekly.
Teachers: • Use technology tools for teaching preparation and other professional activities. • Use tools when required.• Demonstrate positive attitudes toward using technology as part of STEM-G instruction.
Teachers:• Show little to no evidence of using technology tools for teaching preparation or other professional activities.
4
Comments on Outcome 2:
Center for Educational Technologies - May 2007 3

NASA Explorer Schools Rubric : Measuring School Success in Achieving the Six Anticipated Outcomes
1
A B C D E FExceeds Expectations Meets Expectations Meets Minimum or Does Not Meet
ExpectationsMaximum Possible Points
Rating Scores
1617
18
19
7-10 points 3-6 points 0-2 pointsOutcome 3: Family involvement in children's learning
[data sources: interview transcripts; workshop reports; surveys: SI, TL, TI, FC; Admin; e-folio]
Teachers meet expectations and show evidence that parents: • Have opportunities to observe the changes in STEM-G curriculum and teaching strategies.• Have information to appraise teachers for the use of innovative teaching methods; and• Are encouraged to involve children in STEM-G activities outside of school.
Teachers provide evidence that parents: • Actively participate in the NASA-sponsored family events. • Are kept informed of NES project and STEM-G activities at the school.• Observe NES activities having a positive impact on overall school climate and community value of STEM-G content and careers.
Parents attend NES-sponsored family involvement activities at the school, but activities: • Are held infrequently. • Do not follow NES guidelines for family involvement activities.
10
Comments on Outcome 3:
Center for Educational Technologies - May 2007 4

NASA Explorer Schools Rubric : Measuring School Success in Achieving the Six Anticipated Outcomes
1
A B C D E FExceeds Expectations Meets Expectations Meets Minimum or Does Not Meet
ExpectationsMaximum Possible Points
Rating Scores
20
21
22
23
24
25
Outcome 4: Student interest and participation in science, technology, engineering, mathematics, and geography
2 points 1 points 0 points 8
Guideline 1 - Participate productively in STEM-G practices and discourse
[data sources: interview transcripts; e-folio]
Teachers report that students participate in the science inquiry process using: • Real-time data. • Valid instruments for data collection. • Online scientific instruments (i.e., online telescopes).
Teachers report that students participate in the science inquiry process.
There is no evidence to show that students participate in STEM-G practices and discourse.
2
Guideline 2 -Show noticeable curiosity in STEM-G related topics and events
[data sources: interview transcripts; surveys: TL, TI, FC; e-folio]
Teachers report that studentsquestion and/or investigate STEM-G-related topics outside the classroom.
Teachers report that students relate STEM-G-related topics discussed in the classroom to current events or local phenomena.
There are no data indicators to show student interest or curiosity in STEM-G.
2
Guideline 3 -Change attitudes about learning
[data sources: interview transcripts; surveys: SI; e-folio]
Teachers report that: • Students are excited about learning and are asking more questions. • School scores on NES student interest test are above the mean in attitudes toward STEM-G topics and activities.
Teachers report that: • Students are excited about learning and are asking more questions. • School scores on NES student interest test are at or near the mean in attitudes toward STEM-G topics and activities.
Students show a neutral or negative attitude towards STEM-G-related activities.
2
Guideline 4 -Actively participates in hands-on and authentic scientific research
[data sources: interview transcripts; surveys: SI; e-folio]
Students: • Conduct hands-on activities in STEM-G areas • Use technology as part of STEM-G investigations.
Students participate in the hands-on activities or authentic scientific research.
There are no or few signs of student participation in hands-on activities or authentic scientific research.
2
Comments on Outcome 4:
Center for Educational Technologies - May 2007 5
NASA Explorer Schools Rubric : Measuring School Success in Achieving the Six Anticipated Outcomes
1
A B C D E FExceeds Expectations Meets Expectations Meets Minimum or Does Not Meet
ExpectationsMaximum Possible Points
Rating Scores
26
27
28
29
30
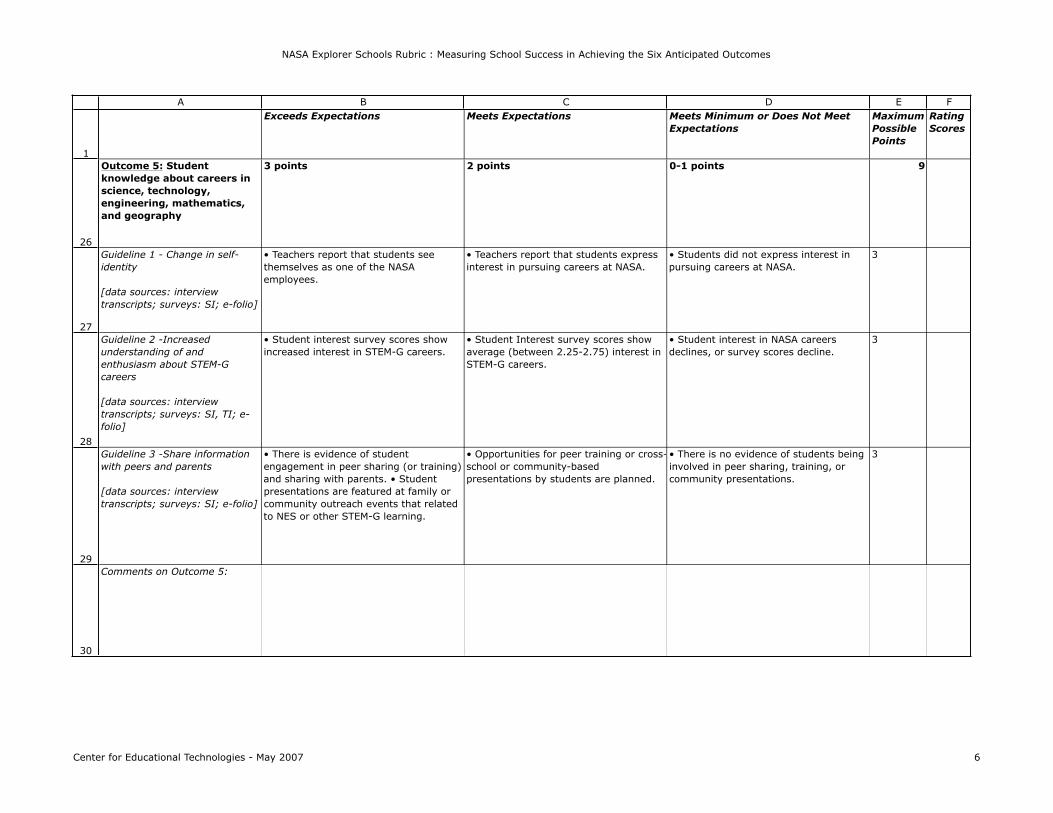
Outcome 5: Student knowledge about careers in science, technology, engineering, mathematics, and geography
3 points 2 points 0-1 points 9
Guideline 1 - Change in self-identity
[data sources: interview transcripts; surveys: SI; e-folio]
• Teachers report that students see themselves as one of the NASA employees.
• Teachers report that students express interest in pursuing careers at NASA.
• Students did not express interest in pursuing careers at NASA.
3
Guideline 2 -Increased understanding of and enthusiasm about STEM-G careers
[data sources: interview transcripts; surveys: SI, TI; e-folio]
• Student interest survey scores show increased interest in STEM-G careers.
• Student Interest survey scores show average (between 2.25-2.75) interest in STEM-G careers.
• Student interest in NASA careers declines, or survey scores decline.
3
Guideline 3 -Share information with peers and parents
[data sources: interview transcripts; surveys: SI; e-folio]
• There is evidence of student engagement in peer sharing (or training) and sharing with parents. • Student presentations are featured at family or community outreach events that related to NES or other STEM-G learning.
• Opportunities for peer training or cross-school or community-based presentations by students are planned.
• There is no evidence of students being involved in peer sharing, training, or community presentations.
3
Comments on Outcome 5:
Center for Educational Technologies - May 2007 6

NASA Explorer Schools Rubric : Measuring School Success in Achieving the Six Anticipated Outcomes
1
A B C D E FExceeds Expectations Meets Expectations Meets Minimum or Does Not Meet
ExpectationsMaximum Possible Points
Rating Scores
31
32
33
34
35
Outcome 6: Student ability to apply science, technology, engineering, mathematics, and geography concepts and skills in meaningful ways
3 points 1-2 points 0 points 9
Guideline 1 - Understand and use scientific explanations of the natural world
[data sources: interview transcripts; surveys: SI, TI, FC; e-folio]
There is evidence that students:• Understand and can use scientific explanations in STEM-G problem solving contexts.
There is evidence that students:• Understand and can use scientific explanations.
There is no evidence that students:• Understand or can use scientific explanations.
3
Guideline 2 - Understand, use, and interpret the nature and development of STEM-G topics
[data sources: interview transcripts; surveys: SI, TI; e-folio]
Students participate in research projects and/or science competitions such as GLOBE, NES student research conference, school science fairs and receive recognition for achievement through review process.
Students participate in science competitions or STEM-G related research projections.
Students did not participate in any science competitions or STEM-G research projects.
3
Guideline 3 - Increased achievement in math and language arts, reading, and science standardized tests
[data sources: interview transcripts; State report card data]
Student achievement scores: • Meet AYP in all areas; and• Exceed district (or state) achievement scores in all areas.
Student achievement scores: • Meet AYP in STEM-G; or • Exceed district (or state) achievement scores in science and/or math.
Student achievement scores:• Do not meet annual progress goals in science and math areas. • Students show no improvements in science and math. • Students do not meet annual progress goals in related subjects, such as language arts.
3
Comments on Outcome 6:
Center for Educational Technologies - May 2007 7
NASA Explorer Schools Rubric : Measuring School Success in Achieving the Six Anticipated Outcomes
1
A B C D E FExceeds Expectations Meets Expectations Meets Minimum or Does Not Meet
ExpectationsMaximum Possible Points
Rating Scores
36
37
383940414243444546474849
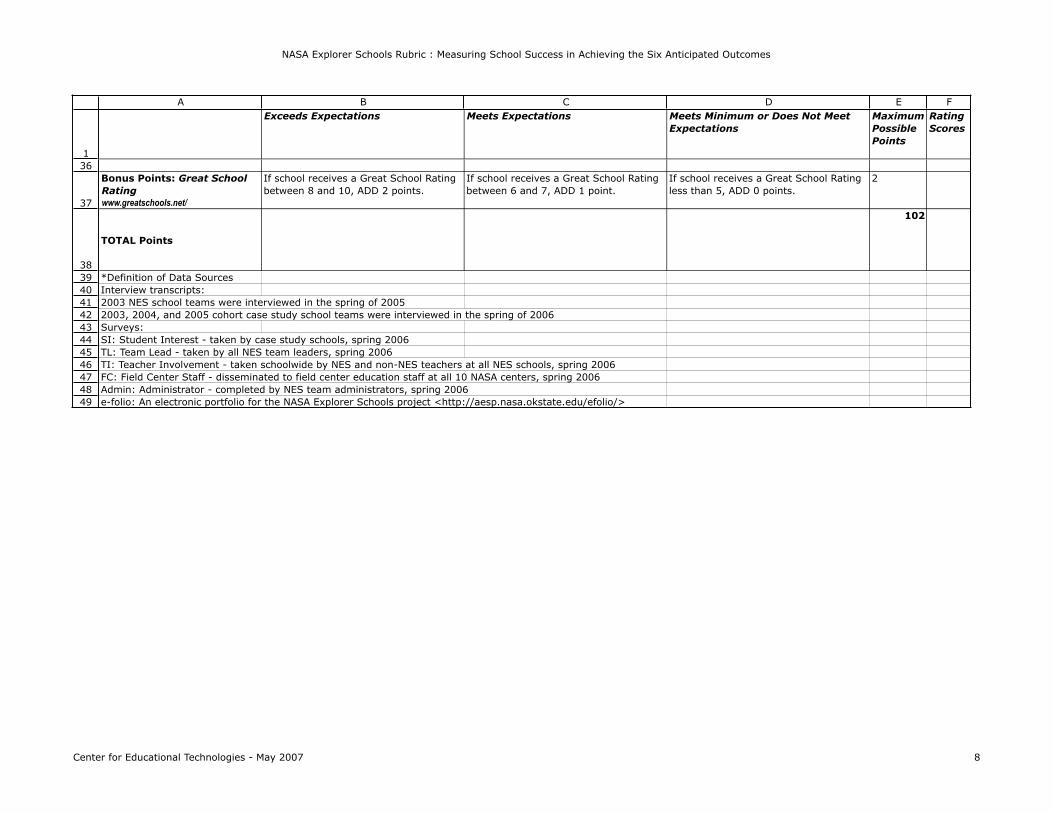
Bonus Points: Great School Ratingwww.greatschools.net/
If school receives a Great School Rating between 8 and 10, ADD 2 points.
If school receives a Great School Rating between 6 and 7, ADD 1 point.
If school receives a Great School Rating less than 5, ADD 0 points.
2
TOTAL Points
102
*Definition of Data SourcesInterview transcripts: 2003 NES school teams were interviewed in the spring of 20052003, 2004, and 2005 cohort case study school teams were interviewed in the spring of 2006Surveys:SI: Student Interest - taken by case study schools, spring 2006TL: Team Lead - taken by all NES team leaders, spring 2006TI: Teacher Involvement - taken schoolwide by NES and non-NES teachers at all NES schools, spring 2006FC: Field Center Staff - disseminated to field center education staff at all 10 NASA centers, spring 2006Admin: Administrator - completed by NES team administrators, spring 2006e-folio: An electronic portfolio for the NASA Explorer Schools project <http://aesp.nasa.okstate.edu/efolio/>
Center for Educational Technologies - May 2007 8