applied multi-pulsed laser in surface treatment and
TRANSCRIPT

HAL Id: hal-01005270https://hal.archives-ouvertes.fr/hal-01005270
Submitted on 21 Feb 2017
HAL is a multi-disciplinary open accessarchive for the deposit and dissemination of sci-entific research documents, whether they are pub-lished or not. The documents may come fromteaching and research institutions in France orabroad, or from public or private research centers.
L’archive ouverte pluridisciplinaire HAL, estdestinée au dépôt et à la diffusion de documentsscientifiques de niveau recherche, publiés ou non,émanant des établissements d’enseignement et derecherche français ou étrangers, des laboratoirespublics ou privés.
Distributed under a Creative Commons Attribution| 4.0 International License
Applied multi-pulsed laser in surface treatment andnumerical–experimental analysis
Abdellah Laazizi, Bruno Courant, Frédéric Jacquemin, Henri Andrzejewski
To cite this version:Abdellah Laazizi, Bruno Courant, Frédéric Jacquemin, Henri Andrzejewski. Applied multi-pulsed laserin surface treatment and numerical–experimental analysis. Optics and Laser Technology, Elsevier,2011, 43 (7), pp.1257-1263. �10.1016/j.optlastec.2011.03.019�. �hal-01005270�
Keywor
Pulsed
Applied multi-pulsed laser in surface treatment andnumerical–experimental analysis
Abdellah Laazizi a, Bruno Courant a, Frédéric Jacquemin a, Henri Andrzejewski ba GeM, Institut de Recherche en Genie Civil et Mecanique, Universite de Nantes—ECN, UMR CNRS 6183, IUT de Saint-Nazaire 37, Boulevard de l’Universite, BP 406,
Saint-Nazaire 44602, Franceb Institut Carnot de Bourgogne, UMR 5209 CNRS-Universite de Bourgogne, IUT Le Creusot 12, rue de le Fonderie 71 200 Le Creusot, France
en sim
d veloc
rties we
ulation
tal stu
ngulati
treatme
ted zon
the key
This paper presents a comparison betwe
YAG. The simulations of temperature an
Variations of the thermophysical prope
surface and the buoyancy force. The sim
laser triangulation sensor, an experimen
called keyhole effect and the laser tria
which were undesirable in the surface keyhole effect. The predicted laser mel
various irradiation conditions, as long as
ds:
laser irradiation Surface profile Numerical sim
ulationulation and experimental results of the melting process of metallic material by a pulsed laser source Nd–
ity fields of melted material were done by solving the transient heat transfer and fluid-flow equations. re considered. Furthermore, the model included the effects of the surface-tension gradient on the fluid
was useful in improving our understanding of the phenomena occurring in the treated material. Using a dy was also conducted on the surface profile of the melted zones to seek a relationship between the so-
on measurements. The keyhole effect induced strong surface deformations and often formed cavities, nt process. The laser power, energy density, and treatment duration could be optimized to prevent the e (LMZ) morphology was in good agreement with the corresponding experimental measurements for hole effect did not occur.
1. Introduction
The role of heat-transfer phenomena in welding and surfacetreatment is crucial for obtaining high quality surfaces by elim-inating defects, such as undercutting, non-uniform surface profile,and cavities, which are attributed to changes in fluid flow andheat transfer [1].
Numerical and analytical models to simulate heat transferand fluid flow during steady and transient fusion welding weredeveloped during the last two decades. Calculations wereobtained for both moving [2] and stationary heat sources andfor laser beam as well as arc welding [3]. In an arc weld pool, flowdriven by both surface tension and electromagnetic fields play animportant role. However, in laser welding, only surface tension-driven flow is significant [1]. These models were used to calculateweld pool geometry by calculating temperature fields during thewelding of stainless steel [4], aluminum alloys [5], titanium alloys[6], and pure iron [7].
Pulsed lasers are used as the energy source for cutting,welding, rapid manufacturing, machining and ablation, melting,alloying [8], cladding, and surface hardening of the materials [9].
1
The understanding of the laser irradiation of materials involvesnumerous phenomena namely heat transfer, absorption, Marangoniconvection, distortion, variation of the thermophysical properties,and phase transformation.
Until now, a model that considers all these phenomena has notexisted because of the multidisciplinary nature of the problemspanning thermal, chemical, and mechanical fields. As a result,most researchers have concentrated on modeling only the meltedzone without comparing simulation to experimental results.Moreover, the efficiency and the quality of the laser materialprocessing depend on a large number of variables: the spatialand temporal energy distributions, the laser parameters, and theirradiated material properties.
Considerable research efforts were focused on exploring the laserprocessing of different materials. Treatment simulations were espe-cially essential for processing control, minimizing the experimentalcost, providing optimization of operative parameters, and improvingunderstanding of Marangoni convection involved during the laserirradiation. Therefore, over the last two decades, several analytical[6,10] and numerical models [11] were developed to predict thetemperature and velocity fields in the melting bath during lasertreatments. Numerical methods based on finite differences or finiteelements were often used when the variations of material propertiesand/or convection flows in the molten bath were taken intoconsideration [12].
Nomenclature
Ap size of the laser beamCp heat specific (J/kg K)E pulse energy (J)H enthalpy (J/kg)HAZ heat-affected zoneLm latent heat of fusion, 2.72�105 (J/kg)LMZ laser-melted zoneL, Z length and thickness of the workpieceNAZ non-affected zoneP pressure (Pa)Qlaser heat transfer flux from laserS source-termT temperature (1C)T0 initial temperature, 23 (1C)Tm melting point, 1535 (1C)
h heat transfer coefficient, 80 (W/m2 K)g gravitational acceleration, 9.8 (m s�2)k thermal conductivity (W/m K)rb radius of laser beam, 200 (mm)t time (s)x, z Cartesian coordinates (m)
Greek symbols
b thermal coefficient of volume expansion, 12.1�10�6
(K�1)s tension surfacem dynamic viscosity (kg/m s_r density (kg/m3)d absorption coefficientt pulse duration (s)
Laser–material interactions are very complex, and only in thesimplest cases, the laser can be treated as a simple surface heatsource. The numerous effects of laser–material interactions wereimmediately the focus of physical research soon after an opera-tional laser was built [4].
Computed temperature fields were used for predicting residualstress, while velocity fields could be used to determine the distribu-tion of chemical elements in the transfer phenomena. Chan et al. [1]reported that the recirculating velocity, as predicted by their model,was of one or two orders of magnitude higher than the scanningspeed. That means fluid particle would recirculate several timesbefore it was solidified. This can account for the highly disperse anduniform solute redistribution within the molten region.
In the melting bath, the liquid circulation was induced byMarangoni flows and hydrodynamic motion, which was causedby pressure gradients [13]. In turn, Marangoni flows weredetermined by the temperature dependence of the surface-ten-sion gradient s0(T). A surface-tension gradient with consequentfluid flow could be imposed on the surface of a fluid in at leasttwo situations [3]: (1) temperature gradient along the surface or(2) chemical composition gradient along the surface. In addition,the magnitude of the force generated by surface gradients couldbe large and can, therefore, dominate other forces such asconvection from buoyancy effects. If a surface-tension gradientexists on the surface of a liquid, then fluid would be drawn alongthe surface from the region of lower surface tension to the regionof higher surface tension. For example, the presence of a lowconcentration of surface active impurities could substantiallyalter the temperature dependence of the surface tension bychanging its sign. However, in the absence of significant concen-trations of surface active impurities, the melt exhibits the normalnegative surface tension temperature coefficient for pure metals.
The effects of tensioactive elements (such as sulfur, selenium,and oxygen) on the shape of melted zone vary and depend on thetemperature coefficient of surface tension. Some of them inducea deep melted zone and others a large but shallow one [14].Walsh and Savage [15], in a survey about the effect of the minorelements in the case of CN7M, an iron-based alloy, justified the LMZshape by the effect of the stable chemical compounds formed on thesurface with iron or with other elements existing in the basematerial. Also, surface rippling during laser surface melting wasattributed to surface-tension gradients [16]. Unfortunately, no datawas available on the temperature dependence of the surface tensionfor most stainless steels. In many studies, the surface tensionbehavior was neglected or assumed to be that of pure metal.
2
The main focus of this work was to calculate temperature andvelocity field in melted metallic material by a pulsed laser beam.Therefore, a numerical model was developed to solve a transientheat transfer problem, for which variations of its thermophysicalproperties are well known. This analysis improved our under-standing of the effects of the irradiation conditions on the size ofthe melted zone during irradiation. Finally, the analyses of thesurface profile of the melted zone with a non-contact method,called laser triangulation, are discussed. Experimental andnumerical results are obtained and presented.
2. Modeling of melting process
2.1. Laser beam function
A LASMA 1054 Nd–YAG laser delivering output energy of1–60 J at 0.3–20 ms pulses was used to irradiate the workpiece(20�20�5 mm3). The laser wavelength was 1.046 mm, themaximum transmitted power was 300 W, and the frequencyof pulses was in the range from 1 to 600 Hz. Argon shielding(15 l/mn) was used to avoid oxidization of the material.
Knowledge of the spatial energy and the duration and thefrequency of pulse generation of the laser were necessary toadequately model the system. The profile of the laser beamdepended on the optics of the system [17] and could be oblong[18], circular, elliptical, or more often a combination of Gaussians[19,20].
In this survey, the focal distance of the optical system was140 mm. Beam analysis by imagery software was used to deter-mine the intensity profiles. For most part, the shape of the laserbeam could be well approximated by a Gaussian profile (radius ofthe laser beam rb). Therefore, we assumed in our model that theenergy distribution was Gaussian. As a result, the energy fluxdensity absorbed on the top surface (z¼0) is given as
Qlaserðt,x,zÞ ¼ dE
t1
pr2b
exp �x�ðx0þvtÞ
rb
� �2!
ð1Þ
where, d is the absorption coefficient temperature dependent:2�10�8T2–8�10�5Tþ0.3407.
2.2. Material
The interaction between the material and the laser beam issensitive to the material composition and the nature of the laser

Table 1Experimental condition of multi-pulse laser irradiations. Operative and relevant
parameters.
Samples Operative parameters Relevant parameters
E (J) s (s) f (Hz) v (mm/s) P (w) D (J/mm2) R B
M1 6.28 0.0126 7.962 1.67 500 50
0.5
0.1
M2 6.28 0.0063 15.924 3.35 1000 50
M3 6.28 0.0042 23.885 5.02 1500 50
M4 12.56 0.0084 11.943 2.51 1500 100
M5 6.28 0.0126 7.962 2.58 500 50
0.25M6 6.28 0.0063 15.924 5.16 1000 50
M7 6.28 0.0042 23.885 7.74 1500 50
M8 12.56 0.0084 11.943 3.87 1500 100
beam. In this study, the material was considered pure iron inspite of the presence of some trace elements (typical analysis:Mno800, Co200, Po200, So150 ppm). In view of the fore-going, effects of the impurities were neglected. Thermophysicalproperties of iron (thermal conductivity, thermal capacity, visc-osity, and density) and the phase transformations that occur inthe material are well known [21,22] (Table 1). The absorptioncoefficient, d was taken to be temperature dependent [23].
3. Modeling description
3.1. Governing equations
A laser melting process is characterized by a small melt-poolsize and a very short process. Due to these characteristics,measurement of important parameters, such as temperatureand velocity fields, during laser welding are a big challenge. Theseparameters are important as they determine the geometry,composition, structure and resulting properties of the treatedmaterials.
In this study, a Cartesian geometry was used, the x–y plane forthe surface of the workpiece and the z axis for the depth. The laserbeam moved at a constant velocity u, and the latent heat due tosolidification and Boussinesq approximation were considered.The governing equations were the coupled mass, momentum,and energy conservation equations. These equations are given as(Eqs. (2)–(6))
Energy
rCp@H
@tþrCpU
@H
@xþrCpW
@H
@z¼
@
@xk@H
@x
� �þ@
@zk@H
@z
� �ð2Þ
In the energy equation, the enthalpy was defined as
H¼
Z T
T0
CpdTþLmFðTÞ ð3Þ
Continuity
@r@tþ@
@xðrUÞþ
@
@zðrWÞ ¼ 0 ð4Þ
U and W are the i and z components of velocity V (m/s).x momentum
r @U
@tþVgradU
� �¼�@P
@xþdiv mgradU
� �ð5Þ
z momentum
r @W
@tþVgradW
� �¼�@P
@zþdiv mgradW
� �þrbgðT�Tref Þ ð6Þ
where k, cp, r, and m are the parameters for the thermophysicalproperties that were temperature dependent.
3
3.2. Boundary conditions
On the free surfaces, the boundary conditions are given asfollowing:
�
ThermalIn many researches, heat source was included in energyconservation equation [24]. However, in this study the heatsource is positioned on the top surface
H¼ 0 at t¼ 0
�k @H@z ¼�hf HþQlaser at z¼ 0
�k @H@x ¼�hlibH at x¼ 0,L
H¼ 0 at z¼ Z
8>>><>>>:
ð7Þ
�
HydraulicAt the melted bath surface, the surface tension variation withtemperature must be balanced by the fluid shear stress sincethe surface must be continuous. Therefore, the shear stress atthe surface is equal to the surface-tension gradient. At the freesurface, the shear stress due to Marangoni effects or thesurface tension-driven flow was included as a boundarycondition for the momentum equation (Eq. (8)) [25].
In common with other works in the field, we made thefollowing assumptions:
1.
In mushy zone, the fluid flow was proportional to the liquidfraction.2.
The surface of the melt pool was assumed to be flat to simplifythe surface boundary condition.3.
Surface rippling was not considered.U,W ¼ 0 at t¼ 0
�m @U@z ¼ s
0 @T@x at z¼ 0 and TZTm
W ¼ 0 at z¼ 0 and 8T
U,W ¼ 0 at x¼ 0,L and z¼ Z
8>>><>>>:
ð8Þ
4. Numerical resolution
4.1. Numerical scheme and solution
The finite-difference method was used to solve Eqs. (2)–(8).The next step consisted of the discretization of space and timevariables. The implicit finite difference scheme built a pentadia-gonal 2D matrix. The UpWind scheme was employed to evaluatethe combined convection and conduction heat transfer. Thisarrangement, which enabled the handling of the pressure linkagesthrough the continuity equation, is known as the Semi-ImplicitMethod for Pressure-Linked Equations (SIMPLE) algorithm [26].On the other hand, the solution of linear systems obtained fromthe discretized transfer equations was computed by the Gauss–Seidel method. In this calculation, it is necessary to use the underrelaxation parameters (¼0.9) for velocities and the enthalpy toavoid numerical instabilities [27].
It is important to point out the solid–liquid interface is not knowna priori. It is part of the problem to be solved. To start the solution,the pure conduction equation has to be solved until a certain moltenpool region formed so that the momentum equation can be applied.The final discretized equation took the following form:
aPHP ¼ aEHEþaW HWþaNHNþaSHSþb ð9Þ
where subscripts E, W, N, and S represent the neighbors of the givengrid point ‘P’. The ‘ai’ terms are coefficients dependent on the
diffusion and convection. The parameter ‘b’ includes the termsassociated with the evaluation of temperature at the previoustime step.
4.2. Grids
The timescale, which was much shorter for laser spot andsmall melt pool size, required the use of fine grids and very smalltime steps. A finer grid spacing (80�63) was used near theinteraction region between heat source and material to improvecomputation accuracy. The minimum grid spaces along the x andz directions were 50 and 5 mm, respectively, and the time stepwas 0.5 ms.
4.3. Simulation cases
The irradiation conditions were dependent on the operativeparameters: pulse energy, E; pulse duration, t; pulse frequency, f;and scanning speed along the x axis of the laser beam, u. Two relevantparameters characterized each laser pulse: the surface density ofdeposited energy, F, and the pulse power, P. Two other parametersdescribed the pulse succession: the time ratio of laser emission, B, andthe superposition ratio of two areas successively irradiated, R [6]. Thedata used for calculations are presented in Table 1. Relevant para-meters are functions of operative parameters [28].
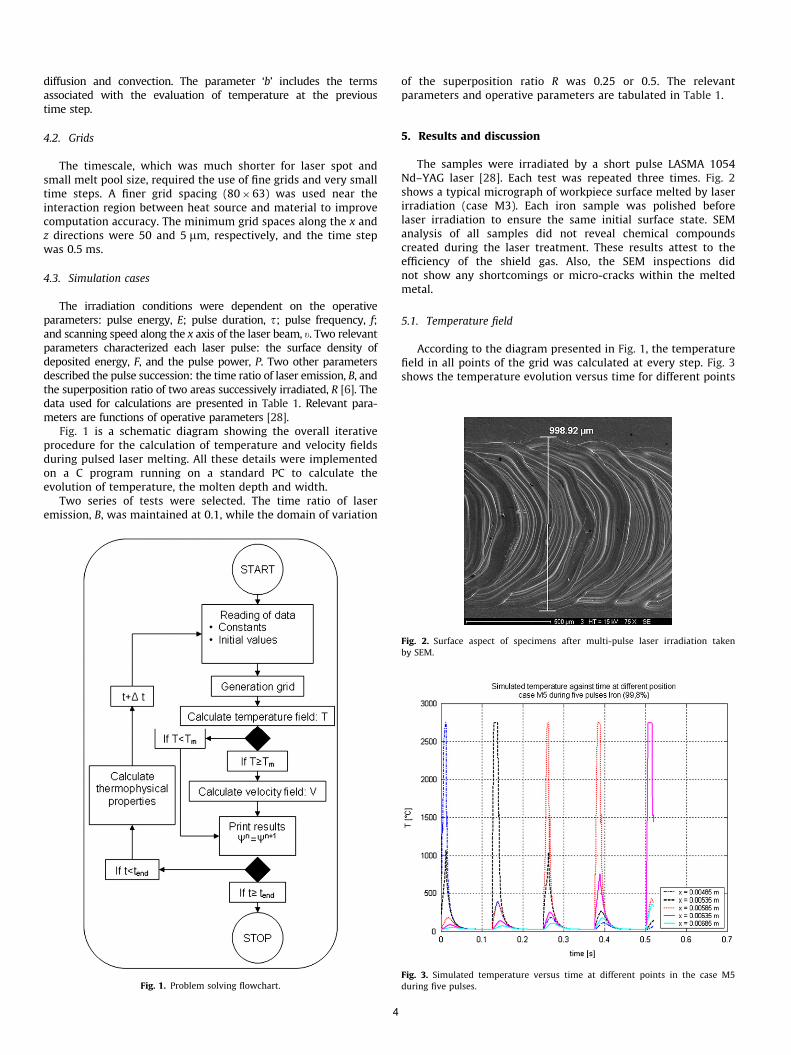
Fig. 1 is a schematic diagram showing the overall iterativeprocedure for the calculation of temperature and velocity fieldsduring pulsed laser melting. All these details were implementedon a C program running on a standard PC to calculate theevolution of temperature, the molten depth and width.
Two series of tests were selected. The time ratio of laseremission, B, was maintained at 0.1, while the domain of variation
Fig. 1. Problem solving flowchart.
4
of the superposition ratio R was 0.25 or 0.5. The relevantparameters and operative parameters are tabulated in Table 1.
5. Results and discussion
The samples were irradiated by a short pulse LASMA 1054Nd–YAG laser [28]. Each test was repeated three times. Fig. 2shows a typical micrograph of workpiece surface melted by laserirradiation (case M3). Each iron sample was polished beforelaser irradiation to ensure the same initial surface state. SEManalysis of all samples did not reveal chemical compoundscreated during the laser treatment. These results attest to theefficiency of the shield gas. Also, the SEM inspections didnot show any shortcomings or micro-cracks within the meltedmetal.
5.1. Temperature field
According to the diagram presented in Fig. 1, the temperaturefield in all points of the grid was calculated at every step. Fig. 3shows the temperature evolution versus time for different points
Fig. 2. Surface aspect of specimens after multi-pulse laser irradiation taken
by SEM.
Fig. 3. Simulated temperature versus time at different points in the case M5
during five pulses.
140
160
on the x axis in case M5. The simulated treatment corresponds tofive successive pulses. This result was achieved with a laservelocity of 2.582 mm/s and pulse duration of 12.6 ms.0
20
40
60
80
100
120
1 2 3 4 5 6 7 8Sample
P (w) /10Δd± x 1000 (mm)F (J/mm2)
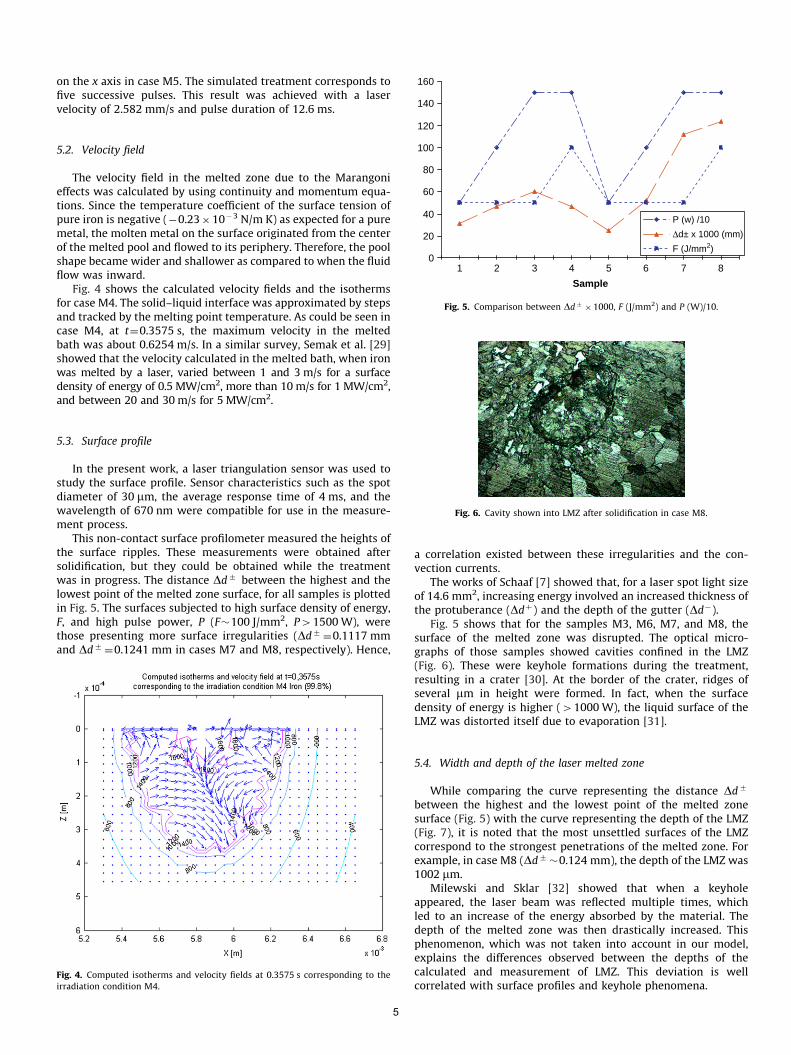
Fig. 5. Comparison between Dd7�1000, F (J/mm2) and P (W)/10.
5.2. Velocity field
The velocity field in the melted zone due to the Marangonieffects was calculated by using continuity and momentum equa-tions. Since the temperature coefficient of the surface tension ofpure iron is negative (�0.23�10�3 N/m K) as expected for a puremetal, the molten metal on the surface originated from the centerof the melted pool and flowed to its periphery. Therefore, the poolshape became wider and shallower as compared to when the fluidflow was inward.
Fig. 4 shows the calculated velocity fields and the isothermsfor case M4. The solid–liquid interface was approximated by stepsand tracked by the melting point temperature. As could be seen incase M4, at t¼0.3575 s, the maximum velocity in the meltedbath was about 0.6254 m/s. In a similar survey, Semak et al. [29]showed that the velocity calculated in the melted bath, when ironwas melted by a laser, varied between 1 and 3 m/s for a surfacedensity of energy of 0.5 MW/cm2, more than 10 m/s for 1 MW/cm2,and between 20 and 30 m/s for 5 MW/cm2.
Fig. 6. Cavity shown into LMZ after solidification in case M8.
5.3. Surface profile
In the present work, a laser triangulation sensor was used tostudy the surface profile. Sensor characteristics such as the spotdiameter of 30 mm, the average response time of 4 ms, and thewavelength of 670 nm were compatible for use in the measure-ment process.
This non-contact surface profilometer measured the heights ofthe surface ripples. These measurements were obtained aftersolidification, but they could be obtained while the treatmentwas in progress. The distance Dd7 between the highest and thelowest point of the melted zone surface, for all samples is plottedin Fig. 5. The surfaces subjected to high surface density of energy,F, and high pulse power, P (F�100 J/mm2, P41500 W), werethose presenting more surface irregularities (Dd7
¼0.1117 mmand Dd7
¼0.1241 mm in cases M7 and M8, respectively). Hence,
Fig. 4. Computed isotherms and velocity fields at 0.3575 s corresponding to the
irradiation condition M4.
5
a correlation existed between these irregularities and the con-vection currents.
The works of Schaaf [7] showed that, for a laser spot light sizeof 14.6 mm2, increasing energy involved an increased thickness ofthe protuberance (Ddþ) and the depth of the gutter (Dd�).
Fig. 5 shows that for the samples M3, M6, M7, and M8, thesurface of the melted zone was disrupted. The optical micro-graphs of those samples showed cavities confined in the LMZ(Fig. 6). These were keyhole formations during the treatment,resulting in a crater [30]. At the border of the crater, ridges ofseveral mm in height were formed. In fact, when the surfacedensity of energy is higher (41000 W), the liquid surface of theLMZ was distorted itself due to evaporation [31].
5.4. Width and depth of the laser melted zone
While comparing the curve representing the distance Dd7
between the highest and the lowest point of the melted zonesurface (Fig. 5) with the curve representing the depth of the LMZ(Fig. 7), it is noted that the most unsettled surfaces of the LMZcorrespond to the strongest penetrations of the melted zone. Forexample, in case M8 (Dd7
�0.124 mm), the depth of the LMZ was1002 mm.
Milewski and Sklar [32] showed that when a keyholeappeared, the laser beam was reflected multiple times, whichled to an increase of the energy absorbed by the material. Thedepth of the melted zone was then drastically increased. Thisphenomenon, which was not taken into account in our model,explains the differences observed between the depths of thecalculated and measurement of LMZ. This deviation is wellcorrelated with surface profiles and keyhole phenomena.

Fig. 7. Comparison between numerical and experimental depth and width of the
melted zones.
6. Criterion to avoid the keyhole effect
The experimentally determined melt pool cross sections werecompared to the corresponding computed values. Fig. 7 showsthat for samples M3, M6, M7, and M8, experimental and calcu-lated differences between the depths of the LMZ were significant.In these cases, Dd7 was larger than 0.06 mm. In the other cases,however, Dd7 was between 0.024 and 0.06 mm. These measure-ments allowed us to determine whether the keyhole effect wasoccurring. In particular, to prevent keyholing, Dd7 must be keptapproximately below 0.06 mm. Accordingly, the calculated meltpool dimensions agreed well with the experimental results aslong as cavities were not created.
In the other hand, when pulse power P or surface density ofdeposited energy F is high, the Dd7 is important. However, whenP and F are high the Dd7 is higher. Therefore, P and F are twoparameters that should be closely controlled in order to avoidkeyholing. In these cases, if P is greater than 1000 W and F greaterthan 50 J/mm2, the treated pieces have to be inspected to ensureadequate quality especially in manufactured products.
6
7. Conclusion
In this work, a modeling of the Nd–YAG laser surface meltingprocess was developed to calculate temperature and velocityfields and melt pool shapes and sizes using a finite-differencemethod with the UpWind scheme. The numerical model solvedthe continuity, momentum conservation, and energy conservationequations. Variations of thermophysical properties, latent heat offusion and solidification and Marangoni flow were taken intoaccount. Several multi-pulse tests were carried out on a puremetal (iron 99.8%). The effect of the operative parameters on themorphology of the melted zone and the convection movementswere shown. The measured widths of the melted zones were ingood agreement with the model predictions. However, the mea-sured depths did not agree with the calculated ones when thesurface density of energy and power of the pulse were too highdue to evaporation. Analysis of surface profiles explained thedifferences between the numerical and measured results. There-fore, the use of the laser triangulation technique for qualitycontrol of surface treatment can be useful when other techniquesare not applicable. A criterion was proposed to determine akeyhole effect with a surface analysis of the laser melted zone.These analyses can be used to optimize the laser power, theenergy density, and the necessary time to realize high qualitysurface treatment.
Acknowledgment
This research is funded by the Institut de Recherche en GenieCivil et Mecanique, Universite de Nantes—ECN in collaborationwith the Institut Carnot de Bourgogne, UMR 5209 CNRS-Univer-site de Bourgogne and Laboratoire Laser et Traitement desMateriaux, IUT du Creusot. The Loire Atlantique County Counciland eduserveng.com are gratefully acknowledged for the financialsupport of this work.
References
[1] Chan C, Mazmuder J, Chen MM. A two-dimensional transient model forconvection in laser melted pool. Metall Trans A 1984;15A:2175–84.
[2] Semak VV, Hopkins JA, Mccay MH, Mccay TD. Melt pool dynamics duringlaser welding. J Phys D: Appl Phys 1995;29:2443–50.
[3] Heiple CR, Roper JR. Mechanism for minor element effect on GTA fusion zonegeometry. Suppl Weld J 1982:97–102.
[4] Lei YP, Murakawa H, Shi YW, Li XY. Numerical analysis of competitiveinfluence of Marangoni flow and evaporation on heat surface temperatureand molten pool shape in laser surface remelting. J Comput Mater Sci2001;21:276–90.
[5] Huang C, Kou S. Partially melted zone in aluminium welds—liquationmechanism and directional solidification. Suppl Weld J 2000:113–20.
[6] Courant B, Hantzpergue JJ, Benayoun S, L’Huillier J-P. Melting and solidifica-tion processes in a moving graphite-covered titanium surface subjected tomulti-pulse irradiation. J Phys 2001;34:1437–46.
[7] Schaaf P. Laser nitriding of metals. Progr Mater Sciences. 2002;47:1–161.[8] Anjos MA, Vilar R, Li R, Ferreira MG, Steen WM, Watkins K. Fe–Cr–Ni–Mo–C
alloys produced by laser surface alloying. J Surf Coat Technol 1995;70:235–42.
[9] Sherclief HR, Ashby MF. The prediction of case depth in laser transformationhardening. J Metall Trans A 1991;22A:2459–65.
[10] Courant B, Hantzpergue JJ, Benayoun S. Surface treatment of titanium bylaser irradiation to improve resistance to dray-sliding friction. Wear1999;236:39–46.
[11] Kim MJ, Zhang. J. Finite element analysis of evaporative cutting with amoving high energy pulsed laser. Appl Math Modelling 2001;25:203–20.
[12] Kreutz EW, Pirch N. Laser de puissance et traitements des materiaux.Lausanne, Switzerland: Presses Polytechniques et Universitaires Romandes;1991 pp. 535–55.
[13] Heiple CR, Roper JR. Effect of selenium on GTAW fusion zone geometry. WeldRes Suppl August 1981:143s–45s.
[14] Burgardt P, Heiple CR. Interaction between impurities and welding variablesin determining GTA weld shape. Weld Res Suppl 1986:150s–155s.

[15] Walsh DW, Savage WF. Technical note: autogenous GTA weldments-beadgeometry variations due to minor elements. Welding research supplement;February 1985. p. 59s–62s.
[16] Antony TR, Cline HE. Surface rippling induced by surface-tension gradientsduring laser surface melting and alloying. J. Appl. Phys. September 1977;48:3888–94.
[17] Avril L. Elaboration de revetements sur acier inoxydable: simulation de lafusion par irradiation laser caracterisation structurale, mecanique et tribolo-gique. Th�ese doctorale. ENSAM d’Angers; December 2003.
[18] Steen PH, Ehrhard P, Schussler A. Depth of melt-pool and Heat-Affected Zonein laser surface treatments. J. Metall Mater Trans A February 1994;25A:427–35.
[19] Yilbas BS. Laser heating process and experimental validation. J. Heat MassTransf 1997;40:1131–43.
[20] Yilbas BS. A closed from solution for temperature rise inside solid substrate dueto time exponentially varying pulse. Int. J. Heat Transf 2002;10:1993–2000.
[21] Techniques de l’ingenieur. MB2, M66, K420, M65, K430; 2004.[22] Handbook of mathematical, scientific, and engineering formulas, tables,
functions, graphs, transforms. Research and Education Association; 1992.[23] Stern G. Absorption des rayonnements lasers CO2 et Nd–Yag en traitements
de surface. Rev Fr de Mec 1995;1995-4:255–263.
7
[24] Dutto C, Fogarassy E, Mathiot D. Numerical and experimental analysis ofpulsed excimer laser processing of silicon carbide. Appl Surf Sci J 2001;184:362–6.
[25] Kim IS, Basu A. A mathematical model of heat transfer and fluid flow in thegas metal arc welding process. J Mater Process Technol 1998;77:17–24.
[26] Patankar SV. Numerical heat transfer and fluid flow. Washington, DC:Hemisphere; 1980.
[27] Ozban AY. Improved convergence criteria for Jacobi and GaussSeidel itera-tions. Appl Math Comput 2004;152:693–700.
[28] Laazizi A. Contribution �a l’etude du procede de traitement des materiaux parfaisceau laser pulse: confrontation simulation experience. Th�ese Universitede Nantes. No. ED 00367231; 2006. p. 182.
[29] Semak VV, Damkroger B, Kempka DS. Temporal evaluation of the tempera-ture field in the beam interaction zone during laser material processing. JPhys D: Appl Phys 1999;32:1819–25.
[30] Jouvard JM, Girard K, Perret O. Keyhole formation and power deposition inNd:YAG laser spot welding. J Phys D: Appl Phys 2001;34:2894–901.
[31] Mackwood AP, Crafer RC. Thermal modelling of laser welding and relatedprocesses: a literature review. Opt Laser Technol 2005;37:99–115.
[32] Milewski J, Sklar E. Modelling and validation of multiple reflections forenhanced laser welding. Modelling Simul Mater Sci Eng 1996;4:305–22.