applications of network theory in finance and production
TRANSCRIPT

APPLICATIONS OF NETWORK THEORY IN FINANCE AND PRODUCTIONWorld Bank Washington DC
15 May 2015
Kimmo SoramäkiFounder and CEO FNA Ltd.
FNA

First Financial Networks
Fedwire Interbank Payment Network (Fall 2001) was one of the first network views into any financial system.
Of a total of around 8000 banks, the 66 banks shown comprise 75% of total value. Of these, 25 banks completely connected
The chart was subsequently used e.g. in congressional hearings to showcase the type of information that should be collected by financial institutions after the financial crisis.
The research is cited in ~300 academic publications.
Research paper: Soramaki, K. M Bech, J. Arnold, R.J. Glass and W.E. Beyeler, The Topology of Interbank Payment Flows, Physica A, Vol. 379, pp 317-‐333, 2007.

Call for Papers
New Journal ‘Network Theory in Finance’ is launched in March 31, 2015
Editor in Chief: Kimmo Soramäki
Editorial Board included e.g.Andrew Haldane, Bank of EnglandFranklin Allen, Imperial College/Wharton Ignazio Angeloni, ECB
“Journal of Network Theory in Finance is an interdisciplinary journal publishing rigorous and practitioner-focused research on the application of network theory in finance. The journal connects academia, regulators and practitioners in solving important issues around financial risk”
2nd Annual Conference on 9 September 2015 in Cambridge, UK.Call for papers is out! Submit paper to [email protected]

Global Network of Payment Flows
Agenda
Industry Level Value Chains
Correlation Networks

1. Global Network of Payment Flows
Gottfried Leibrand, CEO of Swift, presenting the research at Sibos ’14 in Boston

Network MapsBig data problem: Three billion messages exchanged among banks in 231 countries. We focus on aggregated links among countries.
Analysis and visualization a challenge. We don’t want to show much information (as below).
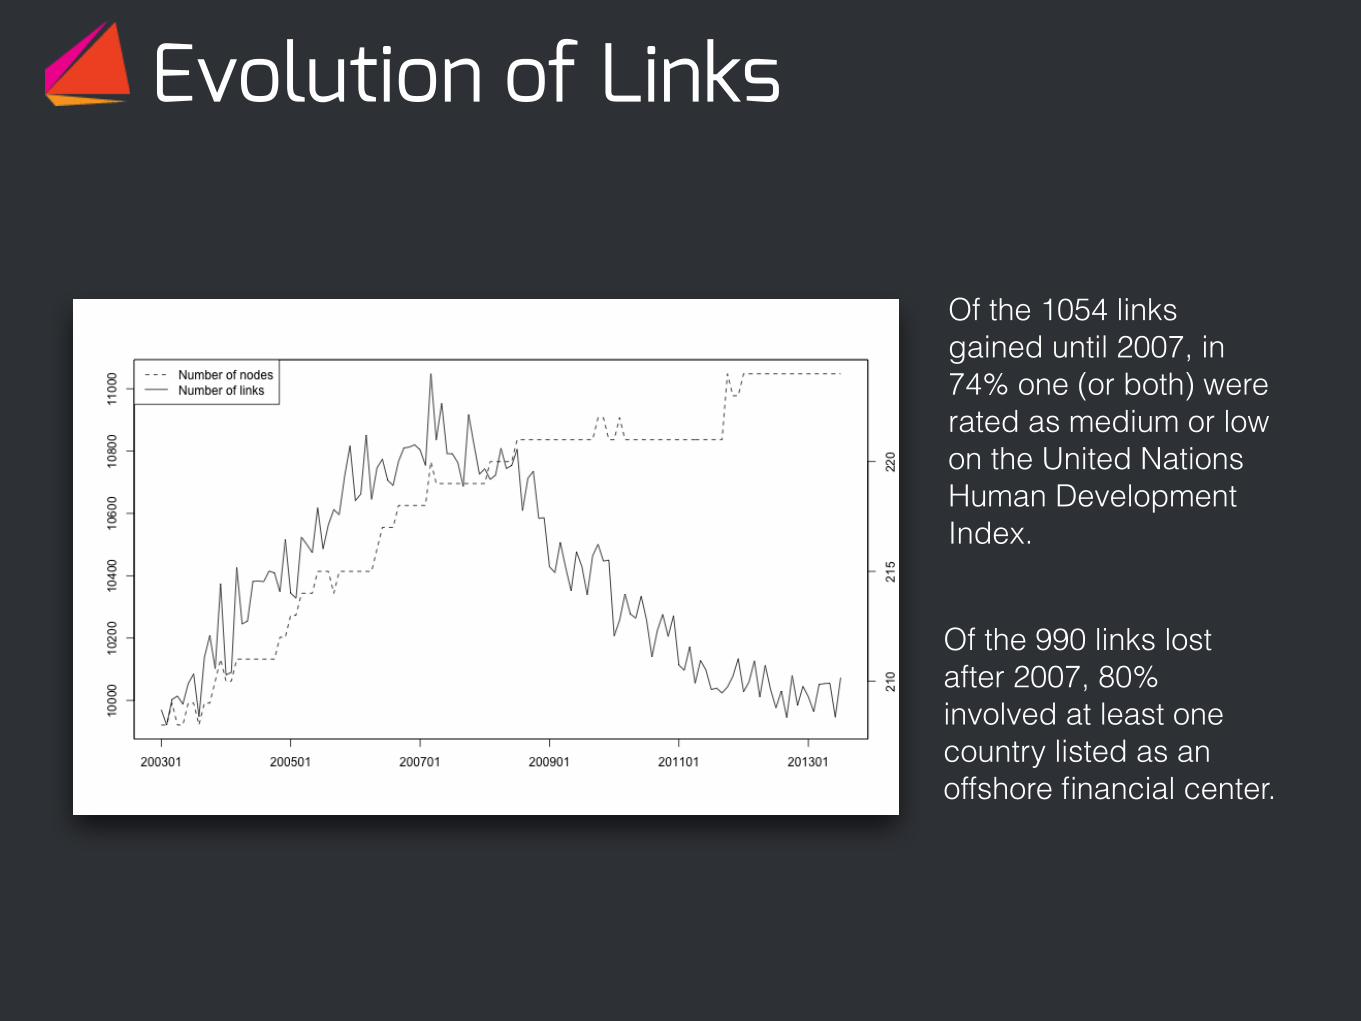
Evolution of Links
Of the 1054 links gained until 2007, in 74% one (or both) were rated as medium or low on the United Nations Human Development Index.
Of the 990 links lost after 2007, 80% involved at least one country listed as an offshore financial center.

Total Messages
The number of messages is 5.5% lower (post-crisis than they would have been had the pre-crisis trend continued unabated throughout the entire period.
The cost of financial crisis $5tr?

Communities
Are there meaningful subgroups among the countries?
Can we group the countries so that messages are sent mostly within groups?
Modularity - measure of concentration of links within communities vs. between communities.

Communities
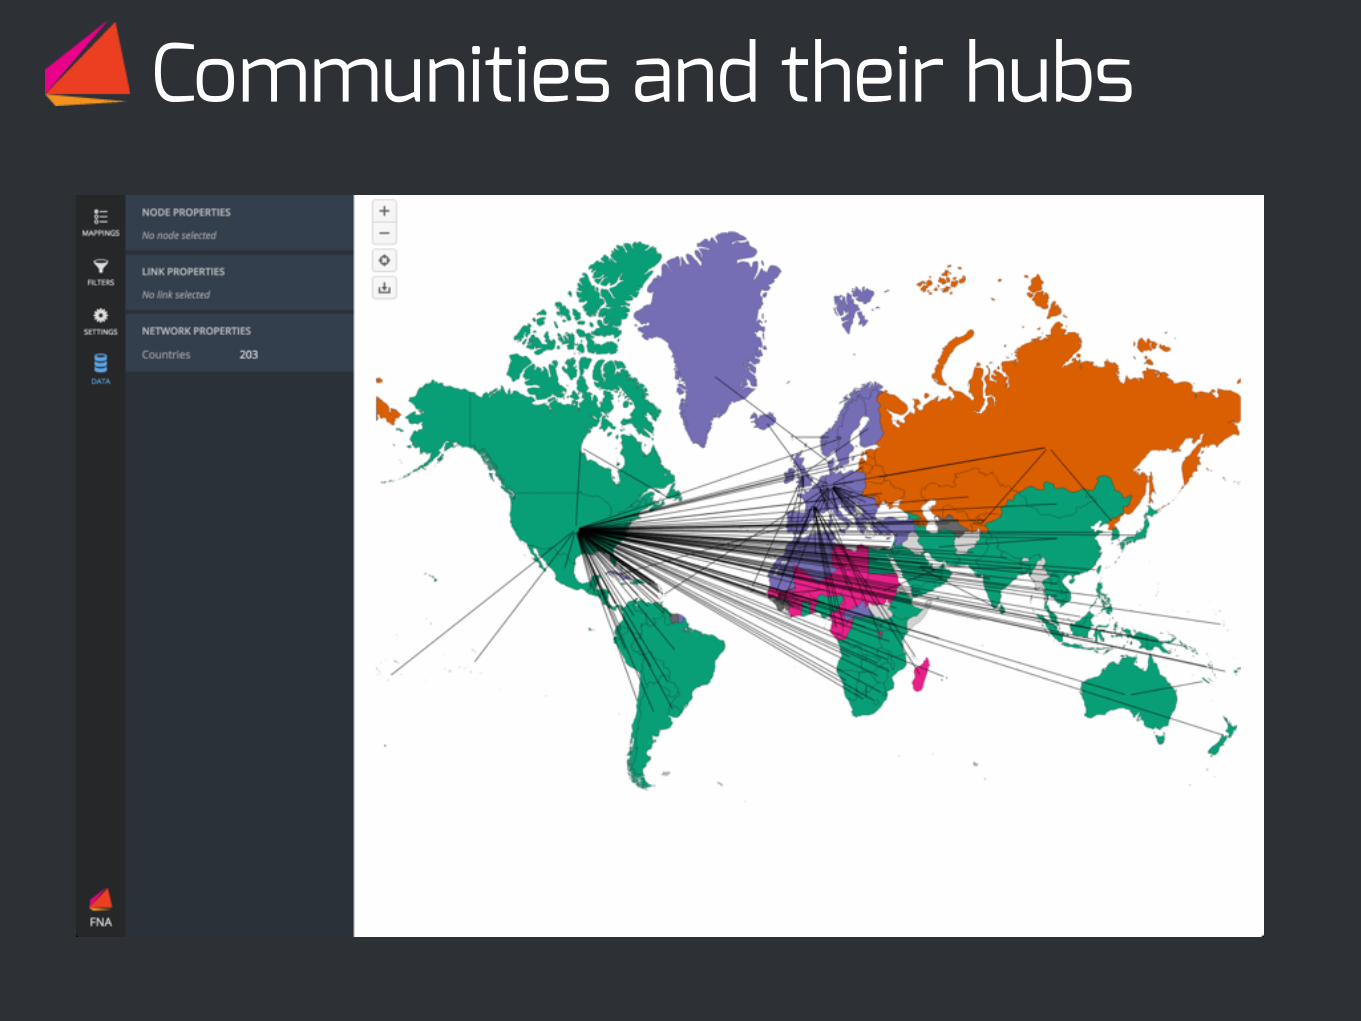
Communities and their hubs
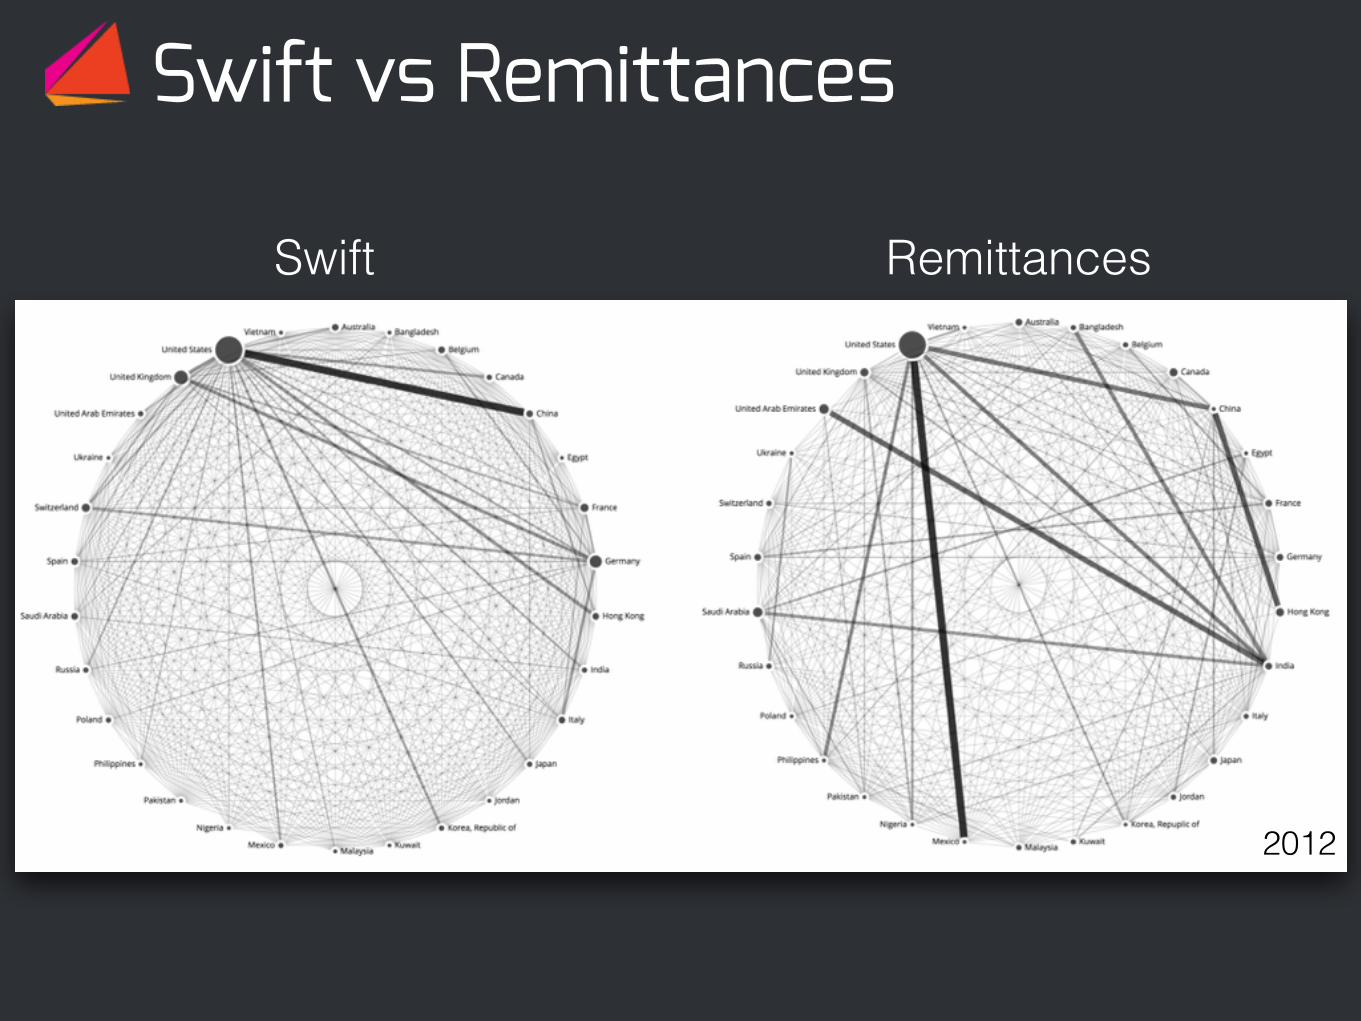
Swift vs Remittances
Swift Remittances
2012

Most important and most volatile countriesMost important
Most volatile

2. Industry level value chains
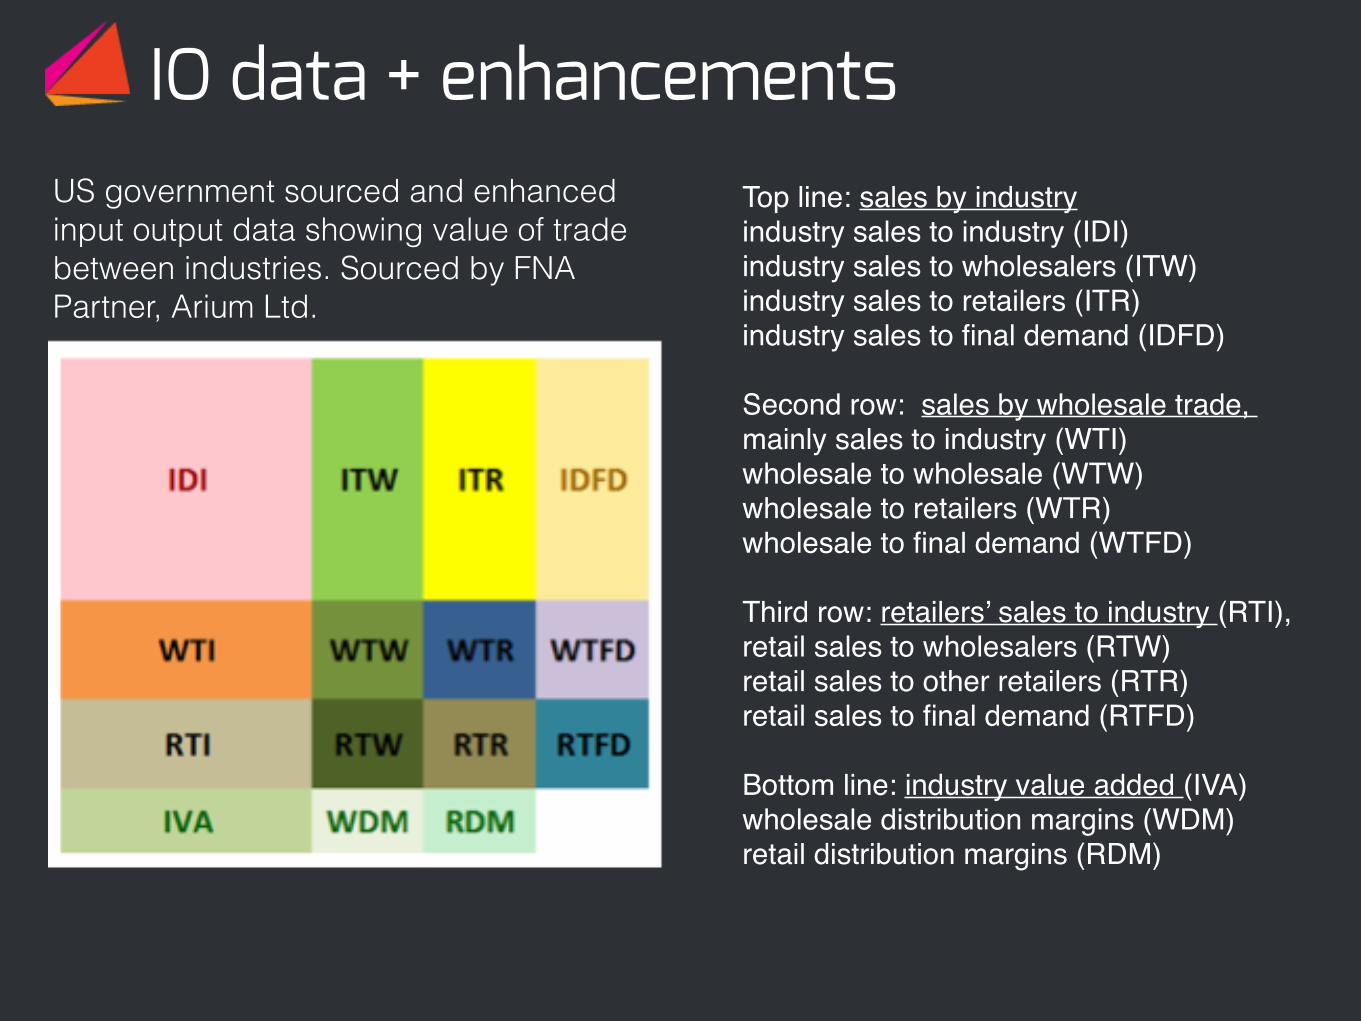
IO data + enhancementsTop line: sales by industryindustry sales to industry (IDI)industry sales to wholesalers (ITW)industry sales to retailers (ITR)industry sales to final demand (IDFD)
Second row: sales by wholesale trade, mainly sales to industry (WTI)wholesale to wholesale (WTW) wholesale to retailers (WTR)wholesale to final demand (WTFD)
Third row: retailers’ sales to industry (RTI), retail sales to wholesalers (RTW)retail sales to other retailers (RTR)retail sales to final demand (RTFD)
Bottom line: industry value added (IVA) wholesale distribution margins (WDM) retail distribution margins (RDM)
US government sourced and enhanced input output data showing value of trade between industries. Sourced by FNA Partner, Arium Ltd.

Developing a scenarioExample: Bisphenol A (BPA) scenario
BPA is an endocrine disruptor in some species. Possible harm to humans includes heart disease, diabetes, obesity, breast cancer, male infertility and general behavioural problems.
Process:1. Develop value chains. Whichindustries are affected down the chain?2. Overlay portfolio. Which policiesare in the affected lines of businessin the affected industries?3. Calculate loss captured in scenario based e.g. on assumptions on the severity of the event.

3. Visualizing Correlations
…" Example: Daily returns of asset prices (ETFs)
Difficult to understand large-scale correlation or other dependence structures of time series data (such as asset prices).
Objective is to:
Efficiently represent a complex system moving in time
Visualize and predicts stress events in their context
Overlay multiple dimensions of the data to allow for visual inference of information

ExamplesCollapse of Lehman Brothers 15 Sept 2008 EU Debt Crisis 2009 -
Energy Meltdown 2014/2015
Other maps:GSIFIs, FX, Sovereign debt, HPIs, Interest Rates, Stress Indicator (CFSI), Equity indices, Commodities, Balance sheet items, trading volumes, etc.
FNA HeavyTails

Collapse of Lehman Brothers on 15 Sept 2008View Interactive Dashboard

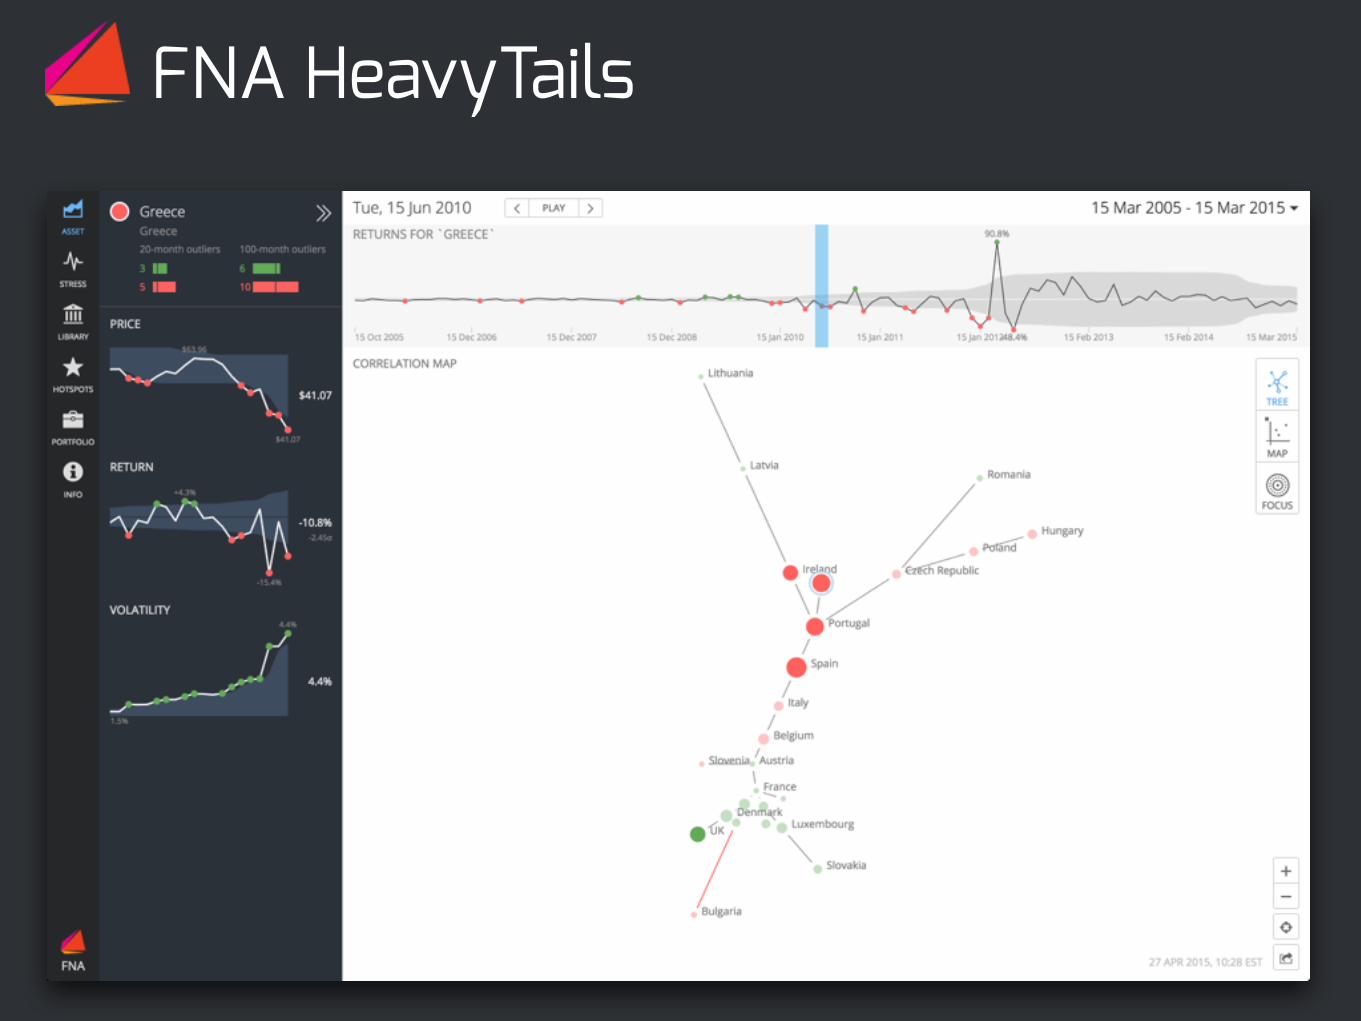
Greek Debt Crisis 2009 -View Interactive Dashboard


Summing up
Many risk models can be improved by taking into account links in the data: interconnections, covariances, dependencies, flows, exposures, co-occurances, etc …
Major challenges that we face are related to filtering signal from noise in large networks and presenting the information efficiently.
Much of the work can be summed up as:
Creating a Map - Placing you on Map - Providing Directions

The FNA Software consists of FNA Platform and FNA Apps.
FNA Platform is the server side workhorse for analysis, simulation and visualization of financial networks used by all FNA Apps.
FNA Software FNA Apps master particular uses cases with an interactive user experience.
FNA Maps
FNA Payments
FNA HeavyTails

FNA Platform Over a decade in making and with a wider selection of financial network algorithms than any other software, the FNA Platform offers a comprehensive end-to-end enterprise solution for advanced analysis and visualizations of financial networks.
FNA Platform is the backbone of all FNA Apps and available as a cloud-based solution with a RESTful API, as an enterprise installation, as a Desktop software and as a Java library.
Cutting-edge analytics Calculate hundreds of graph metrics, perform cluster analysis and carry out predictive stress tests and simulations.
Complete documentation with over 500 pages of manuals describing the platform’s functionality with examples, tutorials and real-life applications.
End-to-end automation Develop scripts for fully automated and regular analytics or use FNA REST API from external applications.
Easy integration tap to data most common online data sources and vendors directly, or from local databases.
More at www.fna.fi/platform
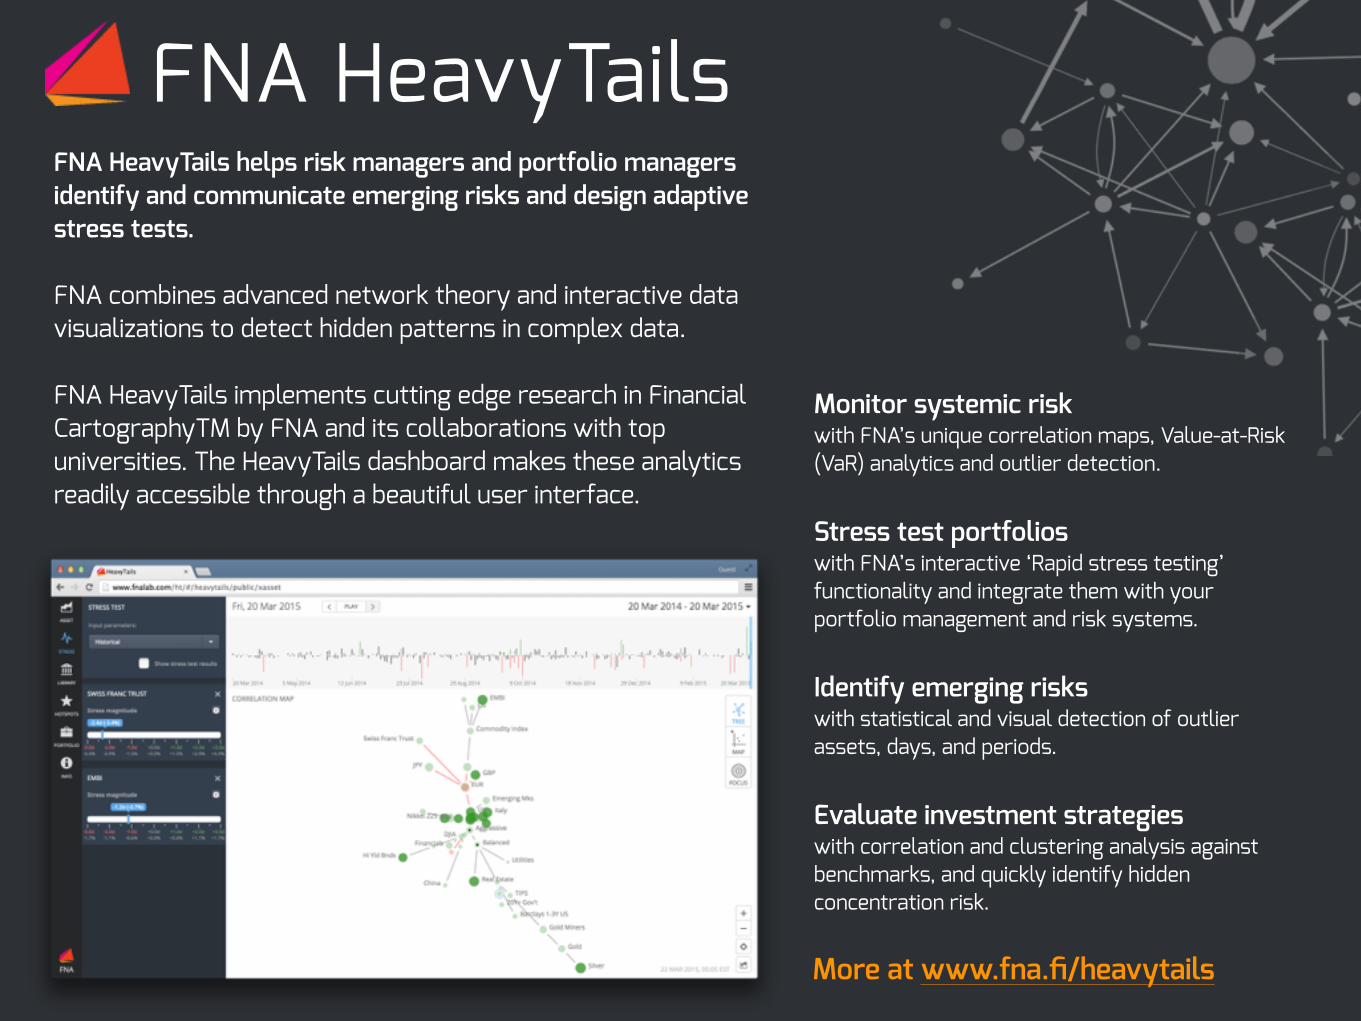
FNA HeavyTails FNA HeavyTails helps risk managers and portfolio managers identify and communicate emerging risks and design adaptive stress tests.
FNA combines advanced network theory and interactive data visualizations to detect hidden patterns in complex data.
FNA HeavyTails implements cutting edge research in Financial CartographyTM by FNA and its collaborations with top universities. The HeavyTails dashboard makes these analytics readily accessible through a beautiful user interface.
Monitor systemic risk with FNA’s unique correlation maps, Value-at-Risk (VaR) analytics and outlier detection.
Stress test portfolios with FNA’s interactive ‘Rapid stress testing’ functionality and integrate them with your portfolio management and risk systems.
Identify emerging risks with statistical and visual detection of outlier assets, days, and periods.
Evaluate investment strategies with correlation and clustering analysis against benchmarks, and quickly identify hidden concentration risk.
More at www.fna.fi/heavytails

FNA Maps FNA NetworkMaps helps financial institutions explore complex financial data for managing risks, identifying new opportunities and making better, data driven decisions.
Combining advanced network theory with interactive visualizations FNA NetworkMaps gives its users the analytical power to answer the most difficult questions that they face. Find hidden patters
with the help of hundreds of graph metrics, clustering analysis and and predictive stress tests and simulations.
Connect the dots with fast interactive data exploration powered by algorithms that filter signal from noise and FNA’s beautiful network maps.
Monitor the network in real-time and get alerted by abnormal events.
Communicate Create interactive network maps from public or internal data sources and share them freely online or within your organization.
More at www.fna.fi/maps

FNA Payments FNA PaymentSimulator helps financial market infrastructures and central banks model liquidity and operational risks, evaluate alternative system designs and carry out stress tests. FNA PaymentSimulator methodologies are based on leading research in network theory and financial infrastructures by FNA and its collaborations with top universities and central banks. The interactive dashboard makes these advanced analytics easily accessible through a well-thought user interface.
Monitor system participants with comprehensive network maps and risk metrics, including FNA’s SinkRank™ and metrics proposed by BIS/BCBS.
Identify emerging riskswith statistical and visual detection of outliers activity.
Get the big picture and drill into details. Uncover interlinkages and second-order effects with FNA’s unique network maps.
Carry out predictive stress tests and payment simulations and explore the results visually or numerically.
More at www.fna.fi/payments