applications of molecular characters to breeding of eucalyptus
TRANSCRIPT

Applications of Molecular Characters to Breeding of Eucalyptus urophylla
Vietnam
Tran Ho Quang Faculty of Natural Resources and Agricultural Sciences
Department of Plant Biology and Forest Genetics Uppsala
Doctoral Thesis Swedish University of Agricultural Sciences
Uppsala 2010
Acta Universitatis Agriculturae Sueciae
2010: 96
ISSN 1652-6880 ISBN 978-91-576-7541-5 © 2010 Tran Ho Quang, Uppsala Print: SLU Service/Repro, Uppsala 2010
Cover: 12-year-old trees from a combined progeny trial and seedling seed orchard of Eucalyptus urophylla at Ba Vi, Ha Noi. Vietnam. (Photo: Tran Ho Quang)
Applications of molecular characters to breeding of Eucalyptus urophylla in Vietnam
Abstract The aim of this study was to investigate how to incorporate molecular genetics into the tree breeding program for E. urophylla. The material was a combined provenance and progeny trial, initially consisting of 144 families from open-pollinated trees of nine provenances. It was selectively thinned in year 2 removing 75% of the trees in each family and again in year 5.
The population structure was studied with microsatellite markers after the second thinning. The inbreeding coefficients (FIS) within provenances ranged from 0.069 to 0.198, relatively low values suggesting that selection at the first thinning favoured heterozygosity. Most of the molecular variation was within provenances, and FST was low, 0.023. The quantitative differentiation for growth traits (QST) among provenances after the second thinning was low since selection tended to equalize the performance of the provenances. The results support the general strategy of the breeding program to improve objective traits while retaining genetic variation.
Wood properties (basic wood density, cellulose and lignin contents) were determined in a group of fast-growing and a group of slow-growing families. The cellulose content of the fast group was significantly higher than that of the slow group (40.0% and 37.1%, respectively) and cellulose content was significantly correlated phenotypically with DBH. High growth rate can be combined with high cellulose content for trees intended for pulping. This conclusion was consistent with the non-significant genetic correlations between growth traits and cellulose content or wood basic density based on larger samples. Expression in scrapes of secondary xylem of genes of cellulose and lignin synthesis were related to wood properties. Cellulose synthase A4 (EuCesA4) expression was significantly correlated with cellulose content. Since EuCesA4 is a potential marker of cellulose content, we sampled 66 trees to investigate the occurrence of polymorphism in the DNA sequence. In a 2 kb sequence through six exons and six introns, the polymorphism density was 23 per kb.
Keywords: Cellulose, CesA, Eucalyptus, FST, Genetic correlation, Genetic variation, Lignin, Microsatellite, QST, Wood properties
Author’s address: Tran Ho Quang, SLU, Department of Plant Biology and Forest Genetics, P.O. Box 7080, SE 750 07 Uppsala, Sweden E-mail: [email protected], [email protected]

4
Dedication
To my parents My beloved wife Ngô Thị Minh Duyên My lovely daughter Trần Minh Khuê and my son Trần Minh Quân
5
Contents
List of Publications 7
1 Introduction 9
1.1 Classification and distribution 9
1.2 Breeding program for Eucalyptus urophylla in Vietnam 10
1.3 Objective traits and their correlations 12
1.3.1 Objective traits 12
1.3.2 Correlation between traits 13
1.4 Molecular genetic markers and their application to the
E. urophylla breeding progam 14
1.4.1 Types of molecular marker 14
1.4.2 Application of molecular markers for studying
genetic variation and fingerprinting 15
1.4.3 MAS in breeding programs 16
1.5 Wood formation and its genetic regulation 20
2 Aims of the present study 25
3 Materials and Methods 27
3.1 Plant materials 27
3.2 Measurement of wood properties (II, III) 28

6
3.3 Molecular methods (I, IV) 29
3.4 Statistical analysis 30
4 Main results and discussion 33
4.1 Genetic structure and quantitative variation (I) 33
4.2 Phenotypic correlation among growth characters and
wood properties (II) 36
4.3 Cellulose content as a selection trait (III) 37
4.4 Expression levels of cellulose and lignin synthesis genes (IV) 38
4.5 Correlation of gene expression with phenotypic traits (IV) 40
4.6 Nucleotide polymorphisms in EucesA4 gene (IV) 41
5 Conclusions and implications for tree breeding 43
6 Future perspectives 45
Acknowledgments 57

7
List of Publications
The thesis is based on the work described in the following papers, which are referred to by the corresponding Roman numberals in the text I Quang TH, Gyllenstrand N, Jansson G, Griffin R, von Arnold S,
Clapham D. Evaluating population structure by neutral markers in a thinned progeny trial of Eucalyptus urophylla. (Manuscript).
II Quang TH, Kien ND, von Arnold S, Jansson G, Thinh HH, Clapham D (2010). Relationship of wood composition to growth traits of selected open-pollinated families of Eucalyptus urophylla from a progeny trial in Vietnam. New Forests. 39: 301-312.
III Kien ND, Quang TH, Harwood C, Clapham D, von Arnold S (2009). Cellulose content as a selection trait in breeding for kraft pulp yield in Eucalyptus urophylla. Ann For Sci 66: 711-718.
IV Quang TH, Hallingbäck H, von Arnold S, Clapham D. Expression of genes of cellulose and lignin synthesis in Eucalyptus urophylla in relation to economic traits. (Manuscript).
Papers II, III are reproduced with the permission of the publishers.

8
The contributions of Tran Ho Quang to the papers included in this thesis were as follows: I THQ planned the work, carried out the laboratory part of the microsatellite analysis in Vietnam, analyzed the microsatellite data statistically and wrote the first draft of the paper. II THQ was greatly involved in the planning of the work, the measurement of cellulose contents, and in the statistical analysis, and wrote the first draft of the paper. III THQ was greatly involved in the planning of the work and the measurement of cellulose content, and in the writing of the paper. IV THQ planned the experiments and organized the sampling of the material for gene expression studies. He carried out all the laboratory work related to measurement of gene expression and preparing the DNA samples for sequencing. He carried out most of the statistical analysis of the results. He wrote the first draft of the paper.

9
1 Introduction
The demand for wood and wood products is continuing to increase over the world. The main reasons are an increase in world population, from 6.4 billion in 2005 to an expected 8.2 billion in 2030, and continued economic growth, with global GDP in US dollars rising from 16 trillion in 1970 to 47 trillion in 2005 and an expected 100 trillion in 2030 (FAO, 2009). Important factors affecting this demand are: (1) regional shifts, owing to the rapid growth of developing economies, particularly in Asia, (2) environmental regulations that exclude more forests from wood production, (3) energy policies, encouraging increased use of woody biomass (FAO, 2009). These trends are reflected in Vietnam. From 1943 to 1990, forest cover declined from 43% to 27%. From 1990 to 2005, it increased to 37%, a total of 12.61 million ha, which included 2.33 million ha of plantation forest (PM, 2006). The intention is to increase the area of plantation forest by a further million ha by 2010 and another million ha ‘for the next phase’. The export value of forest products is planned to reach 7.8 billion US dollars by 2020 from 1.5 billion US dollars in 2005 (PM, 2006).
1.1 Classification and distribution
The species of the genus Eucalyptus are now being widely used over the world to provide wood products for industrial sectors and for rural people. Eucalypts are highly productive and well adapted to dry, infertile sites, and are a productive land use of degraded land no longer suitable for agriculture. In Vietnam, together with other fast growing species of Acacia, Eucalyptus species are one of the most important groups that provide raw materials for pulp and papers, construction and making furniture. Eucalyptus plantations are also important to improve the income of rural people (Kha et al., 2003).

10
The total eucalypt plantation in Vietnam was 586,000 ha in 2008 (Iglesias-Trabado & Wilstermann, 2008).
Eucalyptus urophylla S. T. Blake belongs to the subgenus Symphyomyrtus, section Transversaria (Brooker, 2000). It is a diploid species (2n = 22) (Poke et al., 2005). The haploid genome size is 650 megabase pairs (Mb), similar to E. grandis (640 Mb) (Grattapaglia & Bradshaw, 1994) but larger than Arabidopsis thaliana (125 Mb) (Arabidopsis Genome Initiative, 2000) and Populus trichocarpa (485 Mb) (Tuskan et al., 2006). However, the E. urophylla genome is smaller than in gymnosperms which for example are in the range of 6,500 to 37,000 Mb for Pinus (Ahuja & Neale, 2005). The genome of E. grandis has been intensively sequenced and is expected to be complete by the end of 2010 (Grattapaglia & Kirst, 2008).
E. urophylla is frequently planted in humid and sub-humid tropical climates (Eldridge et al., 1993). The natural range extends across seven islands of Indonesia and Timor Lester in the Sunda archipelago (1220-1270E, 80-100S) comprising an area of 500 km (east to west) by 200 km (north to south). The species occurs over a wide altitudinal range, from 300 m to about 1,100 m in Flores, Adonara, Alor, Lomblen and Pantar; from 70 m to more than 800 m in Wetar, and from 1,000 m up to 2,960 m in Timor (Eldridge et al., 1993) and over a wide range of climatic conditions with a dry season varying from 2 to 8 months. It is predominantly outcrossing (Moran et al., 1989), the outcrossing rates being around 90% in both natural populations and seed orchards (Gaiotto et al., 1997; House & Bell, 1994). The species is mainly used for pulpwood, fibreboard and mining timber.
1.2 Breeding program for Eucalyptus urophylla in Vietnam
Tree breeding programs aim in the short term to produce new varieties with genetically improved traits that will increase the economic and social values of forest plantations. The short term aims are combined with a long term aim of maintaining genetic diversity within the breeding population to meet future needs. Procedures for long-term breeding include the multiple population breeding system of Namkoong (Eriksson et al., 2006). According to this procedure the breeding population is divided into about twenty subpopulations of 50 trees that are grown at different, often contrasting, sites. The fifty trees are crossed together, the breeding values are assessed on the basis of progeny trials, and selection practised for partly different sets of characters at the different sites. Then the cycle is repeated. The fifty trees are sufficient to avoid any important degree of inbreeding within a

11
subpopulation, and allelic diversity is maintained over the 1,000 trees of the total population. The subpopulations provide material to meet short term needs.
Figure 1. Tree breeding program for Eucalyptus urophylla in Vietnam
The breeding program for E. urophylla in Vietnam is outlined in Figure 1. Open-pollinated seeds were collected from about 150 randomly selected mother trees in natural stands (provenances) on the Indonesian islands. The open-pollinated families were planted 1997-1998 in progeny trials at two sites in northern Vietnam. In the second year, mass selection for superior phenotypes was applied by removing three trees in each plot, leaving the best tree as judged by fast growth, stem straightness and branch size. At age 5, the trial was thinned genetically to remove inferior families based on performance in the progeny test; at the same time, poor trees from other families were removed. The inferior trees removed by thinning are often the result of selfing or mating between close relatives. The inbred trees result in reduced vigour and survival, both in natural forests or plantations under competition (Hardner & Potts, 1995; Eldridge & Griffin, 1983). The thinned progeny trials were developed into seedling seed orchards (SSOs) by harvesting open-pollinated seed from 25-50 parent trees. This fulfilled the short-term objectives of the breeding program by providing genetically

12
improved seed for large-scale plantations. A procedure exploiting open pollination is commonly employed as an important component of eucalypt breeding programs (White et al., 2007).
From 2005 to 2008, several additional progeny trials were established at various sites in Vietnam. These were partly based on open-pollinated seed from selected trees from the first progeny trials. They enable estimates of genotype-environment interaction. Furthermore, the genetic base was expanded by including material from seed orchards in Thailand and China, and further trees from natural stands in Indonesia (Kien, 2009). Altogether the trials included 80-200 open-pollinated families for the second cycle of selection. The introduction of new material into the breeding programme to maintain genetic diversity is an alternative to the methods of the multiple population breeding system.
Breeders distinguish between ‘selection backwards’ and ‘selection forwards’. In selection backwards, trees are cross-pollinated in several combinations and the seeds are used in progeny trials to identify parents with high general combining ability. Based on the results, parents are crossed to produce the next generation, or to establish a seed orchard. Selection backwards which is very time consuming has not been exploited in the Vietnamese breeding program with open pollination. Selection forwards, i.e. direct selection for trees in progeny trials to produce the next generation, was practised during the two thinning operations, phenotypically at the first thinning, and both genetically and phenotypically at the second thinning when information on family performance was available. In principle individual trees can be selected genetically by following the performance of cuttings in replicated trials.
1.3 Objective traits and their correlations
1.3.1 Objective traits The Vietnamese tree breeding program has been planned to meet the industrial demand for end-products. Objective traits are those that directly influence income and cost in the production system (review:(Berlin, 2009) and are therefore of central importance in choosing breeding objectives. Objective traits in Eucalyptus breeding are usually growth and wood properties such as stem volume and form, wood density and pulp yield (Borralho et al., 1992).
Growth rate and growing form have long been targets for tree breeders. To take examples from Eucalyptus, the genetic gains relative to unimproved
13
material have been 12-22% for E. pellita (Leksono et al., 2008), E. grandis and E. dunnii (Marco & White, 2002). In recent years the forest industry has paid increasing attention to wood property traits, both physical and chemical. The physical traits include wood basic density (DEN), wood stiffness, fibre length, and microfibril angle. The chemical traits include cellulose and lignin contents, and pulp yield.
DEN has been a favoured trait because it is easy to measure by simple and non-destructive protocols. Species studied include E. globulus (Apiolaza et al., 2005; Raymond & Muneri, 2001) and E. nitens (Raymond & Muneri, 2001). The other traits mentioned above, including cellulose and lignin contents and Kraft pulp yield, are currently laborious and expensive to measure, or require destructive sampling. The situation is changing, however, as technologies develop to allow rapid non-destructive sampling. The SilviScan instrument is easy to use non-destructively on a large scale for measuring fibre properties and density, and is an important step forward, but is very expensive. 1.3.2 Correlation between traits Two types of correlations have been used in breeding programs: phenotypic and genetic. Characters are phenotypically correlated either because they are influenced by the same or linked genes, or because the environment affects their development similarly. A genetic correlation is a correlation of breeding values, i.e. the genotypic value of each character judged by the mean value of its progeny in a properly replicated trial compensating for environmental influences. Genetic correlations are clearly preferable in principle for breeding decisions, but because they are measured indirectly, the errors are large. Therefore large samples are required for moderate genetic correlations to be statistically significant. For example, for E. nitens, the phenotypic correlation between cellulose content and diameter at breast height (DBH) was statistically significant (0.23-0.38) whereas the genetic correlation that can reasonably be expected on physiological grounds was higher (0.63-0.86) but not statistically significant (Kube et al., 2001). A genetic correlation results either from the same genes influencing the two characters, or from linkage of genes that act independently on each character; this distinction can affect breeding decisions, such as how easy it is to break an unfavourable negative correlation.
Genetic correlations between growth traits and DEN have been studied in many species including Eucalyptus, and it has been concluded that there is little association between the two kinds of traits (White et al., 2007). Genetic correlations between growth and various wood properties were not

14
statistically significant for E. globulus (Apiolaza et al., 2005), where DEN, and cellulose and lignin contents were studied. Correlations between growth (DBH) and cellulose content in E. nitens (Hamilton & Potts, 2008) ranged from -0.53 to 0.37 with large standard errors and were also non-significant.
1.4 Molecular genetic markers and their application to the E. urophylla breeding progam
1.4.1 Types of molecular marker DNA markers detected by Southern hybridization, such as restriction fragment length polymorphisms (RFLP), were developed in the 1970s but are laborious to use and will not be discussed here. Of much wider application are markers detected by the polymerase chain reaction (PCR), which are suitable for large-scale screening of populations and require minimal quantities of DNA. The single primers for the PCR reactions are sequences of about ten nucleotides that anneal to various sites in the genome. Random amplified polymorphic DNA (RAPD) markers (Welsh & McClelland, 1990; Williams et al., 1990) have been used in forest trees (Cervera et al., 2000) but results have been difficult to repeat across laboratories. Vos et al. (1995) developed the amplified fragment length polymorphism (AFLP) markers, which work with a variety of genomic DNA samples and for which no prior information on genomic sequence is required. Genomic DNA is cleaved with restriction enzymes, adaptors are ligated to the ends of the fragments, and a subset of fragments are amplified using primers complementary to the restriction site sequence and the adaptor. Simple sequence repeats (SSRs), i.e. microsatellite markers, introduced by Weber and May (1989), are core sequences of 1-6 base-pairs organized in numerous tandem repeats and dispersed at many loci throughout the genome. The number of tandem repeats varies among individuals, so that the locus can act as a genetic marker. A microsatellite marker is amplified using PCR primers specific for single copy DNA sequences flanking the microsatellite locus. The amplified sequences are separated according to size by electrophoresis. These markers are highly attractive because of their abundance in the genome and because they are relatively easy to visualize and score.
Microsatellite markers (SSRs), unlike RAPD and AFLP, have the advantage of being multiallelic and codominant, and are favoured for many applications. RAPD, AFLP and microsatellite markers normally reveal variation in non-genic DNA. For studying variation in structural genes, newer types of markers are expressed sequence tagged polymorphism

15
(ESTP) and single-nucleotide polymorphism (SNP). Expressed sequence tags are partial cDNA sequences obtained in mass sequencing projects. The polymorphisms are detected by PCR amplification from primers based on the sequences. SNPs are single nucleotide alterations in gene sequences. ESTPs and SNPs normally have to be characterized by sequencing, which is becoming feasible on a large scale owing to continual advances in sequencing techniques.
Molecular markers have potential applications at several stages of a breeding program (White et al., 2007). These include: (1) the assessment of variation within and between populations or progenies, including the extent of crossing among the groups, the relative roles of selection and random drift, and the degree of inbreeding, which can affect the need for introduction of new material or rejection of existing material; (2) genetic fingerprinting of individuals or groups, for example to check on the extent of pollination from outside a seed orchard, or to confirm the identity of individual trees after controlled crosses; and (3) in marker-assisted selection (MAS) for breeding. 1.4.2 Application of molecular markers for studying genetic variation and fingerprinting An example of a study of the structure of native tree populations of interest for tree breeding is that of Tripiana et al. (2007). Ten microsatellite markers were used to examine the genetic diversity and structure of 17 E. urophylla natural populations. The results showed low differentiation among populations (FST = 0.04) and high inbreeding coefficient (FIS = 0.2). The genetic diversity and relationship among individuals and provenances in E. dunnii seed orchards was assessed from AFLP and SSR data (Zelener et al., 2005). A high proportion, 80%, of the total variation occurred within families, with little variation among provenances. Each individual could be fingerprinted by the markers. The authors concluded that not all provenances or families need to be represented in the seed orchard to conserve genetic diversity. This is consistent with the thinning activities in conventional breeding programs.
Genetic fingerprinting was exploited by Cupertino et al. (2009), who verified paternity and maternity of controlled crosses in Eucalyptus using microsatellite markers. They found that out of 305 progeny individuals, 78% were correctly assigned to the putative mother/father trees but that variable levels of contamination were detected in 10 of the 14 families. They concluded that parentage analysis should be applied for controlled crosses, especially if the parents are to be used for quantitative trait loci mapping.

16
Chaix et al. (2003), using six SSRs markers to detect gene flow in a seed orchard of E. grandis, found that the outcrossing rate was high (96.7%) and that pollen contamination from outside the seed orchard was 40%. 1.4.3 MAS in breeding programs An important goal of a tree breeding program is to increase the quantity and improve the quality of the wood. In a conventional breeding program, families and individuals are selected phenotypically to capture additive genetic variation, based on performance in a properly randomized and replicated progeny trial. Usually, phenotypic selection is performed after one third of the rotation time. However, phenotypic selection for many traits is ineffective during the early rotation cycle (White et al., 2007), which means selection after at least three years even for tropical forest trees, and commonly 10-20 years for temperate zone trees. Consequently much attention has focused on DNA markers linked to the traits of interest that will enable early selection even at the seedling stage (MAS). This is a move from phenotype-based towards genotype-based selection. Two types of MAS have been applied recently to forest tree improvement: (1) indirect selection based on markers linked to quantitative trait loci (QTL) and (2) direct selection for genes determining the target traits.
By QTL is meant a chromosomal region that includes a gene or genes that determine a quantitative trait. An indirect procedure to find QTLs includes the following steps: (1) generate a pedigreed mapping population by controlled pollination, often an interspecific backcross (e.g. for Eucalyptus species, Kirst et al., (2004); (2) construct a genetic linkage map using genic and/or non-genic molecular markers; (3) measure phenotypically the traits of interest on the progeny trees, (4) identify QTLs by a significant linkage between marker and the trait variation with the help of statistical programs.
Attempts to find QTLs in forest trees by indirect selection methods have continued since the 1990s, e.g. with Pinus taeda (Groover et al., 1994; Tauer et al., 1992) and Populus trichocarpa x P. deltoides (Newcombe & Bradshaw, 1996). In Eucalyptus, the first genetic linkage map was constructed for E. grandis x E. urophylla using 558 (Grattapaglia & Sederoff, 1994) or 480 (Verhaegen & Plomion, 1996) RADP markers. More dense linkage maps were later constructed for Eucalyptus species: E. grandis (Agrama et al., 2002), E. globulus (Thamarus et al., 2004), (E. grandis x E. globulus) x E. grandis (Kirst et al., 2004), and E. grandis (Missiaggia et al., 2005), with various markers (AFLP, SSRs, Expressed sequence Tags (ESTs). Many QTLs have been detected in the important Eucalyptus species, most of them for wood properties and growth traits (Table 1).

17
Table 1. Quantitative trait loci determined for Eucalyptus species
Species Markers Traits QTLs Variance explained (%)
References
E. globulus AFLPs Vegetative propagation
1 putative for sprouting ability
3.8 (Marques et al., 1999)
4 putative for stability of adventiuous rooting
2.5-7.9
2 putative for rooted/serving cuttings
4.7-7.0
1 putative for rooted/total cuttings
5.5
RAPDs, SSRs Growth 3 for DBH 7.8-17.9 (Bundock et al., 2008)
AFLPs, SSRs 2 for DBH 3.8-5.2 (Freeman et al., 2009)
RAPDs, SSRs Bud phenology
1 for early flowering
12.9 (Bundock et al., 2008)
RAPDs, SSRs 2 for wood density
6.7-13.8 (Bundock et al., 2008)
AFLPs, SSRs 3 for wood density
7.2-10.4 (Freeman et al., 2009)
4 for cellulose content
5.6-12.3
2 for total lignin content
9.5-10.7
1 for Klason lignin
11.3
1 for pulp yield
12.2
E. nitens RFLPs, SSRs, ESTs, SNPs
Foliar concentration
9 for formylated phloroglucinon compounds
3.9-12.6 (Henery et al., 2007)
38 for terpenes
3.4-16.9
RFLPs Leaf area 2 for leaf area 9.8-11.6 (Byrne et al., 1997a)
Abiotic strees 2 for frost tolerance
7.7-10.8

18
RFLPs Growth 3 for height 10.3-14.7 (Byrne et al., 1997b)
RFLPs, SSRs, SNPs, ESTs
Wood properties
7 for cellulose content
4.3-7.1 (Thumma et al., 2010)
4 for pulp yield
3.8-5.5
5 for wood density
2.8-5.2
6 for microfibril angle
3.6-5.2
4 for extractives
4.4-6.9
3 for acidsol lignin
3.6-4.7
3 for klason lignin
3.5-5.5
4 for total lignin
4.7-7.3
E. grandis RAPDs Growth 2 putative for DBH
3.9-6.6 (Grattapaglia et al., 1996)
Wood properties
5 for wood specific gravity
3.4-10.2
E. tereticornis AFLPs Vegetative propagation
3 putative for mortality
3.5-14.4 (Marques et al., 1999)
2 putative for rooted/surviving cuttings
3.8-5.5
3 putative for rooted/total cuttings
2.9-5.4
4 putative for petrification
3.1-17.0
E. grandis x E. urophylla
RAPDs Vegetative propagation
6 for stump sprouting ability
14.7-22.9 (Grattapaglia et al., 1995)
4 for rooting ability
8.5-26.3
E. urophylla x E. grandis
RAPDs Wood property
4 for wood density
5.6-10.7 (Verhaegen et al., 1997)
Growth 4 for stem form
5.1-11
4 for stem growth
5.1-14

19
However, the indirect method has some serious limitations. The QTLs
detected in the specific mapping population cannot usually be applied to other populations/crosses at the same or different sites; alleles linked in coupling phase in one population are liable to be linked in repulsion phase in another population. QTL detection is affected by interaction among QTLs, by genetic background, and by the environment. In addition, using pedigree populations of manageable size, QTLs are not located precisely but rather within a map distance of 5-10 cM. This distance is around several megabases when translated into a physical map and it may contain several hundred genes, including additional QTLs. It is hoped that a limited number of QTLs, three to six, will explain perhaps 60% of the total variation of important quantitative traits – an oligogenic model. For forest trees, this appears to be optimistic. For example, in a recent study of wood properties in E. nitens with a mapping population of 296 trees in a full-sib family (Thumma et al., 2010), seven QTLs explained 38% of the total phenotypic variance in cellulose content, the contributions of individual QTL varying from 4.3% to 7.1%. In general, with a few exceptions, individual QTLs account for not more than 5-10% of the phenotypic variance of quantitative traits and the number of QTLs detected is less than ten (White et al., 2007); for Eucalyptus, see Table 1. This is as close to a polygenic as to an oligogenic model of inheritance.
Another MAS method that tree breeders are beginning to apply is direct selection for allelic variants of genes modifying target traits, rather than selection for linked markers (e.g.(Neale & Savolainen, 2004). This method relies on identification of variations in the DNA sequence of genes directly controlling phenotypic variation. The favourable SNP within a ‘candidate’ gene – that is, a gene suspected to influence the trait - is found by association mapping. The association mapping is constructed based on the linkage disequilibrium (LD) markers, i.e the loci that are in population-wide LD with the functional mutation in populations. The statistical programs are applied to find the association between molecular markers and phenotype. Whereas QTL mapping depends on linkage disequilibrium between the marker and the QTL within the mapping population, association mapping populations have low LD to enable correlation of an SNP with the desired phenotype. Usually large natural populations are employed, of at least 500 individuals.
The first association study of a forest tree was on E. nitens (Thumma et al., 2005). The authors found 25 SNPs in the lignin biosynthesis gene cinnamoyl CoA reductase (CCR) and using single-marker and haplotype

20
analyses in 290 trees from a natural population, two haplotypes were significantly associated with microfibril angle (MFA). These results were confirmed in two full-sib families of E. nitens and E. globulus. In P. taeda, Gonzalez-Martinez et al., (2007) found four genes (cad, sams-2, lp3-1 and α-tubulin) associated with wood properties. Later, using 961 clones from 61 families in a P. taeda breeding program, and correcting for family structure, Gonzalez-Martinez et al. (2008) correlated SNPs in two genes (dhn-1 and lp5-like) with stomatal conductance.
It is unlikely to be profitable to select among seedlings exclusively at the DNA level for an optimal combination of alleles at many candidate gene loci. It may however make sense to select for optimal alleles at one or a few loci with large effects on target traits to reduce the numbers of trees that are subsequently grown out in a conventional progeny trial; discussed in White et al. (2007).
1.5 Wood formation and its genetic regulation
Cell wall terminology is as follows Evert (2006). The cellulosic layers formed first in the cell make up the primary cell wall; the middle lamella is the region of union of the primary walls of adjacent cells. Many cells deposit additional layers, composing the secondary cell wall, on the inner surface of the primary cell wall mainly when it has stopped expanding. In thick cell walls, three layers called S1, S2 and S3 can be distinguished by the different orientations of the cellulose microfibrils. S3 is the outer cell layer. The S2 layer is the thickest.
Wood is essentially secondary xylem, a complex tissue. Bark is secondary phloem. The major components of wood, deriving mainly from the thickened secondary cell walls of various cell types, are cellulose, hemicellulose and lignin (Plomion et al., 2001). Cellulose microfibrils consist of assemblies of 18 or 36 parallel chains of β-D- glucopyranose units linked by 1-4 β-glycosidic bounds held together along their length by hydrogen bonding (Buchanan et al., 2000). Hemicelluloses, mainly xyloglucan polymers in dicots, connect microfibrils by hydrogen bonding with the cellulose. The microfibrils are embedded in a matrix of hemicellulose and pectins in the primary cell wall and a matrix of hemicellulose and lignin in the secondary cell wall. The cellulose microfibrils are responsible for the tensile strength of cell walls, and the developmental flexibility of the primary cell wall (Buchanan et al., 2000). Lignin is a complex network of aromatic

21
compounds, mainly consisting of covalently linked monolignols, i.e. p-coumaryl, coniferyl and sinapyl alcohols. It provides wood with its resistance to compression. Being hydrophobic, it assists water transport. Furthermore, it contributes to defence against insects and pathogens (Rogers & Campbell, 2004). In E. globulus, comparable with other woody angiosperms, the cellulose content of dried wood is usually 40-42% (Raymond & Schimleck, 2002) and the lignin content 21-29.8% (Rodrigues et al., 1999). The hemicellulose and cellulose contents of wood are often approximately equal (Buchanan et al., 2000). In addition, structural proteins such as the extensins often make up 10% of the dry weight of the primary cell wall.
Secondary growth is the process driving the radial expansion of woody stems through the activity of a lateral meristem, the vascular cambium (e.g(Du & Groover, 2010). The vascular cambium, called a secondary meristem because it originates from a primary meristem, the procambium in the shoot apex, forms a continuous cylinder of meristematic cells in mature stems. The cambial initials are of two kinds. The isodiametric ray initials, often in groups, divide to form the radially oriented rows of parenchymatous cells (ray parenchyma). The fusiform initials divide periclinally forming the mother cells of the secondary phloem to the outside of the stem and those of the secondary xylem to the inside. The mother cells go through further rounds of periclinal division. The secondary xylem of angiosperm trees such as eucalypts consists of the tracheary elements, i.e. the longitudinally oriented tracheids and vessels that conduct water and minerals from roots to the growing shoots. Additional cell types are ray parenchyma allowing transport across the stems and storage of starch, axial parenchyma and fibres.
The tracheary elements differentiate through five major stages that include (1) cell division, (2) cell expansion, by elongation and radial enlargement, (3) secondary cell wall formation, (4) programmed cell death and (5) heartwood formation. These processes occur in zones across the stem, that have been sampled and the gene expression corresponding to each stage has been studied (Shrader et al., 2004). Although secondary growth is regulated partly by phytohormones and at the posttranscriptional and posttranslational levels, there is a striking correlation between the transcript abundance of particular genes and the stage of development of the cells, indicating the key importance of transcriptional control of gene expression (Du & Groover, 2010; Shrader et al., 2004).

22
Figure 2. A model for the structure of the rosette. Six subunits, possibly containing six CesA
polypeptides, interact to form a rosette, a single CesA enzyme complex. Each CesA
polypeptide is shown to be involved in the synthesis of one β-(1,4)-glucan chain (Adapted
from Doblin et al., 2002) (Doblin et al., 2002)
Cellulose is synthesized and assembled at the surface of the plasma
membrane by a complex of enzymes (cellulose synthases), that moves over the plasma membrane on top of cortical microtubules (Smith et al., 2010; Lloyd & Chan, 2008; Doblin et al., 2002); the process has been directly visualized in living cells by fluorescent staining (Paradez et al., 2006). Cellulose microfibrils are extruded from the complexes into the cell wall. The enzyme complexes are visible as hexameric rosettes approximately 25-30 nm in diameter when plant cells are examined by freeze-fracture electron microscopy (Lerouxel et al., 2006). Each rosette comprises six rosette subunits, and each rosette subunit contains six cellulose synthase A (CesA) proteins, to give 36 CesA proteins per rosette (Fig. 2). The rosettes are assembled in the Golgi and transported to the plasma membrane, where they are believed to build the elementary cellulose microfibrils. The rosette structure seems to be highly conserved in vascular plants, although they have not so far been identified in woody plants (Déjardin et al., 2010).
Although cellulose synthesis is not well understood, cellulose synthase (UDP-glucose-(1,4)-β-glucan glucosyl transferase) clearly plays an important role. The first Ces gene was cloned and identified in the cellulose-synthesizing bacterium Acetobacter xylium (Saxena et al., 1990; Wong et al.,

23
1990). To date, many Ces genes have been identified and sequenced from different species. For plant species where the genome has been fully sequenced, the CesA gene family consists of 12 genes in Arabidopsis (Arabidopsis Genome Initiative, 2000), 13 in Oryza sativa (TIGR Rice Genome Annotation, accessed 10 April 2010) and 18 in P. trichocarpa (Djerbi et al., 2005). In E. grandis, six full length CesA genes have been identified to date (Lu et al., 2008; Ranik & Myburg, 2006).
Studies of the Arabidopsis mutants show that at least five genes, AtCesA1, AtCesA2, AtCesA3, AtCesA5 and AtCesA6, are active in primary cell wall synthesis (Doblin et al., 2002; Arioli et al., 1998); of these, the proteins encoded by CesA1, CesA3 and CesA6 form the rosette in the primary cell wall (Bessueille & Bulone, 2008; Desprez et al., 2007). Three CesA proteins encoded by AtCesA4 (irx5), AtCesA7 (irx3) and AtCesA8 (irx1), interact as part of another rosette essential for cellulose synthesis in secondary cell walls of vascular tissues (Taylor et al., 2003; Zhong et al., 2003; Taylor et al., 2000). Mutation of CesA genes in the monocot, O. sativa (Tanaka et al., 2003) show that OsCesA4, OsCesA7 and OsCesA9 are orthologous with AtCesA8, AtCesA4 and AtCesA7 in Arabidopsis. Characterization of the sequences and expression of three genes in the conifer P. taeda (Nairn & Haselkorn, 2005), indicate that each of the genes, PtCesA1, PtCesA2 and PtCesA3, is orthologous to one of three groups of CesA genes from angiosperm taxa that are functionally non-redundant and are necessary for cellulose synthesis in secondary cell walls of vascular tissues.
The enzymatic pathways of lignin biosynthesis and the genes involved have been studied intensively (Vanholme et al., 2008; Halpin, 2004; Boerjan et al., 2003). Lignin content and monomeric composition vary widely among different taxa, individuals, tissue, cell types and cell wall layers. Conifer lignin is a polymer containing H units, derived from the monolignol p-coumaryl alcohol, and G units, derived from coniferyl alcohol; angiosperm lignin contains in addition S units from sinapyl alcohol. The monolignol units differ from each other only by their degree of methoxylation. Two final steps in the synthesis of monolignols, studied in the present investigation, are catalyzed by the enzymes CCR and cinnamoyl alcohol dehydrogenase (CAD). CCR catalyzes, e.g., the conversion of ferruloyl-CoA to coniferaldehyde and CAD catalyzes the oxidation of coniferaldehyde to coniferyl alcohol, with corresponding reactions for the synthesis of the other monolignols. The CCR reaction is believed to be a point of regulation of monolignol synthesis in Eucalyptus (Piquemal et al. 1998).

24
The biosynthesis of hemicelluloses (Lerouxel et al., 2006) occurs in the Golgi apparatus by a process that can be divided into two main steps: the synthesis of the backbone by polysaccharide synthases, and the addition of side chain residues in reactions catalyzed by a variety of glycosyltransferases (Keegstra & Raikhel, 2001). Hemicelluloses were not studied in the present investigation.

25
2 Aims of the present study
The overall aim of this study was to investigate the potentials for using molecular characters in the breeding of E. urophylla. Specific aims included:
To assess the genetic structure and extent of inbreeding within and
among provenances of E. urophylla in a thinned progeny trial, using
microsatellite variation.
To estimate phenotypic correlations between growth traits and
wood properties (cellulose content, lignin content and basic wood
density).
To determine the heritability of growth and wood property traits
and genetic correlations among them.
To correlate the expression of genes of cellulose and lignin synthesis
with wood traits (cellulose and lignin contents, wood basic density)
and tree growth (height, diameter at breast height).
To investigate single nucleotide polymorphism in a gene of
importance for cellulose synthesis, CesA4.

26

27
3 Materials and Methods
3.1 Plant materials
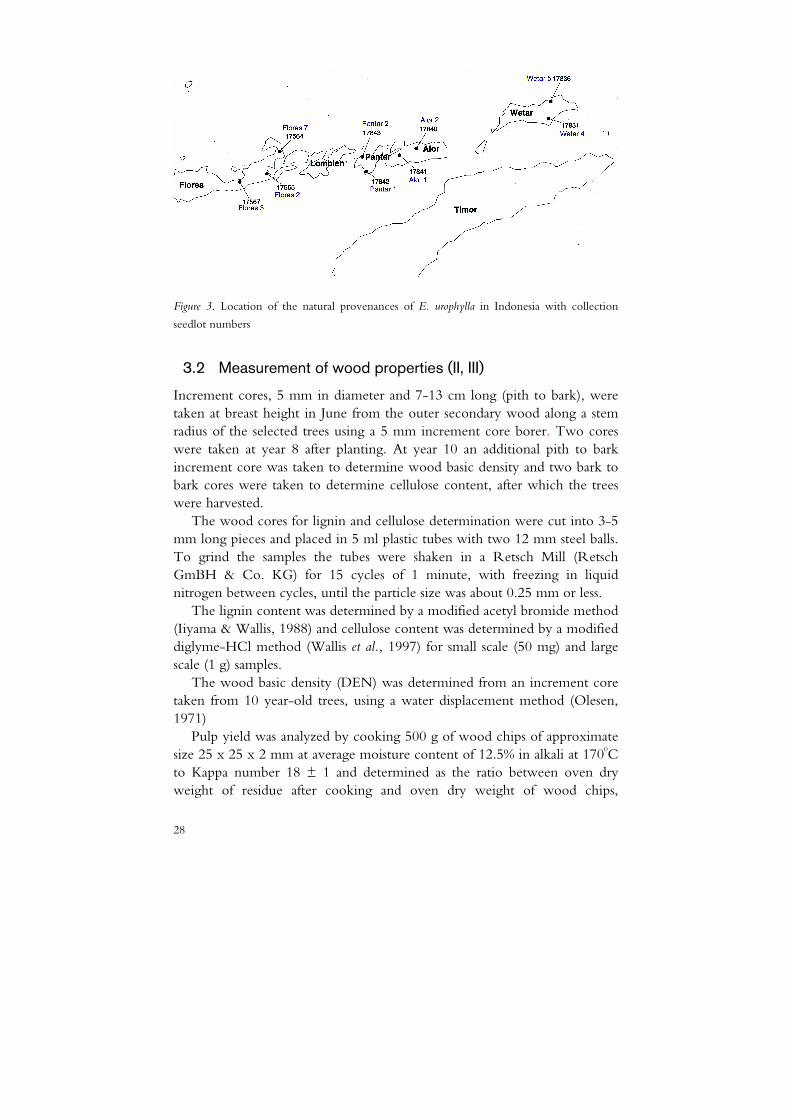
Trees in this study were sampled from a thinned progeny trial of Eucalyptus urophylla at Ba Vi Experimental Station, northern Vietnam. The field trial was established in 1997 from 144 open-pollinated families derived from randomly selected trees from nine natural provenances in Indonesia, from Flores, Wetar, Pantar and Alor islands (Figure 3). The trial design was a row-column design (12 rows x 12 columns) with eight replicates and four-tree row plots. The initial spacing was 4 m between rows and 1.5 m within rows. The progeny test was thinned initially in year two after planting by leaving the single tree with the best vigour and stem form in each plot and for a second time at year five in which the 17 worst-performing families and inferior trees of some other families were removed, leaving 127 families with 4-8 trees per family.
Diameter at breast height (DBH) and total height were measured in May after 8 and 9 years growth. A group of five fast-growing and six slow-growing families were selected for further study based on differences in DBH and total height. The fast-growing group was on average 43% taller and had 29% greater DBH than the slow-growing group. Each group included 31 trees.
28
Figure 3. Location of the natural provenances of E. urophylla in Indonesia with collection
seedlot numbers
3.2 Measurement of wood properties (II, III)
Increment cores, 5 mm in diameter and 7-13 cm long (pith to bark), were taken at breast height in June from the outer secondary wood along a stem radius of the selected trees using a 5 mm increment core borer. Two cores were taken at year 8 after planting. At year 10 an additional pith to bark increment core was taken to determine wood basic density and two bark to bark cores were taken to determine cellulose content, after which the trees were harvested.
The wood cores for lignin and cellulose determination were cut into 3-5 mm long pieces and placed in 5 ml plastic tubes with two 12 mm steel balls. To grind the samples the tubes were shaken in a Retsch Mill (Retsch GmBH & Co. KG) for 15 cycles of 1 minute, with freezing in liquid nitrogen between cycles, until the particle size was about 0.25 mm or less.
The lignin content was determined by a modified acetyl bromide method (Iiyama & Wallis, 1988) and cellulose content was determined by a modified diglyme-HCl method (Wallis et al., 1997) for small scale (50 mg) and large scale (1 g) samples.
The wood basic density (DEN) was determined from an increment core taken from 10 year-old trees, using a water displacement method (Olesen, 1971)
Pulp yield was analyzed by cooking 500 g of wood chips of approximate size 25 x 25 x 2 mm at average moisture content of 12.5% in alkali at 1700C to Kappa number 18 ± 1 and determined as the ratio between oven dry weight of residue after cooking and oven dry weight of wood chips,

29
expressed as a percentage. The Kappa number is an indication of the residual lignin in the pulp and measures the amount of bleach required during digestion of a wood pulp in order to obtain a pulp with a given degree of whiteness (Smook, 1992).
3.3 Molecular methods (I, IV)
For microsatellite analysis of neutral genetic variation within and among provenances, (Paper I), fresh leaves were collected after the second thinning from 10 to 15 trees (seven trees for Alor 2) chosen randomly from each of the 9 provenances. DNA was isolated by a CTAB method after Gawel & Jarret (1991). Then thirteen EMBRA microsatellite markers belonging to different linkage groups were analysed: EMBRA 12, EMBRA 16, EMBRA 56 and EMBRA 70 are located in linkage group I, EMBRA 36 in linkage group IV, EMBRA 41 and EMBRA 64 in linkage group V, EMBRA 28 in linkage group VI, EMBRA 42 in linkage group VII, EMBRA 58 in linkage group IX, EMBRA 38 and EMBRA 40 in linkage group X and EMBRA 29 in linkage group XI. The appropriate primer sequences were obtained from Brondani et al. (2006). PCR amplification was performed in a 20 µl reaction mix by standard methods. The PCR products were separated by electrophoresis on 40% denaturing polyacrylamide gels and stained by silver nitrate to reveal banding patterns. The size of the amplified microsatellite products was assessed by the QuantityOne program (Biorad).
For Paper IV, scrapes of developing secondary xylem about 60 x 50 x 0.5 mm (length x breadth x thickness) were collected from trees of the fast growing and slow growing group at breast height (1.3 m) after removing the bark. The scrapes were immediately frozen in liquid nitrogen. Total RNA was isolated from the scrapes by a proteinase K method modified from Azevedo et al. (2003). Genomic DNA was removed by DNase treatment. The mRNA was reverse transcribed to cDNA using random primers and the RETROscript kit (Ambion).
Six genes encoding cellulose synthase (EuCesA1, EuCesA2, EuCesA3, EuCesA4, EuCesA5 and EuCesA6) were included in this study. These were the homologues in E. urophylla of six CesA genes in E. grandis: EgCesA1, EgCesA2, EgCesA3, EgCesA4, EgCesA5, EgCesA6 (Ranik & Myburg, 2006). In addition two genes related to lignin synthesis, cinnamyl alcohol dehydrogenase (CAD2) (Grimapettenati et al., 1993) and cinnamoyl CoA reductase (CCR) (Lacombe et al., 1997) were investigated. The reference gene for qRT-PCR was EuIDH coding for an NAPD-isocitrate

30
dehydrogenase and corresponding to the E. grandis gene (EgIDH) (Boiffin et al., 1998). This gene was chosen as an internal standard in the study of expression of genes in tension wood of E. globulus (Paux et al., 2005).
To detect single nucleotide polymorphism (SNPs) in the EuCesA4 gene (Paper IV), two kb of the gene was sequenced. The segment extended from about 635 bp before the translational start in the 5-prime untranslated region (5’UTR) through six exons (of which four were in the coding sequence) and six introns, (of which four were after the translational start). The segment for sequencing was amplified by PCR using primers based on the sequence of CesA4 from E. grandis (Lu et al., 2008). The PCR products were checked by gel electrophoresis and sent to Macrogen Ltd for sequencing. The original primers were used for the initial sequencing from each end, and based on the results additional internal primers were chosen for further sequencing.
3.4 Statistical analysis
Provenance genetic structure (paper I) was calculated with the following programs: Micro-checker (Van Oosterhout et al., 2004) to check genotyping errors, Genepop web service (Rousset, 2008) for calculating linkage disequilibrium among 12 microsatellite loci, GeneAlEx 6.1 (Genetic Analysis in Excel) (Peakall & Smouse, 2006) for number of different alleles per polymorphic locus (Na), number of effective alleles (Ne), observed heterozygosity (Ho), and unbiased expected heterozygosity (He). The Global molecular variance (AMOVA) for 9 provenances with 16,000 permutations was calculated using the ARLEQUINE 3 programme (Excoffier et al., 2005). The provenance differentiation was estimated using the variance-based method and F-statistics in the program FSTAT 2.9.3.2 (Goudet, 2001) for mean values of the F-statistics parameters, FIT, FST and FIS (over provenances). The variance components between and within provenances were calculated by the PROC MIXED procedure and the restricted maximum likelihood method of the SAS (SAS Institute, 2004) .
The genetic variation (Paper I) of quantitative traits (QST) was estimated according to McKay and Latta (2002) for the growth traits height and DBH in year 1 after planting, before and after thinning in year 2, in year 3, before and after thinning in year 5, and in year 8. Standard errors were calculated using a Taylor series expansion. The GraphPad Prism statistics program, version 4.00 (GraphPad Software, Sandiego California USA, www.graphpad.com) was used for unpaired t-tests, Pearson correlations and

31
one-way ANOVA. The following model was used in the one-way ANOVA: y = μ + a + e where y = observed values, μ = overall mean, a = family effect, e = residual (Paper I). Linear regressions between wood properties were calculated using PROC REG in SAS software (SAS Institute, 2004) and the estimation of variances and covariances in the genetic study using ASReml (Gilmour et al., 2006) (paper III).

32

33
4 Main results and discussion
4.1 Genetic structure and quantitative variation (I)
Objectives here were to estimate the degree of inbreeding within the nine provenances after the second thinning using microsatellite markers, and to compare the genetic differentiation among provenances estimated by neutral molecular markers and by growth traits.
The inbreeding coefficient FIS for each provenance in our study ranged from 0.069 (Alor 2) to 0.198 (Flores 2), all significantly different from zero (Table 2, Paper I), but not from each other. The FIS values indicated reduced heterozygosity and some degree of inbreeding in all the provenances. The range of FIS values, estimated after selection at two thinning occasions, is lower than that reported for E. urophylla provenances in the unselected progenies of trees in the wild, 0.13-0.31 (Tripiana et al., 2007). The most likely explanation for the lower FIS values in our study is that selection during thinning favoured heterozygous, outbred genotypes. Consistent with this, the FIS values for the three provenances common to both studies (Flores 2, Flores 3 and Flores 7) were 0.198, 0.104 and 0.174 in our thinned material and 0.29, 0.31 and 0.23 for the unselected progenies of Tripiana et al. (2007).
The FIS values for the Flores provenances were among the highest both in our study and in that of Tripiana et al. (2007). The high FIS in our study apparently reflects the high FIS value of the native population rather than only the effects of selection during thinning. Nevertheless, Flores 2 was the fastest growing provenance in our study (Kien et al., 2009). It may be advisable to cross Flores 2 with other less inbred provenances to maintain genetic variation in the future breeding.

34
The overall mean of FST values over all loci was 0.023 but significantly different from zero (P < 0.01), indicating the low differentiation among provenances in the progeny trial after thinning. In the previous studies on natural populations of E. urophylla of Payn et al., (2008) and Tripiana et al. (2007) the FST values were slightly higher, 0.031 and 0.04, respectively.
The quantitative variance (QST) of phenotypic traits (height and diameter at breast height) was calculated in year 1 after planting, in year 2 before and after thinning, in year 3, in year 5 before and after thinning, and in year 8. (Table 4, Paper I). The QST values for both height and DBH increased gradually from the first year (0.047 and 0.038, respectively) to the fifth year before thinning (0.113 and 0.169, respectively). They declined after thinning in year 5 and were 0.081 and 0.090 respectively in year 8. The standard errors on QST estimates were, however, large.
A B C D
cm
Figure 4. The family mean (columns) and standard error of mean (bars) of DBH (cm) for each of the nine provenances at year 2 before (A) and after (B) the first thinning and year 5 before (C) and after the second thinning (D). The order of the provenances is Flores 7, Flores 2, Flores 3, Alor 2, Alor 1, Pantar 1, Pantar 2, Wetar 5 and Wetar 5.
The effect of selection during thinning for the variation of growth within
and among provenances is illustrated in Figure 4. The thinning in year 2

35
brought forward the superiority of the best provenances (Fig. 4A, B). The differences among provenances increased further with age up to year 5 before thinning (Fig. 4C); as the trees age, competition increases, accounting for the increased variance of the provenance means and increase in QST. But the estimates of QST for both height and DBH, after increasing up to year 5 before the second thinning (Fig. 4), decreased after the removal in the second thinning of seventeen poor families, amounting to 123 trees, and 224 other inferior trees. Thinning in year 5 reduced the total number of trees from 948 to 601 and reduced the difference in performance between the best growing (Flores 2) and the other provenances (Fig. 4C, D). Most of the inbred material was presumably removed in the much heavier first thinning, which affected all families equally.
Theoretically, the differentiation of quantitative traits between populations (QST) and the differentiation at neutral marker loci between populations (FST) are equal in the absence of selection (Latta, 1998). The difference between QST and FST is regarded as a measure of the influence of selection, natural or artificial. In our study, the effect of selection on DBH is estimated by the difference between QST at age 5 after selection (0.121 se 0.097) and FST at the same age (0.023 se 0.008). This is a small difference and of doubtful significance. The corresponding difference measuring the effect of selection on height was even smaller (0.088 - 0.023). In the study of Tripiana et al. (2007), QST estimates for height and DBH were up to eight times higher than FST and the differences were significant. The estimates for QST were based on unthinned field trial material at age 37 months. FST was estimated from a comparable material sampled from the natural range. The authors considered that natural selection adapting the populations to different altitudes was an important environmental factor responsible for the differences between QST and FST. In our study, the main selective force was artificial selection for the same traits in the same environment.
Our study was unusual in that microsatellite variation was used to estimate the degree of inbreeding and population structure after artificial selection in the course of the breeding programme. Important for practical breeding is that selective thinning, which reduced the number of trees to 14%, appears to have favoured heterozygosity in all provenances. Furthermore, artificial selection was effective in raising the performance of the poorer provenances while maintaining heterozygosity. The prospects for further breeding progress are bright, whether or not crosses are made among provenances.

36
4.2 Phenotypic correlation among growth characters and wood properties (II)
The main question addressed here was whether rapid tree growth can be combined with high cellulose content on a dry weight basis, as is desirable for the pulping industry; and if rapid growth is correlated with low lignin content. The high cost of cellulose and lignin determination limited the number of trees that could be investigated. Consequently the study focused on the five fastest and six slowest growing families in the progeny test.
The range of cellulose content in our material was 11.4% units, somewhat greater than the 7.4 % units reported for progeny trial material of E. nitens (Kube et al., 2001). The mean cellulose content for the fast-growing group of families, 40.0%, was significantly higher than that of the slow-growing group of families, 37.1% (Table 2, Paper II). Furthermore, there was a moderately strong and highly significant positive correlation (r = 0.58) between DBH and cellulose content (Fig. 5). The fast-growing and slow growing groups of families in our material mostly came from different provenances. The differences in mean cellulose content among provenances were statistically significant by ANOVA.
Mean lignin contents of the two groups did not differ significantly. Nor did we find a significant negative correlation between lignin content and cellulose content, as has been reported for E. globulus, where the phenotypic correlation among individuals for Klason lignin and cellulose contents was -0.401 and the correlation for family means was -0.592, in both cases highly significant (Poke et al., 2006). Wood basic density (DEN) was significantly lower in the fast-growing group, 0.506 g cm-3, than in the slow growing group 0.535 g cm-3, and was significantly negatively correlated phenotypically, r = -0.50, with diameter at breast height.
The conclusion based on phenotypic correlations is that there is no obstacle to combining high growth rate with high cellulose content, for plantation of forests intended mainly for pulpwood. Rapid growth rate, being correlated phenotypically with reduced DEN, may be less suitable for other E. urophylla uses such as construction and furniture. Conclusions based on genotypic correlations are preferable in principle, but it is not always practicable to carry out a trial on a sufficient scale to obtain significance for moderate genetic correlations.

37
0 10 20 30 40 503031323334353637383940414243444546
Slow-growing
Fast-growing
DBH (cm)
% C
ellu
lose
Figure 5. Correlation of cellulose content with DBH at age 10 years. Cellulose content (% dry
weight) measured on 1 g samples. Open symbols: trees from the fast-growing families. Solid
symbols: trees from the slow-growing families. The phenotypic correlation r = 0.58, P =
0.0003.
4.3 Cellulose content as a selection trait (III)
The first aim here was to investigate whether cellulose content, measured by the relatively simple and inexpensive diglyme-HCl method, is sufficiently well correlated with kraft pulp yield to be used as a selection trait in breeding programmes for E. urophylla. The second aim was to measure heritability and genetic correlations between wood property traits and growth traits. We compared estimates of cellulose content based on small non-destructive 1 g samples of increment cores with estimates based on samples from narrow sectors cut from 10 cm discs of 20 felled trees. The cellulose estimates were correlated with pulp yields from 500 g of broad sectors of the discs.
The regression of pulp yield on cellulose content of disk samples was strong (R2 = 0.83, p<0.001) (Figure 1a, Paper III). The regression for pulp yield on cellulose content of core samples was somewhat weaker (R2 = 0.69, p<0.001) (Figure 1b, Paper III), so that the prediction of pulp yield will be somewhat less accurate if it is based on increment core cellulose. However,

38
the two regression equations had very similar slopes (bdisk= 0.76 and bcore= 0.73), and the difference between the intercepts was 3.6%, arising from slightly different mean cellulose content of cores and disks (3.8%) (Figure 1, paper III). The regression of cellulose content of core samples on cellulose content of disk samples was also strong (R2 = 0.81, p<0.001), and both gave high repeatability. The results suggest that cellulose content of cores determined using the diglyme-HCl method should be useful for ranking trees for breeding for kraft pulp yield in E. urophylla.
The genetic control of cellulose content and the genetic relationship between cellulose content, wood density and growth traits were determined with larger samples of 62 families (275 trees). Cellulose content and wood density had heritabilities of 0.50 and 0.48, respectively, substantially higher than the heritabilities of the growth traits, which ranged from 0.22 to 0.38 (Table 3, Paper III). Heritabilities of all traits had large standard errors which can be explained by the small sample size. Coefficients of additive genetic variation of cellulose content and wood density were 3.9 and 5.6%, respectively, lower than those estimated for growth traits (7.8-30.8%). There were no significant differences either between provenances, or between islands, for any of the traits examined in this study (Table 3, Paper III). Genetic correlations between cellulose content and growth, and between cellulose content and wood density had high standard errors and were not significantly different from zero (Table 4, Paper III). Environmental correlations between cellulose content and growth were moderately positive (0.25 to 0.53); and weak to moderate but negative between wood density and other traits (-0.02 to -0.47) (Table 4, Paper III).
Genetic correlations between cellulose content and growth or wood density were weak and non-significant in the present study. This information might suggest that independent selection for any of these traits would have minor effects on the other traits. However, the conclusion should be interpreted with caution as the standard errors were large, indicating the need for a bigger sample, with more families and trees per family.
4.4 Expression levels of cellulose and lignin synthesis genes (IV)
We have analysed the expression levels of genes encoding enzymes of cellulose and lignin synthesis in tangential scrapes of developing xylem tissue from eight-year-old trees taken at the end of June. The scrapes included cells

39
in the expanding and elongating phases and the beginning of secondary wall formation, corresponding to zones B, C and D described for poplar (Sjödin et al., 2009). In addition to developing tracheary elements the scrapes contained axial and ray parenchyma cells lacking secondary walls in which cellulose synthases active in the primary wall are expected to be abundant. In our material the genes EuCesA4 and EuCesA5, encoding cellulose synthases active in the primary wall on the basis of data from homologues in Arabidopsis, were more highly expressed than the genes encoding cellulose synthases active in the secondary wall, EuCesA1, EuCesA2 and EuCesA3 (Table 2, Paper IV). This is unlike what Ranik & Myburg (2006) found for immature and particularly mature xylem material of four-year old E. grandis trees growing in South Africa. In contrast, our results are consistent with those reported for zone B, C and D in xylem of Populus in PopGeneIE (Sjödin et al., 2009). The EuCAD2 gene, required for lignin synthesis, showed relatively high activity (Table 2, Paper IV), as expected for immature tracheary elements still undergoing lignification.
Our results showed that the expression (transcript abundance) of all the genes except EuCesA6 was higher in the fast-growing than the slow-growing groups of families (Table 2, Paper IV) and this difference was significant for EuCesA4 (P = 0.047), suggest that rapid growth is associated with high expression of genes of cell wall synthesis. The EuCesA4 expression showed a moderately strong and significant correlation with the expression of EuCesA5 (Table 3, paper IV). This is consistent with the corresponding proteins working together in the rosettes that synthesize the cellulose fibers of the primary cell wall (Ranik & Myburg, 2006). EuCesA5 expression is also significantly correlated with that of EuCesA6, where the corresponding protein in Arabidopsis is active in the primary cell wall. Co-expression of CesA genes acting together in primary or secondary cell walls has been reported previously, e.g. in the primary cell walls of Hordeum vulgare (Burton et al., 2004) and the secondary cell walls of Arabidopsis (Taylor et al., 2003).
The expressions of the two genes of lignin synthesis, EuCCR and EuCAD2, were strongly correlated (Table 3, Paper IV). This was expected as the genes of lignin synthesis have previously been found to be co-expressed in Picea abies (Wadenback et al., 2008) and in (E. grandis x E. globulus) x E. grandis (Kirst et al., 2004). EuCCR expression was considerably lower, about one third, that of EuCAD2. This is consistent with previous work, suggesting that CCR is a rate-limiting enzyme that regulates lignin content in Nicotiana tabacum and Arabidopsis (Goujon et al., 2003; Piquemal et al., 1998).

40
4.5 Correlation of gene expression with phenotypic traits (IV)
The aims in this study were to correlate the expression of genes of
cellulose and lignin synthesis with cellulose and lignin content and with growth traits, as a first step to finding genetic markers for early selection. In the previous section (4.2), the correlation between wood properties and growth traits (diameter at breast height and total height) was reported. The results showed that cellulose content is phenotypically correlated with DBH and significantly higher in the trees of the fast-growing than the slow growing families (Paper II). It was of interest to find whether rapid growth is correlated with high activity of at least one gene of cellulose synthesis.
In the gene expression studies, we found that the strongest of the correlations of gene expression with the phenotypic traits DBH, DEN, cellulose content and lignin content (Table 2) is that between EuCesA4 expression and cellulose content (r = 0.51, P = 0.011). The expressions of the other EuCesA genes were weakly and non-significantly correlated with cellulose content. This may partly reflect that EuCesA4 was the most strongly expressed of the genes examined and more accurately measured (Table 2). But EuCesA4 expression may be in some degree a regulator of cellulose synthesis in the primary cell wall via co-ordinate synthesis of the other proteins of the rosette. A regulator of primary cell wall synthesis is strategically placed to regulate secondary cell wall synthesis as well. In hybrid aspen (P. tremula L. x P. tremuloides), over-expression of PttEXPA1 (an abundant α-expansing of wood-forming tissues) in primary and secondary cell walls resulted in an increase in stem internode elongation and leaf expansion, and larger cell sizes in the leaf epidermis (Gray-Mitsumune et al., 2008).

41
Table 2. Correlation coefficients (r) among gene expression levels and growth and wood properties. Significant correlations are presented in bold. DBH = diameter at breast height; DEN = wood basic density. The correlations are based on 22-25 samples.
4.6 Nucleotide polymorphisms in EucesA4 gene (IV)
Since EuCesA4 may have potential in MAS, we made a preliminary search for polymorphisms at the 5-prime end of the gene where SNPs can influence expression even when they are in introns or the 5’UTR rather than in coding regions (Li et al., 2010). In the 2 kb sequence we found an overall polymorphism density of 23 per kb, i.e. one every 43 bp. Our sequences comprised 40 single nucleotide polymorphisms (SNPs), two dinucleotide polymorphisms, one simple sequence repeat (SSR) and two complex motive polymorphisms. Of the SNPs, 36 were located in introns, seven in the 5’ UTR and two in coding sequences (synonymous changes).
This can be compared with the SNP densities found for 23 genes of secondary metabolism in other eucalypts: one in every 33 bp in E. nitens, 31 bp in E. globulus, 16 bp in E. camaldulensis and 17 bp in E. loxophleba (Kulheim et al., 2009). For a 3.3 kb sequence of the CCR gene in E. globulus the SNP density was one in every 94 bp (Thumma et al., 2005). For 313 human genes, the polymorphism density was considerably lower, one every 185 bp (Stephens et al., 2001).
Gene DBH DEN Cellulose
content Lignin content
EuCesA1 r = 0.41,
P = 0.036
r = 0.23 r = - 0.15 r = 0.21
EuCesA4 r = 0.33 r = -0.14 r = 0.51,
P = 0.011
r = -0.22
EuCesA5 r = 0.28 r = -0.48,
P = 0.023
r = 0.02 r = 0.20
EuCesA6 r = 0.01 r = -0.29 r = 0.15 r = 0.38
EuCCR r = 0.11 r = 0.05 r = 0.40 r = 0.03
EuCAD2 r = 0.43,
P = 0.038
r = 0.18 r = 0.41 r = 0.02

42

43
5 Conclusions and implications for tree breeding
The results presented in this thesis led to the following conclusions and implications for tree breeding of Eucalyptus urophylla: 1. The inbreeding coefficients (FIS) after the two thinnings, estimated from
microsatellite variation, were relatively low for all the provenances studied (average 0.137). Inbreeding resulting from selection during thinning does not appear to be a problem. The genetic differentiation (FST) among the provenances was also low (0.023 S.E. 0.008), consistent with the implications from other studies that long distance movement of pollen has slowed down the genetic divergence of the provenances. There is no immediate case for making crosses among provenances to reduce inbreeding or to exploit genetic variation.
2. Estimates of the quantitative genetic differentiation, QST, for the growth traits were low over the trial’s first eight years, the highest value being 0.169 S.E. 0.098 for DBH before the second thinning in year 5. After the second thinning, the QST values were 0.088 and 0.121 for height and DBH, respectively. It appears that whereas the main effect of the first thinning, where there was no family selection, was to favour heterozygous material within all provenances, the second thinning favoured only the best families irrespective of provenance. This tended to equalize the performance of the provenances, while maintaining heterozygosity. A consequence was that the differences between QST and FST were small and of doubtful significance. A general conclusion is that the molecular and QST data support the strategy of the breeding programme, i.e. improving objective traits while maintaining genetic variation.

44
3. Cellulose content determined non-destructively from increment cores by the diglyme-HCl method is strongly correlated with pulp yield. This facilitates selection for an important objective trait. Data from phenotypic and genetic correlations indicate that phenotypic selection for growth can readily be combined with high cellulose content in the breeding program. Selection for a particular wood trait has at most minor effects on the other traits for E. urophylla in Vietnam.
4. Since cellulose content is strongly correlated with pulp yield, genes regulating cellulose synthesis are of special interest. Therefore we examined the expression of CesA genes in scrapes of developing secondary xylem sampled from trees of fast growing and slow growing families. Interestingly, the expression of EuCesA4, which encodes a protein active in the primary cell wall, was significantly higher in the fast growing group and was correlated with cellulose content (r = 0.51, P = 0.011). EuCesA4 expression in scrapes is a potential non-destructive marker of cellulose content.
5. It is also possible that the gene can be used in MAS, as we found extensive nucleotide polymorphism in a 2 kb region of the gene at the 5’-prime end. A next step is to correlate nucleotide polymorphisms with CesA4 expression and cellulose content.

45
6 Future perspectives
The studies of microsatellite variation within and among the provenances
in the first cycle of selection of the breeding programme should be followed up in the succeeding stages. The extent of inbreeding in the selected progenies is of continued interest. Other straight-forward applications of microsatellite variation include checking on paternity.
Mass sequencing technologies are developing rapidly and are being applied to Eucalyptus genomics (Grattapaglia & Kirst, 2008). It is becoming feasible to sequence the entire genomes of hundreds of individuals. At the highest level of ambition, an aim is to identify most of the SNPs correlated with objective traits, by methods such as association genetics. Although full of problems, it likely that this approach, in the first place with other species of Eucalyptus, will yield some genetic markers for early selection that can be tested for application to E. urophylla breeding. These may include variants of CesA4 or other genes, including transcription factors, related to cellulose synthesis.
Transgenic plants are valuable for studying the effects of up- or down-regulating the activity of particular gene. In eucalypts there are often difficulties in regenerating transgenic plants. An alternative procedure for studying down-regulation of gene expression is the antisense deoxynucleotide technique (Sun et al., 2005). The effect of down-regulating particular EuCesA genes on the expression of other genes of cellulose synthesis can be conveniently studied by this method in young seedlings.

46

47
References
Agrama, H.A., George, T.L. & Salah, S.F. (2002). Construction of genome
map for Eucalyptus camaldulensis DEHN. Silvae Genetica 51(5-6), 201-206.
Ahuja, M.R. & Neale, D.B. (2005). Evolution of genome size in conifers. Silvae Genetica 54(3), 126-137.
Apiolaza, L.A., Raymond, C.A. & Yeo, B.J. (2005). Genetic variation of physical and chemical wood properties of Eucalyptus globulus. Silvae Genet 54(4-5), 160-166.
Arabidopsis Genome Initiative (2000). Analysis of the genome sequence of the flowering plant Arabidopsis thaliana. Nature (London) 408(6814), 796-815.
Arioli, T., Peng, L.C., Betzner, A.S., Burn, J., Wittke, W., Herth, W., Camilleri, C., Hofte, H., Plazinski, J., Birch, R., Cork, A., Glover, J., Redmond, J. & Williamson, R.E. (1998). Molecular analysis of cellulose biosynthesis in Arabidopsis. Science 279(5351), 717-720.
Azevedo, H., Lino-Neto, T. & Tavares, R.M. (2003). An Improved Method for High-Quality RNA Isolation From Needles of Adult Maritime Pine Trees. Plant Molecular Biology Reporter 21(4), 333–338.
Berlin, M. (2009). Development of economic forest tree breeding objectives. Acta Univ. Agric. Sueciae 2009: 90. SLU, Uppsala. 35 pp. ISBN 978-91-576-7437-1 Doctoral Thesis.
Bessueille, L. & Bulone, V. (2008). A survey of cellulose biosynthesis in higher plants. Japanese Social Plant Cell & Molecular Biology, 315-322.
Boerjan, W., Ralph, J. & Baucher, M. (2003). Lignin biosynthesis. Annu Rev Plant Biol 54, 519-546.
Boiffin, V., Hodges, M., Galvez, S., Balestrini, R., Bonfante, P., Gadal, P. & Martin, F. (1998). Eucalypt NADP-dependent isocitrate dehydrogenase - cDNA cloning and expression in ectomycorrhizae. Plant Physiology 117(3), 939-948.

48
Borralho, N.M.G., Kanowski, P.J. & Cotterill, P.P. (1992). Genetic control of growth of Eucalyptus globulus in Portugal. 1. Genetic and Phenotypic parameters. Silvae Genetica 41(1), 39-45.
Brondani, R.P.V., Williams, E.R., Brondani, C. & Grattapaglia, D. (2006). A microsatellite-based consensus linkage map for species of Eucalyptus and a novel set of 230 microsatellite markers for the genus. Bmc Plant Biology 6(20), doi:10.1186/1471-2229-6-20.
Brooker, M.I.H. (2000). A new classification of the genus Eucalyptus L'Her. (Myrtaceae). Australian Systematic Botany 13(1), 79-148.
Buchanan, B.B., Gruissem, W. & Jones, R. (2000). Biochemistry & molecular biology of plants. ISBN 978-0-943088-39-6.
Bundock, P.C., Potts, B.M. & Vaillancourt, R.E. (2008). Detection and stability of quantitative trait loci (QTL) in Eucalyptus globulus. Tree Genetics & Genomes 4(1), 85-95.
Burton, R.A., Shirley, N.J., King, B.J., Harvey, A.J. & Fincher, G.B. (2004). The CesA gene family of barley. Quantitative analysis of transcripts reveals two groups of co-expressed genes. Plant Physiology 134(1), 224-236.
Byrne, M., Murrell, J.C., Owen, J.V., Kriedemann, P., Williams, E.R. & Moran, G.F. (1997a). Identification and mode of action of quantitative trait loci affecting seedling height and leaf area in Eucalyptus nitens. Theoretical and Applied Genetics 94(5), 674-681.
Byrne, M., Murrell, J.C., Owen, J.V., Williams, E.R. & Moran, G.F. (1997b). Mapping of quantitative trait loci influencing frost tolerance in Eucalyptus nitens. Theoretical and Applied Genetics 95(5-6), 975-979.
Cervera, M.T., Remington, D., Frigerio, J.M., Storme, V., Ivens, B., Boerjan, W. & Plomion, C. (2000). Improved AFLP analysis of tree species. Canadian Journal of Forest Research-Revue Canadienne De Recherche Forestiere 30(10), 1608-1616.
Chaix, G., Gerber, S., Razafimaharo, V., Vigneron, P., Verhaegen, D. & Hamon, S. (2003). Gene flow estimation with microsatellites in a Malagasy seed orchard of Eucalyptus grandis. Theoretical and Applied Genetics 107(4), 705-712.
Cupertino, F.B., Leal, J.B., Vidal, P.O. & Gaiotto, F.A. (2009). Parentage testing of hybrid full-sib families of Eucalyptus with microsatellites. Scandinavian Journal of Forest Research 24(1), 2-7.
Déjardin, A., Lauransa, F., Arnaud, D., Bretona, C., Pilatea, G. & Lepléa, J.C. (2010). Wood formation in Angiosperms. Comptes Rendus Biologies 333(4), 325-334.
Desprez, T., Juraniec, M., Crowell, E.F., Jouy, H., Pochylova, Z., Parcy, F., Hofte, H., Gonneau, M. & Vernhettes, S. (2007). Organization of cellulose synthase complexes involved in primary cell wall synthesis in Arabidopsis thaliana. Proceedings of the National Academy of Sciences of the United States of America 104(39), 15572-15577.

49
Djerbi, S., Lindskog, M., Arvestad, L., Sterky, F. & Teeri, T.T. (2005). The genome sequence of black cottonwood (Populus trichocarpa) reveals 18 conserved cellulose synthase (CesA) genes. Planta 221(5), 739-746.
Doblin, M.S., Kurek, I., Jacob-Wilk, D. & P., D.D. (2002). Cellulose biosynthesis in plants: from genes to rosettes. Plant Cell Physiol. 43(12), 1407-1420.
Du, J. & Groover, A. (2010). Transcriptional Regulation of Secondary Growth and Wood Formation. Journal of Integrative Plant Biology 52(1), 17-27.
Eldridge, K., Davidson, J., Harwood, C. & Van Wyk, G. (1993). Eucalypt Domestication and Breeding: Oxford University Press, Oxford, England. ISBN 0-19-854866-4.
Eldridge, K.G. & Griffin, A.R. (1983). Selfing effects in Eucalyptus regnans. Silvae Genetica 32(5-6), 216-221.
Eriksson, G., Ekberg, I. & Clapham, D. (2006). An introduction to Forest Genetics (second edition). ISBN 91-576-7190-7.
Evert, R.F. (2006). Esau’s Plant Anatomy. Meristems, Cells, and Tissues of the Plant Body: Their Structure, Function, and Development. 3rd Edition. ed: John Wiley and Sons, Inc., Hoboken, New Jersey. ISBN 978-0-471-73843-5.
Excoffier, L., Laval, G. & Schneider, S. (2005). Arlequin ver. 3.0: An integrated software package for population genetics data analysis. Evolutionary Bioinformatics Online 1, 47-50.
FAO (2009). State of the World's Forest. Food and Agriculture Organization of the United Nations.
Freeman, J.S., Whittock, S.P., Potts, B.M. & Vaillancourt, R.E. (2009). QTL influencing growth and wood properties in Eucalyptus globulus. Tree Genetics & Genomes 5(4), 713-722.
Gaiotto, F.A., Bramucci, M. & Grattapaglia, D. (1997). Estimation of outcrossing rate in a breeding population of Eucalyptus urophylla with dominant RAPD and AFLP markers. Theoretical and Applied Genetics 95(5-6), 842-849.
Gawel, N.J. & Jarret, R.L. (1991). A modified CTAB DNA extraction procedure for Musa and Ipomoea. Plant Molecular Biology Reporter 9(3), 262-266.
Gilmour, A.R., Gogel, B.J., Cullis, B.R., Welham, S.J. & Thompson, R. (2006). ASReml user guide release 2.0. VSN International Ltd, Hemel Hempstead, 320 p.
Gonzalez-Martinez, S.C., Huber, D., Ersoz, E., Davis, J.M. & Neale, D.B. (2008). Association genetics in Pinus taeda L. II. Carbon isotope discrimination. Heredity 101(1), 19-26.
Gonzalez-Martinez, S.C., Wheeler, N.C., Ersoz, E., Nelson, C.D. & Neale, D.B. (2007). Association genetics in Pinus taeda L. I. Wood property traits. Genetics 175(1), 399-409.

50
Goudet, J. (2001). FSTAT, a Program to Estimate and Test Gene Diversities and Fixation Indices Version 2.9.3. . Available from http://www2.unil.ch/popgen/softwares/fstat.htm.
Goujon, T., Sibout, R., Eudes, A., MacKay, J. & Jouanin, L. (2003). Genes involved in the biosynthesis of lignin precursors in Arabidopsis thaliana. Plant Physiol Biochem 41(8), 677-687.
Grattapaglia, D., Bertolucci, F.L. & Sederoff, R.R. (1995). Genetic mapping of QTLs controlling vegetative propagation in Eucalyptus grandis & E. urophylla using a pseudo-testcross strategy & RAPD markers. Theoretical and Applied Genetics 90(7-8), 933-947.
Grattapaglia, D., Bertolucci, F.L.G., Penchel, R. & Sederoff, R.R. (1996). Genetic mapping of quantitative trait loci controlling growth and wood quality traits in Eucalyptus grandis using a maternal half-sib family and RAPD markers. Genetics 144(3), 1205-1214.
Grattapaglia, D. & Bradshaw, H.D. (1994). Nuclear DNA content of commercially important Eucalyptus species and hybrids. Canadian Journal of Forest Research 24(5), 1074-1078.
Grattapaglia, D. & Kirst, M. (2008). Eucalyptus applied genomics: from gene sequences to breeding tools. New phytologist 179(4), 911-929.
Grattapaglia, D. & Sederoff, R. (1994). Genetic linkage maps of Eucalyptus grandis and Eucalyptus urophylla using a pseudo-testcross: mapping strategy and RAPD markers. Genetics 137, 1121-1137.
Gray-Mitsumune, M., Blomquist, K., McQueen-Mason, S., Teeri, T.T., Sundberg, B. & Mellerowicz, E.J. (2008). Ectopic expression of a wood-abundant expansin PttEXPA1 promotes cell expansion in primary and secondary tissues in aspen. Plant Biotechnology Journal 6(1), 62-72.
Grimapettenati, J., Feuillet, C., Goffner, D., Borderies, G. & Boudet, A.M. (1993). Molecular cloning and expression of a Eucalyptus gunnii cDNA clone encoding cinnamyl alcohol dehydrogenase. Plant Molecular Biology 21(6), 1085-1095.
Groover, A., Devey, M., Fiddler, T., Lee, J., Megraw, R., Mitchelolds, T., Sherman, B., Vujcic, S., Williams, C. & Neale, D. (1994). Identification of quantitative trait loci influencing wood specific-gravity in an outbred pedigree of loblolly pine. Genetics 138(4), 1293-1300.
Halpin, C. (2004). Investigating and manipulating lignin biosynthesis in the postgenomic era. Adv Bot Res 41, 63-106.
Hamilton, M.G. & Potts, B.M. (2008). Eucalyptus nitens genetic parameters. New Zealand Journal of Forestry Science 38(1), 102-119.
Hardner, C.M. & Potts, B.M. (1995). Inbreeding depression and changes in variation after selfing in Eucalyptus globulus spp. globulus Silvae Genetica 44(1), 46-54.
Henery, M.L., Moran, G.F., Wallis, I.R. & Foley, W.J. (2007). Identification of quantitative trait loci influencing foliar concentrations

51
of terpenes and formylated phloroglucinol compounds in Eucalyptus nitens. New phytologist 176(1), 82-95.
House, A.P.N. & Bell, J.C. (1994). Isozyme variation and mating system in Eucalyptus urophylla ST. Blake. Silvae Genetica 43(2-3), 167-179.
Iglesias-Trabado, G. & Wilstermann, D. (2008). Eucalyptus universalis. Global cultivated eucalypt forests map 2008 Version 1.0.1 In GIT Forestry Consulting’s EUCALYPTOLOGICS: Information resources on Eucalyptus cultivation worldwide. . Retrieved from <http://www.gif-forestry.com> [Mar 29th 2009].
Iiyama, K. & Wallis, A.F.A. (1988). An improved acetyl bromide procedure for determining lignin in woods and wood pulps. Wood Sci Technol 22, 271-208.
Keegstra, K. & Raikhel, N. (2001). Plant glycosyltransferases. Current Opinion in Plant Biology 4(3), 219-224.
Kha, L.D., Thinh, H.H. & Cuong, N.V. (2003). Improvement of eucalypts for reforestation in Vietnam. In: Turnbull, J.W.E. (Ed.) Proceedings of Eucalypts in Asia Zhanjiang, Guangdong, People’s Republic of China, 7-11 April 2003. pp. 71-81: Australian Centre for International Agricultural Research, GPO Box 1571, Canberra, ACT 2601. ISBN 1-86320-392-3.
Kien, N.D. (2009). Improvement of Eucalyptus plantations grown for pulp production. Acta Univ. Agric. Sueciae SLU, Uppsala. 2009: 53. 41 pp. ISBN 978-91-576-7400-5 Doctoral Thesis.
Kien, N.D., Jansson, G., Harwood, C. & Thinh, H.H. (2009). Genetic control of growth and form in Eucalyptus urophylla S. T. Blake in northern Vietnam. J Trop For Sci 21(1), 50-65.
Kirst, M., Myburg, A.A., De Leon, J.P.G., Kirst, M.E., Scott, J. & Sederoff, R. (2004). Coordinated genetic regulation of growth and lignin revealed by quantitative trait locus analysis of cDNA microarray data in an interspecific backcross of eucalyptus. Plant Physiol 135(4), 2368-2378.
Kube, P.D., Raymond, C.A. & Banham, P.W. (2001). Genetic parameters for diameter, basic density, cellulose content and fibre properties for Eucalyptus nitens. For Genet 8(4), 285-294.
Kulheim, C., Yeoh, S.H., Maintz, J., Foley, W.J. & Moran, G.F. (2009). Comparative SNP diversity among four Eucalyptus species for genes from secondary metabolite biosynthetic pathways. Bmc Genomics 10.
Lacombe, E., Hawkins, S., VanDoorsselaere, J., Piquemal, J., Goffner, D., Poeydomenge, O., Boudet, A.M. & GrimaPettenati, J. (1997). Cinnamoyl CoA reductase, the first committed enzyme of the lignin branch biosynthetic pathway: Cloning, expression and phylogenetic relationships. Plant Journal 11(3), 429-441.
Latta, R.G. (1998). Differentiation of allelic frequencies at quantitative trait loci affecting locally adaptive traits. American Naturalist 151(3), 283-292.

52
Leksono, B., Kurinobu, S. & Ide, Y. (2008). Realized genetic gains observed in second generation seedling seed orchards of Eucalyptus pellita in Indonesia. Journal of Forest Research 13(2), 110-116.
Lerouxel, O., Cavalier, D.M., Liepman, A.H. & Keegstra, K. (2006). Biosynthesis of plant cell wall polysaccharides - a complex process. Current Opinion in Plant Biology 9(6), 621-630.
Li, W., Li, H., Wu, H. & Chen, X.Y. (2010). Use of chromosome walking in discovery of single nucleotide polymorphism in noncoding regions of a candidate actin gene in Pinus radiata. Journal of Applied Genetics 51(3), 275-281.
Lloyd, C. & Chan, J. (2008). The parallel lives of microtubules and cellulose microfibrils. Current Opinion in Plant Biology 11(6), 641-646.
Lu, S.F., Li, L.G., Yi, X.P., Joshi, C.P. & Chiang, V.L. (2008). Differential expression of three eucalyptus secondary cell wall-related cellulose synthase genes in response to tension stress. Journal of Experimental Botany 59(3), 681-695.
Marco, M. & White, T.L. (2002). Genetic parameter estimates and genetic gains for Eucalyptus grandis and E. dunnii in Argentina. Forest Genetics 9(3), 205-215.
Marques, C.M., Vasquez-Kool, J., Carocha, V.J., Ferreira, J.G., O'Malley, D.M., Liu, B.H. & Sederoff, R. (1999). Genetic dissection of vegetative propagation traits in Eucalyptus tereticornis and E. globulus. Theoretical and Applied Genetics 99(6), 936-946.
Missiaggia, A.A., Piacezzi, A.L. & Grattapaglia, D. (2005). Genetic mapping of Eef1, a major effect QTL for early flowering in Eucalyptus grandis. Tree Genetics & Genomes 1(2), 79-84.
Moran, G.F., Bell, J.C. & Griffin, A.R. (1989). Reduction in levels of inbreeding in a seed orchard of Eucalyptus regnans F. Muell, compared with natural populations. Silave Genetica 38, 32-36.
Nairn, C.J. & Haselkorn, T. (2005). Three loblolly pine CesA genes expressed in developing xylem are orthologous to secondary cell wall CesA genes of angiosperms. New phytologist 166(3), 907-915.
Neale, D.B. & Savolainen, O. (2004). Association genetics of complex traits in conifers. Trends in Plant Science 9(7), 325-330.
Newcombe, G. & Bradshaw, H.D. (1996). Quantitative trait loci conferring resistance in hybrid poplar to Septoria populicola, the cause of leaf spot. Canadian Journal of Forest Research-Revue Canadienne De Recherche Forestiere 26(11), 1943-1950.
Olesen, P.O. (1971). Water displacement method. A fast and accurate method to determine green volume of wood samples. For Tree Improv 3, 1-23.
Paradez, A., Wright, A. & Ehrhardt, D.W. (2006). Microtubule cortical array organization and plant cell morphogenesis. Current Opinion in Plant Biology 9(6), 571-578.

53
Paux, E., Carocha, V., Marques, C., de Sousa, A.M., Borralho, N., Sivadon, P. & Grima-Pettenati, J. (2005). Transcript profiling of Eucalyptus xylem genes during tension wood formation. New phytologist 167(1), 89-100.
Payn, K.G., Dvorak, W.S., Janse, B.J.H. & Myburg, A.A. (2008). Microsatellite diversity and genetic structure of the commercially important tropical tree species Eucalyptus urophylla, endemic to seven islands in eastern Indonesia. Tree Genetics & Genomes 4(3), 519-530.
Peakall, R. & Smouse, P.E. (2006). GENALEX 6: genetic analysis in Excel. Population genetic software for teaching and research. Molecular Ecology Notes 6(1), 288-295.
Piquemal, J., Lapierre, C., Myton, K., O'Connell, A., Schuch, W., Grima-Pettenati, J. & Boudet, A.M. (1998). Down-regulation of cinnamoyl-CoA reductase induces significant changes of lignin profiles in transgenic tobacco plants. Plant Journal 13(1), 71-83.
Plomion, C., Leprovost, G. & Stokes, A. (2001). Wood formation in trees. Plant Physiology 127(4), 1513-1523.
PM (2006). Vietnam Forestry Development Strategy (2006-2020). Poke, F.S., Potts, P.M., Vaillancourt, R.E. & Raymond, C.A. (2006).
Genetic parameters for lignin, extractive and decay in Eucalyptus globus. Ann For Sci 63(9), 813-821.
Poke, F.S., Vaillancourt, R.E., Potts, B.M. & Reid, J.B. (2005). Genomic research in Eucalyptus. Genetica 125(1), 79-101.
Ranik, M. & Myburg, A.A. (2006). Six new cellulose synthase genes from Eucalyptus are associated with primary and secondary cell wall biosynthesis. Tree Physiology 26(5), 545-556.
Raymond, C.A. & Muneri, A. (2001). Nondestructive sampling of Eucalyptus globulus and E-nitens for wood properties. I. Basic density. Wood science and technology 35(1-2), 27-39.
Raymond, C.A. & Schimleck, L.R. (2002). Development of near infrared reflectance analysis calibration for estimating genetic parameters for cellulose content in Eucalyptus globulus. Can J For Res 32(6), 170-176.
Rodrigues, J., Faix, O. & Pereira, H. (1999). Improvement of the acetyl bromide method for lignin determination within large scale screening programmes. Holz Roh-Werkstoff 57, 341-345.
Rogers, L.A. & Campbell, M.M.C. (2004). The genetic control of lignin deposition during plant growth and development. New Phyto 164(1), 17-30.
Rousset, F. (2008). GENEPOP ' 007: a complete re-implementation of the GENEPOP software for Windows and Linux. Molecular Ecology Resources 8(1), 103-106.
SAS Institute (2004). SAS/STAT® 9.1 User's Guide. SAS institute Inc., Cary, N.C.
54
Saxena, I.M., Lin, F.C. & Brown, J.R.M. (1990). Cloning and sequencing of the cellulose synthase catalytic subunit gene of Acetobacter xylinum. Plant Mol Biol 15, 673-683.
Shrader, J., Nilsson, J., Mellerowicz, E., Berglund, A., Nilsson, P., Hertzberg, M. & Sandberg, G. (2004). A high-resolution transcript profile across the wood-forming meristem of poplar identifies potential regulators of cambial stem cell identity. Plant Cell Physiol. 16, 2278-2292.
Sjödin, A., Street, N.R., Sandberg, G., Gustafsson, P. & Jansson, S. (2009). The Populus Genome Integrative Explorer (PopGenIE): a new resource for exploring the Populus genome. New phytologist 182(4), 1013-1025.
Smith, A.M., Coupland, G., Dolan, L., Harberd, N., Jones, J., Martin, C., Sablowski, R. & Amey, A. (2010). Plant Biology: Garland Science, Taylor and Francis Group, LLC. ISBN 978-0-8153-4025-6.
Smook, G.A. (1992). Handbook for pulp and paper technologists. TAPPI Press, 419 p.
Stephens, J.C., Schneider, J.A., Tanguay, D.A., Choi, J., Acharya, T., Stanley, S.E., Jiang, R.H., Messer, C.J., Chew, A., Han, J.H., Duan, J.C., Carr, J.L., Lee, M.S., Koshy, B., Kumar, A.M., Zhang, G., Newell, W.R., Windemuth, A., Xu, C.B., Kalbfleisch, T.S., Shaner, S.L., Arnold, K., Schulz, V., Drysdale, C.M., Nandabalan, K., Judson, R.S., Ruano, G. & Vovis, G.F. (2001). Haplotype variation and linkage disequilibrium in 313 human genes. Science 293(5529), 489-493.
Sun, C.X., Hoglund, A.S., Olsson, H., Mangelsen, E. & Jansson, C. (2005). Antisense oligodeoxynucleotide inhibition as a potent strategy in plant biology: identification of SUSIBA2 as a transcriptional activator in plant sugar signalling. Plant Journal 44(1), 128-138.
Tanaka, K., Murata, K., Yamazaki, M., Onosato, K., Miyao, A. & Hirochika, H. (2003). Three distinct rice cellulose synthase catalytic subunit genes required for cellulose synthesis in the secondary wall. Plant Physiology 133(1), 73-83.
Tauer, C.G., Hallgren, S.W. & Martin, B. (1992). Using marker-aided selection to improve tree growth response to abiotic stress. Canadian Journal of Forest Research-Revue Canadienne De Recherche Forestiere 22(7), 1018-1030.
Taylor, N.G., Howells, R.M., Huttly, A.K., Vickers, K. & Turner, S.R. (2003). Interactions among three distinct CesA proteins essential for cellulose synthesis. Proceedings of the National Academy of Sciences of the United States of America 100(3), 1450-1455.
Taylor, N.G., Laurie, S. & Turner, S.R. (2000). Multiple cellulose synthase catalytic subunits are required for cellulose synthesis in Arabidopsis. Plant Cell 12(12), 2529-2539.

55
Thamarus, K., Groom, K., Bradley, A., Raymond, C.A., Schimleck, L.R., Williams, E.R. & Moran, G.F. (2004). Identification of quantitative trait loci for wood and fibre properties in two full-sib pedigrees of Eucalyptus globulus. Theoretical and Applied Genetics 109(4), 856-864.
Thumma, B.R., Nolan, M.R., Evans, R. & Moran, G.F. (2005). Polymorphisms in cinnamoyl CoA reductase (CCR) are associated with variation in microfibril angle in Eucalyptus spp. Genetics 171(3), 1257-1265.
Thumma, B.R., Southerton, S.G., Bell, J.C., Owen, J.V., Henery, M.L. & Moran, G.F. (2010). Quantitative trait locus (QTL) analysis of wood quality traits in Eucalyptus nitens. Tree Genetics and Genomes 6(2), 305-317.
TIGR Rice Genome Annotation (accessed 10 April 2010). [http://www.tigr.org/tdb/e2k1/osa1/data_download.shtml].
Tripiana, V., Bourgeois, M., Verhaegen, D., Vigneron, P. & Bouvet, J.M. (2007). Combining microsatellites, growth, and adaptive traits for managing in situ genetic resources of Eucalyptus urophylla. Canadian Journal of Forest Research-Revue Canadienne De Recherche Forestiere 37(4), 773-785.
Tuskan, G.A., DiFazio, S., Jansson, S., Bohlmann, J., Grigoriev, I., Hellsten, U., et al. (2006). The genome of black cottonwood, Populus trichocarpa (Torr. & Gray). Science 313(5793), 1596-1604.
Van Oosterhout, C., Hutchinson, W.F., Wills, D.P.M. & Shipley, P. (2004). MICRO-CHECKER: software for identifying and correcting genotyping errors in microsatellite data. Molecular Ecology Notes 4(3), 535-538.
Vanholme, R., Morreel, K., Ralph, J. & Boerjan, W. (2008). Lignin engineering. Current Opinion in Plant Biology 11(3), 278-285.
Verhaegen, D. & Plomion, C. (1996). Genetic mapping in Eucalyptus urophylla and Eucalyptus grandis using RAPD markers. Genome 39(6), 1051-1061.
Verhaegen, D., Plomion, C., Gion, J.M., Poitel, M., Costa, P. & Kremer, A. (1997). Quantitative trait dissection analysis in Eucalyptus using RAPD markers .1. Detection of QTL in interspecific hybrid progeny, stability of QTL expression across different ages. Theoretical and Applied Genetics 95(4), 597-608.
Vos, P., Hogers, R., Bleeker, M., Reijans, M., Vandelee, T., Hornes, M., Frijters, A., Pot, J., Peleman, J., Kuiper, M. & Zabeau, M. (1995). AFLP: a new technique for DNA fingerprinting. Nucleic Acids Research 23(21), 4407-4414.
Wadenback, J., von Arnold, S., Egertsdotter, U., Walter, M.H., Grima-Pettenati, J., Goffner, D., Gellerstedt, G., Gullion, T. & Clapham, D. (2008). Lignin biosynthesis in transgenic Norway spruce plants harboring an antisense construct for cinnamoyl CoA reductase (CCR). Transgenic Research 17(3), 379-392.
56
Wallis, A.F.A., Weame, R.H. & Wright, P.J. (1997). New approaches to the rapid analysis of cellulose in wood. Proceedings Intenational symbosium on wood and pulping chemistry. Montreal.
Weber, J.L. & May, P.E. (1989). Abundant class of human DNA polymorphisms which can be typed using the polymerase chain reaction. American Journal of Human Genetics 44(3), 388-396.
Welsh, J. & McClelland, M. (1990). Fingerprinting genomes using PCR with arbitrary primers. Nucleic Acids Research 18(24), 7213-7218.
White, T.L., Adams, W.T. & Neale, D.B. (2007). Forest genetics. CAB International, Wallingford.
Williams, J.G.K., Kubelik, A.R., Livak, K.J., Rafalski, J.A. & Tingey, S.V. (1990). DNA polymorphisms amplified by arbitrary primers are useful as genetic markers. Nucleic Acids Research 18(22), 6531-6535.
Wong, H.C., Fear, A.L., Calhoon, R.D., Eichinger, G.H., Mayer, R., Amikam, D., Benziman, M., Gelfand, D.H., Meade, J.H. & Emerick, A.W. (1990). Genetic organization of the cellulose synthase operon in Acetobacter xylinum. Proc. Natl. Acad. Sci. 87, 8130-8134.
Zelener, N., Poltri, S.N.M., Bartoloni, N., Lopez, C.R. & Hopp, H.E. (2005). Selection strategy for a seedling seed orchard design based on trait selection index and genomic analysis by molecular markers: a case study for Eucalyptus dunnii. Tree Physiol 25(11), 1457-1467.
Zhong, R.Q., Morrison, W.H., Freshour, G.D., Hahn, M.G. & Ye, Z.H. (2003). Expression of a mutant form of cellulose synthase AtCesA7 causes dominant negative effect on cellulose biosynthesis. Plant Physiology 132(2), 786-795.

57
Acknowledgments
It has been a long journey on board towards a PhD and it has been as rewarding and exciting as it has been difficult and frustrating many times. So let me take this opportunity to express my sincere gratitude to many of those that who have helped me on my way during the past years:
Associate Professor David Clapham, my main supervisor at the Department of Plant Biology and Forest Genetics, Swedish University of Agricultural Sciences, for all his valuable support and critical advice, and for his English corrections and useful comments, which were essential for me to accomplish this work. Special thanks for the way he taught and encouraged me to find solutions and improve myself. He has made me much more confident as a scientist and researcher. It was my great pleasure to study and conduct this work under his supervision.
Professor Sara von Arnold, my co-supervisor at the Department of Plant Biology and Forest Genetics, Swedish University of Agricultural Sciences, for effective comments and great suggestions helping me to complete this work. Special thanks for the way you pushed me to move onwards.
Professor Rod Griffin, my co-supervisor at the School of Plant Science, University of Tasmania, Australia, for his opinions and valuable comments on the manuscripts and thesis.
Professor Le Dinh Kha and Dr. Ha Huy Thinh, the former and current director, respectively, of the Research Centre for Forest Tree Improvement, Forest Science Institute of Vietnam, for their support and encouragement and for providing me the study site and materials for my PhD Project.
Associate Professor Gunnar Jansson for sharing knowledge on quantitative genetics and helping with the statistical analyses, with the SAS program in particular.
Prof. Gösta Eriksson, Prof. Jim Mattsson, Prof Ulf Lagercrantz, Dr Ann-Christin Rönnberg Wästljung, Dr Anna Westerbergh, Dr Niclas Gyllenstrand and Dr Lennart Norell gave valuable advices on the manuscripts.

58
During my PhD time, many people have been involved in practical work behind this thesis. My sincere thanks are due to Vuong, Lam, Luc, Thuy, Tung who helped me in the material collections and in the lab work; and Hai, Kien, Duong, Hung, Tung for collection of wood samples and measurement of wood properties.
My warm thanks go to the lecturers, researchers, staff and PhD students at our Department in the Genetic Centre for friendship and kindness during my time in Uppsala.
My friends in the Forest Genetics groups Andreas, Emma, Henrik, two Daniels, Malin, Aliona and close friends in the VBSG as well Naeem, Nadeem, Shah, Walter, Moses, Kundu for their friendship and kind help and for sharing their knowledge and enthusiasms, especially on high-tech products, photography and IT issues.
My special thanks to Jim Nygren, my officemate, for endless conversations on Swedish culture, history and social issues. Thanks Jim again for driving me to the Harsa Ski Marathon, it was a very, very exciting time.
My friends at Uppsala from Vietnam: Tong Anh, Sen, Khai, Thieu, Hong, Lam, Giang, Tram, Thuy, Thang, Trien, Xuan, Nhi, Tham, Thi Da, Thanh, Phuc, Quy, Thao, Chi and Lan for the times we were sharing great moments, having delicious parties and exciting chats in Uppsala. My special thanks are due to Hai and Kien who were my two PhD fellows and colleagues for sharing all the good and bad times during PhD life.
Other colleagues and friends who are not listed individually here but whose contributions have been very important to me.
My deepest thanks to my parents, my parents-in-law and my sisters and brothers for their never ending support. My beloved wife, Ngo Thi Minh Duyen and my lovely daughter Tran Minh Khue and son Tran Minh Quan who have always been beside me, for all their love, patience and endless support that undoubtedly helped me keep my sanity all through these hard times - much more than thanks.
This study was supported within the SIDA/SAREC project ‘Uses of genetic diversity and biotechnological advances in forest tree improvement research’ funded by the Swedish International Development Agency. The progeny trial used in this study was established in cooperation between the Research Centre for Forest Tree Improvement and CSIRO Forestry and Forest Products with support from the FAO’s regional Project RAS/91/004 (FORTIP), a part of the molecular work was done in the lab of the Centre for Biotechnology in Forestry which was funded by the National Biotechnology Program - Ministry of Agricultural and Rural Development, Vietnam.