applications and examples of spatial big data and … who was working at the emergency operations...
TRANSCRIPT

LOCATIONAL ANALYTICS AND BIG DATA: FOUNDATIONS, EMERGING APPLICATIONS AND RESEARCH
Overview of Spatial Big Data and Analytics (9:10-9:55am)
Applications and Examples of Spatial Big Data and Analytics
(9:55-10:15am)
Break
Research Opportunities in Location, Analytics, Big Data and GIS for IS Researchers
(10:25-10:45am)
1

Applications and Examples of Spatial Big Data and Analytics
James B. PickUniversity of Redlands
Redlands, CA, [email protected]
Pre-ICIS Workshop on Locational Analytics and Big Data: Foundations, Emerging Applications, and Research
Sponsored by SIGGISAssociation for Information Systems
Fort Worth, Texas, December 13, 2015
2

Applications of Spatial Big Data and Analytics
• Social Media• Internet of Things• Disaster Emergency Management• Supply Chain Management• Public Safety• Urban Traffic• Politics• Healthcare• Energy • Climate Science• Marketing/Advertising
3

Spatial big data: Analyzing socioeconomic geographic patterns of social media – Twitter and Flickr
• Socioeconomic factors can be studied for big data samples of social media use
• One study examined and compared the spatial patterns of 19.8 million Twitter records and 4.3 million Flickr records within the lower-48 US states to determine how the patterns compare at different scales, and the effects of social and economic variables on Twitter and Flickr use, evaluated through regression (Li, Goodchild, and Xu, 2013).
• Spatial analysis showed a lot of similarity and some differences between Twitter and Flickr in the densities of use.
• The big data sample size allows spatial analysis to be done at widely different scales, ranging from the nation down to city areas, such as neighborhoods stretching from Santa Monica to Downtown LA.
4
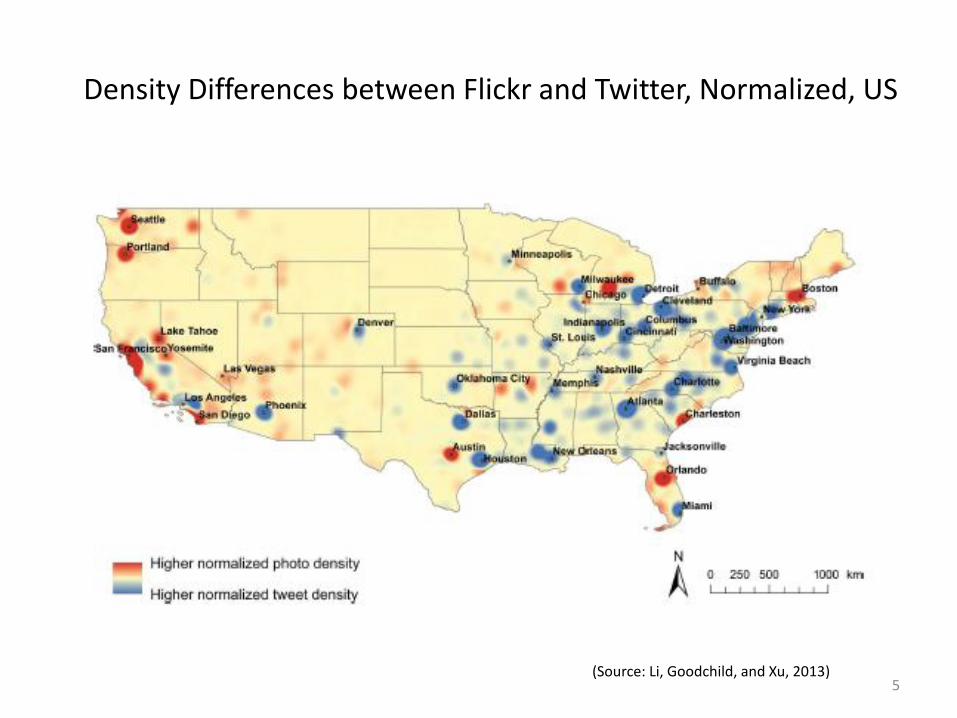
Density Differences between Flickr and Twitter, Normalized, US
(Source: Li, Goodchild, and Xu, 2013)5

Tweet locational patterns at scale of LA neighborhoods.
(Source: Li, Goodchild, and Xu, 2013)
6

Analytics to study socioeconomic patterns of social media –Flickr and Twitter
• The regressions found that greater education and occupations in business, science, and the arts are predictors of the production of tweets and photos that are geo-referenced (Li, Goodchild, and Xu, 2013).
• Due to the size of the sample, and presence of 58 independent variables, and the high level of multi-collinearity, the regression approach was modified to (1) extract five uncorrelated principal components through partial least squares (PLS), and (2) estimate the effect of the five principal components on tweet density through regression (R). The entire process is called PLSR.
• This is a form of analytics applied to big data to explain spatial variables.– Weaknesses of this approach are (1) that the five components may not
represent well the concepts they are named for (age, race, education, income, and occupation) and (2) the PLSR regression does not test for the effect of location.
7
Using Spatial Big Data and Analytics to Understand the Internet of Things
• Internet of Things is the Internet framework for digitally connecting material objects
• Geography and GIS are critical to understanding the Internet of Things
• Billions of devices, which are georeferenced with locations, can be connected together digitally, so the flows and interactions between them can be monitored and controlled.– Cisco estimates that by 2020, 50 billion devices will be connected to each
other by the Internet (van der Zee and Scholten, 2014)
• This inter-connection can be established in space-time.
• “All physical objects and the sensor data they produce have a position, dimension, and orientation in space and time.” (van der Zee and Scholten, 2014)
8

Smart Object// Smart City
• A smart object has dimensions of: shape, size, and orientation (i.e. direction it faces), as well as a sphere of influence (i.e. effective range of an object).
• Spatial algorithms can use these dimensions to determine how two objects interact with each other.
• The object’s sensor(s) receives information from other objects and its actuator(s) sends information to other objects.
• An example of the Internet of Things is a “smart city,” i.e. one which has many “things” in its environment and infrastructure, which send and receive information to and for each other.
(Source: van der Zee and Scholten, 2014)9

Smart Object (a) made available as (b) a resource that can connect to other smart objects and be accessible by humans
Source: Serbanati et al., 201110

Internet of Things, with sensors in Smart City
(Source: Libelium, 2013)11

Locational analytics and Internet of things
• Locational analytics in real time requires that the object or the event is geo-enabled.
– Geo-enabling the object could be by putting a one or more positioning component(s) (such as GPS chip or RFID chip) on board the object. Examples: cell phone, drone, inventory pallet.
– With several sensors, the orientation of a “prototypic” object can be determined, which is based on its internal positioning. An example is a car, which can be tilted up and down and facing different directions.
(note: a non-prototypic object is a point).
– Or, the event can be geo-enabled. Examples: the position of an object is geo-recorded by cameras, or an RFID chip on an object is read by an RFID reader., or a social media text has enough information to look-up the location in a table. (“Redlands” and “Las Fuentes” through look-up in a table give the X-Y coordinates of the Las Fuentes restaurant.)
• A physical object have spatial relationships that can be analyzed. 12

Common Spatial Relationships of Objects
(Source: Esri, 2014) 13

Locational analytics and Internet of things (cont.)
• Spatial analysis can be created for a geo-referenced object. Example: a 3-D spherical buffer of 1,200 meters is calculated continuously for an aircraft. This allows monitoring of any other object that enters the sphere.
• Spatial modeling can estimate future locations and relationships of objects to each other, e.g. weather landscapes, consisting of physical objects and their relationships, can be forecast in 3-D.
• Based on spatial modeling, notable spatial events can be uncovered through modeling of the Big Data and corrective actions can be generated. Example, the future course of the California drought can be modeled. Physical sensors and actuators can work together to detect dry conditions, and in response water valves can be automatically turned on or off, or to an intermediate state of closure.
• The real-time locational analytics can be combined with numerical analytics to produce a mixed response. In the drought example, standard spatial models can estimate the extent of agglomeration of sprinklers across a downtown area. In this case, spatial sensors analyze the proximity of objects, while numerical models analyze runoff stream capacity.
(Partially based on van der Zee and Scholten, 2014) 14

Spatial Big Data and Analytics for Crowdsourced Data
• Place names can be associated with X-Y coordinate locations. This is done by a Gazetteer, which has place name, place type, and spatial location.
• There are administrative and agency costs to maintaining the Gazetteer. An example is the lengthy disputes that take place in the US in identifying Congressional Districts
• An alternative is Volunteered Geographic Information (VGI).
• Here the geographic place naming is provided by volunteers.
• An example is OpenStreetMap which provides a free map of the world maintained by volunteers in the field
• A weakness is lack of quality control and incomplete coverage in some geographic areas, i.e. ones without volunteers
15

Volunteered approach, combined with Big Data, allows generation of “spatial footprints”
• A person takes a photo of a place, say “Paris” and posts it on social media
• An example is the “Footprint” of photos in Flickr, which have an X-Y coordinate available for each photo posted online by a person.
• The “Footprint” reflects the human conceptualization of “Paris,” points geogtagged from a large number of photos, that a group of people posts.
• Although it doesn’t have the administrative exactness of the Gazetteer, it may be a better representation of the group’s cognitive perception of “Paris” as a place.
(Source: Li and Goodchild, 2012) 16

Spatial analytics that can be performed on a “spatial footprint”
• A pattern that forms a spatial footprint can be generalized into a smoothed kernel, using a kernel estimator (Li and Goodchild, 2012)
• Relationships between a larger place and smaller places within the larger place can be displayed, based on point density values for the smaller places, i.e. tagged Flickr points per kilometer2. For instance this can define very popular, defining places within Paris, such as “Montmartre” and “Eiffel Tower”
• Spatial footprint can also be defined in space and time, by graphing the number of photos with the tag “Paris” over time.
17

VGI for Haiti Earthquake
OpenStreetMap Prior to, and After Earthquake
Numerous volunteers gathered and provided geo-crowdsourced information following the disastrous earthquake in Haiti in 2012 that was uploaded to web-based mapping services, including OpenStreetMap, Google MapMaker, Ushahidi, and GeoCommons, which were accessed and used intensively for disaster relief and recovery.
This allowed the greater Haitian population segment that used mobile phones (1/3 of households) to respond.This example represents Spatial Big Data, but with limited Locational Analytics
(Source: Zook et al., 2010)18

Another example of VGI used with Big Data is in Natural Disasters is Hurricane Katrina
• [December 14, 2005]
In Katrina's mess, maps as good as lifesavers• (Dallas Morning News, The (KRT)) KILN, Miss. _ With his stranded mother on one phone line and an emergency
aid worker on the other, the man desperately tried to arrange a rescue as Hurricane Katrina slammed into the Mississippi Gulf Coast.
The volunteer aid worker, an expert in using computer mapping and aerial photography, used those tools to generate coordinates for the water treatment facility where the woman was holed up.
"The helicopter was off and running in a few minutes," said Talbot Brooks of Delta State University in Cleveland, Miss., who was working at the Emergency Operations Center in Jackson, Miss., as Katrina came ashore.
In an area left in ruins by the hurricane, experts in geographic information systems, or GIS, used computer-mapping programs that analyze data geographically to help locate people trapped in their homes and assist emergency responders searching for the missing.
They turned addresses and visual descriptions into latitudes and longitudes for rescue helicopters and provided navigation guides to ground-based rescuers working in terrain bared of road signs and landmarks.
"It's amazing realizing that the profession that we're in can help save people's lives," said Shoreh Elhami, who coordinates the GIS Corps, a volunteer organization of mapping experts who deployed in Katrina's wake. "We are not doctors. I used to think that if you're not a doctor, you can't really save people."
(Source: Dallas Morning News, 12/14/2005) 19
Why does disaster crowdsourcing represent spatial big data?
• Volunteers who provide crowdsourced data of a disaster meet the big data criteria of velocity, volume, variety, veracity (low), and value.
• The value of crowdsourced information in a disaster far exceeds that from traditional sources. Unstructuredness is a plus, since normal structure is often knocked out.
• Professional cartographers and development of models from accurate sensors could do a better job, but would require a longer period of time, while time is of the essence in an emergency.
• There is more reciprocity of valuable disaster information, i.e. volunteers not at the scene can rapidly gather useful information outside of regular reporting, and victims can send critical information directly from the scene.
20
Conclusions
• There are numerous types of applications of locational big data and analytics.
• For social media, tweets or photos in the millions can be mapped, compared, applied at different scales, and analyzed using multiple regression pre-processed to reduce regression computational intensity.
• Another example is applying locational big data and analytics to study the Internet of Things in space-time. Smart objects and smart events are inter-connected, with human user access to the complex relationships.
• Another instance of the benefits of spatial big data is through volunteered geographic information (VGI), also known as spatial crowdsourcing.
21

Conclusions (cont.)
• An example is spatial footprints created through VGI. This approach can provide attitudinal and cognitive mapping that complements conventional gazetteer mapping.
• VGI has found strong practical benefit in major disaster situations, such as Hurricane Katrina centered on New Orleans in 2005 and the Haiti Earthquake of 2010.
• Spatial big data and analytics are often applied without the knowledge of the individuals providing the information. This raises privacy and confidentiality concerns.
• Overall, there are huge benefits already proven to high quality, responsible applications of Locational Analytics and Big Data.
22

Sources
• Li, L, Goodchild, M.F., and Xu, B. 2013. Spatial, temporal, and socioeconomic patterns in use of Twitter and Flickr. Cartography and Geographic Information Science 40(2):61-77.
• Li, L., and Goodchild, M.F. 2012. Constructing paces from spatial footprints. ACM SigSpatial Geocrowd ’12. Proceedings of SigSpatial. New York, NY: Association for Computing Machinery
• Libelium. 2013. 50 Sensor Applications for a Smarter World. Retrieved from http://www.libelium.com/top_50_iot_sensor_applications_ranking.
• Serbenati, A., Medaglia, C.M., and Ceipidor, U.B. 2011. Building Blocks of the Internet of Things, n C. Turcu (Ed.), Deploying RFID – Challenges, Solutions, and Open Issues, INTECH, doi:10.5772/1997.
• Van der Zee, E., and Scholten, H. 2014. Spatial Dimensions of Big Data: Application of Geographical Concepts and Spatial Technology to the Internet of Things, in N. Bessis and C. Dobre (Eds.), Big Data and Internet of Things: A Roadmap for Smart Environments, Switzerland: Springer.
• Zook, M., Graham, M., Shelton, T., and Gorman, S. 2010. Volunteered Geographic Information and Crowdsourcing Disaster Relief: A Case Study of the Haitian Earthquake. World Medical and Health Policy 2(2), Article 2.
23
Questions ??? and Discussion
24