application of the jkr method to the measurement of ...227170/fulltext01.pdf · net w o r k...
TRANSCRIPT

N E T W O R K
Application of the JKR Method to the Measurement of Adhesion to Langmuir-Blodgett Cellulose Surfaces
Mats Rundlöf, SCA Graphic Research
Marie Karlsson, PRV Lars Wågberg, Mitthögskolan
Evgeni Poptoshev, YKI Mark Rutland, YKI Per Claesson, YKI
Report number: R-00-2 August 2000
Mid Sweden University Fibre Science and Communication Network SE-851 70 Sundsvall, Sweden Internet: http://www.mh.se/fscn


FSCN/Teknisk Fiberkemi Internet: Http/www.mh.se/fscn
R-00-2 Page 2 (19)
Content PageAbstract Introduction Experimental
Materials Preparation of cellulose surfaces Preparation of PDMS caps JKR-Apparatus Measurement of contact angle FTIR-ATR spectroscopy Theoretical background
Results Discussion Conclusions Acknowledgements References
3
4
44555666
8
14
16
17
18
Distribution list FSCN Ledningsgrupp (12) Referensgrupp Teknisk Fiberkemi (16) Referensgrupp Mek. Fiberteknologi (13)

FSCN/Teknisk Fiberkemi Internet: Http/www.mh.se/fscn R-00-2 Page 3 (19)
Application of the JKR Method to the Measurement of Adhesion to Langmuir-Blodgett Cellulose Surfaces Mats Rundlöf, SCA Graphic Research; Marie Karlsson, PRV; Lars Wågberg, Mid-Sweden University; Evgeni Poptoshev, YKI; Mark Rutland, YKI and Per Claesson, YKI. Abstract The JKR-method has been applied for studying adhesion between PDMS caps and Langmuir-Blodgett cellulose surfaces including the substrate, hydrophobised mica, and two flat mineral surfaces, bare mica and glass. The self–adhesion of PDMS caps and oxidised PDMS caps are included as a reference to compare with literature data. The results of the measurements have been compared with previous studies using the surface force apparatus and similar systems. A satisfactory agreement is obtained for simple systems showing no, or very limited, hysteresis between loading and unloading curves. In several cases, however, a large hysteresis is found between loading and unloading curves, with a larger adhesion measured from the pull-off force than from the JKR-curve determined on loading. This is for instance the case for PDMS against cellulose. The situation is analogous to that found in wetting studies showing a large hysteresis between advancing and receding contact angles. Key words: Adhesion; Adhesion hysteresis; Cellulose; JKR-method; PDMS.

FSCN/Teknisk Fiberkemi Internet: Http/www.mh.se/fscn
R-00-2 Page 4 (19)
Introduction The specific strength of paper exceeds the specific strength of steel, but despite this the potential strength of the cellulose fibers is not fully utilized. Davison [1] shows that even in a well-bonded paper sheet, a significant number of fibers can be extracted from the paper without being broken. This indicates that the magnitude of the strength of the bonded joint between fibers and hence the adhesion between fibers is very important for the mechanical properties of paper. In turn, this means that an increased adhesion between fibers, e.g. by chemical additives, should be a way of increasing the specific strength of paper even further. The adhesion between paper and other materials are also of great importance; inorganic fillers are commonly used in paper, ink has to adhere during the printing process (and be removed during deinking), and paper and other materials are used together in composites such as packing materials for food. For these reasons interactions forces acting between cellulose surfaces and between cellulose and other materials have been studied extensively during the last years using a range of surface force methods such as atomic force colloidal probe [2-4], MASIF [5] and the interferometic surface force apparatus, SFA [6-8]. These techniques are all very powerful and they provide information of long-range and adhesive properties between surfaces. A difficulty with the AFM colloidal probe technique and the MASIF is that surface deformation effects are not easily accounted for, whereas these effects can be readily studied with the SFA [9]. However, all the above mentioned techniques also have drawbacks in that the measurements are rather time consuming and special requirements are put on the substrate surfaces [10]. It is thus a need for a simpler, but yet accurate, device that can be of general use in studies of interactions between cellulose and other materials. Such a technique may be the JKR-method [11-12], that utilizes the deformation of surfaces under zero or applied loads to accurately determine the adhesion between two bodies. The evaluation is based on the well known theory for contact deformation between elastic surfaces, the JKR-theory, developed by Johnson, Kendall and Roberts [13]. No information about long-range forces is obtained, but in many cases of technological interest it is the adhesion force that is most important. This manuscript describes the application of the JKR technique for measuring adhesion between PDMS caps and Langmuir-Blodgett cellulose surfaces, including the substrate, mica, with or without the hydrophobic sub-layer for the cellulose. The self–adhesion of PDMS caps and oxidised PDMS caps are included as a reference to compare the present results with those published in the literature. The results presented here demonstrate that studies of this type have the potential to be of great importance for understanding how both contaminants and chemical additives affect adhesion forces between surfaces of importance for the paper-making industry. Experimental
Materials A glass slide intended for microscopy was thoroughly cleaned in Decanol and was used as a flat glass sample. Poly(dimethylsiloxane) (PDMS) was supplied by Wacker Chemie GmbH, Germany, as a two component system, a base (Dehesive 920) containing an inhibitor (PT 88) to increase its shelf life, a crosslinking agent (V24) and a Pt catalyst

FSCN/Teknisk Fiberkemi Internet: Http/www.mh.se/fscn
R-00-2 Page 5 (19)
(Catalyst OL). These were completely solvent free according to the manufacturer. Arachidic acid (AA) was purchased from Merck and used as received. Eicosylamine (EA) was previously prepared according to Berg et al. [14]. Chloroform was obtained from Merck and further purified by distillation in all glass apparatus. Trimethylsilyl cellulose (TMSC) was synthesized in our laboratory according to a method described elsewhere [7, 15]. 10.3 mg of TMSC was dissolved in a mixture of 95% chloroform and 5% absolute ethanol and the solution was stored at 5°C prior to use. The water used was purified by a RiOs-8 and Milli-Q +185 unit from Millipore and finally passed through a 0.2 µm filter. The total organic carbon content in the purified water was monitored via A-10 TOC monitor (Millipore) connected to the system. It did not exceed 10 ppb. Preparation of cellulose surfaces Cellulose surfaces were prepared as described by Holmberg et al. [7]. First the substrate surface, a freshly cleaved piece of muscovite mica 3 cm long and 1 cm wide, was rendered hydrophobic by Langmuir-Blodgett deposition. For this purpose an equal amount of AA and EA was dissolved in chloroform to obtain a stock solution (95% chloroform, 5% ethanol) with total concentration of 2.7 mM. It was spread in a Langmuir trough (KSV instruments) and deposited at a constant surface pressure of 30 mN/m at a deposition speed of 5 mm/min. In the text, this surface is referred to as hydrophobised mica. Next, TMSC was spread on a pure subphase and 10 layers were deposited on the hydrophobised mica substrate at a constant surface pressure of 15 mN/m using a constant deposition speed of 5 mm/min in both directions. After the end of the deposition process, TMSC was converted to cellulose by exposing the surface to humid HCl. This was done by positioning it above a 10% HCl solution for 1 minute at room temperature. All the procedures mentioned above were carried out inside a laminar flow cabinet in order to reduce the risk of air born contaminants. Preparation of PDMS caps 2.5 parts by weight (pbw) of crosslinker was added to 100 pbw of the base, and 1.0 pbw of catalyst was slowly mixed in. Droplets of this solution were formed on a glass slide treated with fluorodecyltrichlorosilane and cured for one hour at 105°C. The cured caps were extracted in a soxleth apparatus using heptane as a solvent for a minimum of six hours to remove unreacted monomer. Some caps were treated in air plasma to oxidize the surfaces. For this purpose a plasma cleaner (Harrick PDC-32G) was used at full effect (100W) for 5 minutes. JKR-Apparatus An apparatus for measurement of the work of adhesion according to the JKR-method has been built based on the apparatus constructed by Falsafi [12]. A translation stage is mounted so that it can move one of the surfaces in the z-direction, with the position controlled by a differential micrometer. A holder for a glass slide is mounted horizontally on the stage and an elastic cap is put on the glass slide so that it can be pressed against or withdrawn from an underlying surface. This surface is placed on an analytical balance that measures the applied load. A microscope simultaneously registers the contact area by looking through the glass slide and the elastic cap from above. A computer equipped with custom-made software developed for this purpose controls the measurement. The position of the micrometer is adjusted by means of a

FSCN/Teknisk Fiberkemi Internet: Http/www.mh.se/fscn
R-00-2 Page 6 (19)
stepping motor. The reading of the balance and the images obtained by the microscope are recorded at pre-set intervals by means of a CCD camera. Measurements were carried out in laboratory air at ambient conditions, i.e. T= 25.7-26.2 °C, RH= 33-47%. All measurements were made upon first approach of the PDMS lens to the flat surface. The contact radius and the load were recorded 10 minutes after each compression/decompression step in order to reach quasi equilibrium. The surfaces were kept 30 minutes at maximum load before the unloading started. Data were evaluated according to procedures described by Falsafi [12]. Measurement of contact angle The contact angles with water were measured on planar PDMS sheets, before and after plasma treatment, using a Dynamic Absorption Tester, (Fibro DAT 1121/1122, Fibro System AB, Stockholm, Sweden). The apparatus consists of a capillary, which is connected to a syringe that ejects a given, very accurate volume of liquid. The droplet is applied to the surface to be studied, and a CCD-camera records the process. During the first second one image is recorded every 20 ms, i.e. spreading and possible absorption can be studied at very short contact times. After the first second until a pre-set time when the measurement ends, images are recorded at approximately every 0.4 seconds. Each image is analyzed with respect to base, height and shape of the droplet, and from these values the contact angle, volume and contact area are calculated. FTIR-ATR spectroscopy FTIR-spectroscopy was performed on the surface of PDMS caps using an Attenuated Total Reflectance (ATR)-crystal in contact with the surfaces in air. The instrument used was a Nicolet Magna 750 (Nicolet Instruments Corp. USA) equipped with a Golden Gate single reflection diamond ATR-crystal from Specac Inc., USA. The resolution was 4 cm-1 and the torque applied 5 cNm. Theoretical background The elastic deformation of surfaces has been described theoretically by Johnsson, Kendall and Roberts [13], and the predictions of the JKR-theory has been found to agree well with experimental data [9]. According to the JKR-theory, the radius of the contact zone between solids is related to the work of adhesion by:
( )[ ]aRK
P WR WRP WR3 23 6 3= + + +π π (1)
where R = the equivalent radius of curvature of the system P = the applied load K = the elastic constant of the system R is calculated from the radius of curvature of the two materials 1 and 2:
FSCN/Teknisk Fiberkemi Internet: Http/www.mh.se/fscn
R-00-2 Page 7 (19)
1 1 1
1 2R R R= + (2)
The elastic constant, K, can be calculated from the Young’s modulus, E, and the Poisson ratio, ν, of the two materials
1K
=34
1 −ν12
E1
+1 −ν2
2
E2
(3)
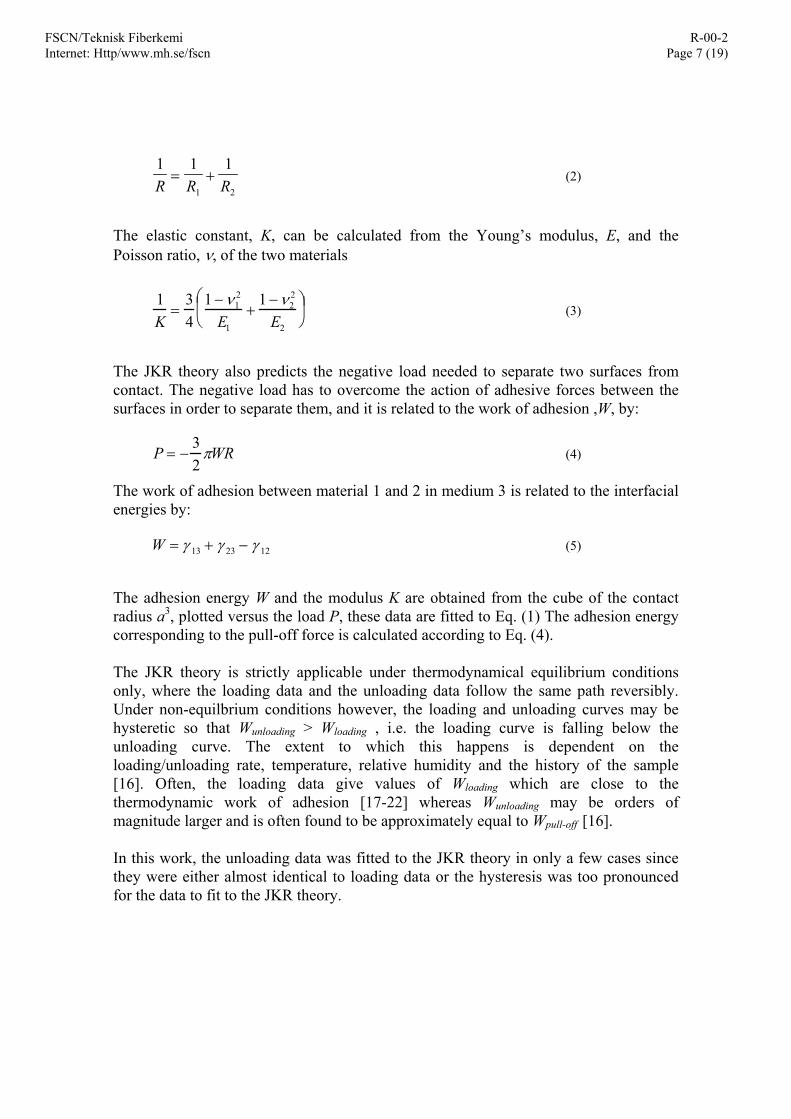
The JKR theory also predicts the negative load needed to separate two surfaces from contact. The negative load has to overcome the action of adhesive forces between the surfaces in order to separate them, and it is related to the work of adhesion ,W, by:
P = −32
πWR (4)
The work of adhesion between material 1 and 2 in medium 3 is related to the interfacial energies by:
W = γ 13 + γ 23 − γ 12 (5)
The adhesion energy W and the modulus K are obtained from the cube of the contact radius a3, plotted versus the load P, these data are fitted to Eq. (1) The adhesion energy corresponding to the pull-off force is calculated according to Eq. (4). The JKR theory is strictly applicable under thermodynamical equilibrium conditions only, where the loading data and the unloading data follow the same path reversibly. Under non-equilbrium conditions however, the loading and unloading curves may be hysteretic so that Wunloading > Wloading , i.e. the loading curve is falling below the unloading curve. The extent to which this happens is dependent on the loading/unloading rate, temperature, relative humidity and the history of the sample [16]. Often, the loading data give values of Wloading which are close to the thermodynamic work of adhesion [17-22] whereas Wunloading may be orders of magnitude larger and is often found to be approximately equal to Wpull-off [16]. In this work, the unloading data was fitted to the JKR theory in only a few cases since they were either almost identical to loading data or the hysteresis was too pronounced for the data to fit to the JKR theory.
FSCN/Teknisk Fiberkemi Internet: Http/www.mh.se/fscn
R-00-2 Page 8 (19)
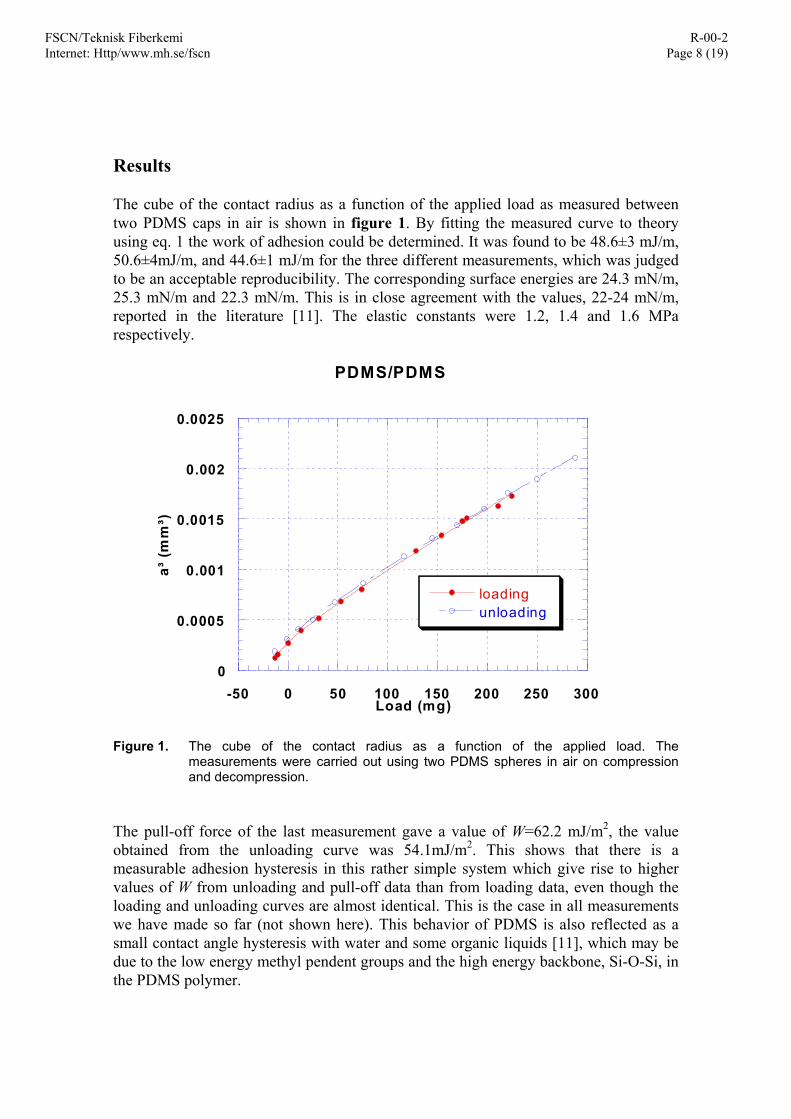
Results The cube of the contact radius as a function of the applied load as measured between two PDMS caps in air is shown in figure 1. By fitting the measured curve to theory using eq. 1 the work of adhesion could be determined. It was found to be 48.6±3 mJ/m, 50.6±4mJ/m, and 44.6±1 mJ/m for the three different measurements, which was judged to be an acceptable reproducibility. The corresponding surface energies are 24.3 mN/m, 25.3 mN/m and 22.3 mN/m. This is in close agreement with the values, 22-24 mN/m, reported in the literature [11]. The elastic constants were 1.2, 1.4 and 1.6 MPa respectively.
0
0.0005
0.001
0.0015
0.002
0.0025
-50 0 50 100 150 200 250 300
PDMS/PDMS
loadingunloading
a³ (m
m³)
Load (mg) Figure 1. The cube of the contact radius as a function of the applied load. The
measurements were carried out using two PDMS spheres in air on compression and decompression.
The pull-off force of the last measurement gave a value of W=62.2 mJ/m2, the value obtained from the unloading curve was 54.1mJ/m2. This shows that there is a measurable adhesion hysteresis in this rather simple system which give rise to higher values of W from unloading and pull-off data than from loading data, even though the loading and unloading curves are almost identical. This is the case in all measurements we have made so far (not shown here). This behavior of PDMS is also reflected as a small contact angle hysteresis with water and some organic liquids [11], which may be due to the low energy methyl pendent groups and the high energy backbone, Si-O-Si, in the PDMS polymer.

FSCN/Teknisk Fiberkemi Internet: Http/www.mh.se/fscn
R-00-2 Page 9 (19)
The results obtained from a similar experiment, using two PDMS caps subjected to an air plasma treatment are shown in figure 2. This surface treatment introduced OH-groups as seen in figure 3, which shows the FTIR spectra of PDMS caps before and after plasma treatment in the region of the spectrum where OH-groups appear.
PDMS surface 15 min plasma treatmentPDMS surface 5 min plasma treatmentPDMS surface 1 min plasma treatmentUntreated PDMS cap
0.004
0.005
0.006
0.007
0.008
0.009
0.010
0.011
0.012
0.013
0.014
0.015
0.016
0.017
0.018
0.019
Abs
orba
nce
3100 3200 3300 3400 3500 Wavenumbers (cm-1)
Figure 2. FTIR spectra of the PDMS caps before and after plasma treatment
0
0.0005
0.001
0.0015
0.002
0.0025
-50 0 50 100 150 200 250 300
Oxidized PDMS - Oxidized PDMS
loadingunloading
a3 (mm
3 )
Load (mg) Figure 3. The cube of the contact radius as a function of the applied load. The
measurements were carried out using two PDMS caps treated with air plasma.

FSCN/Teknisk Fiberkemi Internet: Http/www.mh.se/fscn
R-00-2 Page 10 (19)
The contact angle of the PDMS before and after plasma treatment was monitored qualitatively by putting a droplet of water on a flat PDMS surface which had been treated in exactly the same way as the caps. The water formed a round droplet on the untreated PDMS and wetted the plasma treated surface, which shows that the plasma treatment resulted in a much more hydrophilic surface. The contact angles were later measured on a similar set of samples and were found to be 103° and 31° respectively. The work of adhesion calculated from the loading data was 47.6 ± 1.5 mJ/m2, comparable to that found for untreated PDMS. The unloading data, however, gave a much larger value of 107 mJ/m2 for the work of adhesion. Clearly, we here have a case with a strong adhesion hysteresis in the JKR experiment. The value calculated from the pull-off force was 112 mJ/m2 in good agreement with the value obtained from the unloading data. Chaudhury and Whitesides obtained approximately the same value of the adhesion energy, 117 mJ/m2, using PDMS caps, modified with an oxygen plasma, but from loading experiments [11]. Their unloading experiments caused cohesive failure in the samples and could not be evaluated. The difference between our results and those of Chaudhury and Whitesides could be due to differences in the plasma treatment, which probably give rise to a higher degree of oxidation in their experiments as indicated by the much lower contact angle, θ=0°. Another reason for the differences could be the history of the samples, i.e. the time and environment of storage between plasma treatment and measurement. Morra et al. have shown that oxygen plasma oxidised PDMS return to a lower energy state over time when stored in air [23]. This “hydrophobic recovery” significantly influence the contact angle after half an hour at room temperature (first measurement reported) which is well within the time needed for our JKR measurements that last for several hours. In the evaluation of the unloading data, the two-parameter fit gave a slightly higher value of the elastic constant K compared to for the loading data, 1.6 and 1.8 MPa respectively. To clarify if this difference is important and why it arises is beyond the scope of this investigation. Results from a similar experiment using an untreated PDMS cap and a flat mica surface are illustrated in figure 4. By fitting the experimental data to Eq. (1) we determined the elastic constant for the composite system to be K = 2.6 MPa. The work of adhesion obtained from the loading curve was 58.9 ± 2.3 mJ/m2, slightly lower than that obtained from the pull-off force, 63.9 mJ/m2. The loading/unloading curve did not display any significant differences.

FSCN/Teknisk Fiberkemi Internet: Http/www.mh.se/fscn
R-00-2 Page 11 (19)
-0.001
0
0.001
0.002
0.003
0.004
0.005
-50 0 50 100 150 200 250 300 350
PDMS/Mica
loadingunloading
a³ (m
m³)
Load (mg)
Figure 4. The cube of the contact radius as a function of the applied load. The measurements were carried out in air using one PDMS cap and one flat mica surface.
The data obtained from the JKR-experiment using one PDMS cap and a hydrophobised mica surface are presented in figure 5. The elastic constant evaluated from the experiment, 2.7 MPa, is similar to that found between one PDMS cap and one bare mica surface. This is reasonable considering that the 2 nm thick surfactant layer hardly contributes to the elasticity of the system. The work of adhesion obtained from the loading curve, which is similar to the unloading curve, was 39.8±1.2 mJ/m2, whereas the pull-off force gave a significantly larger value, 62.8 mJ/m2. The work of adhesion determined with the SFA using two hydrophobised mica surfaces is typically 80 mJ/m2, somewhat larger than that found between a PDMS cap and a hydrophobised mica surface.

FSCN/Teknisk Fiberkemi Internet: Http/www.mh.se/fscn
R-00-2 Page 12 (19)
-0.0005
0
0.0005
0.001
0.0015
0.002
0.0025
0.003
0.0035
-50 0 50 100 150 200 250 300 350
PDMS/Hydrophobic mica
loadingunloading
a³ (
mm
³)
Load (mg) Figure 5. The cube of the contact radius as a function of the applied load. The
measurements were carried out in air using one PDMS cap and one flat hydrophobised mica surface.
The data obtained for PDMS against cellulose coated mica are shown in figure 6. The elastic constant evaluated from the loading curve is 3,1 MPa, and the work of adhesion is 49,5 ± 2.1mJ/m2. The loading/unloading curves display a large hysteresis and the measured pull-off force corresponds to a work of adhesion of 201 mJ/m2. This latter value is similar to that found between two cellulose surfaces in air employing the SFA. The values obtained with that technique is 105-210 mJ/m2 [7].

FSCN/Teknisk Fiberkemi Internet: Http/www.mh.se/fscn
R-00-2 Page 13 (19)
-0.0005
0
0.0005
0.001
0.0015
0.002
0.0025
0.003
-200 -100 0 100 200 300 400
loadingunloading
a³ (m
m³)
Load (mg)
PDMS/LB Cellulose
Figure 6. The cube of the contact radius as a function of the applied load. The
measurements were carried out in air using one PDMS cap and one flat mica surface coated with 10 cellulose layers.
A similar large hysteresis was observed when the adhesion between a glass slide and a PDMS cap was studied (figure 7). The elastic constant obtained from the loading curve was similar to the other asymmetric systems, 2.7 MPa. The work of adhesion measured on loading was 44.8±2.1 mJ/m2, much lower than the 342 mJ/m2 determined from the pull off force.

FSCN/Teknisk Fiberkemi Internet: Http/www.mh.se/fscn
R-00-2 Page 14 (19)
-0.001
0
0.001
0.002
0.003
0.004
-300 -200 -100 0 100 200 300 400
PDMS/glass
loadingunloading
a³ (m
m³)
Load (mg) Figure 7. The cube of the contact radius as a function of the applied load. The
measurements were carried out in air using one PDMS cap and one planar glass slide.
Discussion The PDMS caps are non-polar and should interact with the different surfaces with van der Waals forces only. We have estimated the work of adhesion due to van der Waals interactions between the different samples and PDMS from the dispersive part of the surface energies using the approximate relation ddW 2112 2 γγ≈ . These calculated values are compared with those obtained from JKR measurements in table 1. There is a good agreement between the calculated values of W and the values obtained from loading data in the JKR experiments, Wloading, as expected since the loading data often give a value of the adhesion energy close to the equilibrium value [16-22]. The values obtained from the unloading data and the pull-off force in the JKR experiment may however be quite different, due to the large adhesion hystersis which is sometimes seen. If we substitute γ d for PDMS in table 1 with the values reported by Chaudhury and Whitesides [11] obtained from receding contact angles with hexadecane and paraffin oil, we obtain values of W12 of 49.8 and 50.6 mJ/m2 respectively. Again, this is in reasonable agreement with the values obtained from the JKR experiment, but from the unloading curve in this case (Wunloading= 54.1, table 1).

FSCN/Teknisk Fiberkemi Internet: Http/www.mh.se/fscn
R-00-2 Page 15 (19)
Table 1. Comparison of calculated and measured values of work of adhesion, W System: Calculated work of
adhesion, W12, (mJ/m2)
Measured work of adhesion, (mJ/m2)
W loading W unloading W pull-off
PDMS / PDMS 44 (11) 44.6 54.1 62.2
Oxidised PDMS/ Oxidised
PDMS
- 47.6 107 112
PDMS / Mica 52 (24) 58.9 - 63.9
PDMS / Hydrophobic mica 44 (25) 39.8 - 62.8
PDMS / Cellulose 55 (26) 49.5 - 201
Let us now consider why we in some of the experiments observe a large hysteresis between the loading and the unloading curves (figures 2, 6 and 7) but not in other cases (figures 1, 4 and 5). First we note that an adhesion hysteresis may occur between smooth soft elastic bodies [27] due to instabilities occurring when the individual chemical bonds are stretched. Attard, predicts that this effect should be largest for soft bodies and increase with the maximum applied load prior to separation [27]. It seems that the JKR instrument is ideal for testing the theoretical predictions, but this is outside the scope of the present report. There are many other reasons why there may be an adhesion hysteresis with a higher adhesion observed on unloading as compared to on loading [11, 12, 17-19], and the relation between adhesion hysteresis and contact angle hysteresis is clear [28]. One reason is simply that interpenetration of the two materials into each other may occur. This has been observed to affect the adhesion between two cellulose surfaces [7], and between a PDMS cap and a silica surface carrying grafted PDMS chains [19]. This is likely the main reason for the hysteresis observed between one cellulose coated surface and one PDMS cap. The data indicate that the outer layers of the cellulose surface and the outer PDMS surface interpenetrate and upon separation the two surface layers can not disentangle but the cellulose layers may instead separate from each other. This would explain why the adhesion observed with the JKR instrument in measurements of the pull-off force is similar to that measured between two cellulose surfaces using the SFA. It may appear unlikely that the crosslinked hydrophobic PDMS should penetrate into a cellulose film, the presence of a molecular scale roughness on either or both of the surfaces would mean that they could actually adjust to one another to overcome this roughness and create additional contact. This in turn means energy dissipation also by a mechanical interlocking mechanism upon separation of the surfaces, which would lead to adhesion hysteresis. New measurements on another celullose film gave similar values of the work of adhesion from loading data, (53.0, 43.8 mJ/m2) but much less hystersis upon unloading, (62.0, 55.2) i.e. in the range of 10 mJ/m2. These new experiments were made using a lower maximum load, which could not be determined exactly at that time

FSCN/Teknisk Fiberkemi Internet: Http/www.mh.se/fscn
R-00-2 Page 16 (19)
for practical reasons, nevertheless, the fact that a lower maximum load seems to decrease the hysteresis further support the interpenetration hypothesis. The same effect may contribute to the adhesion hysteresis observed between one PDMS surface and a comparatively rough glass slide. However, we note that it has been reported that PDMS is not so inert as one may think and OH-groups may be created by spontaneous hydrolytic decomposition [29]. This process gives rise to an adhesion that increases with contact time for silicon rubber against glass, and for silicon rubber against silica due to formation of polar links between the two substrates [30]. However, the time scale of the present experiment is much shorter than that of Gent et al., and based on this we suggest that also interpenetration is an important mechanism for the adhesion hysteresis between glass and PDMS as reported in this study. Clearly, more experimental work is needed to investigate this in detail, i.e. rate dependence, effect of temperature and relative humidity and the repeatability of the hysteresis upon second approach. Let us also consider the hysteresis observed for the two oxidized PDMS caps (figure 2). The plasma oxidation process is likely to, in addition to creating new chemical functional groups, increase the surface roughness on the molecular scale. Thus entanglement effects are expected to be larger than for untreated PDMS. Another contributing factor is crosslinking by reactive groups on the opposing surfaces [30]. Finally, a third contribution that is present whenever the surface layer has some mobility comes from the changed position of polar surface groups. The polar surface groups can reduce their free energy by exposing itself to the most polar medium, i.e. the ambient medium or the surface. PDMS is more polar than air and the polar surface groups will, if they have a rotational freedom, bury themselves inside the polymer. When the two polymers come together, the polar surface groups can rotate in order to interact favorably with the polar surface groups on the other surface. Hence, on loading the surfaces will have a less polar character than on unloading. This is exactly what the experiments with the oxidized PDMS indicate. The migration/reorientation of surface group on polymers also affects the wetting behavior, the polymer surface becomes more polar after storage in water compared to after storage in air [31, 32]. The long-range forces between such surfaces are also affected by the same mechanism [33].
Conclusions The JKR-method has been applied for studying adhesion between PDMS caps and Langmuir-Blodgett cellulose surfaces including the substrate, hydrophobised mica, and two flat mineral surfaces, bare mica and glass. The self–adhesion of PDMS caps and oxidised PDMS caps were included as a reference to compare our measurements with earlier published results. In simple cases, characterized by little hysteresis between loading and unloading cycles, the work of adhesion determined from the measured radius of the contact as a function of load is less from loading data than from unloading data and less than the work of adhesion determined from the pull-of force, but the differences are small. The values obtained are slightly less than the work of adhesion determined using the interferometric surface force technique for similar, but not identical, systems. The situation is more complicated when the loading and unloading

FSCN/Teknisk Fiberkemi Internet: Http/www.mh.se/fscn
R-00-2 Page 17 (19)
cycles are more hysteretic. In these cases the work of adhesion measured on unloading is always significantly larger than that measured on loading. Several factors contribute to this; viscoelastic deformations, interpenetration of the surface layers, surface roughness, formation of chemical bonds by reactive groups and reorientation of polar surface groups. For each system one may speculate about the most important mechanism, but to thoroughly determine the most important one for a given system is as difficult as for the related problem of contact angle hysteresis. The JKR measurement seems to be an effective alternative and complement to the SFA for studying the adhesion of different polymers to cellulose. Acknowledgements The authors are grateful to the following people: Dr. Afshin Falsafi, formerly of University of Minnesota now with 3M, and Prof. Matt Tirell formerly of University of Minnesota now at University of California, Santa Barbara, who shared experience and knowledge in a most generous way. Ms. Inger Nygren for skilful experimental work, Mr. Sten Larsson, Mr. Lennart Kondrasson, who helped in building the apparatus and Dr. Sven Forsberg for planting the idea of using the JKR method in this context. All of the above mentioned are affiliated with SCA Graphic Research. The financial support from Bo Rydins Foundation for Scientific Research and the Foundation for Strategic Research (SSF), Forest Products Industry Research College is gratefully acknowledged.

FSCN/Teknisk Fiberkemi Internet: Http/www.mh.se/fscn
R-00-2 Page 18 (19)
References 1. Davison, R. W. Tappi 55, 567 (1972).
2. Carambassis, A., Rutland, M. W. Web release date July 23rd 1999 Langmuir .
3. Rutland, M. W., Carambassis, A., Willing, G. A., Neuman, R. D. Colloids Surf. A.
123-124, 369-374 (1997).
4. Holmberg, M., Wigren, R., Erlandsson, R., Claesson, P. M. Colloids and Surfaces A 129-130, 175-183 (1997).
5. Poptoshev, E., Rutland, M. W., Claesson, P. M. (submitted) Langmuir.
6. Neuman, R., Berg, J., Claesson, P. M. Nordic Pulp Pap Res J. 8, 96-104 (1993).
7. Holmberg, M., Berg, J., Stemme, S., Ödberg, L., Rasmusson, J., Claesson, P. M. J. Colloid Interface Sci. 186, 369-381 (1997).
8. Österberg, M., Claesson, P. M. (in press) J. Adhesion Sci. Techn. .
9. Horn, R. G., Israelachvili, J. N., Pribac, F. J. Colloid Interface Sci. 115, 480-492 (1987).
10. Claesson, P. M., Ederth, T., Bergeron, V., Rutland, M. W. (1996) Adv. Colloid Interface Sci. 67, 119-183.
11. Chandhury, M. K., Whitesides, G. M., Langmuir 7, 1013-1025 (1991).
12. Falsafi, A., PhD thesis, "Contact mechanical measurement of block copolymer adhesion" University of Minnesota, Minneapolis, USA, 1998.
13. Johnson, K. L., Kendall, K., Roberts, A. D., Proc. R. Soc. London A. 324, 301-313 (1971).
14. Berg, J. M., Eriksson, L. G. T., Claesson, P. M., Nordli Börve, K. G., Langmuir 10, 1225-1234 (1994).
15. Schaub, M., Wenz, G., Wegner, G., Stein, A., Klemm, D., Adv. Mater. 5, 919-922 (1993).
16. Luengo, G., Pan, J., Heuberger, M., Israelachvili, J. N., Langmuir 14, 3873 (1998)
17. Chen, Y. L., Helm, C. A., Israelachvili, J. N., J. Phys. Chem. 95, 10736-10747 (1991).
18. Chen, Y. L., Helm, C. A., Israelachvili, J. N., Langmuir 7, 2694-2699 (1991).

FSCN/Teknisk Fiberkemi Internet: Http/www.mh.se/fscn
R-00-2 Page 19 (19)
19. Deruelle, M., Léger, L., Tirrell, M., Macromolecules 28, 7419-7428 (1995).
20. Magnipudi, V.S., Tirell, M., Pocius, A. V., J Adhesion Sci. Technol. 8, 1251 (1994)
21. Magnipudi, V.S., Huag, E., Tirell, M., Pocius, A. V., Macromol. Symp. 102, 131 (1996)
22. Falsafi, A., Deprez, P., Bates, F. S., Tirell, M., J. Rheol. 41,1349 (1997)
23. Morra, M., Occhiello, E., Marola, R., Garbassi, F., Humphrey, P., J Colloid Interface Sci. 137, 11-24 (1990)
24. Schultz, J., Norden, M., in "Modern applications to Wettability- Theory and Applications", (M. E. Schrader and G. I. Loeb, Eds.), p. 73. Plenum Press, New York, London, 1992, ISBN 0306433859.
25. Wu,S., "Polymer Interface and Adhesion", p. 188. Marcel Dekker Inc., New York and Basel, 1982., ISBN 0824715330.
26. Wågberg, L, Annergren, G., in "The Fundamentals of Papermaking Materials", (E. F. Baker Ed.), p 23. Pira International, Surrey,UK, (1997), ISBN 1858022096
27. Attard, P., Parker, J., L. Phys. Rev. A 46, 7959-7971 (1992).
28. Israelachvili, J. (1995) "Surface Forces and Microrheology of Molecularly Thin Liquid Films" in "Handbook of Micro/Nano Tribology" (B. Bhushan, Ed.) CRC Press, Boca Raton.
29. Vondracek, P., Gent, A. N. J. Appl. Polym. Sci. 27, 4517-4522 (1982).
30. Gent, A. N., Vondracek, P. J. Appl. Polym. Sci. 27, 4357-4364 (1982).
31. Yasuda, T., Miyama, M., Yasuda, H. Langmuir 8, 1425-1430 (1992).
32. Wang, J.-H., Claesson, P. M., Parker, J. L., Yasuda, H. Langmuir 10, 3887-3897 (1994).
33. Parker, J. L., Claesson, P. M., Wang, J.-H., Yasuda, H. K. Langmuir 10, 2766-2773 (1994).