application of the hybrid harmony search with support vector
TRANSCRIPT
INTERNATIONAL JOURNAL OF OPTIMIZATION IN CIVIL ENGINEERING
Int. J. Optim. Civil Eng., 2013; 3(2):345-358
APPLICATION OF THE HYBRID HARMONY SEARCH WITH
SUPPORT VECTOR MACHINE FOR IDENTIFICATION AND
CALSSIFICATION OF DAMAGED ZONE AROUND
UNDERGROUND SPACES
H. Fattahia, M. A. Ebrahimi Farsangi
a, S. Shojaee
*,†,b, K. Nekooei
c and H. Mansouri
a
aDepartment of Mining Engineering, Shahid Bahonar University of Kerman, Iran bDepartment of Civil Engineering, Shahid Bahonar University of Kerman, Iran
cDepartment of Electrical Engineering Shahid Bahonar University of Kerman, Iran
ABSTRACT
An excavation damage zone (EDZ) can be defined as a rock zone where the rock properties
and conditions have been changed due to the processes related to an excavation. This zone
affects the behavior of rock mass surrounding the construction that reduces the stability and
safety factor and increase probability of failure of the structure. This paper presents an
approach to build a model for the identification and classification of the EDZ. The Support
vector machine (SVM) is a new machine learning method based on statistical learning
theory, which can solve the classification problem with small sampling, non-linearity and
high dimension. However, the practicability of the SVM is influenced by the difficulty of
selecting appropriate SVM parameters. In this study, the proposed hybrid Harmony search
(HS) with the SVM was applied for identification and classification of damaged zone, in
which HS was used to determine the optimized free parameters of the SVM. For
identification and classification of the EDZ, based upon the modulus of the deformation
modulus and using the hybrid of HS with the SVM a model for the identification and
classification of the EDZ was built. To illustrate the capability of the HS-SVM model
defined, field data from a test gallery of the Gotvand dam, Iran were used. The results
obtained indicate that the HS-SVM model can be used successfully for identification and
classification of damaged zone around underground spaces.
Received: 15 January 2013; Accepted: 5 may 2013
* Corresponding author: S. Shojaee, Department of Civil Engineering, Shahid Bahonar University
of Kerman, Iran. †E-mail address: [email protected] (S. Shojaee)
Dow
nloa
ded
from
ijoc
e.iu
st.a
c.ir
at 1
:12
IRS
T o
n W
edne
sday
Jan
uary
31s
t 201
8
H. Fattahi, M. A. Ebrahimi Farsangi, S. Shojaee, K. Nekooei and H. Mansouri
346
KEY WORDS: excavation damaged zone, harmony search, support vector machine,
deformation modulus
1. INTRODUCTION
The excavation damage zone (EDZ) is defined as the zone immediately around an
excavation boundary where the rock mass has been disturbed due to the excavation and
redistribution of stresses [1, 2]. The disturbances can be in the form of creation of new
fractures, closure and opening of pre-existing fractures and redistribution of stresses. During
these processes, the mechanical, hydraulic and physical properties of the rock mass
surrounding the excavation can be considerably affected. The presence of this zone can pose
problems related to stability and seepage and consequently impair the performance and
functionality of the excavation [3]. Various researches about the assessment and
identification of the EDZ with different methods such as displacement measurement,
seismic refraction, direct observation, using borehole camera were carried out worldwide [1,
4-13].
Recently, intelligence system approaches such as the support vector machine (SVM)
have been used successfully for modeling and classification. SVM is a popular pattern
classification method with many diverse applications is an emerging data classification
technique proposed by Vapnik [14], and has been widely adopted in various fields of
classification problems in recent years [15-18].
Kernel parameter setting in the SVM training procedure, along with the feature selection,
significantly influences the classification accuracy. To determine optimized free parameters
of the SVM for the identification and classification, the harmony search (HS) is used while
discovering a subset of features, without reducing the SVM classification accuracy.
Harmony search (HS) is a meta-heuristic search algorithm inspired by the improvisational
process of musicians introduced by Geem et al. [19].
In this paper, an HS-SVM for identification and classification of the EDZ was defined.
To illustrate the capability of the HS-SVM model presented, field data from a test gallery of
the Gotvand dam, Iran were used. According to the authors’ knowledge, application of the
hybrid HS with SVM for identification and classification of damaged zone around
underground spaces is a unique research.
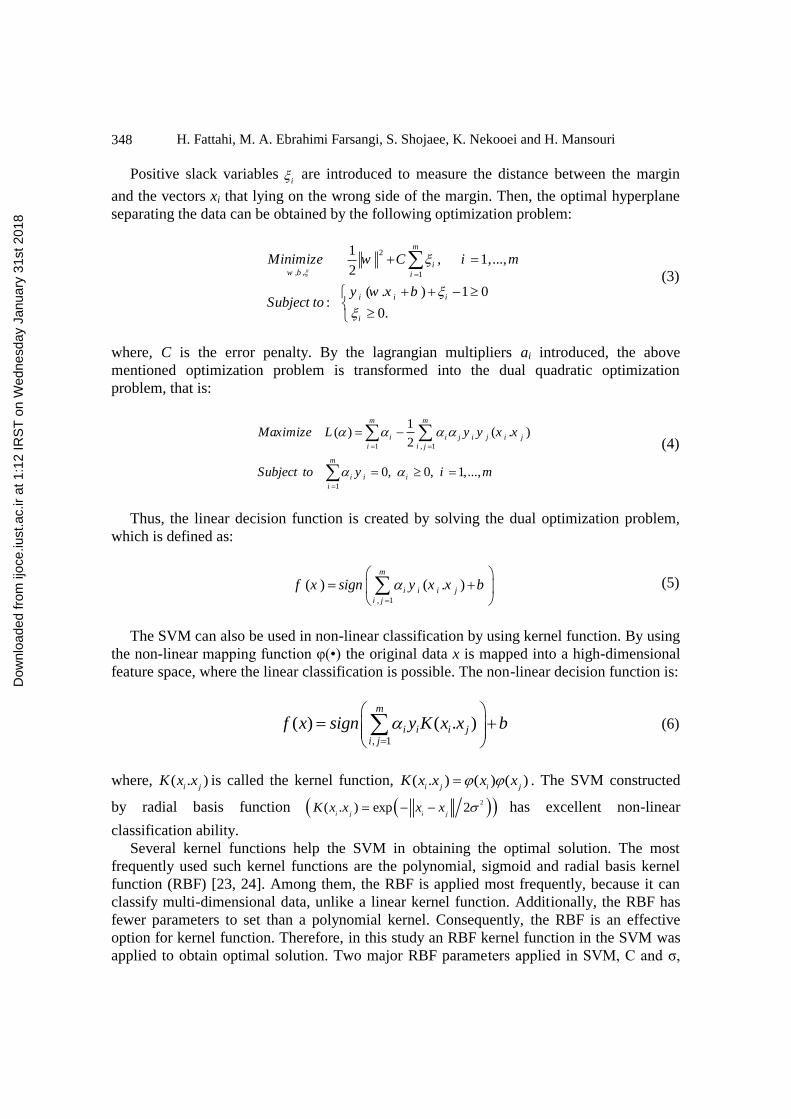
Figure1. Behavior of mass rock surrounding an underground construction
Dow
nloa
ded
from
ijoc
e.iu
st.a
c.ir
at 1
:12
IRS
T o
n W
edne
sday
Jan
uary
31s
t 201
8

APPLICATION OF THE HYBRID HARMONY SEARCH...
347
2. EXCAVATION DAMAGE ZONE
EDZ can be defined as a rock zone where the rock properties and conditions have been
changed due to the processes related to an excavation. This zone affects the behavior of rock
mass surrounding the construction (Figure1), that reduces the stability and safety factor and
increase probability of failure of the structure. Different definitions for the damaged or
disturbed zone have been used [20, 21]. In this paper, the definitions of Tsang et al. [22] for
Excavation disturbed Zone (EdZ), EDZ and Highly Damaged Zone (HDZ) were used.
(Figure2).
Figure 2. Zones around an underground construction
3. SUPPORT VECTOR MACHINE
The purpose of the SVM classification is to find optimal separating hyperplane by
maximizing the margin between the separating hyperplane and the data. Assume that, a set
of data 1{ , }m
i i iT x y is given, where, xi denotes the input vectors, 1, 1iy stands for
two classes, and m is the sample number. It is possible to determine the hyperplane f(x)=0
that separates the given data when two classes are linearly separable:
( ) . 0f x w x b
(1)
where, w denotes the weight vector, and b denotes the bias term. w and b are used to define
the position of separating hyperplane. The separating hyperplane should be satisfying the
constraints:
( ) ( . ) 1, 1,2,...,i i i iy f x y w x b i m
(2)
Dow
nloa
ded
from
ijoc
e.iu
st.a
c.ir
at 1
:12
IRS
T o
n W
edne
sday
Jan
uary
31s
t 201
8
H. Fattahi, M. A. Ebrahimi Farsangi, S. Shojaee, K. Nekooei and H. Mansouri
348
Positive slack variables i are introduced to measure the distance between the margin
and the vectors xi that lying on the wrong side of the margin. Then, the optimal hyperplane
separating the data can be obtained by the following optimization problem:
2
, , 1
1, 1,...,
2
( . ) 1 0:
0.
m
iw b i
i i i
i
Minimize w C i m
y w x bSubject to
(3)
where, C is the error penalty. By the lagrangian multipliers ai introduced, the above
mentioned optimization problem is transformed into the dual quadratic optimization
problem, that is:
1 , 1
1
1( ) ( . )
2
0, 0, 1,...,
m m
i i j i j i j
i i j
m
i i i
i
Maximize L y y x x
Subject to y i m
(4)
Thus, the linear decision function is created by solving the dual optimization problem,
which is defined as:
, 1
( ) ( . )m
i i i j
i j
f x sign y x x b
(5)
The SVM can also be used in non-linear classification by using kernel function. By using
the non-linear mapping function φ(•) the original data x is mapped into a high-dimensional
feature space, where the linear classification is possible. The non-linear decision function is:
, 1
( ) ( . )m
i i i ji j
f x sign y K x x b
(6)
where, ( . )i j
K x x is called the kernel function, ( . ) ( ) ( )i j i j
K x x x x . The SVM constructed
by radial basis function 2( . ) exp 2
i j i jK x x x x has excellent non-linear
classification ability.
Several kernel functions help the SVM in obtaining the optimal solution. The most
frequently used such kernel functions are the polynomial, sigmoid and radial basis kernel
function (RBF) [23, 24]. Among them, the RBF is applied most frequently, because it can
classify multi-dimensional data, unlike a linear kernel function. Additionally, the RBF has
fewer parameters to set than a polynomial kernel. Consequently, the RBF is an effective
option for kernel function. Therefore, in this study an RBF kernel function in the SVM was
applied to obtain optimal solution. Two major RBF parameters applied in SVM, C and σ,
Dow
nloa
ded
from
ijoc
e.iu
st.a
c.ir
at 1
:12
IRS
T o
n W
edne
sday
Jan
uary
31s
t 201
8
APPLICATION OF THE HYBRID HARMONY SEARCH...
349
must be set appropriately. Parameter C represents the cost of the penalty. The choice of a
value for C influences on the classification outcome. If C is too large, then the classification
accuracy rate is very high in the training phase, but very low in the testing phase. If C is too
small, then the classification accuracy rate unsatisfactory, making the model useless.
Parameter σ has a much greater influence on classification outcomes than C, because its
value affects the partitioning outcome in the feature space. An excessively large value for
parameter σ results in over-fitting, while a disproportionately small value leads to under-
fitting [25].
4. PARAMETERS OPTIMIZATION OF SVM BASED ON HS
The value of parameters C and σ that lead to the highest classification accuracy rate in this
interval can be found by setting appropriate values for the upper and lower bounds (the
search interval) and the jumping interval in the search. Meta-heuristic approaches are
commonly employed to help in looking for the best feature subset. Although meta-heuristic
approaches are slow, they obtain the (near) best feature subset. Jack and Nandi [26] and
Shon et al. [27], employed Genetic algorithm (GA) to screen the features of a dataset. The
selected subset of features is then fed into the SVM for classification testing. Zhang et al.
[28] developed a GA-based approach to discover a beneficial subset of features for the SVM
in machine condition monitoring. Samanta et al. [29] proposed a GA approach to modify the
RBF width parameter of the SVM with feature selection. Nevertheless, since these
approaches only consider the RBF width parameter for the SVM, they may miss the optimal
parameter setting. Huang and Wang [30] presented a GA-based feature selection and
parameters optimization for the SVM. Moreover, Huang et al. [31] utilized the GA-based
feature selection and parameter optimization for credit scoring. Also, various researchers
presented a particle swarm optimization (PSO)-based feature selection and parameters
optimization for the SVM [32-38].
In this study, the selection of the parameters C and σ has a great influence on the
performance of the SVM. The HS was used to determine the optimized C and σ, is based on
natural musical performance, a process that searches for a perfect state of harmony. The
harmony in music is analogous to the optimization solution vector, and the musician’s
improvisations are analogous to local and global search schemes in optimization techniques.
The HS algorithm does not require initial values for the decision variables and uses a
stochastic random search that is based on the harmony memory considering rate and the
pitch adjusting rate. The method is very easy to implement, and there are few parameters to
adjust.
Here, the harmony is composed of the parameters C and σ. Figure3 presents the process
of optimizing the SVM parameters with the HS, which is described below:
(1) Definition: The optimization problem can be defined as:
Minimize f(x) subject to ( 1,2,..., )iL i iUx x x i N where, xiL and xiU are the lower
and upper bounds for decision variables.
The HS algorithm parameters are also specified in this step. They are the harmony
memory size (HMS) or the number of solution vectors in harmony memory, harmony
Dow
nloa
ded
from
ijoc
e.iu
st.a
c.ir
at 1
:12
IRS
T o
n W
edne
sday
Jan
uary
31s
t 201
8

H. Fattahi, M. A. Ebrahimi Farsangi, S. Shojaee, K. Nekooei and H. Mansouri
350
memory considering rate (HMCR), distance band width (bw), pitch adjusting rate (PAR),
and the number of improvisations (K), or stopping criterion. K is the same as the total
number of function evaluations.
(2) Initialization. The HS is initialized in the harmony memory (HM). The harmony
memory is a memory location where, all the solution vectors (sets of decision variables) are
stored. The initial harmony memory is randomly generated in the region [xiL, xiU](i=1, 2,. . .,
N). This is done based on the following equation:
() ( ) 1,2,...,ji iL iU iLx x rand x x j HMS
(7)
where rand() is a random number from a uniform distribution of [0,1].
(3) Improvise a new harmony from the harmony memory. Generating a new harmony new
ix is called improvisation where it is based on 3 rules: memory consideration, pitch
adjustment and random selection. First of all, a uniform random number r1 is generated in
the range [0, 1]. If r1 is less than HMCR, the decision variable new
ix is generated by the
memory consideration; otherwise, new
ix is obtained by a random selection. Then, each
decision variable new
ix will undergo a pitch adjustment with a probability of PAR if it is
produced by the memory consideration. The pitch adjustment rule is given as follows:
new newi ix x r bw
(8)
where, r is a uniform random number between 0 and 1.
(4) Training the SVM model and fitness evaluation. The SVM model is trained with the
parameters C and σ included in current harmony. The fivefold cross validation, which offers
the best compromise between computational cost and reliable parameter estimates, is used
to evaluate fitness. In fivefold cross validation, the training data set is randomly divided into
5 mutually exclusive subsets of approximately equal size, in which 4 subsets are used as the
training set and the last subset is used as validation. The above-mentioned procedure is
repeated 5 times, so that each subset is used once for validation. The fitness function is
defined as the 1-CAvalidation of the fivefold cross validation method on the training data set,
which is formulated in the form of Eq. (9). The solution with a bigger CAvalidation has a
smaller fitness value.
5
1
11 1 100%
5c
validationi c f
yFitness CA
y y
(9)
where, yc and yf represent the number of true and false classifications, respectively.
(5) Update harmony memory. After a new harmony vector xnew
is generated, the harmony
memory will be updated. If the fitness of the improvised harmony vector
1 2( , ,..., )new new new new
Nx x x x is better than that of the worst harmony, the worst harmony in
Dow
nloa
ded
from
ijoc
e.iu
st.a
c.ir
at 1
:12
IRS
T o
n W
edne
sday
Jan
uary
31s
t 201
8

APPLICATION OF THE HYBRID HARMONY SEARCH...
351
the HM will be replaced with xnew
and become a new member of the HM.
(6) Termination. Repeat steps 3-5 until the stopping criterion (maximum number of
improvisations K) is met.
Figure 3. The process of optimizing the SVM parameters with the HS
5. SITE DESCRIPTIONS AND GEOLOGY
The tests carried out at Gotvand dam, which is located on the Karun river in the Khuzestan
province, south west of Iran. This dam with 178 m height and 730 m length of embankment,
regulates the water of the Karun river, also serves power generation, flood control and
irrigation needs [39].
The geology of area is mainly including two formations; Bakhtiary (BK) and Aghajari
(AJ). The BK formation is consisted of conglomerate, cherty limestone and inter bedded
mudstones and sandstone [40]. The AJ formation contains 2 to 5 m thick layers of gray and
greenish gray sandstones, inter bedded claystone, siltstone and brow reddish marlstone [39].
Also, laboratory testing was performed on rock samples from boreholes. A summary of
results obtained are shown in Table 1.
Dow
nloa
ded
from
ijoc
e.iu
st.a
c.ir
at 1
:12
IRS
T o
n W
edne
sday
Jan
uary
31s
t 201
8

H. Fattahi, M. A. Ebrahimi Farsangi, S. Shojaee, K. Nekooei and H. Mansouri
352
Table 1: Summary results of the rock laboratory testing for Gotvand dam [41]
Formati
on Rock type
UCS
(MP
a)
Tensil
Strength
(MPa)
Dry
density
(g/cm3)
Porosity
(%)
Youn
g's
modul
us
(GPa)
Wave velocity (m/s)
Vp Vs
AJ
Claystone 16 1.90 2.31 19.5 2.28 1270-2800 820-2330
Siltstone 16.1 1.95 2.30 16.4 2.6 1800-2800 1520-2280
Sandstone 41.9 3.20 2.49 2.1 11.2 3960-4480 2560-2780
BK
Mudstone 25.2 2.51 2.22 18.7 4.95
Sandstone 15.6 2 12.3 2.1 2180 1530
Conglomerate 25.8 2.8 2.48 7.5 13.6 2620-5000 1800
6. DETERMINATION OF DEFORMATION MODULUS BY PLATE LOADING
TEST
The creation of EDZ due to a blasting impact and stress redistribution after excavation
causes significant changes on the mechanical and physical properties and hydraulic
conductivity around an underground excavation. The modulus of deformation (E) is an
important parameter among other parameters that represents the behavior rock mass after
excavation, which can be used for the identification and classification of the EDZ.
The plate loading test (PLT) is the most familiar in situ experiment in rock mass
studying. It is generally conducted in special test galleries or underground spaces excavated
by conventional drill and blast, having a span of 2 m and a height of 2.5 m [42]. In the PLT,
load is directly imposed on the wall of gallery, and the resultant displacement is measured
on the loading point in rock [43]. The recoverable displacement is used to evaluate the
deformation modulus based on the theory of elasticity. Depending on the loading condition,
the PLT can be classified into two types of flexible and rigid [44]. In this paper, the flexible
PLT was adopted. An illustration of a PLT site is shown in Figure 4.
Figure 4. The set-up of PLT
Dow
nloa
ded
from
ijoc
e.iu
st.a
c.ir
at 1
:12
IRS
T o
n W
edne
sday
Jan
uary
31s
t 201
8

APPLICATION OF THE HYBRID HARMONY SEARCH...
353
The PLT was carried out in a test gallery, excavated by drill and blast, at Gotvand dam to
determine deformation modulus for the identification and classification of the EDZ.
7. IDENTIFICATION AND CLASSIFICATION OF THE EDZ AND HDZ, USING
THE HS-SVM MODEL
Popular methods in the SVM multi-class classification are including: ‘one-against-one’ and
‘binary tree’. The ‘binary tree’ SVM classification algorithm needs only k -1 two-class SVM
classifiers for a case of k classes, while the ‘one-against-all’ SVM classification algorithm
needs k two-class SVM classifiers where each one is trained with all of samples and the
‘one-against-one’ SVM classification algorithm needs k(k -1)/2 two-class SVM classifiers
where each one is trained on data from two classes [33]. Obviously less two-class classifiers
expedite the rate of training and recognition. In this paper, the ‘binary tree’ SVM
classification algorithm is adapted for identification and classification of the EDZ and HDZ,
using the MATLAB environment (Figure5).
The modulus of deformation for rock mass in the Gotvand dam is 5.8 GPa [45]. As the
EdZ is a zone without major changes in flow and transport properties [22] and there are no
negative influence on the long-term safety [10], a modulus of deformation of 5 GPa is
assumed for this zone. Also, a threshold of less than 2 GPa was chosen to recognize the
HDZ, which is a part of the EDZ. As shown in Figure5, the diagnostic model includes two
SVM classifiers, which are used to identify the following three states: E ≤ 2 (HDZ), E > 5
(EdZ) and 2 < E ≤ 5 (a part of the EDZ).
Figure 5. Diagnostic model of the HDZ, EDZ and EdZ based on the HS-SVM classifiers
Dow
nloa
ded
from
ijoc
e.iu
st.a
c.ir
at 1
:12
IRS
T o
n W
edne
sday
Jan
uary
31s
t 201
8

H. Fattahi, M. A. Ebrahimi Farsangi, S. Shojaee, K. Nekooei and H. Mansouri
354
In all training data sets of the three states, the HS-SVM1 is trained to separate the EdZ
from the EDZ. When input of the HS-SVM1 is a sample representing the EdZ, output of the
HS-SVM1 is set to +1; otherwise -1. With samples of the EDZ, the HS-SVM2 is trained to
separate a part of the EDZ from the HDZ. When input of the HS-SVM2 is a sample
representing a part of the EDZ, output of the HS-SVM2 is set to +1; otherwise -1. Thus,
diagnostic model of the HDZ, EDZ and EdZ based on the HS-SVM classifiers is obtained,
which is shown in Figure5. As it can be seen in Figure5, X, Y and Z coordinates (location of
installation extensometers from the portal of test gallery that in these points, displacements
and modulus of deformations are obtained) were introduced as input parameters into the
HS-SVM model and deformation modulus as output.
The total data (99 data sets obtained from a test gallery in the Gotvand dam, Iran) are
divided into two data sets: the training data (80 data sets) and the testing data (19 data sets),
in which the training data sets are used to calculate the fitness function and train the SVM,
and the testing data sets are used to examine the classification accuracy. A few samples of
data sets for training and testing are presented in Tables 2 and 3.
Table 2: A few samples for training the HS-SVM model
No. Depth of extensometer in
instrumentation hole (m)
Input Output
X (m) Y (m) Z (m) Deformation
modulus (GPa)
1 0.5 6 7.75 3 3.18
2 1 6 8.25 3 6.48
3 0.4 7.65 6 9 7.75
4 1.2 8.45 6 9 14.9
5 0.4 7.65 6 27 4.3
6 0 6 7.25 9 2.11
7 0.9 6 3.85 27 9.42
8 2.3 9.55 6 3 24.95
9 0.4 7.65 6 27 4.32
10 0.5 6 4.25 9 3.33
Table 3: A few samples for testing the HS-SVM model
No. Depth of extensometer in
instrumentation hole (m)
Input Output
X (m) Y (m) Z (m) Deformation
modulus (GPa)
1 0 6 7.25 3 0.955
2 0.6 4.15 6 3 9.274
3 0.9 6 3.85 3 2.55
4 0.5 6 7.75 27 3.829
5 1.2 3.55 6 27 9.66
Both SVMs adopt RBF as their kernel function. In HS-SVM, the parameters σ, C of
SVM model are optimized by HS. The related parameters C and σ for this kernel were
varied in the arbitrarily fixed ranges [1, 3000] and [0, 5] so that to cover high and small
regularization of the classification model, and fat as well as thin kernels, respectively. In the
Dow
nloa
ded
from
ijoc
e.iu
st.a
c.ir
at 1
:12
IRS
T o
n W
edne
sday
Jan
uary
31s
t 201
8

APPLICATION OF THE HYBRID HARMONY SEARCH...
355
harmony search, there are several coefficients which their values can be adjusted to produce
a better rate of convergence. Table 4 shows the coefficient values in the HS.
Table 4: Coefficient values in the HS.
Maximum number of iterations 100
Harmony memory size (HMS) 30
Number of new harmonies 10
Harmony memory consideration rate (HMCR) 0.95
Pitch adjustment rate (PAR) 0.3
Band width (bw) bw, max=59.98
bw, min=0.1
The adjusted parameters (σ, C) with maximal classification accuracy are selected as the
most appropriate parameters. Then, the optimal parameters are utilized to train the SVM
model. The classification accuracies and optimal parameters of SVM classifiers estimated
by the HS are given in Table 5.
Table 5: The classification accuracies and optimal parameters of SVM classifiers estimated by
HS
Optimal values of σ
parameters
Optimal values of C
parameters
Optimal classification
accuracies of SVM %
HS-SVM1 3.06 1995.89 99.6
HS-SVM2 0.645 2118.93 98.4
The SVM classifiers with the best accuracies were obtained to assess the potential of
creating the EDZ and HDZ around a test gallery in the Gotvand dam. For instance, the EDZ
and HDZ around 6-section with different distances (Z = 3 m, Z = 5m, Z = 10 m, Z = 12 m, Z
= 16 m and Z = 22 m) from the portal of the gallery were obtained, as shown in Figure 6. In
these sections, the data generating was carried out, using the MATLAB environment.
Figure 6. The EDZ and HDZ around different sections of a gallery, Gotvand dam
Dow
nloa
ded
from
ijoc
e.iu
st.a
c.ir
at 1
:12
IRS
T o
n W
edne
sday
Jan
uary
31s
t 201
8

H. Fattahi, M. A. Ebrahimi Farsangi, S. Shojaee, K. Nekooei and H. Mansouri
356
In Figure 6, the orange region shows the HDZ (E ≤ 2), while the violet region is the EDZ
(E ≤ 5). According to the results of the HS-SVM modeling, the EDZ at the test gallery
around the Gotvand dam extends approximately 0.5-1 m into the rock mass.
7. CONCLUSION
In rock mechanics engineering, the study of the EDZ and HDZ is very important in terms of
the economy, stability and safety; because, these zones affect the behavior of mass rock
surrounding the underground spaces, which reduces the stability and safety factor of the
underground structure.
In this paper a new approach for the identification and classification of zones (EDZ and
HDZ) around underground spaces was proposed and the following remarks were concluded:
In the HS-SVM model, the HS is used to select suitable parameters for the SVM
classifier, which avoids over-fitting or under-fitting of the SVM model occurring because
of the improper determining of these parameters.
Based upon the results of the HS-SVM modeling, the extent of the EDZ at the test gallery
around the Gotvand dam is approximately 0.5-1 m into the rock mass.
The HS-SVM modeling as a good tool can estimate the damage occurred due to blasting
around each section of an underground excavation.
REFERENCES
1. Sato T, Kikuchi T, Sugihara K. In-situ experiments on an excavation disturbed zone
induced by mechanical excavation in Neogene sedimentary rock at Tono mine, central
Japan, Eng Geol, 2000; 56(1–2): 97–108.
2. Sheng Q, Yue ZQ, Lee CF, Tham LG, Zhou H. Estimating the excavation disturbed
zone in the permanent shiplock slopes of the Three Gorges Project, China, Int J Rock
Mech Min Sci, 2002; 39(2): 165–84.
3. Saiang D. Behaviour of blast-induced damage zone around underground excavations in
hard rock mass, Ph.D. Thesis. Lulea˚, Lulea˚University of Technology, Sweden, 2008.
4. Malmgren L, Saiang D, Töyrä J, Bodare A. The excavation disturbed zone (EDZ) at
Kiirunavaara mine, Sweden-by seismic measurements, J Appl Geophys, 2007; 61(1): 1–
15.
5. Nicollin F, Gibert D, Bossart P, Nussbaum C, Guervilly C. Seismic tomography of the
excavation damaged zone of the gallery 04 in the Mont Terri rock laboratory, Geophys
J Int, 2008; 172(1): 226–39.
6. Cai M, Kaiser PK, Martin CD. Quantification of rock mass damage in underground
excavations from microseismic event monitoring, Int J Rock Mech Min Sci, 2001;
38(8): 1135–1145.
7. Suzuki K, Nakata E, Minami M, Hibino E, Tani T, Sakakibara J, et al. Estimation of
the zone of excavation disturbance around tunnels, using resistivity and acoustic
tomography, Explor Geophys, 2004; 35(1): 62–9.
Dow
nloa
ded
from
ijoc
e.iu
st.a
c.ir
at 1
:12
IRS
T o
n W
edne
sday
Jan
uary
31s
t 201
8

APPLICATION OF THE HYBRID HARMONY SEARCH...
357
8. Kwon S, Lee CS, Cho SJ, Jeon SW, Cho WJ. An investigation of the excavation
damaged zone at the KAERI underground research tunnel, Tunn Undergr Sp Tech,
2009; 24(1): 1–13.
9. Bossart P, Meier PM, Moeri A, Trick T, Mayor JC. Geological and hydraulic
characterisation of the excavation disturbed zone in the Opalinus clay of the Mont Terri
Rock Laboratory, Eng Geol, 2002; 66(1–2): 19–38.
10. Blümling P, Bernier F, Lebon P, Derek Martin C. The excavation damaged zone in clay
formations time-dependent behaviour and influence on performance assessment, Phys
Chem Earth, 2007; 32(8–14): 588–99.
11. Saiang D, Nordlund E. Numerical analyses of the influence of blast-induced damaged
rock around shallow tunnels in brittle rock, Rock Mech Rock Eng, 2009; 42(3): 421–48.
12. Saiang D. Stability analysis of the blast-induced damage zone by continuum and
coupled continuum–discontinuum methods, Eng Geol, 2010; 116(1): 1–11.
13. Potyondy DO, Cundall PA. A bonded-particle model for rock, Int J Rock Mech Min Sci,
2004; 41(8): 1329–1364.
14. Vapnik V. The nature of statistical learning theory, springer, 1999.
15. Cao LJ, Tay FE. Support vector machine with adaptive parameters in financial time
series forecasting, IEEE T Neural Networ, 2003; 14(6): 1506–1518.
16. Huang CJ, Lai WK, Luo RL, Yan YL. Application of support vector machines to
bandwidth reservation in sectored cellular communications, Eng Appl Artif Intel, 2005;
18(5): 585–94.
17. Ng J, Gong S. Composite support vector machines for detection of faces across views
and pose estimation, Image Vision Comput, 2002; 20(5): 359–68.
18. Shin KS, Lee TS, Kim HJ. An application of support vector machines in bankruptcy
prediction model, Expert Syst Appl, 2005; 28(1): 127–35.
19. Geem Z, Kim J, Loganathan G. Harmony search optimization: application to pipe
network design, IJMOS, 2002; 22(2): 125–33.
20. Bäckblom G, Martin CD. Recent experiments in hard rocks to study the excavation
response: Implications for the performance of a nuclear waste geological repository,
Tunn Undergr Sp Tech, 1999; 14(3): 377–94.
21. Martino JB, Chandler NA. Excavation-induced damage studies at the underground
research laboratory, Int J Rock Mech Min Sci, 2004; 41(8): 1413–26.
22. Tsang CF, Bernier F, Davies C. Geohydromechanical processes in the Excavation
Damaged Zone in crystalline rock, rock salt, and indurated and plastic clays-in the
context of radioactive waste disposal, Int J Rock Mech Min Sci, 2005; 42(1): 109–25.
23. Liao Y, Fang SC, LW Nuttle H. A neural network model with bounded-weights for
pattern classification, Comput Oper Res, 2004; 31(9): 1411–1426.
24. Muller KR, Mika S, Ratsch G, Tsuda K, Scholkopf B. An introduction to kernel-based
learning algorithms, IEEE T Neural Networ, 2001; 12(2): 181–201.
25. Pardo M, Sberveglieri G. Classification of electronic nose data with support vector
machines, Sens Actuators B Chem, 2005; 107(2): 730–7.
26. Jack L, Nandi A. Fault detection using support vector machines and artificial neural
networks, augmented by genetic algorithms, Mech Syst Signal Pr, 2002; 16(2): 373–90.
27. Shon T, Kim Y, Lee C, Moon J. A machine learning framework for network anomaly
Dow
nloa
ded
from
ijoc
e.iu
st.a
c.ir
at 1
:12
IRS
T o
n W
edne
sday
Jan
uary
31s
t 201
8

H. Fattahi, M. A. Ebrahimi Farsangi, S. Shojaee, K. Nekooei and H. Mansouri
358
detection using svm and ga, In: Information Assurance Workshop, 2005, pp. 176–183
28. Zhang L, B Jack L, Nandi AK. Fault detection using genetic programming, Mech Syst
Signal Pr, 2005; 19(2): 271–89.
29. Samanta B, Al-Balushi K, Al-Araimi S. Artificial neural networks and support vector
machines with genetic algorithm for bearing fault detection, Eng Appl Artif Intel, 2003;
16(7): 657–65.
30. Huang CL, Wang CJ. A GA-based feature selection and parameters optimizationfor
support vector machines, Expert Syst Appl, 2006; 31(2): 231–40.
31. Huang CL, Chen MC, Wang CJ. Credit scoring with a data mining approach based on
support vector machines, Expert Syst Appl, 2007; 33(4): 847–56.
32. Huang CL, Dun JF. A distributed PSO–SVM hybrid system with feature selection and
parameter optimization, Appl Soft Comput, 2008; 8(4): 1381–1391.
33. Fei Sw. Diagnostic study on arrhythmia cordis based on particle swarm optimization-
based support vector machine, Expert Syst Appl, 2010; 37(10): 6748–6752.
34. Ranaee V, Ebrahimzadeh A, Ghaderi R. Application of the PSO-SVM model for
recognition of control chart patterns, ISA T, 2010; 49(4): 577.
35. Jiang A, Wang S, Tang S. Feedback analysis of tunnel construction using a hybrid
arithmetic based on Support Vector Machine and Particle Swarm Optimisation,
Automat Constr, 2011; 20(4): 482–89.
36. Gang R, Zhuping Z. Traffic safety forecasting method by particle swarm optimization
and support vector machine, Expert Syst Appl, 2011; 38(8): 10420–10424.
37. Chenglin Z, Xuebin S, Songlin S, Ting J. Fault diagnosis of sensor by chaos particle
swarm optimization algorithm and support vector machine, Expert Syst Appl, 2011;
38(8): 9908–9912.
38. Lin SW, Ying KC, Chen SC, Lee ZJ. Particle swarm optimization for parameter
determination and feature selection of support vector machines, Expert Syst Appl, 2008;
35(4): 1817–1824.
39. Moshanir, CAITEC. Upper Gotvand hydroelectric power project. Gotvand1997.
40. Mahab Ghodss, Coyne et Bellier. Geology of the project area: upper Gotvand dam &
HEPP, Rev A. 2005.
41. Mahab Ghodss, Coyne et Bellier. Geotechnical characteristics of the dam foundation.
Rev A2004.
42. Palmström A, Singh R. The deformation modulus of rock masses - comparisons
between in situ tests and indirect estimates, Tunn Undergr Sp Tech, 2001; 16(2): 115–
31.
43. Faramarzi L, Sugawara K. Analyzing of the representative length of rock mass
subjected to load by In situ loading tests to evaluation of rock mass deformation
modulus, 4th Asian Rock Mechanics Symposium, Singapore, pp. 273–281
44. Rocha M, Dasilva JN. A new method for the determination of deformability in rock
masses, International Society of Rock Mechanics, Proceedings, 1970; 1(1–19).
45. Bashari A, Beiki M, Talebinejad A. Estimation of deformation modulus of rock masses
by using fuzzy clustering-based modeling, Int J Rock Mech Min Sci, 2011; 48(8): 1224–
1234.
Dow
nloa
ded
from
ijoc
e.iu
st.a
c.ir
at 1
:12
IRS
T o
n W
edne
sday
Jan
uary
31s
t 201
8