application of survival ratio for monocyclic process of ... and epidemiology application of survival...
TRANSCRIPT

Ecology and Epidemiology
Application of Survival Ratio for Monocyclic Process of Hemileia vastatrixin Predicting Coffee Rust Infection Rates
A. C. Kushalappa, M. Akutsu, and A. Ludwig
First two authors, Departamento de Fitopatologia, and third author, Centro de Processamento de Dados, Universidade Federal de Vilosa,Minas Gerais, 36.570, Brazil.
This project was financed by Universidade Federal de Vigosa and Financiadora de Estudos e Projetos, Brazil.The authors thank G. M. Chaves for suggestions during the course of this study, R. F. Euclydes for running the LEAFAL computer
program, A. K. Shashi for assisting with field data collection, and D. G. Francis for introducing them to path analysis.Accepted for publication 14 April 1982.
ABSTRACT
Kushalappa, A. C., Akutsu, M., and Ludwig, A. 1983. Application of survival ratio for monocyclic process of Hemileia vastatrix in predicting coffee rustinfection rates. Phytopathology 73: 96-103.
Apparent infection rates corrected for leaf formation (p") were based on the proportion of rainy and windy days (for 28 days before DP)determined based on proportion of leaves (PLR) and leaf area rusted multiplied by the proportion of leaf density. The monocyclic process(PRA) on 60 branches marked among 15 plants on 1 ha of cultivar Mundo equivalents for environment (MPEE) related to the whole monocyclicNovo coffee in Vifosa, Minas Gerais, Brazil, at 14-day intervals from process was derived from MPEE = DISEE X INFEE. The inoculum wasAugust 1978 to July 1980. Hourly temperature and leaf wetness were quantified as the proportion of leaf area occupied by visible spores andrecorded and the data were transformed to infection equivalents for proportion of spore area index (PSAI). The calculated proportion of sporesenvironment (INFEE) and to dissemination equivalents for environment surviving dissemination and able to cause infection was designated as the(DISEE). The INFEE was determined by laboratory experiments to be the proportion of infective spore area index, PISAI = PSAI X DISEE Xproductofinfectionequivalentsforhoursoffreewaterandfortemperature, INFEE. The following regression equations were developed to predictwhich were calculated from the function of hours of free water and of coffee rust infection rates: Y, = 2.0804 + 0.1533Xi + 0.0852X 2 (r
2 = 0.72),
temperature, respectively, for infection, as determined by laboratory2 and Y2 = 1.393 + 0.1149X1 + 0.0708X 2 (r2 = 0.49), in which Yis p" for 28
experiments. The functions are Y= 1 - 1.996 exp (- 0. 1089t) and Y = sin days after the date of prediction ( Y, is based on PLR, Y2 is based on PRA),(188.lx - 41.6x 2
- 151.3x 3), respectively, in which Y and Y' are the X, islogit PISAI and X2is host available for infection,-logit xy when xy isproportions of maximum infection observed (= INFEE), x is the PLR or PRA on the date of prediction corrected for leaf formation duringSchri~dter's temperature equivalent, and t is hours of free water. DISEE was the 28 days after the date of prediction.
Additional key words: Coffea arabica, epidemiology, prediction model.
Multiple regression analysis has been used to predict functions of environment for subprocesses developed bydevelopment of coffee rust (1,8,9,17) and other plant diseases laboratory experiments. Meteorological field data have been(4,6,7). The disadvantages of using multiple regression to predict transformed to subprocess equivalents for environment andplant disease development also have been reported (5). In the survival ratios for monocyclic process using biological field data,regression models developed to predict coffee and wheat rusts (1,4, which were used in combination with data representing the amount6,7,9,17), the combinations of independent variables have been of host tissue available for infection to develop a multiplebased on meteorological rather than biological functions. regression model for predicting coffee rust infection rates. TheFurthermore, variables relating to a single function have often been cause and effect of independent variables for the best-fitting modelrepeated, which makes the model less stable. These models are have been quantified by using path analysis (13).unlikely to describe paths of causation in biological systemsbecause the relationship among variables in multiple regression MATERIALS AND METHODSmodels is a sum of linear functions and because the independentvariables themselves are principally meteorological and thus are Laboratory experiments. The influence of temperature andnot directly related to disease development. However, certain hours of free water on infection were studied under laboratorycombinations or sequences of meteorological factors at known conditions. Young, completely expanded leaves of 6-mo-oldtime intervals may control the progress of various epidemiological seedlings of Coffea arabica L. 'Mundo Novo' were inoculated withprocesses and thus should relate directly to disease development, a suspension (2 mg/ml) of freshly collected urediniospores ofespecially when paths of pathogen actions are synchronized. Hemileia vastatrix race II in 0.12% Tween-80. The spore
Many simulation models define the functional relationship suspension was atomized onto the seedlings, and they were placedinvolved among various subprocesses of a monocyclic process. in a humidity chamber without lights at 21 ± 2 C. The seedlingsZadoks and Schein (20) used principles of ecology to evaluate were removed from the humidity chamber at various time intervals,resistance. They quantified horizontal resistance as survival ratios dried with a fan for 60 min, and then kept in the dark until thefor successful completion of various subprocesses of a monocyclic longest moisture treatment (48 hr) was completed. Each treatmentprocess. consisted of five pairs of leaves, one in each of five seedlings or
In the present study, the environment related to three replicates. The experiment was repeated twice. The seedlings weresubprocesses (sporulation, dissemination, and infection) of the then transferred to a greenhouse and the numbers of lesions formedmonocyclic process of Hemileia vastatrix Berk & Br. have been were counted after 40 days. The mean number of lesions per leaf forquantified as subprocess equivalents for environment based on the each period of free water on the leaves was represented as a
proportion of the maximum number of lesions observed, and anThe publication costs of this article were defrayed in part by page charge payment. This exponential fit to the data was estimated by using a computerarticle must therefore be hereby marked "advertisement" in accordance with 18 U.S.C. § program SPSS (16). The equations were designated here as1734 solely to indicate this fact. functions of environment (for temperature and for hours of free0031-949X/83/01009608/$03.00/0 water) for infection, FEINF (acronyms not defined in the text are01983 The American Phytopathological Society defined in a footnote to Fig. 1).
96 PHYTOPATHOLOGY
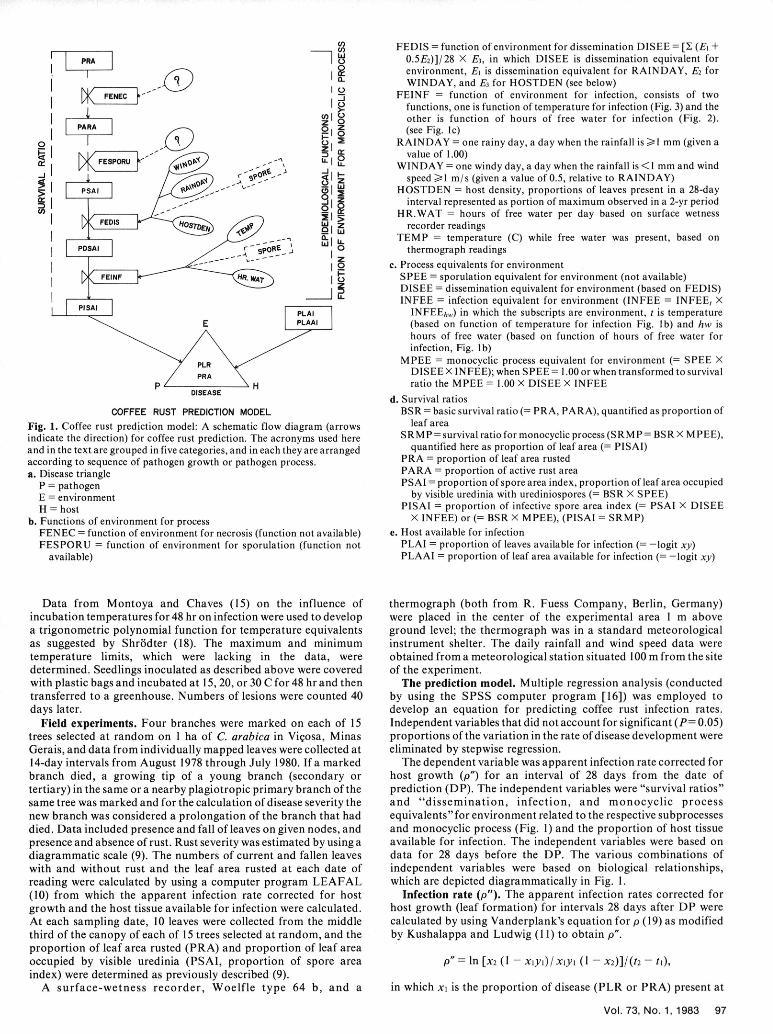
(n FEDIS = function of environment for dissemination DISEE = [Y (Ei +0.5E2)]/28 X E3, in which DISEE is dissemination equivalent for
I environment, El is dissemination equivalent for RAINDAY, E 2 for-•" WINDAY, and E3 for HOSTDEN (see below)
I FEINF = function of environment for infection, consists of twoPR functions, one is function of temperature for infection (Fig. 3) and the
other is function of hours of free water for infection (Fig. 2).0A A(see Fig. 1c)
o [RAINDAY = one rainy day, a day when the rainfall is >1 mm (given a=) it value of 1.00)S FESPORU1.o -_ WINDAY = one windy day, a day when the rainfall is <I mm and wind
.. s• speed >I m/s (given a value of 0.5, relative to RAINDAY)PSAI -- I HOSTDEN = host density, proportions of leaves present in a 28-day
9 interval represented as portion of maximum observed in a 2-yr periodo_ HR.WAT = hours of free water per day based on surface wetnessFEDISOSo V W Z recorder readings
a . TEMP = temperature (C) while free water was present, based onPD A S-0_. 0 0' thermograph readings
z0 C. Process equivalents for environmentFEINF Hk WAT SPEE = sporulation equivalent for environment (not available)
DISEE = dissemination equivalent for environment (based on FEDIS)PISAI U_ INFEE = infection equivalent for environment (INFEE = INFEE, X
INFEEhw) in which the subscripts are environment, t is temperatureE(based on function of temperature for infection Fig. lb) and hw is
hours of free water (based on function of hours of free water forinfection, Fig. lb)
MPEE = monocyclic process equivalent for environment (= SPEE XPRA DISEE X INFEE); when SPEE = 1.00 or when transformed to survival
ratio the MPEE = 1.00 X DISEE X INFEEd. Survival ratios
COFFEE RUST PREDICTION MODEL BSR = basic survival ratio (= PRA, PARA), quantified as proportion ofFig. 1. Coffee rust prediction model: A schematic flow diagram (arrows leaf areaindicate the direction) for coffee rust prediction. The acronyms used here SRMP = survival ratio for monocyclic process (SRMP= BSR X MPEE),and in the text are grouped in five categories, and in each they are arranged quantified here as proportion of leaf area (= PISAI)according to sequence of pathogen growth or pathogen process. PRA = proportion of leaf area rusteda. Disease triangle PARA = proportion of active rust area
P = pathogen PSAI = proportion of spore area index, proportion of leaf area occupiedE = environment by visible uredinia with urediniospores (= BSR X SPEE)H = host PISAI = proportion of infective spore area index (= PSAI X DISEE
b. Functions of environment for process X INFEE) or (= BSR X MPEE), (PISAI = SRMP)FENEC = function of environment for necrosis (function not available) e. Host available for infectionFESPORU = function of environment for sporulation (function not PLAI = proportion of leaves available for infection (= -logit xy)
available) PLAAI = proportion of leaf area available for infection (= -logit xy)
Data from Montoya and Chaves (15) on the influence of thermograph (both from R. Fuess Company, Berlin, Germany)incubation temperatures for 48 hr on infection were used to develop were placed in the center of the experimental area 1 m abovea trigonometric polynomial function for temperature equivalents ground level; the thermograph was in a standard meteorologicalas suggested by Shrbdter (18). The maximum and minimum instrument shelter. The daily rainfall and wind speed data weretemperature limits, which were lacking in the data, were obtained from a meteorological station situated 100 m from the sitedetermined. Seedlings inoculated as described above were covered of the experiment.with plastic bags and incubated at 15, 20, or 30 C for 48 hr and then The prediction model. Multiple regression analysis (conductedtransferred to a greenhouse. Numbers of lesions were counted 40 by using the SPSS computer program [16]) was employed todays later. develop an equation for predicting coffee rust infection rates.
Field experiments. Four branches were marked on each of 15 Independent variables that did not account for significant (P= 0.05)trees selected at random on 1 ha of C. arabica in Vigosa, Minas proportions of the variation in the rate of disease development wereGerais, and data from individually mapped leaves were collected at eliminated by stepwise regression.14-day intervals from August 1978 through July 1980. If a marked The dependent variable was apparent infection rate corrected forbranch died, a growing tip of a young branch (secondary or host growth (p") for an interval of 28 days from the date oftertiary) in the same or a nearby plagiotropic primary branch of the prediction (DP). The independent variables were "survival ratios"same tree was marked and for the calculation of disease severity the and "dissemination, infection, and monocyclic processnew branch was considered a prolongation of the branch that had equivalents" for environment related to the respective subprocessesdied. Data included presence and fall of leaves on given nodes, and and monocyclic process (Fig. 1) and the proportion of host tissuepresence and absence of rust. Rust severity was estimated by using a available for infection. The independent variables were based ondiagrammatic scale (9). The numbers of current and fallen leaves data for 28 days before the DP. The various combinations ofwith and without rust and the leaf area rusted at each date of independent variables were based on biological relationships,reading were calculated by using a computer program LEAFAL which are depicted diagrammatically in Fig. 1.(10) from which the apparent infection rate corrected for host Infection rate (p"). The apparent infection rates corrected forgrowth and the host tissue available for infection were calculated. host growth (leaf formation) for intervals 28 days after DP wereAt each sampling date, 10 leaves were collected from the middle calculated by using Vanderplank's equation for p (19) as modifiedthird of the canopy of each of 15 trees selected at random, and the by Kushalappa and Ludwig (11) to obtain p".proportion of leaf area rusted (PRA) and proportion of leaf areaoccupied by visible uredinia (PSAI, proportion of spore area p" = In [x2 (1 - xiyl)/XiyI (1 - x2)]/(t2 - ti),index) were determined as previously described (9).
A surface-wetness recorder, Woelfle type 64 b, and a in which x, is the proportion of disease (PLR or PRA) present at
Vol. 73, No. 1, 1983 97

DP; X2 is the cumulative proportion of disease based on leaves based on the average cumulative number of leaves for 28 dayspresent on t2 and those removed due to leaf fall during the interval before DP, and was represented as a proportion of the maximum28 days after DP (for equation see [11]); y, = Y,/ Y2 in which Y, is observed during the 2-yr study period. The mean DISEE is anumber of leaves present at DP and Y2 is the cumulative number of proportion of maximum dissemination and ranged from zero toleaves present during the 28-day interval, one.
Monocyclic process equivalents for environment (MPEE). The Survival ratio for monocyclic process (SRMP). The SRMP wasdaily weather information was transformed into subprocess calculated as SRMP = BSR X MPEE (Fig. 1), in which the basic(dissemination and infection) equivalents for environment related survival ratio, BSR, is the initial stage of the monocyclic process (=to the respective subprocesses from which the monocyclic process proportion of leaf area rusted). For the purpose of this study theequivalent for environment was calculated (MPEE = SPEE X proportion of leaf area occupied by visible uredinia withDISEE X INFEE in which SPEE was eliminated or given a value of urediniospores, PSAI (Fig. 1) was considered as the initial stage1.00 [Fig. 1]). The daily mean MPEE ranged from zero to one. (PSAI = BSR X SPEE) and was estimated directly in the field,
The mean INFEE per day was calculated by substituting hours of which eliminated the need for SPEE. The PSAI for samples offree water and temperature in the functions for infection, which marked plants were obtained indirectly from those for randomwere determined under laboratory conditions with those based on samples in order to reduce extensive handling of marked plants.daily weather data for 28 days before the DP. The daily INFEE was The PSAI, cumulative for 28 days before DP, for samples ofderived from INFEE = INFEEhw X INFEE, in which hw is hours of marked plants was calculated from an average (on DP and 14 andfree water and t is temperature (Fig. 1), which were calculated from 28 days before DP) ratio of PSAI: PRA estimated from randomthe functions (or equations) of hours of free water (Fig. 2) and of samples; the ratio was multiplied by PRA, cumulative for 28 daystemperature (Fig. 3), respectively. The total hours of free water before DP calculated from marked plants to yield PSAI.were determined from surface-wetness recorder readings and the The PSAI surviving after the subprocesses dissemination andtemperature was recorded on a thermograph. Since the infection depending on the environment during a 28-day periodtemperature varied during long free-water periods, the daily before DP were calculated and represented as proportions of leafINFEE was calculated as the mean of the products of infection area. The probable survival ratio after dissemination wasequivalents for every 6 hr with the infection equivalent for total designated as proportion of disseminated spore area indexnumber of hours of free water on a given day. The continuous (PDSAI) and that after infection as proportion of infective sporefree-water hours were treated together and not separated according area index (PISAI). Here, the PISAI is the proportion of leaf areato days. occupied by spores that initiate infection. The rate of flow of each
The mean DISEE per day for 28 days before DP was calculated subprocess depends on the mean DISEE and INFEE as explainedfrom the function of environment for dissemination (FEDIS, Fig. above. The value of SRMP ranged from zero to one (SRMP =1): DISEE= [Y (El +0.5 E2)/28] X E3 in which E, is dissemination PISAI = PSAI X DISEE X INFEE, Fig. 1).equivalent for RAINDAY (Fig. 1), a day with rainfall > 1 mm; E2 isdissemination equivalent for WINDAY (Fig. 1), a day with norainfall or with rainfall <1 mm and with wind speed t>I m/s. I.O.Consecutive days of uninterrupted rain, as determined by -- ESTIMATEDcontinuous leaf wetness hours, were considered as one RAINDAY;E3 is dissemination equivalent for HOSTDEN (Fig. 1) and was 0 OBSERVED
.8-
ESTIMATED
e OBSERVEDZ
U.)w
.a.6 k0I-P
00 _z .6-4 .2"
0..-a::
00
.2-
14 18 22 26 30
.0 TEMPERATURE °C0 10 2b 30 40 48 Fig. 3. Function of temperature for 'infection of coffee leaves by
urediniospores of Hemileia vastatrix: observed values and a trigonometricHRS. FREE WATER polynomial fit. The equation is Y= sin 2 (188. lx - 41.6x2
- 151.3x 3), (r2 =Fig. 2. Function of hours of free water for infection of coffee leaves by 0.77), in which Y is the proportion of maximum infections or lesionsurediniospores of Hemileia vastatrix: observed values and an exponential observed (= infection equivalents for environment) and x is temperaturefit. The equation is Y= 1 - 1.996 exp (-0.1089t), (r2 = 0.79), in which Yis equivalents (18), in which X = (tob - tmin)/(tmin - t/max), in which t isthe proportion of maximum infections or lesions observed (= infection temperature in C, observed, and minimum and maximum for activity, andequivalents for environment), t is the hours of leaf wetness, and r2 is the r2 is the coefficient of determination. For the transformation of weathercoefficient of determination. data, the estimated values were adjusted to a maximum of one.
98 PHYTOPATHOLOGY
Host tissue available for infection. The proportion of leaves RESULTS(PLAI) and leaf area available for infection (PLAAI) during aninterval of 28 days preceding DP was calculated based on the Function of environment for infection. Function of free waterformula, - logit xy, in which xis PLR or PRA present at DP andy for infection. The proportion of the maximum number of lesions= Y1/ Y2, where Y, is leaves present at DP and Y2 is cumulative for per leaf observed at various time intervals of free water and an28 days after DP (here the amount of host during the prediction exponential fit to the data are shown in Fig. 2. The equation was Yinterval is considered constant as in the calculation of p"). = 1 - 1.996 exp (- 0.1089 t), in which Y is the proportion of the
Path analysis. Path analysis deals with relationships among the maximum number of lesions per leaf and t is the number of hours ofstandardized variables. The regression coefficient for any free water; the coefficient of determination (r2) was 0.79. The hoursstandardized variable is called the path coefficient (p), thus the of free water exposure tested were 6, 12, 18, 24, and 48. At 6 hr freelatter is a standardized regression coefficient. The path coefficient water, the number of lesions produced was 0.03 of the maximumcarries a direction with it and is shown by arrows. The total (1.00), which was reached in 24 hr.percentage of the coefficients of determination is the sum of partial Function of temperature for infection. The proportion of thedetermination by each variable (p0 + p02) and by correlation maximum number of lesions per leaf observed at variousamong variables (p01 r12 P02 + P02 r2l poi); the rest is unexplained temperatures and a trigonometric polynomial fit are presented invariation (for details see reference 13, pages 113-115). Fig. 3. The equation was Y= sin (188. lx - 41.6x 2 - 151.3x 3),
1.41.4• 0 P'(PLR) 4A a P'(PLR) 4B a1.2- * P(PRA)1.2 2 9'(PRA)
1.0- 1.0
0 - -0- .6..6"A
.4- a- A.,
-JL
.2- .2 b,
-10I •2
o - I-- • " °
10 -
....
0_ 12-
- -.. " ° .1 1 ..- -..... 1 4M° 'N E dar I I I I
rD 1j FM....M Ji iD i[ i] IMOT 9 ,979-80
an "NE1d) o 8dasbfr P bevdfrmAgs 173oJn 1979 (A)dan fro August 199tdue18 4) epetvla io ia
for onocyc c .2 a N EEV 7
Z :
0 l' I r', 'D I • I I M I A I- -U j 0 AI S 0 N 'I . . .. ..M I "
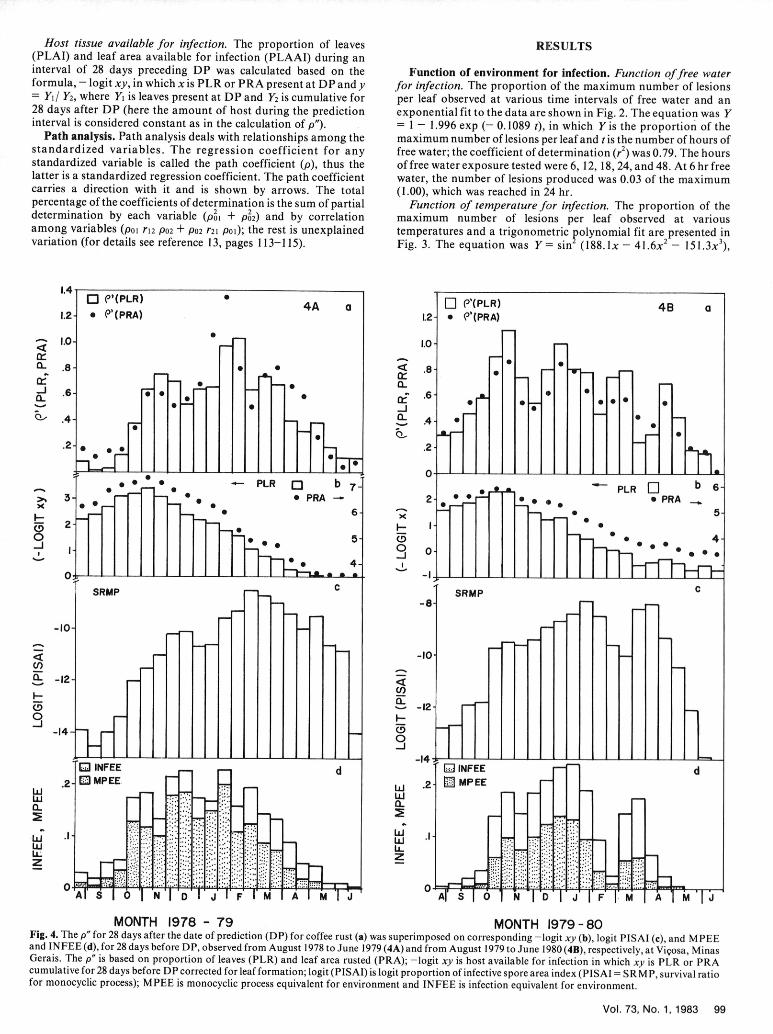
MONTH 1978 -79 MONTH 1979-80Fig. 4. The p" for 28 days after the date of prediction (DP) for coffee rust (a) was superimposed on corresponding -logit xy (b), logit PISAI (c), and MPEEand INFEE (d), for 28 days before DP, observed from August 1978 to June 1979 (4A) and from August 1979 to June 1980 (4B), respectively, at Vii~osa, MinasGerais. The p" is based on proportion of leaves (PLR) and leaf area rusted (PRA); -logit xy is host available for infection in which xy is PLR or PRAcumulative for 28 days before DP corrected for leaf formation; logit (PISAI) is logit proportion of infective spore area index (PISAI = SRMP, survival ratiofor monocyclic process); MPEE is monocyclic process equivalent for environment and INFEE is infection equivalent for environment.
Vol. 73, No. 1, 1983 99

where Yis the proportion of maximum infection (lesions); x is the explained more than 25% of the variation in the rate of rust
temperature equivalent (x = tob - tmin)/(tmax - tmin), in which ob development. When data from April to July were excluded,indicates observed, min indicates minimum, and max indicates because of longer incubation periods, the r2 significantly increased
maximum temperature for activity (18). The coefficient of in logit proportion of spore area index and in logit proportion of
determination (r 2) was 0.77. An average of less than one lesion per infective spore area index, but decreased in other variables. The
leaf appeared at 15 (0.35) and 30 C (0.1); consequently, a minimum logit proportion of infective spore area index explained up to 67%
of 14 and a maximum of 30 C were chosen as the limits for activity, of the variation in p" based on PLR.
Host available for infection. The proportion of leaves and leaf The weather was favorable for infection of coffee leaves by H.
area available for infection (Fig. 4Ab and Bb) increased until vastatrix from the second half of October through March (INFEE,November after which they decreased. The proportion of Fig. 4Ad and Bd). However, a higher proportion of infective spore
maximum leaves observed (= HOSTDEN) were relatively higher area index (Fig. 4Ac and Bc) was observed after March because of
during 1978-1979 (Fig. 5Ac) than during 1979-1980 (Fig. 5Bc); the higher proportion of spore area index, which was due to a
within each growing season, the HOSTDEN was higher from higher proportion of disease area (an inverse function of -logit xy,October through March. The new flush of growth of branches and Fig. 4Ab and Bb). Although the proportion of host available for
leaves started in September after the winter months of infection (Fig. 4Ab and Bb) and the host density (Fig. 5Ac and Bc)
June-August. After March, fewer leaves formed, and the were relatively higher from August through October, the INFEE
continued leaf fall reduced the amount of foliage, especially after (Fig. 4Ad and Bd) and logit proportion of infective spore area
harvest (May). index (Fig. 4Ac and Bc) were lower, which consequently reduced
Disease development. The rate of disease increase (p" for 28 the infection rate (Figs. 4Aa and Ba, 5Aa and Ba, and 5 Ab and
days), based on PLR and PRA, was relatively higher from October Bb).
to April than from May to September (Fig. 4Aa and Ba). The rate Equations for various combinations of independent variables are
of rust development in general was similar between years, although given in Table 2. In general, the r 2 was higher when the dependent
it varied between corresponding months. variable p" based on PLR was chosen than when p" based on PRA.Equations to predict rust infection rate. The coefficients of In all but one case (Table 2, eq. 12) the r2 increased when the data
determination (r2) for various independent variables are shown in from April to July were excluded. A maximum of 72% of the
Table 1. Four of the six variables, DISEE, INFEE, MPEE, and variation in p" based on PLR was explained by a combination of
logit proportion of infective spore area index independently logit proportion of infective spore area index, and host available
1.20 OBSERVED 5 A a 5B aAUG-. MAR1 '
1.0" - AUG.- JUN' PRED.
._1
/b''Ab
_j 4%
.198,4T - 97 -
"4 ,
o . .. . ..
b b
1.0.
.=V 'A, -- -A-
a. ~ ~ ~ ~ ~ A -A,' - - . ,•_ .4- A, A,,
2. 'A/- "
Cm C
8-
1978 - 79 MONTH 1979 - 80
Fig. 5. Apparent infection rate corrected for leaf formation (p") for 28 days after date of prediction, observed and predicted based on the equation 11 (Table2), and the number of leaves present in an interval of 28 days before DP, represented as proportion of the maximum observed from August 1978 to June 1979(5A) and from August 1979 to June 1980 (SB), respectively, at Vigosa, Minas Gerais. PLR, proportion of leaves rusted (a); PRA, proportion of leaf arearusted (b); PML, proportion of maximum leaves present (c).
100 PHYTOPATHOLOGY

for infection (-logit xy). In none of the four combinations (Table 2) leaf area diseased, while -logit xy is logit proportion of leaves thatdid the independent variable DISEE explain significant variation are not diseased (based on PLR).in infection rate, even though individually it explained significantvariation (Table 1). This is because of high multicolinearity DISCUSSIONbetween the variables DISEE and INFEE (r = 0.796 and 0.759)(Table 3). High multicolinearity among independent variables were In the regression model suggested here to predict coffee rustalso observed between logit PSAI and -logit xy. infection rates (Fig. 1), the functional relationships among
Path model and multicolinearity. The amount of variation independent variables (biological and meteorological) thatexplained by each variable directly and due to multicolinearity (due influence increase in disease have been more adequately definedto correlated causes) among variables, in a combination of than in earlier models (1,8,9,17) by transforming meteorologicalindependent variables, is described with the aid of path coefficients. information to monocyclic process equivalents for the environmentThe combination that gave highest r2 value has been chosen for related to the three subprocesses of a monocyclic process andillustration (eq. 11, Table 2). In a stepwise regression, the variable further by deriving the survival ratio for monocyclic process,logit proportion of infective spore area index entered first, and it proportion of infective spore area index from proportion of sporeexplained 67% of the variation in p". Next entered the logit area index. The multiple regression analysis explains the responseproportion of leaves available for infection (-logit xy), which in the dependent variable as a sum of linear functions ofincreased the r2 to 72%. However, -logit xy independently independent variables and not through paths of action asexplained 10% of the variation; the reduced contribution with logit illustrated in Fig. 1. The nontransformed meteorological variablesPISAI is due to the correlation of-logit xy with logit PISAI (r = explain variation in disease development since in certain-0.589). Based on path coefficients, the variable logit proportion of combination they determine the monocyclic process equivalentsinfective spore area index in the combination directly explained that are directly related to disease development.96% (021 = 0.96) and -logit xy explained 8% (p02 = 0.08) of the Zadoks and Schein (20, page 51) used 'survival ratios'to quantifyvariation in the rate of disease development (p"), but the final horizontal resistance. A reduced proportion of survival from sporeamount was reduced to 72% because of negative correlation (r = to pustule development (infection efficiency) is an indication of-0.598) between the independent variables; the correlation reduced resistance. A similar principle has been adopted here to quantifythe final r 2 by 32%, 16% from each path [(poor12 P02 = -0.16) + (P02 the monocyclic process of H. vastatrix, and to predict infectionr2l poi = -0. 16)]. The correlation between logit PISAI and -logit xy rate. The various functions of environment, designated asis negative because the logit PISAI is based on the proportion of epidemiological functions (Fig. 1), have been determined under
TABLE 1. Coefficients of determination (r2) for various independent variables that were used in formulating a multiple regression equation to predict coffeerust infection rate in Viqosa, Minas Gerais, Brazil, during August 1978-June 1980
Coefficient of determination for independent variables'Dependent Logit Logit - Logit
Period variable' PSAI DISEE INFEE MPEE PISAI xyAugust-June p" (PLR) 0.0001 0.269 0.473 0.411 0.450 0.057
p" (PRA) 0.0086 0.372 0.477 0.469 0.384 0.082
August-March p" (PLR) 0.267 0.084 0.397 0.287 0.666 0.097p" (PRA) 0.123 0.185 0.364 0.367 0.452 0.051
Yp" is apparent infection rate based on proportion of leaves rusted (PLR) or leaf area rusted (PRA) for 28 days after the date of prediction (DP), corrected forleaf formation (11).'Variables are for 28 days before DP: proportion of spore area index (PSAI), dissemination equivalents for environment (DISEE), infection equivalents forenvironment (INFEE), monocyclic process equivalent for environment (MPEE), proportion of infective spore area index (PISAI), and host available forinfection (-logit xy), in which x is PLR or PRA and y is the correction for leaf formation (see text).
TABLE 2. Constant values, partial regression coefficients, and coefficients of determination (r2) for various combinations of independent variables for model
equations that explained significant variation in the coffee rust infection rate in Vivosa, Minas Gerais, Brazil, during August 1978-June 1980
Partial regression coefficients for independent variablesyEq. Dependent Logit Logit - Logit
Period no. variabley Constants PSAI DISEE INFEE MPEE PISAI xy r2August-June 1 p" (PLR) 1.4690 0.2168 _Z 2.1894 0.2609 0.673
2 p" (PRA) 0.2507 - - 2.3695 - 0.4783 p" (PLR) 1.6554 0.2403 3.1238 0.2686 0.6704 p" (PRA) 1.6892 0.1400 3.0068 0.1542 0.5585 p" (PLR) 1.5892 .1225 0.1058 0.6266 p" (PRA) 1.1009 .1052 0.1016 0.568
August-March 7 p" (PLR) 1.4617 0.1877 - 2.1242 0.1605 0.7118 p" (PRA) 0.7802 0.0600 - 1.9691 - 0.4819 p" (PLR) 1.6584 0.2099 2.8121 0.1675 0.711
10 p" (PRA) 0.9355 0.0788 2.9002 - 0.56511 p" (PLR) 2.0804 0.1533 0.0852 0.71512 p" (PRA) 1.3930 0.1149 0.0708 0.490
Yp" is apparent infection rate based on proportion of leaves rusted (PLR) or leaf area rusted (PRA) for 28 days after the date of prediction (DP), corrected forleaf formation (11). Independent variables are for 28 days before DP: proportion of spore area index (PSAI), dissemination equivalent for environment(DISEE), infection equivalent for environment (INFEE) and monocyclic process equivalent for environment (MPEE), proportion of infective spore areaindex (PISAI), and host available for infection (-logit xy), in which x is PLR or PRA, and y is the correction for leaf formation (see text).
'Indicates variable that did not account for a significant (P= 0.05) proportion of the variation in p". When all variables were included, the r2 values were 0.690,0.596, 0.723, 0.560, and 0.570, respectively, for equations 1, 2, 7, 8, and 10.
Vol. 73, No. 1, 1983 101

laboratory conditions or approximated from data in the literature. TABLE 3. Correlation coefficients (r) among independent variables thatHourly microclimatic and macroclimatic data have been were used in formulating multiple regression equations to predict coffeetransformed to subprocess equivalents and, further, to monocyclic rust infection rate in Vigosa, Minas Gerais, Brazil, during August 1978-Juneprocess equivalents for environment. Each subprocess equivalent 1980for environment has been quantified as a proportion of maximum r for independent variablessurvival, the ratio between the initial and the final stage of asubprocess. We have attempted to follow the path of action; Independent Logit -Logit xy -Logit xyhowever, this model does not explain the complete biological Period variables' INFEE PSAI (PLR) (PRA)
relationship. August-June Logit PSAI -0.918 -0.930Various combinations of independent variables in addition to DISEE 0.796 -0.655 0.696 0.739
that in the final functional model eq. 5, 6, 11, and 12 were tested to INFEE -0.273 0.378 0.443evaluate variation and to compare them in terms of the MPEE -0.414 0.494 0.555
relationships that they represented. Although the variables in Logit PISAI -0.250 -0.213
equations 1-4 and 7-10 are functional, the relationships among August-March Logit PSAI -0.889 -0.923them are additive, whereas in equations 5, 6, 11, and 12 the DISEE 0.759 -0.449 0.431 0.518relationships involve proportion of survival (thus a functional INFEE 0.013 0.058 0.126model), except for -logit xy, which is additive. In the equation 11 MPEE -0.147 0.192 0.275(similarly in eq. 5, 6, and 12) the cause and effect relationship is Logit PISAI -0.598 -0.574explained by path analysis. In equation 1 a combination of four ZIndependent variables are for 28 days before the date of prediction (DP):variables explained 67% of the variation whereas the same proportion of spore area index (PSAI), dissemination equivalent forvariables explained only 63% when the relationship was based on environment (DISEE), infection equivalent for environment (INFEE) andsurvival ratio (eq. 5). Thus, a nonbiological relation may falsely monocyclic process equivalent for environment (MPEE); proportion ofincrease r2 values. A similar false increase is also possible with infective spore area index (PISAI), and proportion of host available forrepetition of variables (overlapping meteorological variables) for a infection based on proportion of leaves (PLR) and leaf area rusted (PRA).single function; such relations reduce model stability. Logit x = loge (xI 1 - x), in which x = PLR, PRA, PISAI, or PSAI; y in
Since no function was available for DISEE, an approximation -logit xy is the correction for leaf formation (see text).
was made. In eq. 5 (Table 2) when WINDAY and HOSTDEN wereexcluded from DISEE, the r2 decreased from 63 to 53%. At higherhost density levels the disease has been reported to increase faster(1). Though spores have been trapped in the air (2,3,17) and certaindays with maximum wind speed were associated with maximumspore catch (3), no significant increase in number of spores was logit x, = logit xo + rtobserved at wind speeds of more than 4 km/hr (14). Spores havebeen found to be disseminated in drippings from leaves in rains of logit X, = logit Xoyo + p" tup to 1.6 mm; an increase in the amount of rain was not associatedwith either an increase or a decrease in spore dissemination (2). in which yo = Yo/ Yt and t is time, 28 days after DP.Instead, the relationship was irregular. Based on the factors influencing infection, a cropping period can
The incubation period (the period from inoculation until 50% of be grouped into three infection periods. The first is 'period ofthe maximum number of lesions appeared) estimated from an low-initial infection' from beginning of September through mid-equation developed in earlier studies (12) varied from 25 to 40 days October, when the PSAI (inoculum) as well as the MPEE are lowfor the months included in the model, for September through April but the HOSTDEN and host available for infection are relativelyand up to 60 days during the winter months, June-August. The higher. The second is 'period of highest infection' from mid-prediction interval of 28 days allows an incubation period of 28 to October to mid-April when the values for PSAI, MPEE,56 days depending on how many days before DP the infection had HOSTDEN, and host available for infection are the highest. Theoccurred. Consequently some overlapping of monocyclic process is third is 'period of declining infection,' from mid-April to the end ofpossible; the infections initiated earlier than 28 days before DP August when the value for PSAI is relatively higher but values formight develop lesions during the prediction interval and infections MPEE, HOSTDEN, and host available for infection are theinitiated a few days before DP might not appear at all during the lowest; the PSAI reaches its lowest level during July andprediction interval. Such false addition and exclusion of lesions September. The inoculum in the beginning of the first period,would be predominant during the cooler months after April. A surviving from the preceding winter months, plays a major role incorrection for incubation period should increase r2. When data the further development of disease.from April were excluded, the r' increased from 63 to 72% (Table 2, Various parameters such as INFEE, PSAI, and PISAI could beeq. 5, 11). used to make decisions on timing of fungicidal applications. Based
When calculating host available for infection (-logit xy) a on MPEE in this study, applications of fungicide may be startedcorrection for leaf formation was made as in calculating infection during October if the amount of initial inoculum in September israte (p"); the host cumulative until 28 days after DP was considered comparatively higher, or during December if the amount ofconstant during the predictive period. Future host growth, when inoculum is lower. Generally, the cumulative number of leavesneeded, may be approximated based on the equation developed produced until December is substantial (11). In the State of Minas(11) (absence of correction may result in little difference in Gerais fungicides are usually applied three to four times a year.predicted rate). Also, if the season is relatively less favorable (based on MPEE) or if
The model suggested here appears to explain more adequately host density and amount of inoculum are lower, the intervalthe variation in rust incidence (PLR) than in rust severity (PRA). between applications can be extended and, consequently, the totalThis is because rust severity increases due to enlargement of lesions number of applications reduced.with time, which is not considered in the model since the increase is The model developed here is flexible, and can be adopted fornot part of the infection process. Also the factors associated with other host-pathogen systems. The calculation of proportion ofspore dissemination within and between plants and/or leaves may infective spore area index should consider the stage of the pathogendifferentially influence disease development that is based either on observed and the subsequent environmental functions appropriatePLR or on PRA. from the model (Fig. 1). The r2 values in the model can be increased
In the model developed here, we used p" as a dependent variable, by improving the functions for subprocesses.From the predicted value of p", the logit x, (t = 28 days) can be The equations developed here are preliminary. A similar modelcalculated based on an equation similar to that for apparent based on data from more locations and seasons is necessary beforeinfection rate (19). it can be recommended for prediction.
102 PHYTOPATHOLOGY

LITERATURE CITED 10. Kushalappa, A. C., and Lagesse, R. M. 1981. LEAFAL: A computerprogram for quantitative analysis of leaf fall in coffee principally fromrust. Phytopathol. Z. 101:97-105.
1. Alfonsi, R. R., Ortolani, A. A., Pinto, H. S., Pedro, M. J., Jr., and 11. Kushalappa, A. C., and Ludwig, A. 1982. Calculation of apparentBrunini, P. 1978. Associacao entre nievel de infecco da ferrugem do infection rate in plant diseases: Development of a method to correct forcafeeiro, varidveis clim6.ticas e dtrea foliar, observada em Coffea arabica host growth. Phytopathology 72:1373-1377.L. Pages 80-83 in: Proc. II Congresso Brasileiro sobre Pesquisas 12. Kushalappa, A. C., and Martins, C. P. 1980. Incubation and generationCafeeiras. (Abstr.) 10-14 September, Po~os de Caldas, MG. 392 pp. periods for Hemileia vastatrix on coffee in Vigosa, Minas Gerais.
2. Becker, S. 1977. Vergleichende untersuchungen zur verbreitung von Fitopatol. Bras. 5:177-183.Hemileia vastatrix in Kenia. Z. Pflanzenkrankh. Pflanzenshutz 13. Li, C. C. 1975. Path Analysis: A Primer. The Boxwood Press, Pacific84:526-539. Grove, California. 346 pp.
3. Becker, S. 1977. Tagesperiodik des sporenfluges von Hemileia vastatrix 14. Martinez, J. A., Palazzo, D. A., and Karazawa, M. 1977. Importanciain abhingigkeit von witterungsfaktoren. Z. Pflanzenkrankh. do vento na liberaCo e disseminac.'o dos esporos de Hemileia vastatrixPflanzenschutz 84:577-591. Berk & Br. Fitopatol. Bras. 2:35-42.
4. Burleigh, J. R., Eversmeyer, M. G., and Roelfs, A. P. 1972. 15. Montoya, R. H., and Chaves, G. M. 1974. Influ~ncia da temperatura eDevelopment of linear equations for predicting wheat leaf rust. da luz na germinaao, infectividade e peribdo de geragao de H.Phytopathology 62:947-953. vastatrix. Experientiae 18:239-266.
5. Butt, D. J., and Royle, D. J. 1974. Multiple regression analysis in the 16. Nie, N. H., Hull, C. H., Jenking, J. G., Steinbrenner, K., and Bent,epidemiology of plant diseases. Pages 78-114 in: Epidemics of Plant D. H. 1975. Statistical Package for the Social Sciences. 2nd ed.Diseases: Mathematical Analysis and Modeling. J. Kranz, ed. McGraw-Hill Book Co., New York. 675 pp.Springer-Verlag, New York. 170 pp. 17. Oseguera, S. H. 1980. Efeito de fatores biol6gicos e climdticos sobre o
6. Eversmeyer, M. G., and Burleigh, J. R. 1970. A method of predicting desenvolvimento da ferrugem (Hemileia vastatrix Berk & Br.) doepidemic development of wheat leaf rust. Phytopathology 60:805-811. cafeeiro. M.S. thesis. Univ. Fed. Vigosa, MG. Brazil. 57 pp.
7. Eversmeyer, M. G., Burleigh, J. R., and Roelfs, A. P. 1973. Equations 18. Schr~dter, H. 1965. Methodisches zur Bearbeitung Phytometeoro-for predicting wheat stem rust development. Phytopathology pathologischer Untersuchungen, dargestellt am Beispiel der63:348-351. Temperaturrelation. Phytopathol. Z. 43:154-166.
8. Kushalappa, A. C. 1981. Linear models applied to variation in the rate 19. Vanderplank, J. E. 1963. Plant Diseases: Epidemics and Control.of coffee rust development. Phytopathol. Z. 101:22-30. Academic Press, New York. 349 pp.
9. Kushalappa, A. C., and Chaves, G. M. 1980. An analysis of the 20. Zadoks, J. C., and Schein, R. D. 1979. Epidemiology and Plant Diseasedevelopment of coffee rust in the field. Fitopatol. Bras. 5:95-103. Management. Oxford Univ. Press, New York. 427 pp.
Vol. 73, No. 1, 1983 103