application of pneumatic flow injection-tandem spectrometer system for chromium...
TRANSCRIPT

Hindawi Publishing CorporationJournal of Automated Methods and Management in ChemistryVolume 2007, Article ID 34373, 6 pagesdoi:10.1155/2007/34373
Research ArticleApplication of Pneumatic Flow Injection-TandemSpectrometer System for Chromium Speciation
Meissam Noroozifar,1 Mozhgan Khorasani-Motlagh,2 and Reza Akbari1
1 Analytical Research Laboratory, Department of Chemistry, University of Sistan & Baluchestan, P.O. Box 98155-147, Zahedan, Iran2 Inorganic Research Laboratory, Department of Chemistry, University of Sistan & Baluchestan, Zahedan, Iran
Received 12 March 2007; Accepted 29 June 2007
In this approach, a pneumatic flow injection-tandem spectrometer system, without a delivery pump, has been developed to studychromium speciation. In this system, suction force of pneumatic nebulizer of a flame atomic absorption spectrometer has beenused for solution delivery through the manifold. Cr(VI) and total Cr concentrations were determined using UV-Vis and FAASspectrometers, respectively. The Cr(III) was determined by difference. The calibration curves were linear up to 10 μg mL−1 and20 μg mL−1 for Cr(VI) and total Cr with detection limit of 0.12 μg mL−1 and 0.07 μg mL−1 for Cr(VI) and Cr(III), respectively. Themidrange precision and accuracy are less than 1.98% and ±2.50% for two species, respectively, at a sampling rate of 100 h−1. Thissystem was applied for the determination of the chromium species in spiked and natural waters as well as industrial waters.
Copyright © 2007 Meissam Noroozifar et al. This is an open access article distributed under the Creative Commons AttributionLicense, which permits unrestricted use, distribution, and reproduction in any medium, provided the original work is properlycited.
1. INTRODUCTION
The demand for fast, reliable analytical methods for de-termining different species of an element in environmentalsamples has rapidly increased, because in most cases the dif-ferent biological, nutritional, or toxicological properties de-pend critically on chemical form or oxidation state [1, 2].Chromium is a naturally occurring element, mainly foundin minerals, rocks, plants, soil, and water in volcano dust andgases. Although, chromium is known to exist in all oxidationstates from Cr(0) to Cr(VI), the Cr(III) and Cr(VI) speciesare the most widespread in the nature. Trivalent Cr(III) andhexavalent Cr(VI) enter the environment as a result of efflu-ent discharge, electroplating, tanning industries and oxida-tive dyeing [3]. Chromium(III) is considered as an essentialmicronutrient for humans playing a role in the maintenanceof normal glucose, cholesterol, and fatty acid metabolism,whereas Cr(VI) is highly toxic than Cr(III). Its acute toxic ef-fects include immediate cardiovascular shock, with later ef-fects on kidney, liver, and blood-forming organs. The toxicnature of the Cr(VI) ions is attributed to their high oxidationpotential and their relatively small size, which enables themto penetrate through biological cell membranes [4]. Hence,the speciation of chromium has special importance in severalfields of life.
Up to now, several methods for speciation of chromi-um(VI) and chromium(III) have been investigated and pub-
lished in different journals such as catalytic cathodic strip-ping voltammetry (CCSV) [5], X-ray absorption near-edgestructure (XANES) spectroscopy [6], the separation or pre-concentration methods using capillary electrophoresis [7],sorption [8, 9], liquid-liquid extraction [10, 11], extrac-tion using ion-pair formation [12, 13], coprecipitation [14],extraction using supported liquid membranes (SLM) [15],solid phase extraction [16, 17, 19], ion exchange [18], cloudpoint extraction [20] followed by instrumental analysis suchas UV-Vis [7, 13], energy dispersive X-ray fluorescence spec-trometry [9], GFAAS [10, 11, 15–17], FAAS [14, 19], ionchromatography [18], and high-performance liquid chro-matography (HPLC) [20]. The flow injection methods withconjunction by several detection techniques were also ap-plied for the chromium speciation [3, 4, 21–28]. However,there are several disadvantages of using these methods suchas using complicated chemical systems and techniques, ex-pensive reagents and instruments such as ICP and ICP/MS,low sample frequency, and also two determination needs foreach sample; first determining one of the species, followedby reduction/oxidation of the corresponding redox form andquantification of the total amounts of chromium or otherspecies.
Flow techniques present several useful analytical features,in particular the possibility to attain high sample through-put, little sample handling, or manipulation and this elimi-nates many of the stringent clean particles often necessary for
2 Journal of Automated Methods and Management in Chemistry
INJ
C
W
RUV-Vis
Light source FAAS
Detector
Com
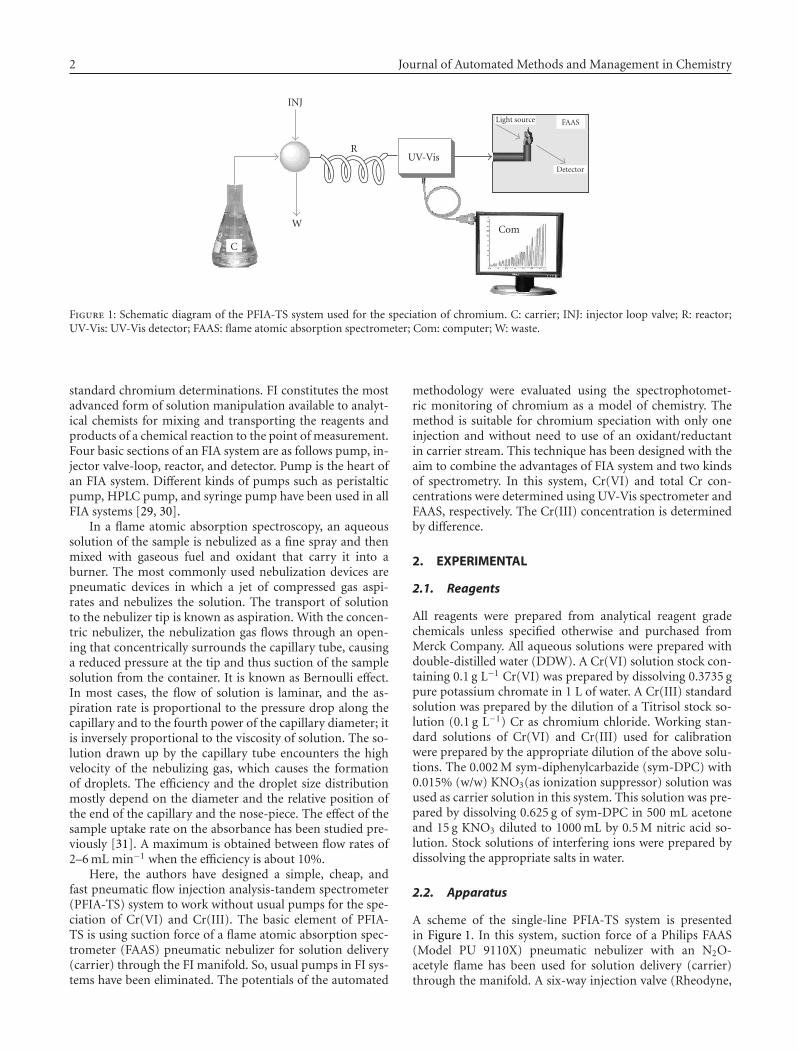
Figure 1: Schematic diagram of the PFIA-TS system used for the speciation of chromium. C: carrier; INJ: injector loop valve; R: reactor;UV-Vis: UV-Vis detector; FAAS: flame atomic absorption spectrometer; Com: computer; W: waste.
standard chromium determinations. FI constitutes the mostadvanced form of solution manipulation available to analyt-ical chemists for mixing and transporting the reagents andproducts of a chemical reaction to the point of measurement.Four basic sections of an FIA system are as follows pump, in-jector valve-loop, reactor, and detector. Pump is the heart ofan FIA system. Different kinds of pumps such as peristalticpump, HPLC pump, and syringe pump have been used in allFIA systems [29, 30].
In a flame atomic absorption spectroscopy, an aqueoussolution of the sample is nebulized as a fine spray and thenmixed with gaseous fuel and oxidant that carry it into aburner. The most commonly used nebulization devices arepneumatic devices in which a jet of compressed gas aspi-rates and nebulizes the solution. The transport of solutionto the nebulizer tip is known as aspiration. With the concen-tric nebulizer, the nebulization gas flows through an open-ing that concentrically surrounds the capillary tube, causinga reduced pressure at the tip and thus suction of the samplesolution from the container. It is known as Bernoulli effect.In most cases, the flow of solution is laminar, and the as-piration rate is proportional to the pressure drop along thecapillary and to the fourth power of the capillary diameter; itis inversely proportional to the viscosity of solution. The so-lution drawn up by the capillary tube encounters the highvelocity of the nebulizing gas, which causes the formationof droplets. The efficiency and the droplet size distributionmostly depend on the diameter and the relative position ofthe end of the capillary and the nose-piece. The effect of thesample uptake rate on the absorbance has been studied pre-viously [31]. A maximum is obtained between flow rates of2–6 mL min−1 when the efficiency is about 10%.
Here, the authors have designed a simple, cheap, andfast pneumatic flow injection analysis-tandem spectrometer(PFIA-TS) system to work without usual pumps for the spe-ciation of Cr(VI) and Cr(III). The basic element of PFIA-TS is using suction force of a flame atomic absorption spec-trometer (FAAS) pneumatic nebulizer for solution delivery(carrier) through the FI manifold. So, usual pumps in FI sys-tems have been eliminated. The potentials of the automated
methodology were evaluated using the spectrophotomet-ric monitoring of chromium as a model of chemistry. Themethod is suitable for chromium speciation with only oneinjection and without need to use of an oxidant/reductantin carrier stream. This technique has been designed with theaim to combine the advantages of FIA system and two kindsof spectrometry. In this system, Cr(VI) and total Cr con-centrations were determined using UV-Vis spectrometer andFAAS, respectively. The Cr(III) concentration is determinedby difference.
2. EXPERIMENTAL
2.1. Reagents
All reagents were prepared from analytical reagent gradechemicals unless specified otherwise and purchased fromMerck Company. All aqueous solutions were prepared withdouble-distilled water (DDW). A Cr(VI) solution stock con-taining 0.1 g L−1 Cr(VI) was prepared by dissolving 0.3735 gpure potassium chromate in 1 L of water. A Cr(III) standardsolution was prepared by the dilution of a Titrisol stock so-lution (0.1 g L−1) Cr as chromium chloride. Working stan-dard solutions of Cr(VI) and Cr(III) used for calibrationwere prepared by the appropriate dilution of the above solu-tions. The 0.002 M sym-diphenylcarbazide (sym-DPC) with0.015% (w/w) KNO3(as ionization suppressor) solution wasused as carrier solution in this system. This solution was pre-pared by dissolving 0.625 g of sym-DPC in 500 mL acetoneand 15 g KNO3 diluted to 1000 mL by 0.5 M nitric acid so-lution. Stock solutions of interfering ions were prepared bydissolving the appropriate salts in water.
2.2. Apparatus
A scheme of the single-line PFIA-TS system is presentedin Figure 1. In this system, suction force of a Philips FAAS(Model PU 9110X) pneumatic nebulizer with an N2O-acetyle flame has been used for solution delivery (carrier)through the manifold. A six-way injection valve (Rheodyne,

Meissam Noroozifar et al. 3
Model 7125, USA) allowed the sample to be loaded directlyinto a 400 μL loop, and subsequently injected into the car-rier stream. Manifold lines consisted of 0.8 mm i.d. polyethy-lene tubing. The injection valve was kept at the loading po-sition for each first 5 seconds of every run to load the sam-ple. After that it was switched to the injection position to in-ject the sample to the carrier stream. The valve was kept inthe injection position for further 30 seconds to ensure thatthe entire sample was flushed out of the sample loop. Next,the valve was again switched to the loading position to fillthe sample loop for the next run. The generated products inreactor were channeled to the 10 mm in-length optical flowcell, a variable wavelength UV-Vis spectrophotometer detec-tor (Knauer, Germany) at 548 nm, then an FAAS with a 5 cmoptical path-length (burner). The carrier flow rate in thismanifold was 2.4 mL min−1. The signals from UV-Vis detec-tor were performed with computer via the Chromstar soft-ware (Bruker, Germany). The light source for FAAS was a Crhollow cathode lamp. The wavelength was set to 357.9 nmwith a spectral slit-width of 0.5 nm and a lamp current of12 mA.
3. RESULTS AND DISCUSSION
3.1. Optimization of the experimental condition
The performance of the proposed flow injection system de-pended on the efficiency of the reaction occurring betweensym-DPC and chromium(VI) in the reactor, as well as on thereactor length, reactor diameter (reactor i.d.), and the loopvolume.
The reactor length (with i.d. 0.8 mm) was varied between20 cm and 160 cm. The optimizations for two detectors areshown in Figure 2. The analytical signal for UV-Vis detec-tor significantly increases for lengths ranging between 20 cmand 100 cm and remains nearly constant afterwards. The re-sponse for FAAS detector decreases slightly for lengths rang-ing between 20 and 100 and then decreased with increasingin reactor length. The best results were obtained at the lengthof 100 cm.
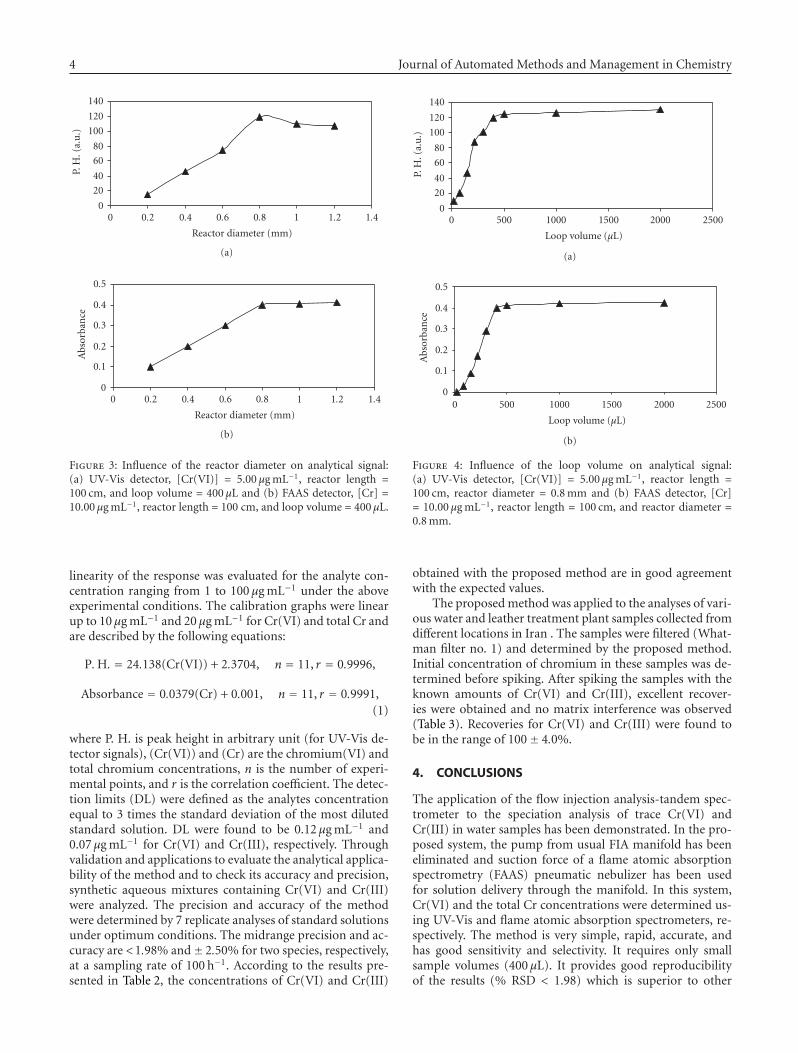
The influences of reactors i.d. were studied in range 0.2–1.2 mm. The results for two detectors are shown in Figure 3.In reactors having an i.d. smaller than 0.8 mm, the interac-tions between the sample and the DPC were weak and thepeak height decreases for UV-Vis detector signal. The re-sponse of the FAAS increases from 0.2 mm i.d. to an i.d. of0.8 mm, remaining nearly constant afterwards. Also, the car-rier flow rate decreases with decreasing of reactors i.d. An i.d.larger than 0.8 mm led to increase dispersion coefficients. A0.8 mm i.d. was chosen as the optimum diameter.
The response of the system was also studied for varioussample volumes injected (loop volume): 20, 80, 100, 150,220, 300, 400, 500, 1000, and 2000 μL. These optimizationsare shown in Figure 4. The analytical signal increased withan increase of the volume. Larger volumes resulted in higher,yet broader peaks. Consequently, the sampling frequency andthe peak capacity sharply decreased. A 400 μL volume was se-lected as the loop volume.
200150100500
Reactor length (cm)
020406080
100120140
P.H
.(a.
u.)
(a)
200150100500
Reactor length (cm)
0.2
0.3
0.4
0.5
0.6
Abs
orba
nce
(b)
Figure 2: Influence of the reactor length on analytical sig-nal: (a) UV-Vis detector, [Cr(VI)] = 5.00 μg mL−1, reactor i.d. =0.8 mm, and loop volume = 400 μL and (b) FAAS detector, [Cr] =10.00 μg mL−1, reactor i.d. = 0.8 mm, and loop volume = 400 μL.
Table 1: Optimization of the experimental condition PFIA-TS sys-tem for chromium speciation.
Parameter Study range Optimum value
Reactor length (cm) 20–160 100
Reactor diameter (mm) 0.2–1.2 0.8
Loop volume (μL) 20–2000 400
The optimization ranges of the experimental conditionsand optimum value for PFIA-TS system are summarized inTable 1.
3.2. Sample matrix interference
The effect of potentially interfering ionic species on the de-termination of Cr(VI) with UV-Vis detector was investigated.The tolerance limit was defined as the concentration of for-eign ions resulting in the ±5.0% error in the determinationof 5 μg mL−1 Cr(VI). It was found that even a 250-fold ex-cess of Ca2+, Mg2+, Cl−, Br−, I−, F−, 200-fold excess of NO3
−,Zn2+, Al3+, Mn2+, Ni2+, SO4
2−, 120-fold excess of Cu2+, Co2+,S2O4
2−, S2O82−, S2O5
2−, CO32−, and 45-fold excess of Fe3+,
Cd2+, VO−3 , 12-fold excess of Hg2+, Pb2+, and CH3COO−did
not interfere.
3.3. Calibration plot and precision
A typical response of UV-Vis detector in optimum condi-tions was shown in Figure 5. The results show the stability ofthe flow rate and repeatability of the proposed system. The
4 Journal of Automated Methods and Management in Chemistry
1.41.210.80.60.40.20
Reactor diameter (mm)
0
20
40
60
80
100
120
140
P.H
.(a.
u.)
(a)
1.41.210.80.60.40.20
Reactor diameter (mm)
0
0.1
0.2
0.3
0.4
0.5
Abs
orba
nce
(b)
Figure 3: Influence of the reactor diameter on analytical signal:(a) UV-Vis detector, [Cr(VI)] = 5.00 μg mL−1, reactor length =100 cm, and loop volume = 400 μL and (b) FAAS detector, [Cr] =10.00 μg mL−1, reactor length = 100 cm, and loop volume = 400 μL.
linearity of the response was evaluated for the analyte con-centration ranging from 1 to 100 μg mL−1 under the aboveexperimental conditions. The calibration graphs were linearup to 10 μg mL−1 and 20 μg mL−1 for Cr(VI) and total Cr andare described by the following equations:
P.H. = 24.138(Cr(VI)) + 2.3704, n = 11, r = 0.9996,
Absorbance = 0.0379(Cr) + 0.001, n = 11, r = 0.9991,(1)
where P. H. is peak height in arbitrary unit (for UV-Vis de-tector signals), (Cr(VI)) and (Cr) are the chromium(VI) andtotal chromium concentrations, n is the number of experi-mental points, and r is the correlation coefficient. The detec-tion limits (DL) were defined as the analytes concentrationequal to 3 times the standard deviation of the most dilutedstandard solution. DL were found to be 0.12 μg mL−1 and0.07 μg mL−1 for Cr(VI) and Cr(III), respectively. Throughvalidation and applications to evaluate the analytical applica-bility of the method and to check its accuracy and precision,synthetic aqueous mixtures containing Cr(VI) and Cr(III)were analyzed. The precision and accuracy of the methodwere determined by 7 replicate analyses of standard solutionsunder optimum conditions. The midrange precision and ac-curacy are <1.98% and± 2.50% for two species, respectively,at a sampling rate of 100 h−1. According to the results pre-sented in Table 2, the concentrations of Cr(VI) and Cr(III)
25002000150010005000
Loop volume (μL)
0
20
40
60
80
100
120
140
P.H
.(a.
u.)
(a)
25002000150010005000
Loop volume (μL)
0
0.1
0.2
0.3
0.4
0.5
Abs
orba
nce
(b)
Figure 4: Influence of the loop volume on analytical signal:(a) UV-Vis detector, [Cr(VI)] = 5.00 μg mL−1, reactor length =100 cm, reactor diameter = 0.8 mm and (b) FAAS detector, [Cr]= 10.00 μg mL−1, reactor length = 100 cm, and reactor diameter =0.8 mm.
obtained with the proposed method are in good agreementwith the expected values.
The proposed method was applied to the analyses of vari-ous water and leather treatment plant samples collected fromdifferent locations in Iran . The samples were filtered (What-man filter no. 1) and determined by the proposed method.Initial concentration of chromium in these samples was de-termined before spiking. After spiking the samples with theknown amounts of Cr(VI) and Cr(III), excellent recover-ies were obtained and no matrix interference was observed(Table 3). Recoveries for Cr(VI) and Cr(III) were found tobe in the range of 100± 4.0%.
4. CONCLUSIONS
The application of the flow injection analysis-tandem spec-trometer to the speciation analysis of trace Cr(VI) andCr(III) in water samples has been demonstrated. In the pro-posed system, the pump from usual FIA manifold has beeneliminated and suction force of a flame atomic absorptionspectrometry (FAAS) pneumatic nebulizer has been usedfor solution delivery through the manifold. In this system,Cr(VI) and the total Cr concentrations were determined us-ing UV-Vis and flame atomic absorption spectrometers, re-spectively. The method is very simple, rapid, accurate, andhas good sensitivity and selectivity. It requires only smallsample volumes (400 μL). It provides good reproducibilityof the results (% RSD < 1.98) which is superior to other

Meissam Noroozifar et al. 5
Table 2: Determination results for Cr(VI) and Cr(III) in synthetic aqueous mixtures.
Added/μg mL−1
Total found/μg mL−1 Cr6+/μg mL−1 Cr3+/μg mL−1
Cr6+ Cr3+ Found RSD (%) RE (%) Found RSD (%) RE (%)
0.5 4.00 4.39 0.49 1.98 −2.00 3.90 1.47 −2.50
3.00 3.00 5.98 3.05 1.51 1.66 2.93 1.69 −2.33
5.00 6.00 11.00 4.90 1.73 −2.00 6.10 0.98 1.66
7.00 2.00 8.95 6.91 1.67 −1.28 2.04 1.33 2.00
Table 3: Determination results and recoveries for Cr(VI) and Cr(II) speciations in water and west water samples collected at differentlocations in Iran.
SampleAdded/μg mL−1 Cr(III) found/μg mL−1
Recovery (%)Cr(VI) found/μg mL−1
Recovery (%)Cr(III) Cr(VI) (n = 5) (n = 5)
Drinking waterZahedan city
0.00 0.00 0.00 — 0.00 —
2.00 3.00 1.98 99.0 3.04 101.3
Well water
0.00 0.00 0.00 — 0.00 —
3.00 3.00 2.97 99.0 3.02 100.7
4.00 4.00 3.94 98.5 4.05 101.3
Lethertreatment plant1
0.00 0.00 1.33 — 0.00 —
4.00 2.00 5.40 101.8 1.96 98.0
2.00 3.00 3.39 103.0 2.90 96.7
Lethertreatment plant2
0.00 0.00 3.71 — 0.00 —
3.00 2.00 6.65 98.0 2.05 102.5
1.00 5.00 4.75 104.0 4.90 98.0
Caspian sea
0.00 0.00 0.00 — 0.00 —
3.00 5.00 3.04 101.3 4.89 97.8
5.00 2.00 4.95 99.0 1.97 98.5
20100
(min)
0
50
100
150
200
250
300
(mV
)
0.51
2
4
5
6
8
10
Figure 5: Typical analytical signals of UV-Vis detector for deter-mination of Cr(VI) with PFIA-TS system. Values above peaks areconcentrations of Cr(VI) in μg mL−1.
speciation methods already described in the literature. ThePFIA-TS is inexpensive, stable, and available in every labora-tory.
ACKNOWLEDGMENT
The authors gratefully acknowledge the financial supportprovided by the University of Sistan & Baluchestan (USB).
REFERENCES
[1] M. Sperling, S. Xu, and B. Welz, “Determination of chromium(III) and chromium(VI) in water using flow injection on-linepreconcentration with selective adsorption on activated alu-mina and flame atomic absorption spectrometric detection,”Analytical Chemistry, vol. 64, no. 24, pp. 3101–3108, 1992.
[2] D. T. Gjerde, D. R. Wiederin, F. G. Smith, and B. M. Mattson,“Metal speciation by means of microbore columns with direct-injection nebulization by inductively coupled plasma atomicemission spectroscopy,” Journal of Chromatography, vol. 640,no. 1-2, pp. 73–78, 1993.
[3] D. G. Themelis, F. S. Kika, and A. Economou, “Flow injec-tion direct spectrophotometric assay for the speciation of tracechromium(III) and chromium(VI) using chromotropic acidas chromogenic reagent,” Talanta, vol. 69, no. 3, pp. 615–620,2006.
[4] M. V. Balarama Krishna, K. Chandrasekaran, S. V. Rao, D.Karunasagar, and J. Arunachalam, “Speciation of Cr(III) and

6 Journal of Automated Methods and Management in Chemistry
Cr(VI) in waters using immobilized moss and determinationby ICP-MS and FAAS,” Talanta, vol. 65, no. 1, pp. 135–143,2005.
[5] Y. Li and H. Xue, “Determination of Cr(III) and Cr(VI) speciesin natural waters by catalytic cathodic stripping voltammetry,”Analytica Chimica Acta, vol. 448, no. 1-2, pp. 121–134, 2001.
[6] R. E. Shaffer, J. O. Cross, S. L. Rose-Pehrsson, and W. T. Elam,“Speciation of chromium in simulated soil samples using X-ray absorption spectroscopy and multivariate calibration,” An-alytica Chimica Acta, vol. 442, no. 2, pp. 295–304, 2001.
[7] Z. Chen, R. Naidu, and A. Subramanian, “Separation ofchromium (III) and chromium (VI) by capillary electrophore-sis using 2,6-pyridinedicarboxylic acid as a pre-column com-plexation agent,” Journal of Chromatography A, vol. 927, no. 1-2, pp. 219–227, 2001.
[8] B. Demirata, I. Tor, H. Filik, and H. Afsar, “Separation ofCr(III) and Cr(VI) using melamine-formaldehyde resin anddetermination of both species in water by FAAS,” Fresenius’Journal of Analytical Chemistry, vol. 356, no. 6, pp. 375–377,1996.
[9] S. Peraniemi and M. Ahlgren, “Separation of microgramquantities of Cr(III)) and Cr(VI) in aqueous solutions anddetermination by energy dispersive X-ray fluorescence spec-trometry,” Analytica Chimica Acta, vol. 315, no. 3, pp. 365–370, 1995.
[10] K. S. Subramanian, “Determination of chromium(III) andchromium(VI) by ammonium pyrrolidinecarbodithioate-methyl isobutyl ketone furnace atomic absorption spectrome-try,” Analytical Chemistry, vol. 60, no. 1, pp. 11–15, 1988.
[11] A. Beni, R. Karosi, and J. Posta, “Speciation of hexavalentchromium in waters by liquid-liquid extraction and GFAASdetermination,” Microchemical Journal, vol. 85, no. 1, pp. 103–108, 2007.
[12] K. Kargosha, M. Noroozifar, and J. Azad, “Preconcentrationand speciation of chromium in natural waters using ion-pairextraction and graphite furnace AAS,” Atomic Spectroscopy,vol. 23, no. 3, pp. 98–102, 2002.
[13] M. Noroozifar and M. Khorasani-Motlagh, “Specific extrac-tion of chromium as tetrabutylammonium-chromate andspectrophotometric determination by diphenylcarbazide: spe-ciation of chromium in effluent streams,” Analytical Sciences,vol. 19, no. 5, pp. 705–708, 2003.
[14] P. G. Krishna, J. M. Gladis, U. Rambabu, T. P. Rao, and G. R. K.Naidu, “Preconcentrative separation of chromium(VI) speciesfrom chromium(III) by coprecipitation of its ethyl xanthatecomplex onto naphthalene,” Talanta, vol. 63, no. 3, pp. 541–546, 2004.
[15] N.-K. Djane, K. Ndung’u, C. Johnsson, H. Sartz, T. Tornstrom,and L. Mathiasson, “Chromium speciation in natural watersusing serially connected supported liquid membranes,” Ta-lanta, vol. 48, no. 5, pp. 1121–1132, 1999.
[16] G. Hu and R. L. Deming, “Speciation of bio-availablechromium in soils by solid-phase extraction and graphitefurnace atomic absorption spectrometry,” Analytica ChimicaActa, vol. 535, no. 1-2, pp. 237–242, 2005.
[17] J. Chwastowska, W. Skwara, E. Sterlinska, and L. Pszonicki,“Speciation of chromium in mineral waters and salinas bysolid-phase extraction and graphite furnace atomic absorp-tion spectrometry,” Talanta, vol. 66, no. 5, pp. 1345–1349,2005.
[18] E. Pobozy, E. Wojasinska, and M. Trojanowicz, “Ion chro-matographic speciation of chromium with diphenylcarbazide-based spectrophotometric detection,” Journal of Chromatogra-phy A, vol. 736, no. 1-2, pp. 141–150, 1996.
[19] M. Tuzen and M. Soylak, “Chromium speciation in environ-mental samples by solid phase extraction on Chromosorb108,” Journal of Hazardous Materials, vol. 129, no. 1–3, pp.266–273, 2006.
[20] A.-N. Tang, D.-Q. Jiang, Y. Jiang, S.-W. Wang, and X.-P. Yan,“Cloud point extraction for high-performance liquid chro-matographic speciation of Cr(III) and Cr(VI) in aqueous solu-tions,” Journal of Chromatography A, vol. 1036, no. 2, pp. 183–188, 2004.
[21] E. K. Paleologos, S. I. Lafis, S. M. Tzouwara-Karayanni, andM. I. Karayannis, “Speciation analysis of CrIII-CrVI using flowinjection analysis with fluorimetric detection,” The Analyst,vol. 123, no. 5, pp. 1005–1009, 1998.
[22] P. Liang, T. Shi, H. Lu, Z. Jiang, and B. Hu, “Speciation ofCr(III) and Cr(VI) by nanometer titanium dioxide micro-column and inductively coupled plasma atomic emissionspectrometry,” Spectrochimica Acta, vol. 58, no. 9, pp. 1709–1714, 2003.
[23] B. P. Bubnis, M. R. Straka, and G. E. Pacey, “Metal speciationby flow-injection analysis,” Talanta, vol. 30, pp. 841–844, 1983.
[24] J. E. T. Andersen, “Introduction of hydrogen peroxide as anoxidant in flow injection analysis: speciation of Cr(III) andCr(VI),” Analytica Chimica Acta, vol. 361, no. 1-2, pp. 125–131, 1998.
[25] R. M. Cespon-Romero, M. C. Yebra-Biurrun, and M.P. Bermejo-Barrera, “Preconcentration and speciation ofchromium by the determination of total chromium andchromium(III) in natural waters by flame atomic absorptionspectrometry with a chelating ion-exchange flow injection sys-tem,” Analytica Chimica Acta, vol. 327, no. 1, pp. 37–45, 1996.
[26] Y. Luo, S. Nakano, D. A. Holman, J. Ruzicka, and G. D. Chris-tian, “Sequential injection wetting film extraction applied tothe spectrophotometric determination of chromium(VI) andchromium(III) in water,” Talanta, vol. 44, no. 9, pp. 1563–1571, 1997.
[27] E. Vassileva, “Use of high surface area TiO2 for preconcentra-tion and following determination of Cr species by on-line flowinjection inductively coupled plasma atomic emission spec-trometry,” Analusis, vol. 28, no. 9, pp. 878–884, 2000.
[28] Y. C. Sun, C. Y. Lin, S. F. Wu, and Y. T. Chung, “Evaluation ofon-line desalter-inductively coupled plasma-mass spectrom-etry system for determination of Cr(III), Cr(VI), and totalchromium concentrations in natural water and urine sam-ples,” Spectrochimica Acta B, vol. 61, no. 2, pp. 230–234, 2006.
[29] Z. Fang, Flow Injection Atomic Absorption Spectrometry, JohnWiley & Sons, New York, NY, USA, 1995.
[30] A. Sanz-Medel, Flow Analysis with Atomic Spectrometric Detec-tors, Elsevier Science, Amsterdam, The Netherlands, 1998.
[31] L. H. J. Lajunen, Spectrochemical Analysis by Atomic Absorptionand Emission, Royal Society of Chemistry, London, UK, 1992.