application of knudsen thermal force for detection of co
TRANSCRIPT
ISSN 0015-4628, Fluid Dynamics, 2018, Vol. 53, No. 6, pp. 812–823. c© Pleiades Publishing, Ltd., 2018.Original Russian Text c© M. Barzegar Gerdroodbary, D.D. Ganji, R. Moradi, Ali Abdollahi, 2018, published in Izvestiya Rossiiskoi Akademii Nauk, Mekhanika Zhidkostii Gaza, 2018, No. 6, pp. 94–104.
Application of Knudsen Thermal Force for Detection of CO2
in Low-Pressure Micro Gas Sensor
M. Barzegar Gerdroodbary1*, D. D. Ganji1, R. Moradi2, and Ali Abdollahi3
1Department of Mechanical Engineering, Babol University of Technology, Babol, Iran2Department of Chemical Engineering, School of Engineering & Applied Science,
Khazar University, Baku, Azerbaijan3Department of Mechanical Engineering, Islamic Azad University, Najafabad, Iran
Received December 9, 2017
Abstract—Development of new techniques for detection of CO2 gas is significant for decrease thedangers of CO2. In this research, numerical simulations are performed to evaluate the performanceof a new micro gas sensor (MIKRA) for the detection of CO2 gas. This device works due totemperature difference inside a rectangular enclosure with heat and cold arms as the non-isothermalwalls at low pressure condition. In this study, the pressure of CO2 is varied from 62 to 1500 Pacorrespond to Knudsen number from 0.1 to 4.5 to investigate all characteristics of the thermal-drivenforce inside the MEMS sensor. In order to simulate a rarefied gas inside the micro gas detector,Boltzmann equations are applied to obtain high precision results. To solve these equations, DirectSimulation Monte Carlo (DSMC) approach is used as a robust method for the non-equilibriumflow field. Our findings show that value of generated Knudsen force significantly different when thefraction of CO2 in N2–CO2 mixtures is varied. This indicates that this micro gas sensor couldprecisely detect the concentration of CO2 gas in a low-pressure environment. In addition, theobtained results demonstrate that the mechanism of force generation highly varies in the differentpressure conditions.Keywords: CO2 gas detection, Knudsen molecular force; DSMC; low-pressure gas actuators;MEMS.
DOI: 10.1134/S0015462818060149
1. INTRODUCTION
Sensors are the main device for several industrial and scientific applications. Since the first stepfor the separation of the mixture is detection, the development of this sensor could highly enhance theseparation techniques such as membranes, cryogenic column and gas centrifuges [1–2]. In addition,several researchers have tried to develop new simple devices for the detection of the dangerous gas suchas NH3, CO2, and H2S. Due to the significance of inert gas, detection of these gases is important forscientists.
Microsensors are highly developed due to their applications in the different device such as medicalinstruments. One of the new methods for the detection of the gas is the application of the Knudsen forcewhich is highly sensitive to the properties of the gas. Indeed, the non-homogeneity of the temperaturein the low-pressure condition produce a force known as Knudsen force. Galkin et al. [3–4] investigatedsome kinetic effects in continuum flows. This special characteristic motivated the researchers to usethis approach for measurement of pressure. Alexandrov et al. [5–6] studied thermal stress effect and itsexperimental detection.
The physics of Knudsen force in rarefied conditions was investigated by various researchers. Ketsde-ver et al. [7] reviewed more than hundred papers and documents to present a comprehensive literaturereview on the origin of the Knudsen force and its history. In addition, the physics of the Knudsen forceare explained in this paper. Among various studies, some of the recent work tried to apply this force
*E-mail: [email protected].
812
APPLICATION OF KNUDSEN THERMAL FORCE 813
for diverse applications. Since Crookes radiometer [8] was the first device which applied Knudsen force,various researchers performed extensive studies on this device. Passian et al. [9] investigated thermaltranspiration at the microscale by a Crookes cantilever. They [10] also studied Knudsen forces on micro-cantilevers and presented theoretical discussions of the magnitude of the Knudsen forces in variousconditions. Moreover, several researches [11–13] investigated the Knudsen force in the rarefied gas.Aoki et al. [14–15] performed numerical simulations to observe the main characteristics of the Knudsenforce. Bosworth et al. [16] presented a study on the measurement of negative thermophoretic force.
Several works performed to apply a Direct Simulation Monte Carlo (DSMC) for the simulation ofthe rarefied gas. Balaj et al. [17, 18] focused on the effects of shear work on non-equilibrium heattransfer characteristics of rarefied gas flows through micro/nanochannels. Poozesh and Mirzaei [19, 20]applied the lattice Boltzmann method for flow simulation around cambered airfoil by using conformalmapping and intermediate domain. Eskandari and Nourazar [21] focused on the time relaxed MonteCarlo computations for the lid-driven microcavity flow. Strongrich et al. [22] performed experimentalmeasurements and numerical simulations of the Knudsen force on a non-uniformly heated beam.
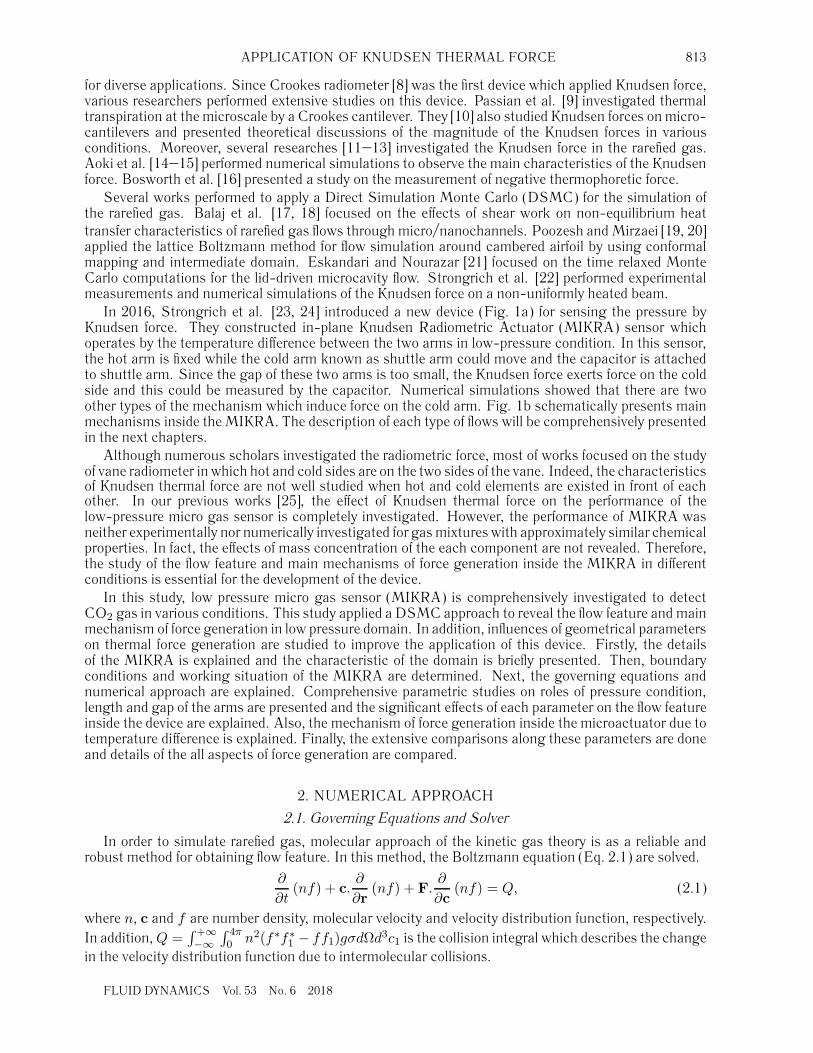
In 2016, Strongrich et al. [23, 24] introduced a new device (Fig. 1a) for sensing the pressure byKnudsen force. They constructed in-plane Knudsen Radiometric Actuator (MIKRA) sensor whichoperates by the temperature difference between the two arms in low-pressure condition. In this sensor,the hot arm is fixed while the cold arm known as shuttle arm could move and the capacitor is attachedto shuttle arm. Since the gap of these two arms is too small, the Knudsen force exerts force on the coldside and this could be measured by the capacitor. Numerical simulations showed that there are twoother types of the mechanism which induce force on the cold arm. Fig. 1b schematically presents mainmechanisms inside the MIKRA. The description of each type of flows will be comprehensively presentedin the next chapters.
Although numerous scholars investigated the radiometric force, most of works focused on the studyof vane radiometer in which hot and cold sides are on the two sides of the vane. Indeed, the characteristicsof Knudsen thermal force are not well studied when hot and cold elements are existed in front of eachother. In our previous works [25], the effect of Knudsen thermal force on the performance of thelow-pressure micro gas sensor is completely investigated. However, the performance of MIKRA wasneither experimentally nor numerically investigated for gas mixtures with approximately similar chemicalproperties. In fact, the effects of mass concentration of the each component are not revealed. Therefore,the study of the flow feature and main mechanisms of force generation inside the MIKRA in differentconditions is essential for the development of the device.
In this study, low pressure micro gas sensor (MIKRA) is comprehensively investigated to detectCO2 gas in various conditions. This study applied a DSMC approach to reveal the flow feature and mainmechanism of force generation in low pressure domain. In addition, influences of geometrical parameterson thermal force generation are studied to improve the application of this device. Firstly, the detailsof the MIKRA is explained and the characteristic of the domain is briefly presented. Then, boundaryconditions and working situation of the MIKRA are determined. Next, the governing equations andnumerical approach are explained. Comprehensive parametric studies on roles of pressure condition,length and gap of the arms are presented and the significant effects of each parameter on the flow featureinside the device are explained. Also, the mechanism of force generation inside the microactuator due totemperature difference is explained. Finally, the extensive comparisons along these parameters are doneand details of the all aspects of force generation are compared.
2. NUMERICAL APPROACH
2.1. Governing Equations and Solver
In order to simulate rarefied gas, molecular approach of the kinetic gas theory is as a reliable androbust method for obtaining flow feature. In this method, the Boltzmann equation (Eq. 2.1) are solved.
∂
∂t(nf) + c.
∂
∂r(nf) + F.
∂
∂c(nf) = Q, (2.1)
where n, c and f are number density, molecular velocity and velocity distribution function, respectively.In addition, Q =
∫ +∞−∞
∫ 4π0 n2(f∗f∗
1 − ff1)gσdΩd3c1 is the collision integral which describes the change
in the velocity distribution function due to intermolecular collisions.
FLUID DYNAMICS Vol. 53 No. 6 2018
814 BARZEGAR et al.
Shuttle
Shuttle Arm
Actuation Capacitor
Sense Capacitor
Suspension
4 mm4 m
m
Heater Arm
Main Circulation(thermalcreeping)
Molecular force(thermal stress)
ThermalEdge flow
Shear Force
Gold Hot
(a)
(b)
Fig. 1. (a) MIKRA device [17], (b) Schematic of flow inside the MEMS sensor.
In order to solve the Boltzmann equation, some approaches are available. Several studies [16–18]showed that the DSMC method of Bird [27], as a particle method based on kinetic theory for simulationof rarefied gases, is a reliable approach for such molecular regime. In the present study, open-sourcedsmcfoam code is applied to obtain from a proficient and flexible implementation of complex models[28]. dsmcfoam has been established within the framework of the open source software of OpenFOAMversion 1.7. Numerical technique is widely used for solving engineering problems [29–34].
2.2. Numerical Procedure
In this work, the variable hard sphere (VHS) collision model is applied to simulate the collision.Moreover, collision pairs are chosen based on the no time counter (NTC) method, in which thecomputational time is proportional to the number of simulator particles [23].
In the present model, the size of the gap (distance between the heater and shuttle arms) is known asthe characteristic length (L) and it is approximately 20 μm. The total number of simulated particles wasapproximately 2.48 × 10+5. We calculated the time step and it is 1× 10⁻⁸ (s), smaller than the meancollision time. The physical time of these simulations was 0.015 s to reach steady state condition. For atypical simulation, twenty particles are initially set in each cell to minimize the statistical scatter. Table 1
FLUID DYNAMICS Vol. 53 No. 6 2018
APPLICATION OF KNUDSEN THERMAL FORCE 815
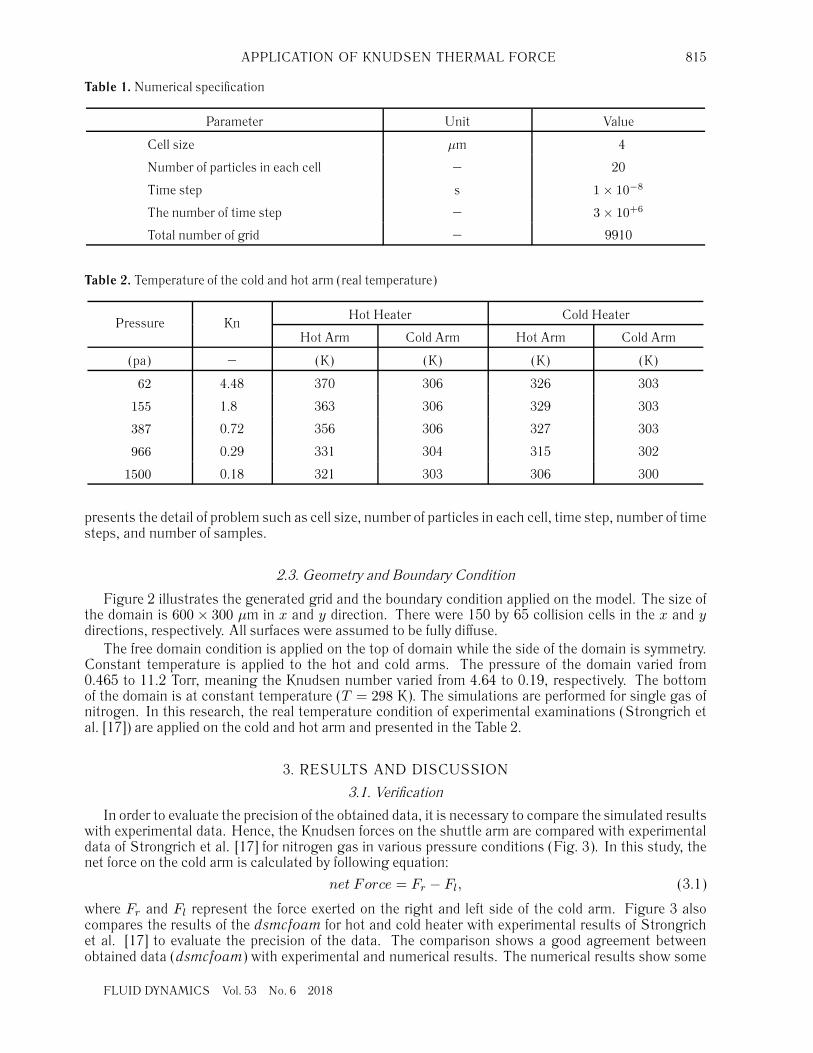
Table 1. Numerical specification
Parameter Unit Value
Cell size μm 4
Number of particles in each cell – 20
Time step s 1× 10⁻⁸
The number of time step – 3× 10+6
Total number of grid – 9910
Table 2. Temperature of the cold and hot arm (real temperature)
Pressure KnHot Heater Cold Heater
Hot Arm Cold Arm Hot Arm Cold Arm
(pa) – (K) (K) (K) (K)
62 4.48 370 306 326 303
155 1.8 363 306 329 303
387 0.72 356 306 327 303
966 0.29 331 304 315 302
1500 0.18 321 303 306 300
presents the detail of problem such as cell size, number of particles in each cell, time step, number of timesteps, and number of samples.
2.3. Geometry and Boundary Condition
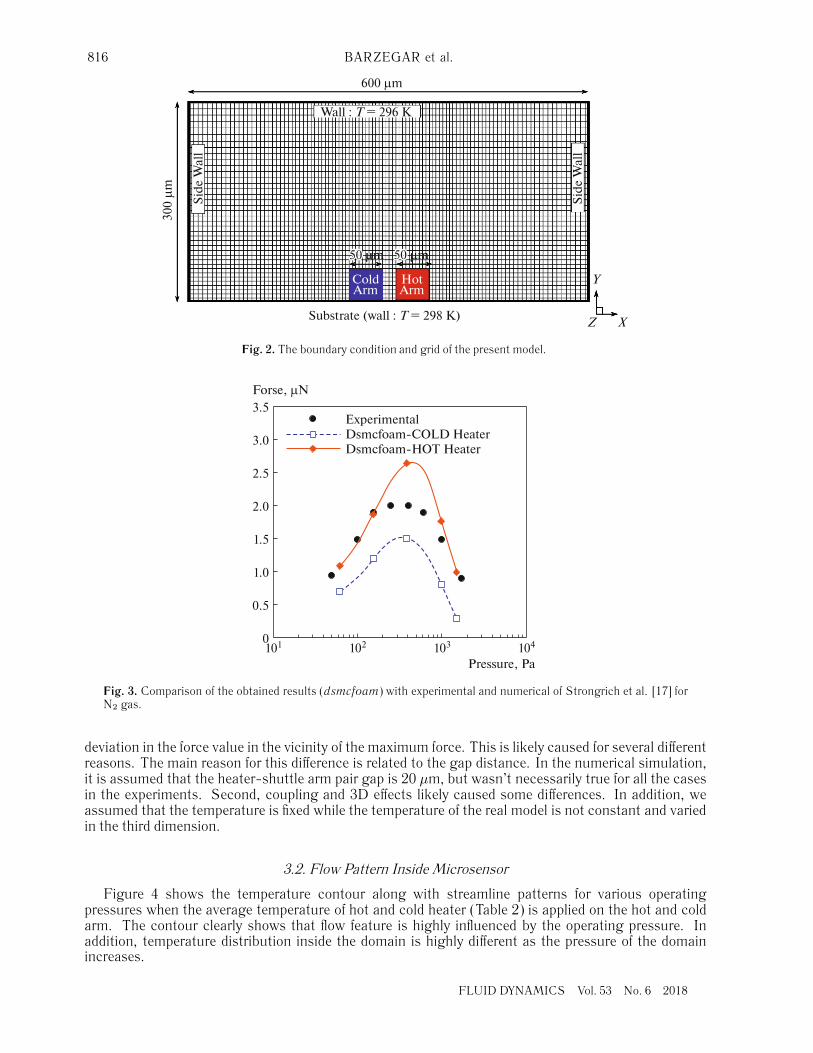
Figure 2 illustrates the generated grid and the boundary condition applied on the model. The size ofthe domain is 600 × 300 μm in x and y direction. There were 150 by 65 collision cells in the x and ydirections, respectively. All surfaces were assumed to be fully diffuse.
The free domain condition is applied on the top of domain while the side of the domain is symmetry.Constant temperature is applied to the hot and cold arms. The pressure of the domain varied from0.465 to 11.2 Torr, meaning the Knudsen number varied from 4.64 to 0.19, respectively. The bottomof the domain is at constant temperature (T = 298 K). The simulations are performed for single gas ofnitrogen. In this research, the real temperature condition of experimental examinations (Strongrich etal. [17]) are applied on the cold and hot arm and presented in the Table 2.
3. RESULTS AND DISCUSSION
3.1. Verification
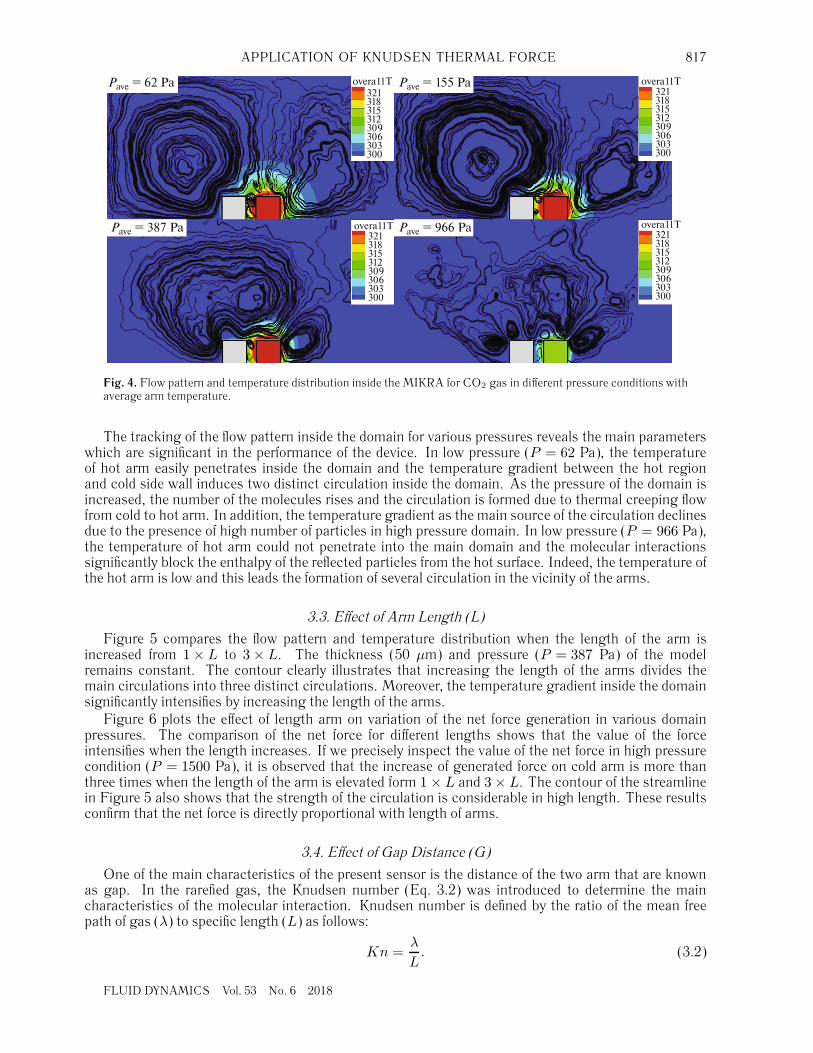
In order to evaluate the precision of the obtained data, it is necessary to compare the simulated resultswith experimental data. Hence, the Knudsen forces on the shuttle arm are compared with experimentaldata of Strongrich et al. [17] for nitrogen gas in various pressure conditions (Fig. 3). In this study, thenet force on the cold arm is calculated by following equation:
net Force = Fr − Fl, (3.1)
where Fr and Fl represent the force exerted on the right and left side of the cold arm. Figure 3 alsocompares the results of the dsmcfoam for hot and cold heater with experimental results of Strongrichet al. [17] to evaluate the precision of the data. The comparison shows a good agreement betweenobtained data (dsmcfoam) with experimental and numerical results. The numerical results show some
FLUID DYNAMICS Vol. 53 No. 6 2018
816 BARZEGAR et al.
Wall : T = 296 K
Substrate (wall : T = 298 K)
Side
Wal
l
Side
Wal
l
600 �m
300 �m
5050 �m50 �m 5050 �m50 �m
ColdArm
HotArm
Y
Z X
Fig. 2. The boundary condition and grid of the present model.
3.5ExperimentalDsmcfoam-COLD HeaterDsmcfoam-HOT Heater
Forse, �N
3.0
2.5
2.0
1.5
0.5
101 102 103 104
Pressure, Pa
0
1.0
Fig. 3. Comparison of the obtained results (dsmcfoam) with experimental and numerical of Strongrich et al. [17] forN2 gas.
deviation in the force value in the vicinity of the maximum force. This is likely caused for several differentreasons. The main reason for this difference is related to the gap distance. In the numerical simulation,it is assumed that the heater-shuttle arm pair gap is 20 μm, but wasn’t necessarily true for all the casesin the experiments. Second, coupling and 3D effects likely caused some differences. In addition, weassumed that the temperature is fixed while the temperature of the real model is not constant and variedin the third dimension.
3.2. Flow Pattern Inside Microsensor
Figure 4 shows the temperature contour along with streamline patterns for various operatingpressures when the average temperature of hot and cold heater (Table 2) is applied on the hot and coldarm. The contour clearly shows that flow feature is highly influenced by the operating pressure. Inaddition, temperature distribution inside the domain is highly different as the pressure of the domainincreases.
FLUID DYNAMICS Vol. 53 No. 6 2018
APPLICATION OF KNUDSEN THERMAL FORCE 817
Pave = 62 Pa Pave = 155 Paovera11T321318315312309306303300
overa11T321318315312309306303300
overa11T321318315312309306303300
overa11T321318315312309306303300
Pave = 387 Pa Pave = 966 Pa
Fig. 4. Flow pattern and temperature distribution inside the MIKRA for CO2 gas in different pressure conditions withaverage arm temperature.
The tracking of the flow pattern inside the domain for various pressures reveals the main parameterswhich are significant in the performance of the device. In low pressure (P = 62 Pa), the temperatureof hot arm easily penetrates inside the domain and the temperature gradient between the hot regionand cold side wall induces two distinct circulation inside the domain. As the pressure of the domain isincreased, the number of the molecules rises and the circulation is formed due to thermal creeping flowfrom cold to hot arm. In addition, the temperature gradient as the main source of the circulation declinesdue to the presence of high number of particles in high pressure domain. In low pressure (P = 966 Pa),the temperature of hot arm could not penetrate into the main domain and the molecular interactionssignificantly block the enthalpy of the reflected particles from the hot surface. Indeed, the temperature ofthe hot arm is low and this leads the formation of several circulation in the vicinity of the arms.
3.3. Effect of Arm Length (L)
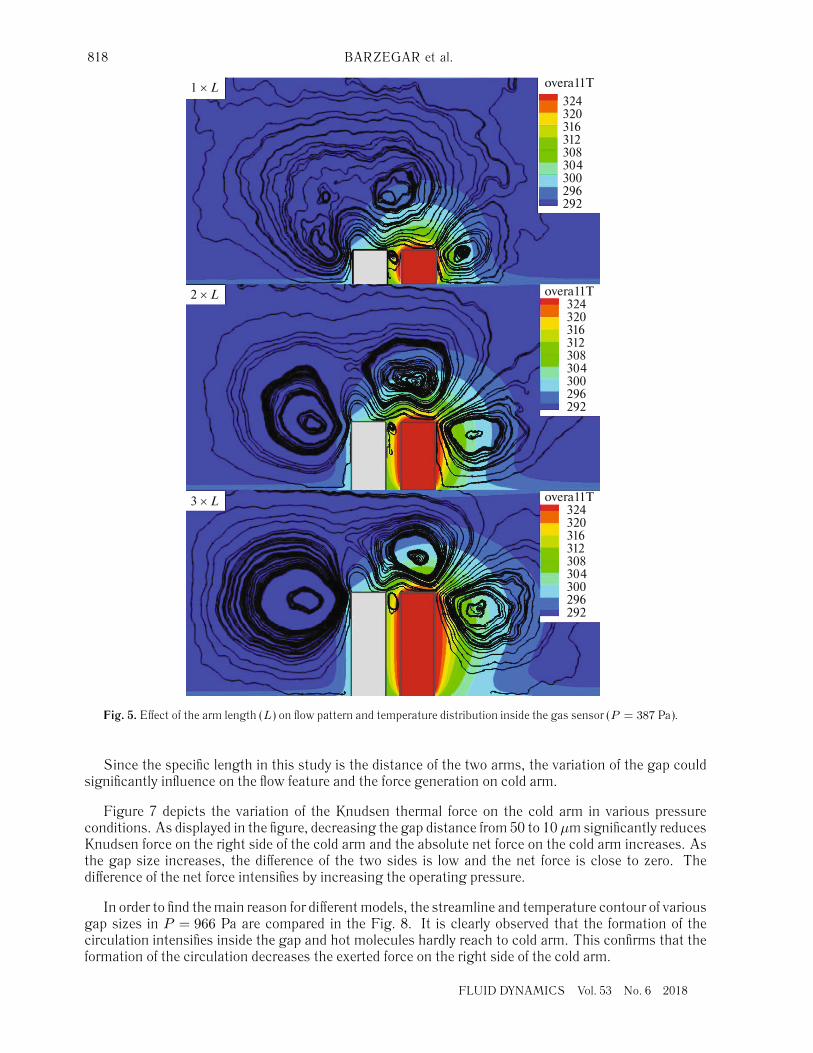
Figure 5 compares the flow pattern and temperature distribution when the length of the arm isincreased from 1× L to 3× L. The thickness (50 μm) and pressure (P = 387 Pa) of the modelremains constant. The contour clearly illustrates that increasing the length of the arms divides themain circulations into three distinct circulations. Moreover, the temperature gradient inside the domainsignificantly intensifies by increasing the length of the arms.
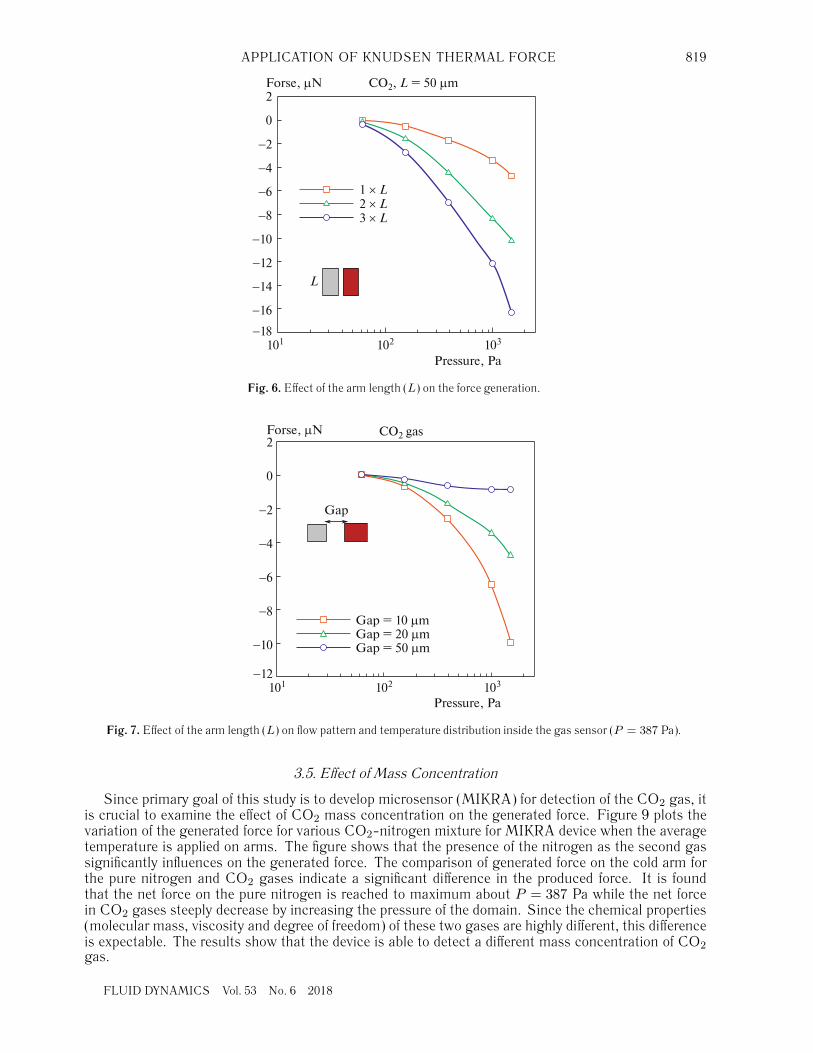
Figure 6 plots the effect of length arm on variation of the net force generation in various domainpressures. The comparison of the net force for different lengths shows that the value of the forceintensifies when the length increases. If we precisely inspect the value of the net force in high pressurecondition (P = 1500 Pa), it is observed that the increase of generated force on cold arm is more thanthree times when the length of the arm is elevated form 1× L and 3× L. The contour of the streamlinein Figure 5 also shows that the strength of the circulation is considerable in high length. These resultsconfirm that the net force is directly proportional with length of arms.
3.4. Effect of Gap Distance (G)
One of the main characteristics of the present sensor is the distance of the two arm that are knownas gap. In the rarefied gas, the Knudsen number (Eq. 3.2) was introduced to determine the maincharacteristics of the molecular interaction. Knudsen number is defined by the ratio of the mean freepath of gas (λ) to specific length (L) as follows:
Kn =λ
L. (3.2)
FLUID DYNAMICS Vol. 53 No. 6 2018
818 BARZEGAR et al.
overa11T324320316312308304300296292
overa11T324320316312308304300296292
overa11T324320316312308304300296292
3 � L
2 � L
1 � L
Fig. 5. Effect of the arm length (L) on flow pattern and temperature distribution inside the gas sensor (P = 387 Pa).
Since the specific length in this study is the distance of the two arms, the variation of the gap couldsignificantly influence on the flow feature and the force generation on cold arm.
Figure 7 depicts the variation of the Knudsen thermal force on the cold arm in various pressureconditions. As displayed in the figure, decreasing the gap distance from 50 to 10 μm significantly reducesKnudsen force on the right side of the cold arm and the absolute net force on the cold arm increases. Asthe gap size increases, the difference of the two sides is low and the net force is close to zero. Thedifference of the net force intensifies by increasing the operating pressure.
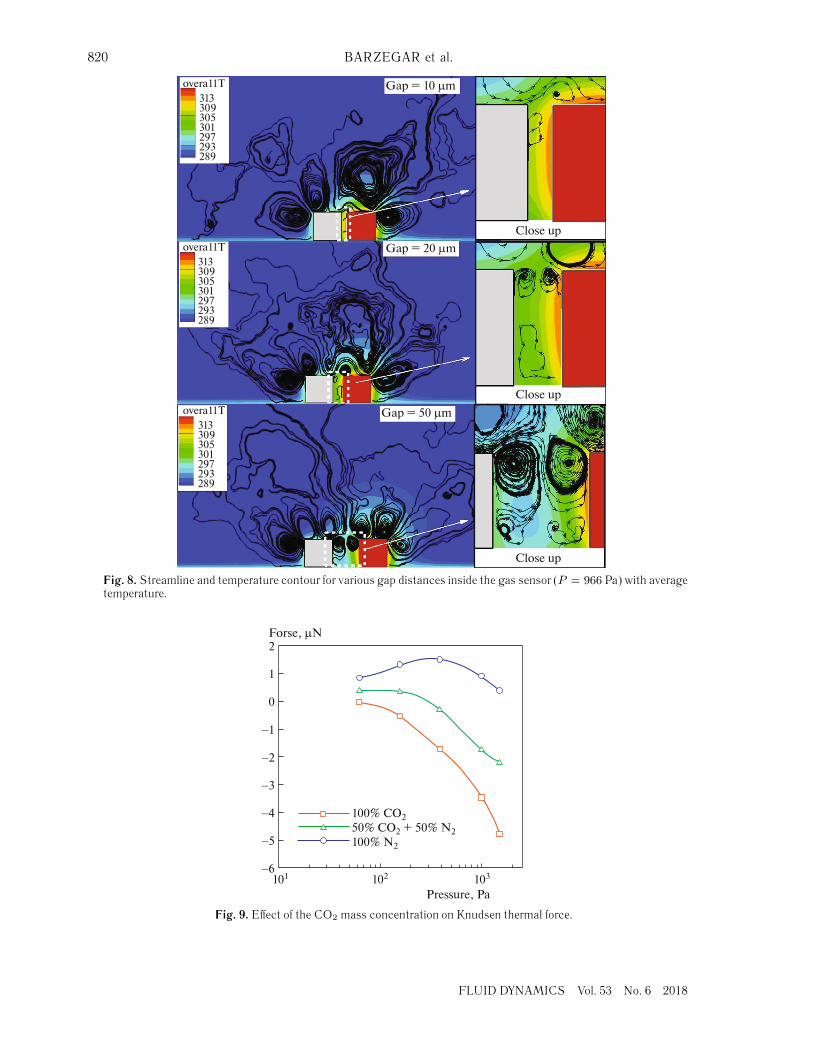
In order to find the main reason for different models, the streamline and temperature contour of variousgap sizes in P = 966 Pa are compared in the Fig. 8. It is clearly observed that the formation of thecirculation intensifies inside the gap and hot molecules hardly reach to cold arm. This confirms that theformation of the circulation decreases the exerted force on the right side of the cold arm.
FLUID DYNAMICS Vol. 53 No. 6 2018
APPLICATION OF KNUDSEN THERMAL FORCE 819
Forse, μN2
−2
−4
−6
−8
−10
−12
−14
−16
−18
0
CO2, L = 50 μm
101 102 103
Pressure, Pa
3 × L 2 × L 1 × L
L
Fig. 6. Effect of the arm length (L) on the force generation.
Forse, �N CO2 gas
101
2
�2
�4
�6
�8
�10
�12
0
Gap
Gap = 10 �mGap = 20 �mGap = 50 �m
102 103
Pressure, Pa
Fig. 7. Effect of the arm length (L) on flow pattern and temperature distribution inside the gas sensor (P = 387 Pa).
3.5. Effect of Mass Concentration
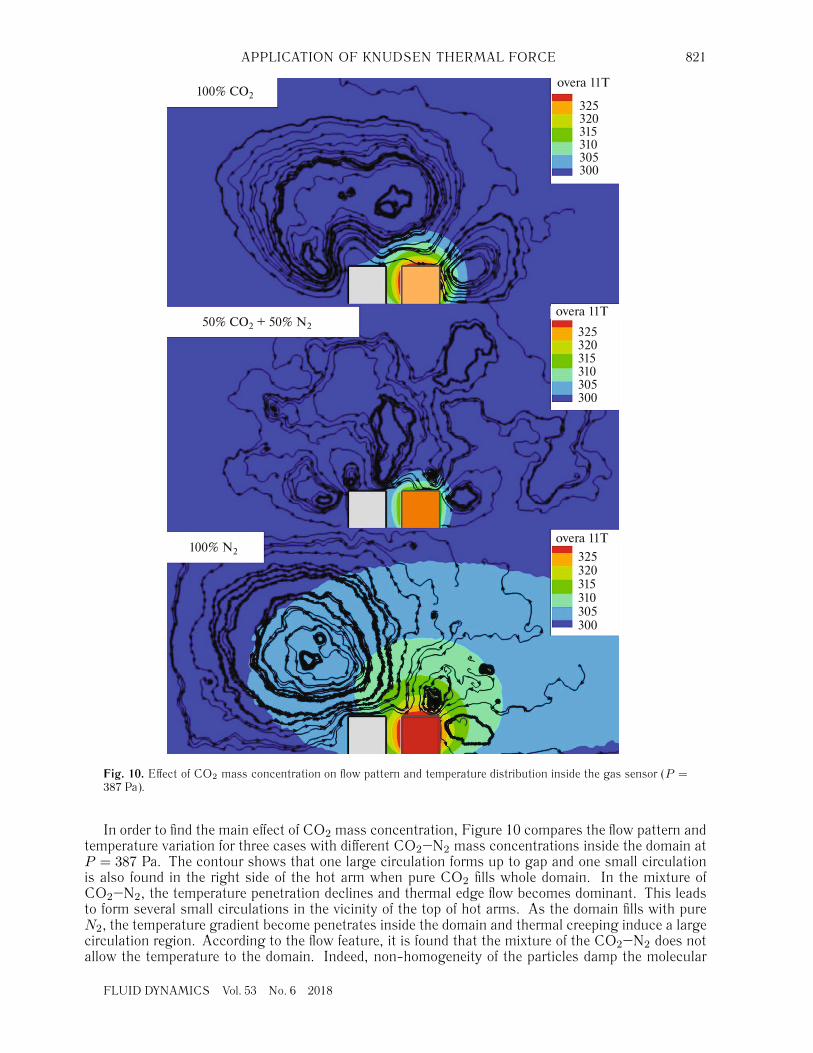
Since primary goal of this study is to develop microsensor (MIKRA) for detection of the CO2 gas, itis crucial to examine the effect of CO2 mass concentration on the generated force. Figure 9 plots thevariation of the generated force for various CO2-nitrogen mixture for MIKRA device when the averagetemperature is applied on arms. The figure shows that the presence of the nitrogen as the second gassignificantly influences on the generated force. The comparison of generated force on the cold arm forthe pure nitrogen and CO2 gases indicate a significant difference in the produced force. It is foundthat the net force on the pure nitrogen is reached to maximum about P = 387 Pa while the net forcein CO2 gases steeply decrease by increasing the pressure of the domain. Since the chemical properties(molecular mass, viscosity and degree of freedom) of these two gases are highly different, this differenceis expectable. The results show that the device is able to detect a different mass concentration of CO2gas.
FLUID DYNAMICS Vol. 53 No. 6 2018
820 BARZEGAR et al.
overa11T Gap = 10 �m
Сlose up
Сlose up
Сlose up
Gap = 20 �m
Gap = 50 �m
313309305301297293289
overa11T313309305301297293289
overa11T313309305301297293289
Fig. 8. Streamline and temperature contour for various gap distances inside the gas sensor (P = 966 Pa) with averagetemperature.
Forse, μN2
−2
−3
−1
−4
−5
−6
0
100% CO250% CO2 + 50% N2 100% N2
1
101 102 103
Pressure, Pa
Fig. 9. Effect of the CO2 mass concentration on Knudsen thermal force.
FLUID DYNAMICS Vol. 53 No. 6 2018
APPLICATION OF KNUDSEN THERMAL FORCE 821
100% CO2
50% CO2 + 50% N2
100% N2
overa 11T
325320315310305300
overa 11T
overa 11T
325320315310305300
325320315310305300
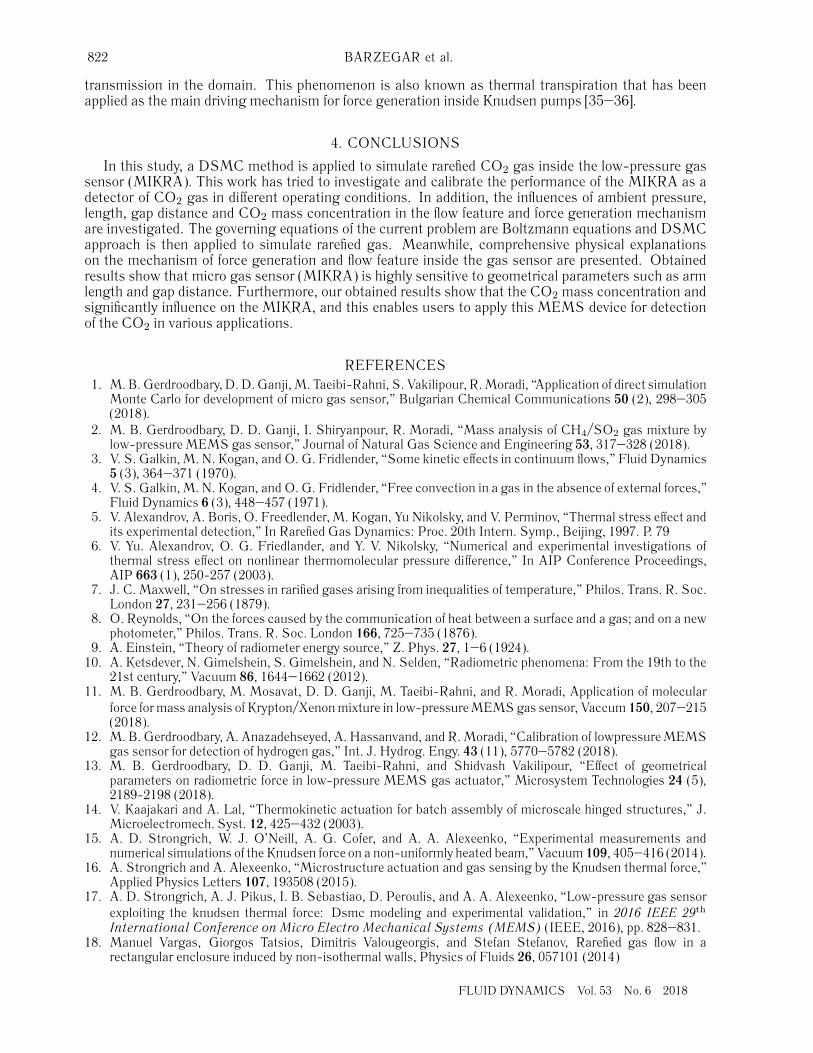
Fig. 10. Effect of CO2 mass concentration on flow pattern and temperature distribution inside the gas sensor (P =387 Pa).
In order to find the main effect of CO2 mass concentration, Figure 10 compares the flow pattern andtemperature variation for three cases with different CO2–N2 mass concentrations inside the domain atP = 387 Pa. The contour shows that one large circulation forms up to gap and one small circulationis also found in the right side of the hot arm when pure CO2 fills whole domain. In the mixture ofCO2–N2, the temperature penetration declines and thermal edge flow becomes dominant. This leadsto form several small circulations in the vicinity of the top of hot arms. As the domain fills with pureN2, the temperature gradient become penetrates inside the domain and thermal creeping induce a largecirculation region. According to the flow feature, it is found that the mixture of the CO2–N2 does notallow the temperature to the domain. Indeed, non-homogeneity of the particles damp the molecular
FLUID DYNAMICS Vol. 53 No. 6 2018
822 BARZEGAR et al.
transmission in the domain. This phenomenon is also known as thermal transpiration that has beenapplied as the main driving mechanism for force generation inside Knudsen pumps [35–36].
4. CONCLUSIONS
In this study, a DSMC method is applied to simulate rarefied CO2 gas inside the low-pressure gassensor (MIKRA). This work has tried to investigate and calibrate the performance of the MIKRA as adetector of CO2 gas in different operating conditions. In addition, the influences of ambient pressure,length, gap distance and CO2 mass concentration in the flow feature and force generation mechanismare investigated. The governing equations of the current problem are Boltzmann equations and DSMCapproach is then applied to simulate rarefied gas. Meanwhile, comprehensive physical explanationson the mechanism of force generation and flow feature inside the gas sensor are presented. Obtainedresults show that micro gas sensor (MIKRA) is highly sensitive to geometrical parameters such as armlength and gap distance. Furthermore, our obtained results show that the CO2 mass concentration andsignificantly influence on the MIKRA, and this enables users to apply this MEMS device for detectionof the CO2 in various applications.
REFERENCES1. M. B. Gerdroodbary, D. D. Ganji, M. Taeibi-Rahni, S. Vakilipour, R. Moradi, “Application of direct simulation
Monte Carlo for development of micro gas sensor,” Bulgarian Chemical Communications 50 (2), 298–305(2018).
2. M. B. Gerdroodbary, D. D. Ganji, I. Shiryanpour, R. Moradi, “Mass analysis of CH4/SO2 gas mixture bylow-pressure MEMS gas sensor,” Journal of Natural Gas Science and Engineering 53, 317–328 (2018).
3. V. S. Galkin, M. N. Kogan, and O. G. Fridlender, “Some kinetic effects in continuum flows,” Fluid Dynamics5 (3), 364–371 (1970).
4. V. S. Galkin, M. N. Kogan, and O. G. Fridlender, “Free convection in a gas in the absence of external forces,”Fluid Dynamics 6 (3), 448–457 (1971).
5. V. Alexandrov, A. Boris, O. Freedlender, M. Kogan, Yu Nikolsky, and V. Perminov, “Thermal stress effect andits experimental detection,” In Rarefied Gas Dynamics: Proc. 20th Intern. Symp., Beijing, 1997. P. 79
6. V. Yu. Alexandrov, O. G. Friedlander, and Y. V. Nikolsky, “Numerical and experimental investigations ofthermal stress effect on nonlinear thermomolecular pressure difference,” In AIP Conference Proceedings,AIP 663 (1), 250-257 (2003).
7. J. C. Maxwell, “On stresses in rarified gases arising from inequalities of temperature,” Philos. Trans. R. Soc.London 27, 231–256 (1879).
8. O. Reynolds, “On the forces caused by the communication of heat between a surface and a gas; and on a newphotometer,” Philos. Trans. R. Soc. London 166, 725–735 (1876).
9. A. Einstein, “Theory of radiometer energy source,” Z. Phys. 27, 1–6 (1924).10. A. Ketsdever, N. Gimelshein, S. Gimelshein, and N. Selden, “Radiometric phenomena: From the 19th to the
21st century,” Vacuum 86, 1644–1662 (2012).11. M. B. Gerdroodbary, M. Mosavat, D. D. Ganji, M. Taeibi-Rahni, and R. Moradi, Application of molecular
force for mass analysis of Krypton/Xenon mixture in low-pressure MEMS gas sensor, Vaccum 150, 207–215(2018).
12. M. B. Gerdroodbary, A. Anazadehseyed, A. Hassanvand, and R. Moradi, “Calibration of lowpressure MEMSgas sensor for detection of hydrogen gas,” Int. J. Hydrog. Engy. 43 (11), 5770–5782 (2018).
13. M. B. Gerdroodbary, D. D. Ganji, M. Taeibi-Rahni, and Shidvash Vakilipour, “Effect of geometricalparameters on radiometric force in low-pressure MEMS gas actuator,” Microsystem Technologies 24 (5),2189-2198 (2018).
14. V. Kaajakari and A. Lal, “Thermokinetic actuation for batch assembly of microscale hinged structures,” J.Microelectromech. Syst. 12, 425–432 (2003).
15. A. D. Strongrich, W. J. O’Neill, A. G. Cofer, and A. A. Alexeenko, “Experimental measurements andnumerical simulations of the Knudsen force on a non-uniformly heated beam,” Vacuum 109, 405–416 (2014).
16. A. Strongrich and A. Alexeenko, “Microstructure actuation and gas sensing by the Knudsen thermal force,”Applied Physics Letters 107, 193508 (2015).
17. A. D. Strongrich, A. J. Pikus, I. B. Sebastiao, D. Peroulis, and A. A. Alexeenko, “Low-pressure gas sensorexploiting the knudsen thermal force: Dsmc modeling and experimental validation,” in 2016 IEEE 29th
International Conference on Micro Electro Mechanical Systems (MEMS) (IEEE, 2016), pp. 828–831.18. Manuel Vargas, Giorgos Tatsios, Dimitris Valougeorgis, and Stefan Stefanov, Rarefied gas flow in a
rectangular enclosure induced by non-isothermal walls, Physics of Fluids 26, 057101 (2014)
FLUID DYNAMICS Vol. 53 No. 6 2018
APPLICATION OF KNUDSEN THERMAL FORCE 823
19. R. W. Bosworth, A. L. Ventura, A. D. Ketsdever, and S. F. Gimelshein, “Measurement of negative ther-mophoretic force,” Journal of Fluid Mechanics 805, 207–221 (2016).
20. A. Ventura, N. Gimelshein, S. Gimelshein, and A. Ketsdever, “Effect of vane thickness on radiometric force,”Journal of Fluid Mechanics 735, 684–704 (2013).
21. D. Bond, M. J. Goldsworthy, and V. Wheatley, “Numerical investigation of the heat and mass transfer analogyin rarefied gas flows,” International Journal of Heat and Mass Transfer 85, 971–986 (2015).
22. D. M. Bond, V. Wheatley, and M. Goldsworthy, “Numerical investigation of curved channel Knudsen pumpperformance,” International Journal of Heat and Mass Transfer 76, 1–15 (2014).
23. Mojtaba Balaj, Ehsan Roohi, and Hassan Akhlaghi, “Effects of shear work on non-equilibrium heat transfercharacteristics of rarefied gas flows through micro/nanochannels,” International Journal of Heat and MassTransfer 83, 69–74 (2015).
24. X. Guo, D. Singh, J. Murthy, and A. A. Alexeenko, “Numerical simulation of gas-phonon coupling in thermaltranspiration flows,” Physical Review E 80 (4), 046310.
25. M. B. Gerdroodbary, D. D. Ganji, M. Taeibi-Rahni, and S. Vakilipour, “Effect of Knudsen thermal force onthe performance of low-pressure micro gas sensor,” The European Physical Journal Plus 132 (7), 315 (2017).
26. J. Nabeth, S. Chigullapalli, and A. A. Alexeenko, “Quantifying the Knudsen force on heated microbeams: Acompact model and direct comparison with measurements,” Physical Review E 83 (6), 066306.
27. G. A. Bird, Molecular gas dynamics and the direct simulation of gas flows (Clarendon Press, Oxford,1994).
28. OpenFOAM: the Open Source CFD Toolbox, user Guide, Version 1.6 (2009).29. M. B. Gerdroodbary, M. Barzegar, Y. Amini, D. D. Ganji, and M. R. Takam, “The flow feature of transverse
hydrogen jet in presence of micro air jets in supersonic flow,” Advances in Space Research 59, 1330–1340(2017).
30. M. B. Gerdroodbary, M. Barzegar, D. D. Ganji, and Y. Amini, “Numerical study of shock wave interaction ontransverse jets through multiport injector arrays in supersonic crossflow,” Acta Astronautica 115, 422–433(2015)
31. M. B. Gerdroodbary, M. Barzegar, M. R. Takami, H. R. Heidari, K. Fallah, and D. D. Ganji, “Comparison ofthe single/multi transverse jets under the influence of shock wave in supersonic crossflow,” Acta Astronautica123, 283–291 (2016).
32. M. B. Gerdroodbary, M Barzegar, K. Fallah, and H. Pourmirzaagha, “Characteristics of transverse hydrogenjet in presence of multi air jets within scramjet combustor,” Acta Astronautica 132, 25–32 (2017).
33. S. V. Mousavi, M. B. Gerdroodbary, M. Sheikholeslami, and D. D. Ganji, “The influence of a magnetic fieldon the heat transfer of a magnetic nanofluid in a sinusoidal channel,” The European Physical Journal Plus131, 347 (2016).
34. M. B. Gerdroodbary, M. Mokhtari, Sh. Bishehsari, and K. Fallah, “Mitigation of Ammonia Dispersion withMesh Barrier under Various Atmospheric Stability Conditions,” Asian Journal of Atmospheric Environment10, 125–136 (2016).
35. Taishan Zhu and Wenjing Ye, Origin of Knudsen forces on heated microbeams, Physical Review E 82, 036308(2010).
36. Taishan Zhu, Wenjing Ye, and Jun Zhang, Negative Knudsen force on heated microbeams, Physical ReviewE 84, 056316 (2011).
FLUID DYNAMICS Vol. 53 No. 6 2018