application of holography to flow visualization
TRANSCRIPT
NASA Tech nical Memorandum 84325
ASA-TM-84325 19840008462
Application of Holography to Flow Visualization
George Lee
January 1984
NI\5/\ National Aeronautics and Space Administration
---- --
'hIS R N
I RARY 0 Y
LANGLEY RESEARr.H CEN1ER LlBRP.RY, NASA
H TON, VIRGINIA
I
I
I .
I
I
NASA Technical Memorandum 84325
Application of Holography to Flow Visualization
George Lee, Ames Research Center, Moffett Field, California
NI\S/\ National Aeronautics and Space Administration
Ames Research Center Moffett Field , California 94035

SUMMARY
Laser holographic interferometry is being applied to many different types of aerodynamics problems. These include two- and three-dimensional flows in wind tunnels, ballistic ranges, rotor test chambers and turbine facilities. Density over a large field is measured and velocity, pressure, and Mach number can be deduced.
INTRODUCTION
Flow visualization and measurement in aerodynamics continue to be important first steps in aircraft design and in the basic understanding of fluid-flow problems. According to many aerodynamic researchers and designers, the flow must be visualized before it can be understood. As an example, the initial design work on the Space Shuttle included interferograms (fig. 1). Over the years, many types of visualization techniques have been developed - smoke tracers, spark tracers, vapor screens, Schlieren photographs, shadowgraph and interferometry. Among these techniques, only interferometry combines visualization with a quantitative measurement capability. Interferometry measures the entire density field, and, in many cases, the pressure and velocity fields can be deduced. For many years, aerodynamicists have used Mach-Zehnder interferometry for flow visualization and density measurements. However, it was not practical in many applications because of vibration sensitivity and the expense of very high quality optics. Thus, its use has been limited to small laboratory experiments. During the past decade, laser holographic interferometry has become a practical technique, has superseded Mach-Zehnder interferometry, and shows the best potential for large-field quantitative density measurements. At present many research laboratories (refs. 1-15) are using laser holographic interferometry in airfoil research, turbomachinery research, jet-exhaust studies, and many other types of fluid-flow investigations.
BASIC DESCRIPTION
Laser holographic and conventional interferometry are both accomplished when two or more light waves are superimposed and the resulting constructive and destructive interference causes bright and dark fringes. However, holographic interferometry allows the storage of two waves separated in time to be superimposed in reconstruction. One class of interferometry commonly called "dual-plate," allows a comparison wave of known character to be mixed with a test wave of unknown character to determine the spatial phase variation impressed by an object. For aerodynamics applications, this method is the most versatile and allows quantitative measurements. In another class, commonly called "double-pulse" interferometry, two waves of unknown character are stored on a single hologram. This technique is used to study unsteady flows by double pulsing the laser to give two waves separated by a very short time

duration. The information recorded is the change in densities that occurs during the time between the two waves.
For aerodynamic applications it is required that the interference fringe patterns on the interferogram form a reliable and accurate representation of the density field about the model. In order to obtain accurate densities, it is critical that the fringes be sharp and well defined. This requires accurate alignment of the optics, laser stability, a sufficiently high power and uniform-intensity laser beam, and careful reconstruction. Either infinite-fringe or finite-fringe interferograms may be used to analyze flow fields. Infinite fringe implies that a field of uniform irradiance results in infinitely wide fringe spacing. The process of holographic reconstruction to infinite fringe requires accurate alignment of the holograms and is a difficult task. The fringe interpretation is also not clear about whether the optical path length increases or decreases from one fringe to the next. This signambiguity can be resolved by introducing reference fringes into the interferogram. These become finite-fringe interferograms and are useful when the density gradient is small. For the special and widely used class of two-dimensional aerodynamic flows, the fringe lines of infinite-fringe interferograms represent lines of constant density. Thus, for this particular class, a contour map of density is readily obtained. Flow speed and pressure fields that are of interest can be directly derived from the density data with the assumption of isentropic flow. For the more general case of three-dimensional flows, the fringes represent the cumulative density change along the beam path . The three-dimensional density scaler field must be obtained by a relatively complex inversion process (refs. 16-18). Again, the accuracy of the density data is dependent on the ability to properly reconstruct the interferogram and the quality of the reconstruction, and in many cases, the sensitivity or number of fringes.
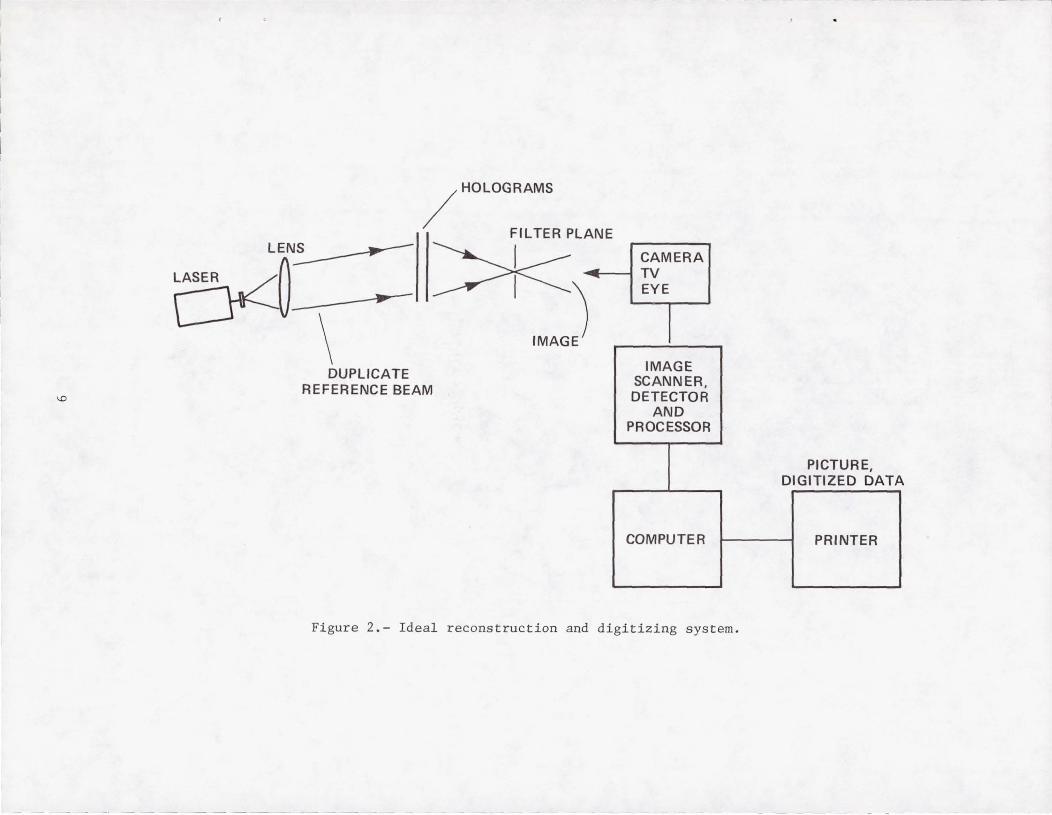
Systems for reconstructing holograms are well described in textbooks, for example, in Vest (ref. 19). The main problem is not so much the reconstruction process, although that must be done precisely to obtain sharp fringes, as it is the digitizing of the fringe data. This can be done in the simplest manner by measuring the fringes manually or it can be done by a fully automated fringe-digitizing system. A fully automated ideal system is shown in figure 2. It would consist of laser and optics to recreate the reference beam, a precise holder to allow adjustment of the holograms, a TV camera with an image-enhancement processor, and a computer. Systems based on this scheme have been tried with some degree of success (refs. 20-22).
Since infinite-fringe interferograms are commonly used for two-dimensional aerodynamics, a typical reconstruction sequence of dual-plate interferograms to the infinite-fringe mode will be described in detail (refer to fig. 3). This is for a symmetric NACA 0012 airfoil at a = 1° where the flow is nearly symmetric. At the first stage of reconstruction (fig. 3(a», the object and reference plates are placed in the dual-plate holder and the airfoil and support mechanism, that is, the dark shapes, are superimposed. The large number of fringes is typical of finite-fringe interferograrns. The second stage involves small movements of one plate with respect to the other, both to minimize the number of fringes and to achieve a fringe pattern based on a general knowledge of the aerodynamics. In this case, the symmetric airfoil .' at a = 1° should give a fringe pattern that is nearly symmetric to the horizontal plane of symmetry of the airfoil. The second stage interferogram (fig. 3(b» shows fair symmetry except for the one fringe that crosses the airfoil at about 75% chord. It is further noticed that there are a number of vertical fringes behind the airfoil; these fringes indicate a change in density that should not occur. The final stage consists of minor adjustment to eliminate these vertical fringes and
2
______ -.J

,- ------~-
I
to minimize the number of fringes in the outer regions surrounding the airfoil, since these regions should have the smallest density gradients. Figure 3(c) shows the final infinite-fringe interferograms used for data analysis.
This method of alignment requires the model to be sufficiently small so that the flow approaches the free-stream density at some point near the outer edge of the interferogram. By definition, the fringe spacing becomes infinite when the density is at the free-stream value. However, there is some subjectivity in this procedure for subsonic flows since the density is never quite at the free-stream value and the noise of the system introduces two or three broad fringes. For a particular wind tunnel, the size of the airfoil is usually determined from previous calibration.
WIND-TUNNEL SYSTEMS
A number of laser holographic interferometers - mainly off-axis systems - have been constructed for various wind tunnels. Although the beam paths may vary depending on the particular wind tunnel, the basis system is as depicted in figure 4. The laser beam is split into an object and reference beam. The object beam is expanded and collimated and directed through the wind-tunnel test section. It is then focused on the hologram. The reference beam is routed around the wind tunnel and focused on the hologram.
A large interferometer was recently built for the 11- by II-Foot Transonic Wind Tunnel at Ames Research Center. Figure 5 is a photogra ph of this system where beam paths were over 10 m. An Nd:Yag laser at 5300 K was used in this system. Ruby lasers at 6943 A are also commonly used and CW argon lasers have also been tried. The coherence lengths of the ,Nd:Yag and ruby lasers are about 1 m, which is adequate for the large beam paths in large wind tunnels. Pulse durations of the order of nanoseconds are a second requirement for the high-vibration environment.
Another example of a large interferometer is the Anechoic Hover Chamber system at the Army's Aeromechanics Laboratory; it was designed for studying helicopter rotor aerodynamics (ref. 23). Figure 6 is a photograph of the beam paths with a rotor blade and a rotating mechanism. Beam paths were about 30 m, with the object beam expanded to a diameter of more than 60 cm. A ruby laser was used in this system.
AERODYNAMIC APPLICATIONS AND TWO-DIMENSIONAL FLOW
One of the first applications (refs. 24 and 25) of interferometry was in measuring the pressure distributions on an airfoil (fig. 7). By integrating the pressures, the lift and drag forces on the airfoil can be obtained. The density and the pressure were obtained by counting the fringes on the airfoil surface. The fringes are related to the density by PI - P2 = A/ LK, where PI and p z are the densities at two adjacent fringes. The laser wavelength is A, L is the optical path length, and K is the Gladstone-Dale constant. Pressure is related to the density by the perfect gas law. In order to start the solution, a density from a pressure transducer is identified with a given fringe. The entire density field is then calculated from the fringe-density equation. Agreement to within 1% between interferometric and pressure-transducer data was obtained in this case. By using a semiautomatic fringe-counting digitizer and a computer, pressure distributions can be
3
- - . - - - - - - - - - - - - - - - - - -- - ---~

routinely obtained in about 10 min. This method could reduce the cost of building expensive pressure-transducer instrumented airfoils. The entire flow field can also be found from interferometry to validate theoretical prediction codes. Interferometry is ideally suited to providing data for this purpose. Point-measurement methods would be very tedious, time consuming, and prohibitively expensive.
Further examples of airfoil flows are (1) an oscillating airfoil (ref. 26), (2) a modern transport airfoil (ref. 27), and (3) a circulation control airfoil (ref. 28), using a jet of air near the trailing edge to produce lift. In addition to surface-pressure data from interferometry, the pressures in the wake and the velocity in the viscous region near the airfoil surface can be obtained. The wake and viscous data are used to understand the fluid-mechanics aspects of the flow and to validate prediction theories.
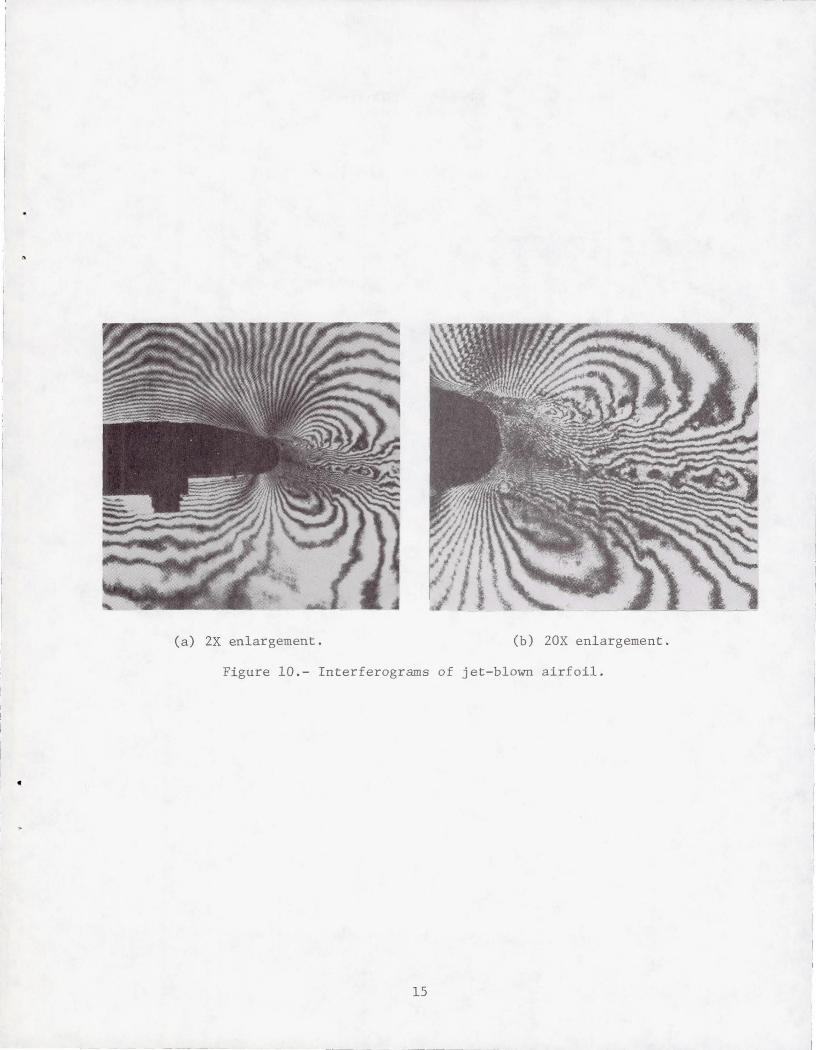
Shown in figure 8 are probably the first attempts to take interferograms of an oscillating airfoil. A specially designed window was used to mount the airfoil, which was oscillated at frequencies up to 30 Hz. Dual-plate interferograms (fig. 8(a» were taken to obtain pressure, density, and velocity data. Double-pulse interferograms (fig. 8(b» characterized qualitatively the turbulence nature of the flow. The second example is a modern transport airfoil which has a pronounced aft camber; figure 9 is an interferogram of this airfoil. The airfoil is very sensitive to changes in the viscous or boundary layer near the aft camber surface. Small perturbations in the upper surface flow can cause drastic changes in the shock-wave location on the wing and thereby change its flying characteristics. By using short laser pulses, any time-varying phenomena in the flow can be recorded and analyzed . These details are often lost in pressure-prob~ or laser-Doppler velocimeter measurements. The viscous layers over the rear portion of the airfoil are well defined, as can be seen by the many closely spaced fringes. Finally, the third example is a class of airfoils in which the Coanda effect is used to provide lift. Here a detailed visualization and measurement of the interaction of the jet with the outer flow and the wake are crucial. Interferograms were enlarged over 20 times (fig. 10) to study this region. Note that the fringe remained sharp' and the contrast remained good. The interferometric data were compared with pitot pressure data and the agreement was good.
Another application of interferometry is in the study of turbulence modeling, which is a problem of current interest and importance. Accurate turbulence models are essential for the success of numerical aerodynamic prediction and design. To check out various turbulence models, good experimental data are needed. Such an experiment was run using interferometry to provide accurate and detailed aspects of a nozzle flow (ref . 28). Note the shock-wave structure and the viscous regions that show up very clearly in the interferogram (fig. 11). The other portions of the figure show the theoretical predictions (ref. 29).
AERODYNAMIC APPLICATIONS: THREE-DIMENSIONAL FLOWS
Laser holographic interferometry has been applied to a number of threedimensional configurations, most of which were simple shapes such as cones (refs. 6 and 11) and nozzle exhausts (ref. 20). An airplane model was studied with a partially transparent model (ref. 30), and density fields were determined to be about 6% accuracy. Recently , interferograms (fig. l2(a» of a rotating helicopter blade were obtained at various planes perpendicular to the rotor's rotation plane (ref. 23). Shock waves (fig. l2(b» can be easily seen, and density fields are
4
being calculated. I am studying the flow about basic shapes at both subsonic and supersonic speeds (fig. 13) to refine this technique for aerodynamic applications. Density fields are being determined and correlated with theoretical predictions.
Laser holographic interferometry is a very useful diagnostic tool for aerodynamics. For two-dimensional flows, many laboratories are using this technique on a routine basis. For three-dimensional flows, much more development work is required. Fast, automatic digitizing schemes are needed for reducing the vast amount of data that this technique generates.
5

REFERENCES
1. Tanner, L. H.: Some applications of holography in fluid mechanics. J. Sci. Instrum. vol. 43, 1966, pp. 81-83.
2. Tanner, L. H.: The design of laser interferometers for use in fluid mechanics. J. Sci. Instrum., vol. 43, 1966; pp. 878-886.
3. Heflinger, L. 0.; Wuerker, R. F.; and Brooks, R. E.: Holographic interferometry. J. Appl. Phys., vol. 37, Feb . 1966, pp. 642-649.
4. Beamish, J. K.; et al .: Wind-tunnel diagnostics by holographic interferometry. AlAA J., vol. 7, Oct. 1969, pp. 2041- 2042.
5. Matulke, R. D.; and Collins, D. J.: Determination of three-dimensional density fields from holographic interferometry. J. Appl. Phys., vol. 42, Mar . 1971, pp. 1109-1119.
6. Jogota, R. C.; and Collins, D. J.: Finite fringe holographic interferometry applied to a right circular cone at angle of attack. J. Appl. Mech., vol. 39, Dec. 1972, pp. 897-903.
7. Reinheimer, C. J.: Holographic subsonic flow visualization. Appl. Optics, vol. 9, Sep t. 1970, pp. 2059- 2065.
8. Hirth, A. ; Smigielski, P.; and Stimpfling, A.: Use of holography for visualization of the wake of projectiles in hypersonic flight a t Mach 6. Optics and Laser Tech., Nov. 1971, pp. 195-199.
9. Redley, R. J., Jr.; and Havener, A. G.: Application of dual hologram interferometry to wind-tunnel testing. AlAA J ., vol. 11, Nov. 1973, pp. 1332-1333.
10. Belozerov, A. F.; et al.: Hologram study of gas flow in a ballistic wind tunnel. Sov. Phys. Tech. Phys., vol . 18, Oct. 1973, pp. 488-489.
11. Zien, T. F.; Ragsdale, W. C.; and Spring, W. C.: Quan titative determination of three-dimensional density field by holographic interferometry. AIAA J . , vol. 13, July 1975, pp. 841-842.
12. Surget, J.: Holographic Interferometer for Aerodynamic Flow Analysis. International Symposium of Flow Visualization. Bochum (RFA). Hemisphere Pub. Co., Sept. 1980.
13. Craig, J. E.; Lee, G.; and Bachalo, W. D.: Nd:YAG holographic interferometer for aerodynamic research. SPIE Paper 353-15, San Diego, Calif., Aug. 1982.
14. Burner, A. W.; and Goad, W. K. Flow visual ization in a cryogenic wind tunnel using holography. NASA TM-84556, Nov. 1982.
15. Matulka, R. D.: The Application of Holographic Interferometry to the Determination of Asymmetric Three-Dimensional Density Fields in Free Jet Flow. Ph.D. Thesis, U.S. Naval Postgraduate School, June 1970.
6
- - - -----.- .----
16. Tanner, L. H.: A holographic interferometer and fringe analyzer and their use for the study of supersonic flow. Optics and Laser Tech., Dec. 1972, pp. 281-287.
17. Sweeney, D. W.; and Vest, C. M.: Reconstruction of three-dimensional refractive index fields from multidirectional interferometric data. Applied Optics, vol. 12, Nov. 1973, pp. 2649-2664.
18. Vest, C.: Holographic Interferometry. J. Wiley & Sons, N.Y., 1979.
19. Trolinger, J. D.: Laser instrumentation for flow field diagnostics. AGARD-AG-186, 1974.
20. Clark, L. T.; et a1.: A three-dimensional density field measurement of transonic flow from a square nozzle using holographic interferometry. J. Fluid Eng., vol. 99, Dec. 1977, pp. 737-744.
21. Becker, F.; and Meier, G. E. A.: Entwicklung eins Gerates zur Auswertung von Interferogrammen. Max-Planck-Institut fur Stromungsforsehung, Bericht 110/1981, June 1981.
22. Menzel, R. W.; and Vandergriff, L. D.: Program for automated holographic data reduction. AEDC-TR-80-39, Aug. 1981.
23. Kittleson, J. K.: A holographic interferometry technique for measuring transonic flow near a rotor blade. 9th European Rotorcraft Forum, Stresa, Italy, Sept. 13-15, 1983.
24. Johnson, D. A.; and Bachalo, W. D.: Transonic flow past a symmetric airfoi1-inviscid and turbulent flow properties. AIAA J., vol. 18, Jan. 1980, pp. 16-24.
25. Spaid, F. W.; and Bachalo, W. D.: Experiments on the flow about a supercritical airfoil, including holographic interferometry. AIAA Paper 80-0343, Pasadena, Calif., Jan. 1980.
26. Lee, G.; et al.: Laser holographic interferometry for unsteady airfoil undergoing dynamic stall. AlAA Paper 83-0388, Reno, Nev., Jan. 1983.
27. Bacha10, W. D.: An experimental investigation of supercritica1 and circulation control airfoils at transonic speeds using holographic interferometry. AIAA Paper 83-1793, Danvers, Mass., July 1983.
28. De1ery, J. M.: Investigation of strong shock turbulent boundary layer interaction in 2-D transonic flows with emphasis on turbulence phenomena. AlAA Paper 81-1245, Palo Alto, Calif., June 1981.
29. Marvin, J. G.: Modeling of turbulent separated flows for aerodynamic applications. Int. Symp. Recent Advances in Aero and Aeroacoustics, Stanford, Calif., Aug. 1983.
30. Kosakoski, R. A.; and Collins, D. J.: Application of holographic interferometry to density field determination in transonic corner flow. AlAA J., vol. 12, June 1974, pp. 767-700.
7

Figure 1.- Interferogram of Space Shuttle model.
8
--- - - --- --- ---.... _- ---
I • I
. :
\
- I I
\.0
HOLOGRAMS
/ FILTER PLANE LE~
~
\ DUPLICATE
REFERENCE BEAM
I i
IMAJ
-" CAMERA TV EYE
IMAGE SCANNER, DETECTOR
AND PROCESSOR
COMPUTER
Figure 2.- Ideal reconstruction and digitizing system.
PICTURE, DIGITIZED DATJ
PRINTER
I I I I

INITIAL ALIGNMENT
INTERMEDIATE ALIGNMENT
FINAL ALIGNMENT
Figure 3.- Reconstruction of infinite fringe interferograms.
10
I • I
I I I I
I
I I I I
- 1
1

I
I • j \
RECEIVING OPTICS AND HOLOGRAM
TEST SECTION
LASER AND TRANSMITTING OPTICS
REFERENCE BEAM
OBJECT BEAM
Figure 4. - Basic off-axis laser holographic in t erfer ome ter.
Figur e 5 .- NASA Ames ii- Foot Interferometric System.
11
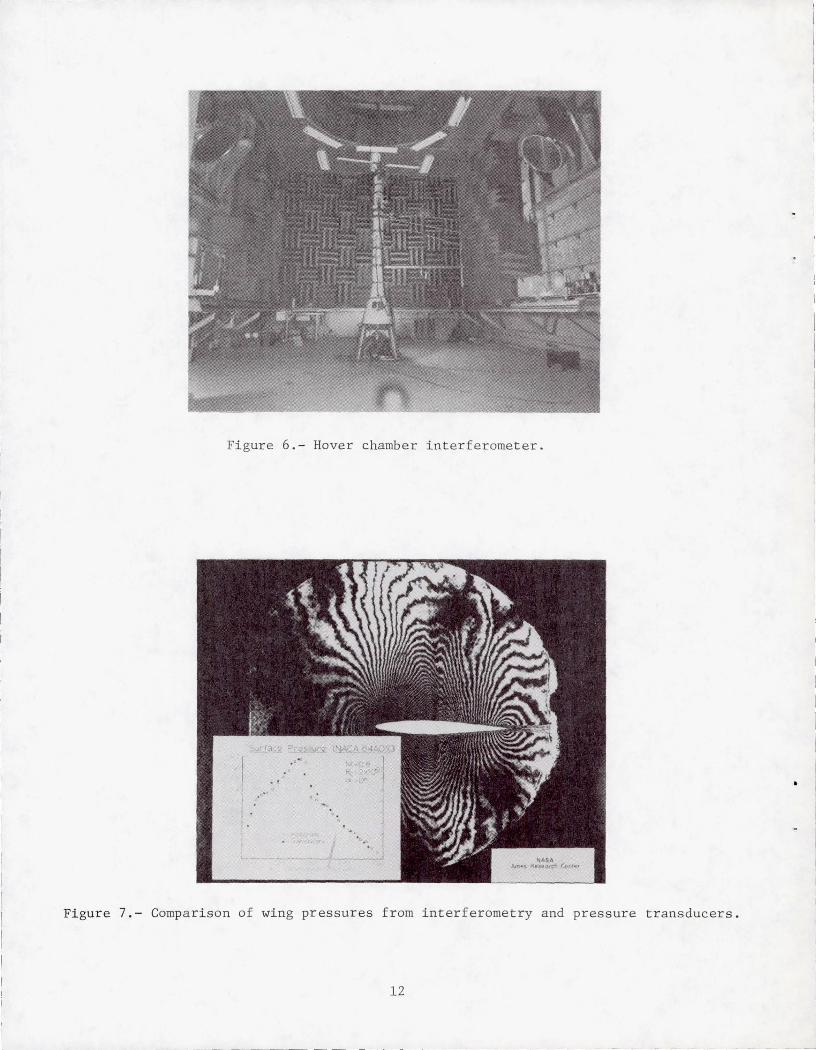
Figure 6. - Hover chamber interferometer.
Fi gure 7 . - Comparison of wing pressures from interferometry and pressure transducers.
12
- ~ - - - - ---------___________ J

! •
(a) Dual plate. (b) Double pulse; ~t 0 . 1 msec .
Figure 8. - Interferograms of oscillating airfoil.
13

·03 .06 r HOLOGRAPHIC
" PITOTPROBE " I (;
.02 - ) 04[ "J 6 r e " " £j"
~~ c ,.. 0
.01 .02 e °s:1 Qs
.f!l;"C
~ f"'''' oB< c 0 0° 0 00
9# 0 L oOc{}o.) '';0
G 0:1 % 8"> 9 D
y/c 0
_0: [' 0
" ., neg, 0° !iJ~ ~e ° "'00 (. ° '00 <:0 0"" " 1 -.01 ~
0 ~Gb,
-02 f x/c~ :.~ ., -.04 El
e (3
I x/c ~ 0.75 " I x/c = 1.00 x/c ~ 1.06
-.03 1 _.OSL __ - .L ___ _ 1.- _J - 1 __ L ___
.2 .4 .6 .8 1.0 0 .2 .4 .6 .8 1.0 .2 .4 .6 .8 1.0 .6 .8 1.0 u/ue
Figure 9.- Trailing- edge boundary- layer and wake profiles derived from pi tot pressure and interferogram data, supercritical airfoil: M = 0 . 72, a = 4 . 32°.
00
14
- - ._- --.----
•
I I I
I I I I
i ! '
( -
r i
I
(a) 2X enlargement . (b) 20X enlargement .
Figure 10.- Interferograms of jet-blown airfoil.
15

E E >.
EXPERIMENT
E E >.
60
40 E E >.
20
O~~----------~~--~--------~-------J 250 300 350
x, mOl
75
50
25
0
75
50
25
.: 1.1
I
,
- .... : ...
, I
I
,
.-
,.
/ /
/
, t
I , , f
, I
(
COMPUTATION I .
1.3,' i
,
! MODIFIED MODEL I
f I
/
X, mOl
Figure 11 .- Shock structure in two-dimensional nozzle.
•
16
I . _~. __ __ ._. ___ J

I~-------------------- - - - - ----- ------- - - - - - - - - - -- )
II - 20 (a)
FILM '---___ ---J
u = 186 (g)
1=180 (f)
u = 34 (c)
{} = 90 (d)
Fi gure 12 .- Interferograms a t various azimutha l angles 8 .
17

(a) Subsonic speed.
(b) Supersonic speed.
Figure 13.- Interferograms of simple models to show small density gradients.
18
I I i I I
, I
,
--- ---------- ----- ------------'

- - - - -- - - -------- - ----- - ----------- \
1. Report No. 2. Government Accession No. 3. Recipient's Catalog No. NASA TM 84325
4. Title and Subtitle 5. Report Date January 1984
APPLICATION OF HOLOGRAPHY TO FLOW VISUALIZATION 6. Performing Organization Code
7. AuttlOr(s) S. Performing Organization Report No.
George Lee ~-~540 10. Work Unit No .
9. Performing Organization Name and Address T-6430Y Ames Research Center 11 . Contract or Grant No.
Moffett Field, Calif . 94035
13. Type of Report and Period Covered T Z. Sponsoring Agency Name and Address Technical Memorandum
National Aeronautics and Space Administration 14. Sponsoring Agency Code
Washington, D.C. 20546 505-31-51
1:;. Suppiementary Notes
Point of Contact: George Lee, Ames Research Center, MS 227-8, Moffett Field, CA 94035. (415) 965-5861 or FTS 448 5861.
16. Abstract
Laser holographic interferometry is being applied to many different types of aerodynamics problems. These include two- and three-dimensional flows in wind tunnels, ballistic ranges, rotor test chambers and turbine facilities. Density over a large field is measured and velocity, pressure, and Mach number can be deduced.
17. Key Words (Suggested by Author(s)) 18. Distribution Statement
Holographic interferometry Unlimited
Aerodynamics Holography
Subject Category: 35 19. Security Oassif. (of this report) 20. Security Classif. (of this page) 21 . No. of Pages 22. Price"
Unc1ass if ied Unclassified 22 A02
"For sale by the National Technical Information Service, Springfield , Virginia 22161