application of gohfer® in a petroleum engineering curriculum of gohfer in a... · application of...
TRANSCRIPT

July 2016 | © Barree & Associates LLC 1 www.gohfer.com | www.barree.net
Application of GOHFER® in a Petroleum Engineering Curriculum
R. D. Barree
Table of Contents
Introduction ..................................................................................................................................... 1
Log Analysis ...................................................................................................................................... 2
Drilling and Wellbore Stability ......................................................................................................... 3
Geosteering and Selective Completions .......................................................................................... 6
Pre-Frac Diagnostic Injection Test Analysis ..................................................................................... 7
Fracturing Fluid Rheology ................................................................................................................ 8
Proppant Material Properties and Transport .................................................................................. 8
Fracture Geometry Evolution and Job Design ................................................................................. 9
Fracture Cleanup, Conductivity, and Effective Length................................................................... 10
Well and Fracture Spacing, Interference, Well Bashing ................................................................ 11
Production Forecasting and Economic Optimization .................................................................... 12
Rate-transient Production Analysis and Decline Curves ................................................................ 13
Team Integration ........................................................................................................................... 14
Introduction
To many people GOHFER is “just a frac model”. GOHFER has grown over more than 30 years of
development into an integrated well design and optimization package that covers a broad spectrum of
disciplines involved in petroleum engineering. It is our belief that GOHFER can be used throughout the
curriculum to bring together multiple disciplines and a large amount of diverse but interconnected
information impacting well performance efficiency and development planning.
Although many universities have access to GOHFER at no cost, through the GOHFER/B&A University
Outreach Program, is has become apparent that the software is not being used to its full potential as a
teaching aid. This document presents some of the features GOHFER, along with suggestions as to how it
can be used to supplement a curriculum that is more focused on development of unconventional
reservoirs, which seems to be the outlook for our industry in the near future.

July 2016 | © Barree & Associates LLC 2 www.gohfer.com | www.barree.net
Log Analysis
The log analysis portion of GOHFER (LAS Processing) imports multiple LAS files that conform to the
standard for version 2 certification. It provides a means to process conventional logs (triple-combo,
platform express, etc.) and acoustic logs (BHC sonic, acoustic anisotropy, dipole sonic). Logs can be
displayed over any depth range, and at many standard log depth scales, for both oilfield (English or
Imperial), and metric units. Unit conversion for all input log tracks is available, along with the ability to
generate graphical equation processing on each curve, or pairs of curves. The mathematical functions
allowed are Cartesian shift of the curve, multiplier or scaling, summing of curves, averaging of curves,
logarithm of input curve, and exponentiation of the input curve. These functions can be used to transform
any input log curve, and to generate a new curve that may be an input to another generated curve or
function.
The package also includes a crossplot, or scatter-plot function that allows generation of correlation
functions between any pair of input log tracks or curves. These regression results can then be used to
produce a desired output log curve from any available input curve. Similarly, there are pre-defined
correlations to generate synthetic sonic logs and dynamic rock mechanical properties, Poisson’s Ratio and
Young’s Modulus) from multiple inputs, as well as from conventional shear and compressional acoustic
slowness. Correlation of the generated sonic log curves have been shown to be good indicators of total
organic content and hydrocarbon potential of zones. The derived curves also provide mechanical
properties estimates that are corrected for the slowing effect of hydrocarbons on the raw sonic data.
Crossplot correlation for DTC derived from GR log data.
The mechanical properties and derived Biot’s poroelastic coefficient are combined with true vertical
depth, overburden gradient, pore pressure profile, and imposed tectonic stress and strain boundary
conditions, to compute a curve of minimum in-situ stress. This curve can be calibrated to field measured

July 2016 | © Barree & Associates LLC 3 www.gohfer.com | www.barree.net
fracture closure stress to generate a representative mechanical earth model. The stress profile can also
be used to generate a maximum horizontal stress estimate, when sufficient data are available. These two
curves then define a horizontal stress anisotropy that is spatially variable, and tied to lithology and local
rock properties.
A lithologic model can also be generated based on a 6 component model. The model includes volume
fraction of clay (or shale), sand (quartz, feldspars, mica), lime, dolomite, anhydrite (including other heavy
minerals), and coal (or kerogen). The model parameters can be adjusted to match available XRD/XRF data
when available.
Core data can be input to the model, and depth shifted to align core and log depths. Any core properties
tabulated versus depth can be input, and plotted, along with any appropriate log curve. This provides a
means for calibrating derived log curves or quality assurance of core and log data for consistency. Logs
from offset wells can also be imported n the same project, and each log can be depth-shifted to a common
datum plane for comparison.
The processed log functions are also used to generate a net-pay curve based on effective porosity,
resistivity, and shale (clay) fraction. This process provides an effective “quick look” to find potential pay
targets. The net pay analysis also includes the generated “brittleness” curve. Archie water saturation is
also computed and displayed as a separate log curve.
All processed and generated curves are output to a LAS (log ascii standard) filed for use in any other log
analysis package, or for input to a simulator. There are pre-defined output curves that are used within
GOHFER, but any derived curve can be added to the output LAS.
The GOHFER LAS processing package can be used to teach conventional log analysis, geomechanics,
response and comparison of different logging tools, and normalization of logs. The impact of changes in
any input parameter on the resulting stress profile can be examined, including use of mechanical
properties from multiple sources. Local pore pressure depletion and overpressure can be modeled in the
logs, and shown to affect in-situ stress. Similarly, the difference between a constant stress and strain
boundary condition on calibration of the stress profile can be easily illustrated. This leads to a more
general discussion of tectonics and development of a calibrated 3D stress tensor for a geomechanical
model.
Drilling and Wellbore Stability
A detailed wellbore deviation survey can be input to GOHFER in the form of MD, Inclination, and azimuth.
The well northing, easting, and TVD are computed using the minimum radius of curvature method. The
azimuth of maximum horizontal stress can also be specified. Using the derived mechanical earth model,
spatially variable stress anisotropy, and relative azimuth of the well and maximum stress, the tangential
stress is computed around the deviated well at any point in the model. Data are available at each point
along the well trajectory to compute the safe mud weight window to avoid well collapse or tensile failure
of the borehole. The computation of the safe mud weight window will be added in an upcoming version
of GOHFER, and is currently done in an external application.

July 2016 | © Barree & Associates LLC 4 www.gohfer.com | www.barree.net
The well directional survey is displayed in a rotatable 3D view, and in an x-z vertical earth cross-section
through the variable lithology derived from the log processing. Geologic structure, including folds, bed
dips, and faults, can be built into the cross-section. Each shift of TVD of any rock unit changes the stress
tensor, relative to the overburden and pore pressure gradients, so that the stress tensor at each point are
recomputed. Any point on the vertical cross-section, on or off the wellbore trajectory, can be selected to
evaluate well breakdown conditions.
Well directional survey in 3D view.
The selection of a point in the earth section generates a pair of polar coordinate plots, showing the well
trajectory in terms of inclination and azimuth and the tensile failure (breakdown) pressure gradient in
psi/ft or kpa/m. The second plot shows the angle of inclination around the wellbore circumference where
the minimum tangential stress exists. This is the angle of departure of an induced tensile fracture for a
homogeneous medium (over the diameter of the hole), with no pre-existing flaws or cracks. In these plots
any of the parameters affecting breakdown pressure can ba varied for “what if” analysis. These
parameters include the maximum stress azimuth, stress anisotropy, pore pressure, Biot’s coefficient,
Poisson’s Ratio, Young’s Modulus, and stress or strain boundary conditions on the earth model. This
analysis easily demonstrates the potential problems encountered when traversing the build section of a
high-angle well, especially when drilled orthogonal to the maximum horizontal stress.

July 2016 | © Barree & Associates LLC 5 www.gohfer.com | www.barree.net
Model grid showing total closure stress and well breakdown conditions.
Along with the general polar plots of breakdown gradient, a second analysis and plot shows the tangential
stress distribution around the well at any point along the directional survey. Rapid changes in the
tangential stress profile can occur over short distances along the well, when the wellbore cuts layers of
variable rock type or changes angle of attack. The analysis can be used to select optimal points for
breakdown, or fracture placement, and to avoid sections of the well where adverse breakdown conditions
may exist.
Tangential stress around borehole for breakdown conditions.

July 2016 | © Barree & Associates LLC 6 www.gohfer.com | www.barree.net
Geosteering and Selective Completions
GOHFER provides for import of well logs for both a vertical reference well, to provide data for construction
of the mechanical earth model above and below the treatment well, and for the treatment well itself. The
treatment well logs may be LWD/MWD or post-drill logs. Any logs can be imported and processed for the
treatment well, including GR, mud logs, density, porosity, resistivity, and sonic. All the log processing,
generation of synthetic sonic and mechanical properties available for the vertical reference well can be
performed in the treatment well.
In the vertical earth cross-section view, with the treatment well trajectory displayed (based on the input
survey), a log curve from the treatment well and a corresponding log from the reference well can be
displayed. As the user moves a cursor along the wellbore the two logs can be correlated by vertically
shifting the lithology column at each point. This allows the well to be located correctly within the vertical
cross-section, and builds the geologic structure necessary to describe well surroundings.
Vertical reference well and treatment well logs with geosteering application.
This process can be frustrating when the well is nearly parallel to the bed dip, as there is no change in the
log character over a range of well MD. Exercises in log correlation, pattern recognition, and an
understanding of the difficulties in locating a well in the geologic section are valuable. The impact on
wellbore stability, breakdown pressure, and ultimate fracture geometry that can result from incorrect
placement of a well can also be illustrated. Putting the well in the wrong vertical position can, in some
cases, completely change the section of pay contacted by an induced hydraulic fracture.
Having the log suite along the treatment well, including processing for mechanical properties and derived
stress profile, can also provide insights for an engineered completion, instead of random or uniform
perforation placement. Areas of adverse breakdown conditions, or non-pay sections can be readily

July 2016 | © Barree & Associates LLC 7 www.gohfer.com | www.barree.net
identified, and marked for potential exclusion from perforating or stimulation. Placement of selective
perforations can be evaluated in terms of fracture coverage and completion economic optimization.
Pre-Frac Diagnostic Injection Test Analysis
The diagnostics package in GOHFER includes step-rate analysis, G-function, Sqrt(time), and log0log type-
curve derivative analysis, non-linear leakoff determination, and wellbore storage and decompression
analysis. Familiarization with the analysis and interpretation of these data allow determination of total
closure stress and pore pressure, for calibration of the minimum in-situ stress profile. The data can also
be used to determine reservoir flow capacity, for appropriate design of stimulation and completions as
well as post-frac production forecasting.
Example of diagnostic G-function and log-log plot analyses.
Results of a complete, and proper DFIT analysis, coupled with the fracture geometry and proppant
placement model, then tied to fracture cleanup driven by reservoir transient behavior, have been shown
to accurately predict well production in every type of reservoir and geologic environment. The production
forecast and derived reservoir properties are consistent with production rate-transient analysis and static
pressure buildup data.
Input to the calibration of the in-situ stress tensor and subsequent development of a calibrated
mechanical earth model requires direct measurement of pore pressure and stress. These properties
cannot be computed from available log data. The same is true for pore pressure and reservoir flow
capacity. Without this information it is not possible to design an appropriate or optimum completion for
a well.
Reservoir pore pressure and estimated permeability, combined with porosity, saturation, and net pay
analysis from the log processing will allow a production decline forecast to be run for any proposed
fracture design. This process leads naturally to development of an economic value model which can
illustrate the merits of initial production (IP), net present value (NPV), internal rate of return (IROR), and
other value indicators in making development decisions. Without an accurate estimate of the reservoir
properties, this exercise can be almost useless. An accurate analysis also requires a realistic assessment
of fracture conductivity and flowing length, which will be discussed later.

July 2016 | © Barree & Associates LLC 8 www.gohfer.com | www.barree.net
Fracturing Fluid Rheology
Although most fracture treatments in unconventional reservoirs are now conducted with some form of
polyacrylamide friction reducer (slick-water), complex non-Newtonian linear and crosslinked polymer-
based fluids are still used. Understanding the time, shear, temperature, and complex breaker effects on
these fluids is important in overall stimulation design. How long should the fluid last? What temperature
should it be designed and tested at? How do all the chemical additives interact to produce a suitable
stimulation fluid? These questions can be answered with appropriate laboratory rheology and break
testing.
GOHFER includes a fluid database, and the ability to generate a shear-rate and time dependent model of
complex fluid rheology, based on specific laboratory test data. Lab rheometer test results can be imported
and processed to generate a consistent description of a job-specific fluid. The newly developed fluid model
can be added to the user fluid database, then used in fracture geometry and proppant transport modeling
to determine the impact of rheology on geometry and economic value of the stimulation.
Fluid rheology model and import of lab data.
Proppant Material Properties and Transport
Complete models of proppant conductivity and crush under field confining stress conditions have been
developed based on 30 years of consistent laboratory measurements at the Stim-Lab Proppant
Consortium. The results of the entire Stim-Lab proppant library are available in GOHFER for comparison
of baseline and effective conductivity, and economic value of all commercially available proppants. Careful
analysis of well performance with similar fracture designs, or pumping schedules, shows that productivity
is not only controlled by the strength or baseline conductivity of proppants. The effects of multiphase flow
and inertial losses in the proppant pack, along with the energy supplied by the reservoir, often dominate
production. Accurate coupling of proppant behavior with transient reservoir performance is required to
assess the true economic value of proppants with varying costs and availability.

July 2016 | © Barree & Associates LLC 9 www.gohfer.com | www.barree.net
The proppant model allows computation and direct comparison of baseline conductivity of any number
and size of proppants, at any specified concentration, substrate modulus, and temperature. Various
proppants can be selected for use in fracture treatment designs. Integration of the proppant pack created
by the design with the log-derived and calibrated reservoir pore pressure, closure stress, and transient
production profile, allow each proppant to be evaluated in terms of its cost-benefit ratio. Use of the
proppant model provides valuable insights into the selection and cost justification of materials for
stimulation design and execution.
The proppant transport model in GOHFER has been verified by years of testing in large and small scale
slot flow cells. Fluids including borate and metallic crosslinked gels, linear polymer system, and slickwater
have been modeled, both physically and numerically. The model performs transport and settling
computations for any size and density of proppant. Up to ten proppants and ten fluids may be used within
a single design model. GOHFER provides insights into the actual economic value and placement efficiency
for commercially marketed propping agents.
Fracture Geometry Evolution and Job Design
Prediction of fracture geometry is one of the primary purposes of GOHFER, and involves developing a
correctly calibrated and representative mechanical earth model. From a teaching standpoint, GOHFER can
be used to evaluate the fracture geometry generated by different fluids, pump rates, perforation spacing,
proppant schedules, and many other “design” variables. Common metrics such as gallons per foot, or
pounds of proppant per foot of pay or lateral, can be evaluated versus their impact on cost and
production.
More importantly, the impact of changes in log processing and assumptions about pay quality, pore
pressure, stress anisotropy, and other geomechanical inputs can be easily evaluated. Critical observation
of the sensitivity of results to geologic inputs, rather than to changes in fluid, proppant, and job size may
add support to multi-disciplinary team building. Consistent input to describe the reservoir and mechanical
properties and pressure/stress state are more important than simply pumping bigger jobs, if economic
value and efficient use of resources are important to the industry, shareholders, and community at large.
The model is also useful to demonstrate fracture containment and isolation from potable water sources.
It provides a good visual reference for comparing probable fracture extent, especially height growth, to
sources of drinking water. The model will also take 3D microseismic event locations as input, for
comparison to the predicted fracture geometry. The distribution of shear events can be related to the
predicted fracture deformation field.
When available, radio-active tracer data can be imported for comparison to the predicted fracture height
in vertical wells. These data can be imported as LAS or text files, and plotted with the simulator output of
proppant concentration or other state variables.

July 2016 | © Barree & Associates LLC 10 www.gohfer.com | www.barree.net
Fracture Cleanup, Conductivity, and Effective Length
A critical output for any fracture treatment design is an realistic estimate of the resulting fracture
conductivity and effective producing length. This goes far beyond modeling the created fracture geometry
and baseline conductivity of the proppant pack. GOHFER incorporates the results of 30 years’ effort by
the Stim-Lab consortium to understand proppant pack conductivity and fracture cleanup under actual
field producing conditions. To estimate effective conductivity, the fracture must be coupled to a transient
reservoir production simulator. The energy supplied by the reservoir, in the form of flow velocity and
potential gradient in the fracture, drives the cleanup. With limited production, there will be limited
fracture conductivity. Fracture conductivity also depends more on reservoir producing conditions, such as
water cut, liquid yield, and applied drawdown, than on the fracture geometry and proppant selection.
The ability to model fracture conductivity, cleanup, and production for various scenarios can be used to
demonstrate sensitivity to the critical parameters governing post-frac productivity. The model can easily
show the effect of changing proppant type, size, strength, and cost, on development economics. The
impact of water cut, GOR, and condensate yield can also be demonstrated. In the current economy, being
able to identify what actually impacts project economics, and to make positive changes that add value to
a development is a useful, if not necessary, ability.
Output of various predicted fracture lengths: Cutoff, Flowing, and Effective, from the GOHFER simulator.

July 2016 | © Barree & Associates LLC 11 www.gohfer.com | www.barree.net
Well and Fracture Spacing, Interference, Well Bashing
With the prevalence of multi-stage horizontal well fracturing, it is necessary to understand the stress and
strain interference between fractures in a stage, and from one stage to the next. Similarly, for “zipper
frac” operations, the impact of stress/strain transmitted from one well in the pattern to another must be
understood. GOHFER can be used to illustrate the impact of fracture and well spacing, time between stage
(as the fractures leak-off and close), fluid rheology, pump rate, emplaced proppant pack width, and other
variables that impact stress shadowing.
When infill-drilling, or offsetting a producing well, the pore pressure depletion resulting from production
of the existing offset well affects fracture placement, wing asymmetry, conductivity, and damage to the
offset well by invasion of frac fluids. The effect of local depletion zones can be modeled and illustrated.
Degree of depletion, effect of shut-in of the offset well, re-injection into the well, well spacing, and other
variables can be studied with relative ease.
The industry is entering a phase of development where infill drilling and re-fracturing are a major concern.
The ability to model fracture placement and performance in an environment of highly variable pore
pressure and earth stress, and to account for likely operational interventions, such as pressure buildup
and re-injection, is a relatively new area of study. It is an area that will become increasingly important and
valuable in the near future.
Multiple stage stress shadow and impact of offset well depletion causing fracture asymmetry.

July 2016 | © Barree & Associates LLC 12 www.gohfer.com | www.barree.net
Production Forecasting and Economic Optimization
An accurate production forecast requires accurate reservoir descriptions, knowledge of reservoir
producing fractional flows, and a valid fracture conductivity profile that responds to changes in producing
conditions over time. The effective fracture length and conductivity are never constant, but change with
production rate, fractional flow, and bottomhole pressure, as well as time-dependent degradation of the
proppant itself. Using a model that accounts for all these makes it possible to demonstrate the relative
economic value of those parameters that can be controlled by the stimulation design, and those that are
dependent on accurate reservoir and PVT characterization.
GOHFER makes it easy to compare multiple production forecasts, NPV, IP, EUR, and other production
metrics for many cases. Fracture treatment design, fluid cleanup, proppant selection, and reservoir
properties can be quickly changed to show the relative sensitivity to each. An interesting exercise is to
construct a reservoir realization, with fixed reservoir and geomechanical properties, then challenge the
students to maximize the NPV or IROR for a completion design. This may involve all the possible design
parameters including frac spacing, number of entry points per stage, lateral length, proppant and fluid
selection, pump rate, perforation design, fluid volume, proppant mass, well spacing, and others.
For multi-stage horizontal wells, production can be modeled wither for the entire well, or by replicating
the production generated from a single archetypical stage. In the latter case the production is not simply
multiplied by the number of stages. Transient interference and overlap of drainage area is considered in
the production forecast and resulting economics.
Comparison of actual and model predicted post-frac production using input reservoir properties and modeled fracture geometry and conductivity.

July 2016 | © Barree & Associates LLC 13 www.gohfer.com | www.barree.net
Rate-transient Production Analysis and Decline Curves
Reservoir engineering relies heavily on analysis of production decline, and assessment of reserves and
economic value of a well. GOHFE includes a fast, efficient, and accurate production analysis package. The
analysis types include flowing material balance for determination of drainage volume, area, and aspect
ratio. These results depend heavily on a correct assessment of reservoir fluid mobility and compressibility.
To aid in the analysis, a complete PVT correlation package is part of the production analysis. This makes
evaluation of the impact on production of changes in oil and gas gravity, GOR, yield, and other properties
possible.
To determine the size and shape of the drainage area, the time for each pressure transient to reach each
successive boundary must be determined. To accomplish this, the reservoir permeability and effective
fracture length and conductivity must be determined. A diagnostic plot is provided to determine these
parameters, but the solution requires iteration with the flowing material balance. Both these analyses are
linked, and the correct results require satisfaction of both analyses.
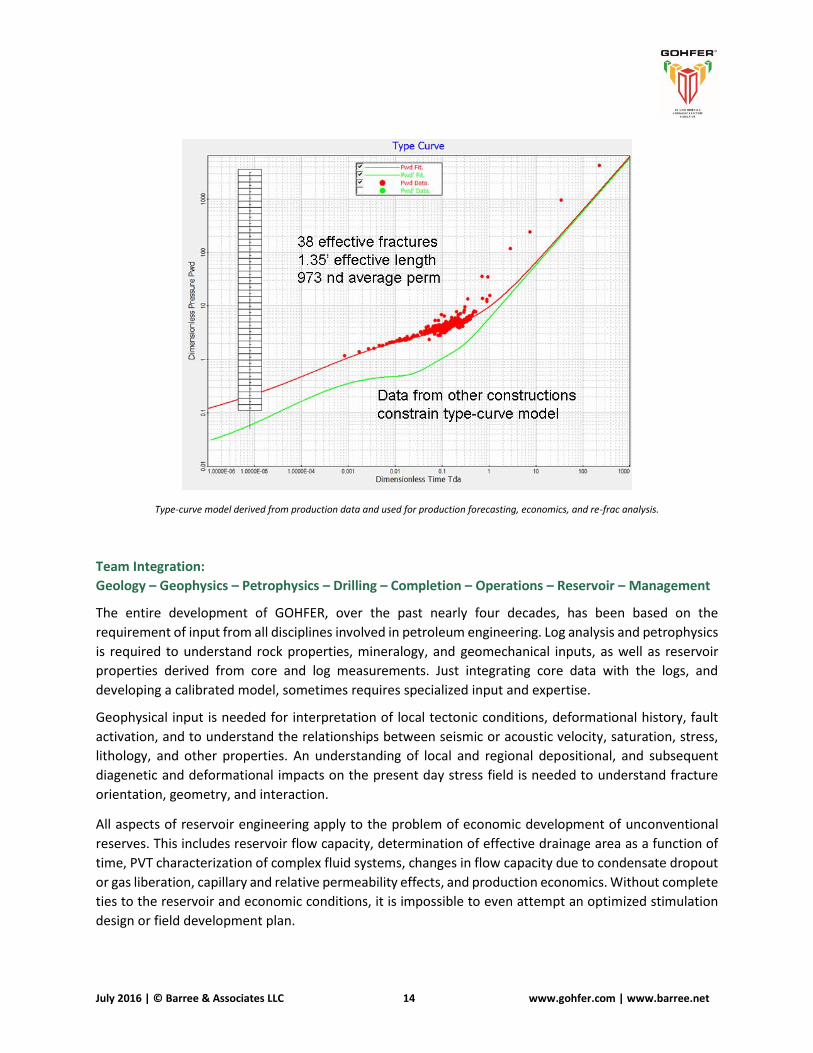
Once the drainage area, perm, and frac length are defined, the software generates am Agarwal-Gardner
type curve in terms of PWD and TDA. For either a horizontal or vertical well, a diagram of well length,
fracture effective length, and drainage area for each fracture is displayed. The type curve can be then be
used, with the input flowing pressure history of the well, to produce a model “history match” of the entire
production decline for all phases. Once a history m attach is achieved, the model can be used for various
production forecasts.
The production forecasting ability in GOHFER provides many opportunities for evaluation of well
operating plans. Starting from the end of the existing production history, the future production can be
modeled with changing BHFP or fracture length, to simulate the effect of re-frac treatment, installation
of a pump, gas lift, or other change in production mechanism. The re-frac model will also simulate the
relative impact of a change in effective fracture length with the existing pressure transient in the reservoir,
resulting from the previous production, or the effect of a shut-in with or without a re-frac. The shut-in, or
“new transient” mode assumes that the reservoir builds up to the current average reservoir pressure
based on the volumetric depletion of the preceding production.
The economic value, in terms of acceleration and added reserves, of various changes in fracture length,
shut-in, and operating conditions can be readily demonstrated. Re-fracturing is thought by many to be
next step in unconventional resource development. The ability to assess re-frac candidates quickly,
efficiently, and correctly, is a valuable asset.
July 2016 | © Barree & Associates LLC 14 www.gohfer.com | www.barree.net
Type-curve model derived from production data and used for production forecasting, economics, and re-frac analysis.
Team Integration:
Geology – Geophysics – Petrophysics – Drilling – Completion – Operations – Reservoir – Management
The entire development of GOHFER, over the past nearly four decades, has been based on the
requirement of input from all disciplines involved in petroleum engineering. Log analysis and petrophysics
is required to understand rock properties, mineralogy, and geomechanical inputs, as well as reservoir
properties derived from core and log measurements. Just integrating core data with the logs, and
developing a calibrated model, sometimes requires specialized input and expertise.
Geophysical input is needed for interpretation of local tectonic conditions, deformational history, fault
activation, and to understand the relationships between seismic or acoustic velocity, saturation, stress,
lithology, and other properties. An understanding of local and regional depositional, and subsequent
diagenetic and deformational impacts on the present day stress field is needed to understand fracture
orientation, geometry, and interaction.
All aspects of reservoir engineering apply to the problem of economic development of unconventional
reserves. This includes reservoir flow capacity, determination of effective drainage area as a function of
time, PVT characterization of complex fluid systems, changes in flow capacity due to condensate dropout
or gas liberation, capillary and relative permeability effects, and production economics. Without complete
ties to the reservoir and economic conditions, it is impossible to even attempt an optimized stimulation
design or field development plan.

July 2016 | © Barree & Associates LLC 15 www.gohfer.com | www.barree.net
The overall design of a GOHFER project integrates all these disciplines, and leads to a coherent and
consistent development of a predictive three-dimensional reservoir and geomechanical model. Rather
than spending excessive time running full field numerical reservoir simulators, that may not correctly
represent fracture conductivity, cleanup, and flow capacity, an entire GOHFER project can be built on a
time schedule that is appropriate for a university setting. Multiple production sensitivity runs can be
accomplished quickly, once the model is built. The software package is ideal for integrating data and input
from multiple disciplines, and building an appreciation for an integrated development team that is sought
after by many companies.
Regards,
Robert D. Barree
President,
Barree & Associates LLC