application of geographical information systems and remote sensing technologies for assessing
TRANSCRIPT

Given its impact on populations and the gravity of itspathology, malaria remains one of the most significantinfectious diseases. Malaria is a leading cause of mor-bidity and mortality in the developing world, especiallysub-Saharan Africa where the transmission rates arehighest and where it is considered to be a major imped-iment to economic development (Sachs and Malaney,2002). Malaria is a preventable and curable diseasewhose causal agent, a Plasmodium spp. parasite, istransmitted throughout the globe by a select number ofAnopheles vector mosquitoes. It is essentially an envi-ronmental disease since the vectors require specifichabitats with surface water for reproduction, humidityfor adult mosquito survival and the development ratesof both the vector and parasite populations are influ-enced by temperature. In Sub-Saharan Africa the pat-tern of malaria transmission varies markedly fromregion to region, depending on climate and biogeogra-phy, and broad ecological categories have been widelyused to describe variations in the observed epidemio-logical patterns (Mouchet et al., 1993). Towards eitherend of this spectrum of variation malaria transmissionis classified as stable or unstable (Gilles, 1993). Aregion prone to stable malaria is characterized by hightransmission levels with little inter-annual variation. Inthese areas, collective immunity to the disease in thepopulation is high and epidemics are unlikely. A region
prone to unstable malaria is characterized by transmis-sion levels that vary from year to year. In these areas,collective immunity is low and disease, when it doesoccur, affects all age groups and is often severe(Wernsdorfer and McGregor, 1988). Unstable malariaareas are essentially found in warm, semi-arid zones,tropical mountainous areas, and regions where previ-ous levels of control are beginning to fail. It has longbeen known that in these areas any change in tempera-ture, relative humidity or rainfall can have a majorimpact on malaria transmission, possibly leading to epi-demics (Najera, 1989).Although tremendous progress has been made globallyin fighting the vector and the parasite (Najera, 1989),the situation is far from being resolved, especially inAfrica.Since 1993 there has been a pragmatic global malariacontrol strategy based on a Primary Health Careapproach. Its aims are to: a) reduce mortality and thenegative social and economic consequences of the dis-ease; b) prevent epidemics; c) protect malaria freeareas; d) eradicate malaria where possible (WHO,1993). Such a control strategy requires recognition ofthe underlying variability in the epidemiology of the dis-ease, potential for modification, availability of resourcesand need to adapt malaria control planning to local con-ditions in areas where there is a reasonable chance ofsuccess.One of the new approaches to better understand thevariability in the epidemiology of the disease dependson knowledge of biodiversity. Specifically, the distribu-tion and ecology of the vectors and the parasites areconsidered within a context of a climatic and anthro-pogenic environment which is in perpetual evolution.
Parassitologia 47: 81-96, 2005
Application of Geographical Information Systems andRemote Sensing technologies for assessingand monitoring malaria risk
P. Ceccato1, S.J. Connor1, I. Jeanne2, M.C. Thomson1
1International Research Institute for Climate Prediction, The Earth Institute, Columbia University, Palisades, NY, USA; 2UnitéSanté, Environnement, Climat, CERMES – BP 10887 Niamey, Niger. Réseau International des Instituts Pasteur.
Abstract. Despite over 30 years of scientific research, algorithm development and multitudes of publicationsrelating Remote Sensing (RS) information with the spatial and temporal distribution of malaria, it is only inrecent years that operational products have been adopted by malaria control decision-makers. The time isripe for the wealth of research knowledge and products from developed countries be made available to thedecision-makers in malarious regions of the globe where this information is urgently needed. This paperreviews the capability of RS to provide useful information for operational malaria early warning systems. Italso reviews the requirements for monitoring the major components influencing emergence of malaria andprovides examples of applications that have been made. Discussion of the issues that have impededimplementation on a global scale and how those barriers are disappearing with recent economic, techno-logical and political developments are explored; and help pave the way for implementation of an integrat-ed Malaria Early Warning System framework using RS technologies.
Key words: malaria, epidemic, Remote Sensing, Geographical Information Systems, Early Warning System.
Correspondence: Pietro Ceccato, International Research Institutefor Climate Prediction, The Earth Institute, 227a MonellBuilding, Columbia University, 61 Rt. 9W, Palisades, NY 10964-8000 USA, Tel +1 845-680-4425, Fax +1 845-680-4864,e-mail: [email protected]

82
This biodiversity is determined by many factors:- Environmental: rainfall, temperature, vegetation;- Biological: competence of the vectors (transmission),
biology of each species of Plasmodium; andsuscecptibility of the host to disease;
- Anthropogenic: deforestation, irrigation, urbanization,movements of populations and economic changes.
Although successful eradication of malaria has beenachieved in many countries, in Europe and the USA,where it was still endemic not so long ago (last centu-ry), the situation is still problematic in many regions ofthe globe (Najera, 1989). Several initiatives have beenlaunched to reduce malaria on the various continentswhere the disease still prevails or is re-emerging. InMay 1998, the Director-General of the World HealthOrganization (WHO) announced a United Nations-ledcampaign to Roll Back Malaria (RBM), pledging tohalve malaria deaths by 2010. One of the MillenniumDevelopment Goals (MDGs), initiated at the turn ofthe century, is to combat malaria while Global Fund toFight AIDS, Tuberculosis and Malaria (GFATM) alsoprovides a mechanism for increasing the globalresources allocated for fighting the disease. The Africansituation is by far the worst where the number of deathsis actually increasing (Attaran, 2004). The reasons forthe persistence and re-emergence of malaria are manyand varied. Environmental changes, economic reasons,declining control programs and mosquito/parasiteadaptation to pesticides/drugs, all contribute to thedevelopment of the disease.During the last twenty years, the development ofGeographical Information Systems (GIS) and satellitesfor earth observation have made it possible to makeimportant progress in the monitoring of the environ-mental and anthropogenic factors which influence thereduction or the re-emergence of the disease. Analysesresulting from the combination of GIS and RemoteSensing (RS) have improved knowledge of the biodi-versity influencing malaria. A better understanding ofthe stratification of malaria and the burden of the dis-ease on the population is in–progress (Craig et al.,1999; Snow et al., 1999; Omumbo et al., 2004). Thisknowledge can help decision-makers to better allocatelimited resources in the fight against the disease.This review summarizes the recent advances in GIS andRS in the prevention and fight against malaria.Examples of applications in various areas of the globeare provided to support current knowledge on the useof the new monitoring and early warning systems.
Principles that govern emergenceof malaria
The severity of malaria is a function of the interactionbetween the parasite, the Anopheles mosquito vector,the human host and the environment. Vector abun-dance, duration of the extrinsic incubation period andsurvival rate of the vector, combined with the probabil-ity of the vector feeding off a susceptible human host
determine the risk of malaria infection, the stability ofdisease transmission, and seasonal patterns. Many fac-tors are involved in determining the evolution of theparasite, the vector, the human and the environment.Hackett wrote ‘Everything about malaria is so moldedby local conditions that it becomes a thousand epi-demiological puzzles’. Like chess, it is played with fewpieces, but is capable of an infinite variety of situa-tions’. If we are to see order within the chaos we mustconsider that most of the factors are interrelated and itis necessary to take into account these inter-relation-ships in a holistic approach to understand the compo-nents which influence the development of malaria; wemust also understand the differing scales at which eachfactor play out its influence on the overall game. In ourreview we have tried to separate them into three differ-ent components for analysis knowing that their interac-tions are key elements. The following sections reviewthe importance of each component and discuss the pos-sibility of mapping its spatial and temporal distribution.
Ecology of Malaria
Rainfall
Different malaria vectors use a variety of sites in whichto lay their eggs (irrigation canals, tire ruts, mangroveswamps, pools, etc.) as long as the water is clean, nottoo shaded and, for most species, relatively still. Inmany semi-arid areas these sites are only widely avail-able with the onset of the seasonal rains unless dry sea-son irrigation is undertaken. The association betweenrainfall and malaria epidemics has been recognized formany decades (Christophers, 1911) but while increas-ing precipitation may increase vector populations inmany circumstances by increasing available anophelesbreeding sites, excessive rains may also have the oppo-site effect by flushing out small breeding sites, such asditches or pools (Fox, 1957) or by decreasing the tem-perature, which in regions of higher altitude can stopmalaria transmission.In tropical Africa rain is largely produced from deepconvective storms and the clouds with the coldest topsurface temperature produce the heaviest rainfall. It ispossible to derive estimates of rainfall by measuringcloud top temperatures using thermal infrared imagesfrom Meteosat. At a certain threshold temperature (-40to -70ºC depending on latitude and season) clouds willprecipitate into rainfall. By measuring the length oftime a cloud is at this critical threshold temperature,knows as the Cold Cloud Duration (CCD), it is possi-ble to estimate the amount of rainfall using a simpleregression technique (Milford and Dugdale, 1990).
Using such technique, Rain Fall Estimates are producedon a decadal basis and provided to the user communityby the Africa Data Dissemination Service (ADDS) web-site supported by USAID FEWS NET. The methodolo-gy uses an interpolation method to combine Meteosatand Global Telecommunication System (GTS) data,
P. Ceccato et al. - Geographical Information Systems, Remote Sensing and malaria

and includes warm cloud information for the decadalestimates. Meteosat 7 geostationary satellite infrareddata are acquired in 30-minute intervals, and areasdepicting cloud top temperatures of less than 235K areused to estimate convective rainfall. WMO GTS datafrom ~1000 stations provide station rain gauge totalsand are taken to be the true rainfall within 15-km radiiof each station, model analyses of wind, relative humid-ity and orography are also included. Two new satelliterainfall estimation instruments have recently been incor-porated into the rainfall estimation, namely, the SpecialSensor Microwave/Imager (SSM/I) on board DefenseMeteorological Satellite Program satellites, and theAdvanced Microwave Sounding Unit (AMSU) on boardNOAA satellites. SSM/I estimates are acquired at 6-hour intervals while AMSU rainfall estimates are avail-able every 12 hours (FEWS Web page: http://igskmncn-wb015.cr.usgs.gov/adds/readme.php? symbol=rf).Rainfall data are also available from the 2.5ºx2.5ºClimate Prediction Center Merged Analysis ofPrecipitation (CMAP) version 0309 (Xie and Arkin,1998) dataset constructed from gauge observations,from five kinds of satellite estimates of precipitation,and from National Centers for EnvironmentalPrediction Reanalysis precipitation.The data area available from 1979 to date (http://www.cpc.ncep.noaa.gov/products/global_precip/html/wpage.cmap.html) are expressed as daily averages (mm perday) for each month. These data are of a much coarserspatial resolution than satellite rainfall estimates distrib-uted by the Africa Data Dissemination Service (ADDS),but have the advantage of a consistent time serieslonger than the one provided by ADDS. The CMAPdata were used to study the relationship of variability inrainfall to malaria incidence in Botswana (Thomson etal., 2005).Additional information for Malaria Epidemic Riskanalyses is also provided via the ADDS FEWS webpage. The maps provide a simple indicator of changesin malaria risk in marginal transmission areas basedsolely on rainfall, showing differences above and belowexpected levels. The maps use a mask to exclude areaswhere malaria is considered to be endemic (as opposedto epidemic), or absent. This mask is based solely onclimatic constraints to malaria transmission (includingclimatic variability), and as yet does not account forareas where historic control has eliminated epidemicrisk in the northern and southern margins of the conti-nent. The maps have been tested against laboratory-confirmed malaria incidence figures in districts inBotswana where they showed a strong correlation. Themaps have also been tested and correspond well withexpert knowledge of epidemic risk in a number of epi-demic prone countries. Their use and validation else-where is encouraged.
Temperature
Temperature has an effect on both the vector and theparasite. For the vector, it affects the juvenile develop-
ment rates, the length of the gonotrophic cycle and sur-vivorship of both juvenile and adult stages with an opti-mal temperature and upper and lower lethal bound-aries. For the parasite it effects the extrinsic incubationperiod (Lactin et al., 1995). Plasmodium falciparum(the dominant malaria parasite in Africa) requireswarmer minimum temperatures than Plasmodiumvivax. This helps account for the geographic limits offalciparum malaria transmission in Africa (Bruce-Chwatt, 1991). At 26ºC the extrinsic incubation periodof this malaria species is about 9-10 days whereas at 20-22ºC it may take as long as 15-20 days. In highlandareas, where cold temperatures preclude vector and/orparasite development during part/or all of the year,increased prevalence rates may be closely associatedwith higher than average minimum temperatures(Bouma et al., 1994).It is possible to estimate surface temperatures from thethermal channels of NOAA-AVHRR sensors, Meteosatand TERRA-MODIS. The Land Surface Temperature(LST), a proxy environmental variable, is commonlycalculated using a split-window method which takesinto account some atmospheric effects (Adding andKauth, 1970; Price, 1984; Coll et al., 1994; França andCracknell, 1994). The relationship between air tem-perature and LST is not straightforward. The LST rep-resents a spatial integration of information over theentire area observed, and therefore differs from in situmeasurements. It also differs from the ambient tem-perature since it measures the temperature of theearth’s “skin”.New research is underway to use temperature fieldsproduced by the MM5 mesoscale numerical weatherprediction model for this purpose, available from theAir Force Weather Agency. Estimated air temperaturedownscaled with a regional digital elevation model isplanned to be associated with rainfall to produce anextended vectorial capacity model (Fig. 1).Vectorial capacity V has been defined as the daily rateat which future inoculations could arise from a cur-rently infected case (Dye, 1992). It has also beendescribed as a convenient way of expressing malariatransmission risk, or the receptivity of an area tomalaria (Gilles, 1993). While vectorial capacity does
83P. Ceccato et al. - Geographical Information Systems, Remote Sensing and malaria
Fig.1. A diagrammatic representation of the “extended”vectorial capacity model.

84
not take into account parasite availability in the humanhost population, it is considered to be analogous to theenvironmental-biological driving force under-pinningthe transmission potential in an area. The vectorialcapacity model has more recently been extended toenable temperature and rainfall to drive the model(Connor, 2002).The extended vectorial capacity model includes theinfluence of rainfall and temperature variables onmalaria transmission patterns through the impact theyhave on the bionomics of the anopheline vector (feed-ing frequency, gonotrophic period, larval developmentrate, survival) and the parasite’s extrinsic incubationperiod (sporogeny) in its mosquito host.
Humidity
The survival rate of adult insects is often thought toincrease or decrease in relation to a factor called satu-ration deficit. Saturation deficit is derived by subtract-ing the actual water vapor pressure from the maximumpossible vapor pressure at a given temperature.Evidence for other vectors (tsetse, ticks, culicoides)suggests that saturation deficit is an important environ-mental variable in larval and adult survivorship.Despite little direct evidence of the effect of saturationdeficit on mosquito longevity, the relationship can beinferred from historical studies in Africa, India andLatin America (Macdonald, 1953).There are no techniques currently available to extractprecise quantitative estimations of saturation deficitfrom satellite data although Normalized DifferenceVegetation Index (NDVI) has been suggested as a pos-sible proxy (Rogers, 1991). Nevertheless, related vari-ables can be used to infer its status such as the waterdeficit index obtained from AVHRR data (Moran et al.,1994) or the Global Vegetation Moisture Index whichprovides an estimation of the vegetation water content(Ceccato et al., 2002). Further research to quantify therelationship between those indices and saturationdeficit must be made to determine whether they couldbe used as substitutes.
Surface Water
Surface water provides the habitat for the juvenilestages (egg, larvae, pupae) of malaria vectors. Monitor-ing the state of small water bodies and wetlands usingsatellite data is therefore very useful to identify thesource of malaria vectors. The Short Wave Infrared(SWIR) is a wavelength (1.55-1.75 µm) absorbed bywater and therefore can be used to retrieve informationon the presence of water bodies and vegetation watercontent (Ceccato et al., 2001). The SWIR is availableon sensors such as LANDSAT-TM, SPOT-VEGETA-TION and TERRA-MODIS. Recently, research hasbeen developed to use the SWIR to retrieve vegetationwater content (Ceccato et al., 2002) and water bodies(Gond et al., 2004) using SPOT-VEGETATION. Newindices such as the Global Vegetation Moisture Index
(GVMI, Ceccato et al., 2002); Normalized DifferenceWater Index (NDWI, Gao, 1996) have been developedto retrieve vegetation water content and a contextualalgorithm developed by Gond et al. (2004) to retrievewater bodies using the sensor SPOT-VEGETATION.However, SPOT-VEGETATION spatial resolution of1km does not allow the detection of small ponds impor-tant for mosquito breeding. TERRA-MODIS (with aspatial resolution of 250 m) and LANDSAT-TM (30 m)provide improved quality of images and can be used asshown later in section 3 for monitoring water bodies.In addition to the potential of the SWIR, furtherresearch was also carried out using RADARSATSynthetic Aperture Radar (SAR) images to monitorwetland ecosystem and flooded areas (Kandus et al.,2001). The use of radar systems provides the possibili-ties to monitor earth features during night or when cov-ered heavily by clouds. The signal amplitude wave-length emitted and received by the sensors are not influ-enced by atmospheric conditions and allow the detec-tion of area flooded even during cloudy days. Radar RSprograms, like ENVISAT, RADARSAT 2, have beendeveloped and a panel of products made available,increasing the possibility for using operationally radarimages to monitor water bodies. RADARSAT was suc-cessfully used in different ecosystems and combinedwith SPOT-VEGETATION data to enhance the accura-cy of mapping the surface area of flooded wetland areas(Toyra et al., 2002).
Vegetation
Vegetation type and growth stage may play an impor-tant role in determining vector abundance irrespectiveof their association with rainfall. It has been noted thatwhilst rice irrigation schemes may provide excellentbreeding sites for An. gambiae s.l. early in the growthcycle of the plants – this changes as the rice plantsmature and form a dense canopy over the water(Lindsay et al., 1991). Methods of rice field classifica-tions were successfully developed using SyntheticAperture Radar (SAR) sensors onboard ERS1(Chakraborty et al., 1997) and RADARSAT (Panigrahyet al., 1999, Shao et al., 2001).The type of vegetation which surrounds the breedingsites, and thereby provides potential resting, sugar feed-ing supplies for adult mosquitoes, and protection fromclimatic conditions, may also be important in determin-ing the abundance of mosquitoes associated with thebreeding site (Beck et al., 1994). Furthermore, vegeta-tion type may influence mosquito abundance by affect-ing the presence or absence of animal or human hostsand thereby affecting the availability of blood meals.Large-scale changes in vegetation class and phenologyhave been extensively researched using AVHRR(Townshend and Justice, 1986; Tucker et al., 1985) andSPOT-VEGETATION (Mayaux et al., 2004) data.Satellite images at higher spatial resolution such asLandsat, SPOT-HRVIR and TERRA-MODIS have beenused to map changes in vegetation in particular defor-
P. Ceccato et al. - Geographical Information Systems, Remote Sensing and malaria

estation, a process widely thought to be associated withchanging levels of malaria transmission (Walsh et al.,1993). MODIS images at 250m spatial resolution areaccessible free of charge. Therefore, they are used on aregular basis to detect vegetation in Africa (where thespatial resolution of SPOT-VEGETATION cannotdetect it) by the Desert Locust community for opera-tional field campaigns to fight against the Desert Locust(Ceccato, in press).
Seasonality in Climate
The combined influence of rainfall, temperature andhumidity, re-grouped underneath weather (short-term)and climate (long-term) on malaria is very complex,especially for extreme weather conditions. Directeffects of climate on vector and parasite developmentare easy to see but indirect effects may also be impor-tant such as the effects of previous exposure (related todirect effects), nutritional status, and co-infection mayhelp determine the disease outcome.Just as climate is one of the determinants of malariaendemicity, climate variability is one of the main factorsbehind inter-annual fluctuations of malaria. Literatureabounds with examples of how unusual, anomalous orextreme weather conditions have led directly and indi-rectly (through destructive crop pests and diseases) tohuman malnutrition and in turn to health problems orto both at the same time (Gommes et al., 2004).In recent years there have been significant scientificadvances in our ability to predict climate on the season-al timescale (Goddard et al., 2001). The skill associatedwith these predictions varies from region to region, butis generally higher within the tropics. Information on cli-mate forecast and weather anomalies can be accessed online through the IRI web site (IRI Climate InformationDigest: http://iri.columbia.edu/climate/cid/index.html).The World Health Organizations Technical SupportNetwork for Malaria Epidemic Prevention and Controlhas suggested that such forecasts may be relevant tomalaria early warning (WHO, 2001). Recently, theinformation provided by regional forecasters inSouthern Africa has been presented and used by deci-sion-makers to forecast an increase in malaria risk inepidemic prone areas during seasonal Outlook Forums(DaSilva et al., 2004).The importance of the factors influencing malaria is notonly limited to climatic factors. Anthropic changes inthe environment, in land use, deforestation, inhydraulic network, also induce continuous changes inthe intensity of malaria transmission.
Ecology of Anthropogenic Componentsof Malaria Transmission
Consequences of demographic and technological devel-opments during the last century have considerablymodified the environment. Forest and swamp regionswere shifted to agriculture to feed an ever-increasingpopulation. Water requirements for many crops have
led to modifications of surface waters. Development ofurban areas has also modified the spatial distribution ofpopulations and lead to high concentrations of popula-tion in restricted areas. Already more than 50% of thetotal global population lives in cities. These demo-graphic changes in cities can impact malaria, either byincreasing the potential for malaria transmission wherethe development of irrigated cultures surrounding thecity increases the vector population or by decreasing it,if adequate measures are taken to reduce the vector andparasite population in the cities.In some countries, and in particular in Africa, move-ments of population for political or economical reasonscreate another risk factor to the spread of malaria.Migrants and refugees may bring new parasites (includ-ing drug resistant parasites) to an area and increasetransmission in the settled population, or because theycome from a low, no transmission area migrants andrefugees may be highly vulnerable to severe diseasewhen the enter a malaria endemic area (Giada et al.,2003). Development of urban cities (Small, 2003) canbe monitored with high spatial resolution images suchas Ikonos and QuickBird (respectively, 1m and 0.61mfor the panchromatic channel).
Control Components
Malaria is a preventable and curable disease. The mostimportant factors that determine the survival ofpatients with P. falciparum malaria are (i) the patientspersonal vulnerability (in terms of immunity, malnutri-tion, other diseases) and (ii) early diagnosis and prompttreatment with effective anti-malaria drugs. Drug ther-apy may not only save the patient but also decrease thereservoir of gametocyte available for further transmis-sion (Mouchet et al., 2004). Vector control is essential-ly based on (i) in-house spraying with insecticides (ii)personal protection through the use of mosquitonets/repellants and (iii) larviciding of breeding sites. Agood control strategy is to use the best combination ofcontrol methods available where and when they can bemost effective.In endemic malaria areas where the intensity of trans-mission varies little from year to year it is possible toorganize control programs according to the calendar ofthe transmission season and RS may be used to helpstratify different levels of endemicity, and the local sea-sonality of transmission (Thomson et al., 1999).However, in areas where there is considerable inter-yearvariation in transmission and the potential for epi-demics, a control program can benefit from more costeffective early warning systems supported by the use ofsatellite data for environmental monitoring which canbe used to predict unusually high malaria 1-2 months inadvance as well as satellite data for the location ofbreeding sites; and where necessary, satellite data formonitoring dispersed populations or population on themove. In recent years the use of GIS within the healthservices in many malaria affected countries hasincreased and although this process remains problem-
85P. Ceccato et al. - Geographical Information Systems, Remote Sensing and malaria

86 P. Ceccato et al. - Geographical Information Systems, Remote Sensing and malaria
Mis
sion
Sen
sor
PA
NV
NIR
SW
IRT
IRS
AR
/Ban
dS
wat
h (k
m)
Laun
chA
pplic
atio
ns
Orb
view
-3O
rbvi
ew-3
14
820
03U
rban
and
sub
-urb
an a
reas
, ref
ugee
cam
ps,
land
pla
nnin
g &
infr
astr
uctu
res
Ikon
osIk
onos
14
1119
99U
rban
and
sub
-urb
an a
reas
, ref
ugee
cam
ps,
land
pla
nnin
g &
infr
astr
uctu
res
Qui
ckb
ird-2
Qui
ckb
ird0.
612.
4422
2001
Urb
an a
nd s
ub-u
rban
are
as, r
efug
ee
cam
ps,
land
pla
nnin
g &
infr
astr
uctu
res
ALO
SAV
NIR
-23
10-1
535
-70
2004
Land
cov
erag
e an
d la
nd-u
se c
lass
ifica
tion
map
s
SP
OT-
5aH
RG
510
2060
2002
Land
cov
erag
e an
d la
nd-u
se c
lass
ifica
tion
map
s,
veg
etat
ion
and
wat
er b
odie
s
SP
OT-
5bH
RG
510
2060
2004
Land
cov
erag
e an
d la
nd-u
se c
lass
ifica
tion
map
s,
veg
etat
ion
and
wat
er b
odie
s
Land
sat-
7E
TM+
1530
3030
185
1999
Land
cov
erag
e an
d la
nd-u
se c
lass
ifica
tion,
veg
etat
ion
and
wat
er b
odie
s
Land
sat-
5TM
3030
120
185
1984
Land
cov
erag
e an
d la
nd-u
se c
lass
ifica
tion,
veg
etat
ion
and
wat
er b
odie
s
CB
ER
SC
CD
/IR-M
SS
20/
8020
20/8
080
120
1999
Land
Sur
face
Tem
per
atur
e (L
ST)
Terr
a A
STE
R15
2090
6019
99Ve
get
atio
n, w
ater
bod
ies,
LS
T
AD
EO
S-2
GLI
250
250
1000
1600
2002
Veg
etat
ion,
wat
er b
odie
s, L
ST
Terr
a M
OD
IS25
0-10
0050
0-10
0010
0023
0019
99Ve
get
atio
n m
onito
ring
, wat
er b
odie
s, L
ST
SP
OT-
5aVe
get
atio
n10
0010
0022
0020
02Ve
get
atio
n an
d w
ater
bod
ies
EN
VIS
AT-1
AAT
SR
1000
1000
1000
512
2002
Fore
st a
nd n
atur
al v
eget
atio
n
NO
AA
-MAV
HR
R11
0011
0011
0030
0020
02Ve
get
atio
n m
onito
ring
, wat
er b
odie
s, L
ST
Orb
view
-2S
eaW
iFS
1100
-450
015
00-2
800
1997
Veg
etat
ion,
wat
er b
odie
s, d
ust
Met
eosa
t 7V
ISS
R25
0050
00H
emis
phe
re19
97R
ainf
all e
stim
atio
n, L
ST
Met
eosa
t-Sec
ond
SE
VIR
I14
0048
00H
emis
phe
re20
02R
ainf
all e
stim
atio
n, L
ST
Gen
erat
ion
Rad
arsa
t-1
SA
R10
-100
/C45
-500
1995
Fore
st, w
ater
bod
ies
Rad
arsa
t-2
SA
R3-
100/
C10
-500
Fore
st, w
ater
bod
ies
EN
VIS
ATA
SA
R30
/C10
020
02W
eath
er, w
ater
bod
ies
ER
S-2
AM
I-S
AR
30/C
100
1995
Veg
etat
ion,
wat
er b
odie
s, w
eath
er
ALO
SPA
LSA
R10
/L70
Veg
etat
ion,
wat
er b
odie
s
Tabl
e 1.
Lis
t of s
atel
lite
curre
ntly
ava
ilabl
e or
ava
ilabl
e in
the
near
futu
re fo
r mon
itorin
g m
alar
ia c
ompo
nent
s. P
AN
= P
anch
rom
atic
, VN
IR =
Vis
ible
/Nea
r-Inf
rare
d, S
WIR
= S
hortw
ave
Infra
red,
TIR
= T
herm
al In
frare
d, S
AR
= S
ynth
etic
Ape
rture
Rad
ar (
Spat
ial r
esol
utio
n -
m),
LST
= L
and
Surfa
ce T
empe
ratu
re. S
atel
lite
whi
ch h
ave
been
use
d fo
r m
alar
ia s
tudi
esar
e hi
ghlig
hted
.

atic in some areas (Snipe and Dale, 2003) the routinemapping of health surveillance data, distribution ofclinics, breeding sites, etc. means that spatial informa-tion, derived from satellite data, can now be directlycompared with health data.Progress is being made, but much could be learnt fromthe development of GIS and RS tools for routine sur-veillance for desert locust control monitoring which iscurrently operational in 15 countries affected bydesert locust from Mauritania to India (Ceccato, inpress).The different sensors available for monitoring the com-ponents influencing malaria are summarized in Table 1.
Use of Remote Sensingin malaria control
Satellite sensors developed in US, Europe, Canada andIndia, have contributed to a better understanding ofmalaria vector ecology. The history of RS and its appli-cation to malaria and other vector-borne diseases hasbeen recorded over time in a series of review papers(Washino and Wood, 1994; Wood et al., 2000;Thomson et al., 1997; Hay et al., 2000; Manguin andBoussinesq, 1999; Beck et al., 2000; Thomson andConnor, 2001). Yet, despite 30 years of research on thepotential applicability of remote sensing technologies tomalaria control, these tools are only now beginning tohave an impact on policy and practice in operationalcontrol of malaria in affected countries.Research initially focused on the spatial rather thantemporal dynamics of malaria transmission indices. Inparticular, efforts were made to gain a detailed under-standing of the population dynamics of the vectors,rather than the distribution of disease in the humanpopulation. The use of high-resolution imagery andexpensive software also limited these studies to well-resourced research groups. Thus, demonstration stud-ies have been difficult for national malaria control toincorporate into their routine planning activities. It hastaken the intervening 30 years for many of the worstaffected countries to begin to collect and routinely mapfrequently updated information on malaria incidence.The following sections review applications developedwith high-resolution and low-resolution data and alsodiscuss future development of an operational system ofsatellite images which could be used directly by thedecision-maker community in countries. Operationaluse of these images is now feasible due to the freeaccess of the necessary images.
Use of High Spatial Resolution Images forMapping Landscape Ecology
Since the launch of Landsat-1 30 years ago, remotelysensed data have been used to map and monitor fea-tures on the earth’s surface and the atmosphere above.Over the following three decades an increasing numberof studies used remotely sensed data for monitoring,surveillance and risk mapping of vector borne disease
indicators, in particular malaria (Barnes and Cibula,1979; Rogers and Randolph, 1991; Connor et al.,1995; Hay et al., 1996; Thomson et al., 1996; Beck etal., 1997; Beck et al., 2000). More recently there havealso been studies on the use of RS for non-vector borneinfectious disease transmission (Molesworth et al.,2003).In the early years, investigations were led by NASA sci-entists in the Earth Observations Division (EOD) at theJohnson Space Center in Houston, Texas. Some of thestudies, which demonstrated the potential utility of dataacquired from both cameras and sensors onboard air-craft platforms, used them to identify mosquito-breed-ing habitats associated with Aedes sollicitans; relatedisease with housing quality; and identify Calladiumsp., the plant associated with the intermediate snailhost for the schistosoma parasite. The EOD group alsointegrated weather data from the National Oceanic andAtmospheric Administration’s (NOAA) Tiros Opera-tional Satellite into an insect model to describe habitatsin Mexico that supported the screwworm fly. After adecade of demonstration projects, NASA ended theprogram, assuming that the health community wouldtake up the use of airborne and satellite data forresearch, surveillance, and control activities. This was areasonable assumption, given that the forestry, geologi-cal, and agricultural communities had begun activelyincorporating these data into their own activities.However, the health community did not adopt the useof remotely sensed data, and NASA’s involvementlapsed until 1985, when scientists from the originalEOD program initiated a new human health applica-tions program Global Monitoring and Human Health(GMHH) at Ames Research Center. This program ranfrom 1985 until its transition in 1995 to the Center forHealth Applications of Aerospace Related Technologies(CHAART) (http://geo.arc.nasa.gov/sge/health/chaart.html). The GMHH program’s purpose was to demonstrate theapplication of RS and GIS technologies in the areas oflandscape epidemiology focusing on the interaction ofland use and vector bionomics. The first GMHH pro-gram used Landsat Multispectral (MSS) data to mapareas with high abundances of Anopheles freeborni lar-vae within rice fields in California (Wood et al., 1991)which could then be targeted by the states vector con-trol program. By using a time-series of Landsat MSSdata, GMHH scientists discovered that those fields thatproduced higher numbers of larvae ‘greened-up’ soonerthan neighboring rice fields; this gave an early seasonadvantage to the anophelines, which needed vegetatedwater to attach egg rafts. A spatial analysis also indi-cated that high larval-producing fields were found inareas where there was a mix of land uses, includingorchards, cattle pastures, and native vegetation; theareas in which rice was the only land use had signifi-cantly fewer mosquitoes. This was explained by anunderstanding of the vector’s limited flight range (3km) and habitat preferences. Within her flight range,the female required a blood meal (preferably from cat-tle or small mammals associated with native vegeta-
87P. Ceccato et al. - Geographical Information Systems, Remote Sensing and malaria

88
tion), followed by a resting site (such as a cool orchardenvironment), and finally a rice field in which to lay hereggs. GMHH scientists used the Landsat MSS data tomap the vegetation canopy green-up in the rice fields;the location of the orchards, cattle pastures, and ricefields; and then used this map to describe the temporaland spatial relationships between them. In this way,high larval-producing rice fields could be identified upto two months prior to peak larval production.Beginning in 1987, the GMHH program began inten-sive vector ecology studies of Anopheles albimanus, aprimary vector of malaria in the Americas. The studytook place in southern Chiapas, Mexico, an area ofunstable malaria. As was found in the California rice-field study, not all villages (fields) had the same abun-dance of mosquitoes, and the hypothesis was that thelandcover/land use (i.e. landscape) functioned as thelimiting factor to mosquito distribution. To test this,Ames scientists used multi-temporal Landsat ThematicMapper (TM) data to map landscape elements in thestudy area, while Ames’ colleagues sampled adult mos-quito abundances surrounding 40 randomly selectedvillages. GIS functions were used to determine the pro-portion of different remotely sensed landscape elementssurrounding the village within the flight range of An.albimanus. The results showed that the proportions oftwo landscape elements (unmanaged pasture and tran-sitional swamp) could predict villages with high abun-dances of adult mosquitoes throughout the annual cal-endar, with an overall accuracy of 90% (Beck et al.,1994). These landscape elements provided opportuni-ties for blood meals and breeding sites, and could beeasily mapped using Landsat TM data. The statisticalmodels generated in the study were then applied inanother location in Chiapas using a blind test.Meanwhile, Ames’ Mexican colleagues sampled mos-quito abundances throughout the year. At the end of theseason, the modeled predictions were compared withthe observed abundances, and the scientists found thatthe regression model was able to predict seven of theten highest abundance villages (Beck et al., 1997). Thisresult indicated that RS/GIS could indeed be used tohelp malaria control agencies target villages at high vec-tor-human contact risk, thus avoiding a waste of valu-able resources being used to treat villages with little tono risk.NASA scientists at Goddard Space Flight Center’sHealthy Planet program are conducting a landscape-based malaria study in the Mekong River area. Theteam, which includes scientists from Thailand, is usingdata from Landsat TM, Ikonos, and NASA’s AdvancedSpaceborne Thermal Emission and ReflectionRadiometer (ASTER) and Moderate ResolutionSpectroradiometer (MODIS) to identify potentialbreeding sites of the major vector species in order tobetter focus larvicide and adulticide applications. Theproject is also developing a malaria transmission modelthat includes parasites, hosts, vectors, human factors,and the environment, as well as a risk model to predicttransmission intensity that incorporates meteorological
data. These models use sophisticated techniques suchas discrete wavelet transformation to generate land-scape patterns from the various satellite data types.In Africa the landscape ecology approach has also beensuccessfully used in studies of malaria transmissionassociated with rice irrigation, landuse change andurban – rural interactions (Eisele et al., 2003). Irrigatedrice cultivation has been associated with an extendedbreeding season and higher densities of the main vec-tors of malaria compared with neighboring, non-irrigat-ed areas in many parts of Africa (Ijumba and Lindsay,2001). Landsat imagery has been frequently used inthese studies to provide a detailed map of the spatialecological characteristics of the irrigated areas and theirsurroundings. Resurgence of malaria in Madagascarafter 20 years of effective control has resulted in thedisease becoming a major public health issue onceagain – responsible for between 5-20% of all outpatientvisits and a major cause of morbidity and mortality(Ariey et al., 2002). While the disease is endemic in thecoastal areas it is seasonal and unstable in the highlands– where epidemics marked the comeback of the diseasein the late 1980s. It has been ascertained that rice fieldsare the principle breeding sites of Anopheles funestus,the malaria main vector in the highlands (Marrama etal., 1995), and that altitude plays a major role both inthe anopheles ecology and the length of the sporogoniccycle via temperature (Mouchet and Blanchy, 1995).Knowledge of topography and rice field distribution istherefore key to the malaria stratification of the high-lands necessary for control purposes. An epidemiologi-cal early warning and control system developed by theMinistry of Health (MoH) in conjunction with theItalian Cooperation (Albonico et al., 1999) was alreadyin place in Madagascar. However, the system, based onclinical and parasite data, was producing numerousfalse positive cases of alert and the forecast was notmade sufficiently early in the season to allow the imple-mentation of actions to decrease malaria risk. It wastherefore necessary to improve the predictability ofmalaria by forecasting it with a longer lead time beforethe outbreak. By adding climatic and environmentalfactors to the model, the predictive accuracy of the sys-tem could have been improved. This was achieved bydeveloping a new epidemic early warning and controlsystem which integrated parasite, clinical, and environ-mental data. The system, called SIGREP (Systèmed’Information Géographique pour la prévention duRisque d’Epidémie de Paludisme dans la région desHautes Terres centrales de Madagascar – Geographicinformation system for malaria risk prevention in theMalagasy Highlands), was developed by the MalariaResearch Group (GRP – Groupe de Recherche sur lePaludisme) of the Institut Pasteur of Madagascar, theItalian Cooperation and the Malaria Control Service ofthe Malagasy Ministry of Health (Jeanne, 2000).Implementation of SIGREP was planned in four phases:- Phase 1: Setting a RS method to monitor rice-fields
using SPOT Xi+P images collected after the rainy sea-son (Fig. 2).
P. Ceccato et al. - Geographical Information Systems, Remote Sensing and malaria

- Phase 2: Analyzing the links between rice-fields charac-teristics (type, area, distance from houses) and malariatransmission (vector studies).
- Phase 3: Creating a model to assess malaria risk.- Phase 4: Integrating the new model within the malaria
control unit of the MoH planning system.To date, Phases 1 and 2 have been implemented and theinformation collected for SIGREP has been incorporatedinto an Atlas of Malaria in Madagascar (http://www.pas-teur.mg/AtlasPalu/index.htm) designed to inform theMinistry of Health of the current status of the biogeog-raphy, vector and parasite species and malaria incidenceacross the country. The plan is to update this atlas on aregular basis and implement Phases 3 and 4 in the nearfuture.In French Guyana, l’Institut Pasteur and GeoscienceFrancilian Institute of Marne la Vallée University usedradar JERS-1 RS data to detect potential vector larvalbreeding sites for use in control malaria program.Tropical amazonian forests cover 90% of FrenchGuyana. Malaria remains a public health priority along
the two rivers that demarcate its border. Vector abun-dance and malaria risk varied considerably in bothspace and time. Local climate and hydrological varia-tions were examined to identify whether they couldexplain this heterogeneity. The river margins (Fig. 3)were studied in both wet and dry seasons to understandwhether rainfall and river flow were linked to thepotential vector larval breeding sites. This was achievedusing radar remote sensing using the L band of theJERS-1 satellite system (Rudant et al., 1996). Thanks toL-Band wavelength, flooded areas along river marginsin Amazonian forest were identified. These shady flood-ed areas are potential larval habitats of malaria vectors,such as Anopheles darlingi.
Use of Low Spatial Resolution Images forMapping Environmental Components
Low spatial resolution images such as NOAA-AVHRRand Meteosat have been used to update and improve thespatial resolution of malaria transmission intensity mapsin several countries, especially in Africa. NDVI comput-ed from NOAA-AVHRR and cold cloud duration (CCD)inferred from Meteosat have been used as secondary pre-dictors of transmission intensity (Omumbo et al., 2002).
NDVI is an empirical formula designed to producequantitative measures related to vegetation propertiessuch as vegetation biomass and conditions. NDVI val-ues vary between -1.00 and 1.00 and are computed asshown in Eq. 1:
NDVI = –––––––––– (1)
Where: NIR is the reflectance measured in the nearinfrared channel (expressed in %); Red is thereflectance measured in the red channel (expressed in %).
The higher the NDVI value is the denser or healthierthe green vegetation is. Visible and near-infrared chan-nels are available on most optical satellite sensorsincluding NOAA-AVHRR, TERRA-MODIS and SPOT-
89P. Ceccato et al. - Geographical Information Systems, Remote Sensing and malaria
Fig. 3. River margin in French Guyana.
(NIR-Red)
(NIR+Red)
Fig. 2. SPOT Xi + P for prevention of malaria risk in the high-lands of Madagascar.Legend:SIGREP, Spot 4 Xi- 168-369 27/04/20001. Color composite RGB 342 2. Classification of 22 classes (maximum likelihood)3. 7 class groups with all types of rice field in bright green

90
VEGETATION. However, only the NOAA-AVHRRsensors have an historical data series long enough (July1981 to current) to be used for comparison with long-time series data. Since NDVI values can vary dependingon the sensor and atmospheric conditions, it is impos-sible to compare NDVI values computed from differentsensors used between July 1981 and the current date. Itis therefore required to:
1) Calibrate the NDVI values for inter-sensor differ-ences (several sensors have been used between 1981and current date) and intra-sensor degradation.
2) Correct the NDVI values for atmospheric perturba-tions such as El Chichon and Mt. Pinatubo volcanicevents.
These calibrations and corrections were implementedby NASA and ten-day composite period products weremade available at 8km pixel resolution on an AlbertEqual Area projection (Pinzón et al., in press). Theresulting NDVI time-series products were used to ana-lyze trends in malaria incidence in Eritrea from 1996 to2003 showing high correlation between NDVI valuesand malaria incidence (Thomson et al., 2004).Meteosat satellite has also been operationally used formonitoring areas where excess rainfall is the major epi-demic indicator (e.g. the Sahel, semi-arid lowlands inthe Horn of Africa, and the desert-fringes of SouthernAfrica). During the third meeting of the Roll BackMalaria Technical Support Network on Epidemic pre-vention and Control (WHO, 2002), it was noted thatMEWS have immediate operational value in areaswhere excess rainfall is the major epidemic indicator(e.g. the Sahel, semi-arid lowlands in the Horn ofAfrica, and the desert-fringes of southern Africa).Further, those simple products such as rainfall differ-ence maps for these epidemic-prone regions should bedeveloped and made available through the existingFamine Early Warning System’s Africa Data Dissemi-nation Service (WHO, 2002). These products weresubsequently developed and have, since mid-2002,been routinely available (WHO, 2002) (Fig. 4). Areview of their utility in desert fringe settings inSouthern Africa has shown a high correlation betweenrainfall difference anomalies and both confirmed(Botswana) and unconfirmed (Namibia, Swaziland andZimbabwe) malaria incidence anomalies, with a lead-time of at least 2 months (Connor, 2002; Connor,2003). Further review of their utility in East and WestAfrica is currently planned (Connor, 2003; WHO,2003).While these routine products were primarily aimed atlowland ‘desert-fringe’ epidemic settings, it has beenshown that they offered a potential 4 week lead time fortrue epidemics, during 2002, in highland settings inKenya (Hay et al., 2003; WHO, 2003). These samerainfall difference products were also used for opera-tional monitoring of changes in epidemic risk, during2002, in highland Uganda (Connor, 2003).
Future Operational Use of Satellite Datain Affected Countries
Operational use of remotely sensed images has taken along time to be implemented in technologically devel-oping regions because image and processing softwarecosts were prohibitive. This problem is now diminish-ing since: (i) computer processing and data storagefacilities are now accessible at lower cost, (ii) satelliteimages at high spatial resolution have become accessi-ble free of charge (MODIS data) via the Internet and(iii) processing tools such as Healthmapper (GIS tool),Windisp (image display tool), and ADDAPIX (imageanalysis tool) are being made available to the user com-munity at no cost by organizations such as the WorldHealth Organization and the UN Food and AgricultureOrganization (FAO).The recent availability of free images and processingtools has enabled the rapid development of applicationsusing RS and GIS for operational purposes. In the caseof Desert Locust monitoring using RS, GIS and datacollection tools including GPS and palmtop computersshows that technology can be made operational inAfrica under harsh conditions and at low cost. This suc-cessful operational early warning system for DesertLocust monitoring developed by FAO could also be
P. Ceccato et al. - Geographical Information Systems, Remote Sensing and malaria
Fig. 4. Rain Fall Anomaly (for Malaria) produced everydecade with a spatial resolution of 10 km. Data are availa-ble on the website of the USGS, Africa Data DisseminationService: http://igskmncnwb015.cr.usgs.gov/adds/.

applied for Malaria Early Warning System. The majorchallenge would be to harmonize data collection andtools in the Malaria community in order to enable datadissemination and analyses. This harmonization for theAfrican continent should be made by an organizationsuch as the UN which has the ability to develop stan-dards and negotiate processes to reach consensus onmethodologies and best practices between countries.Thanks to the availability of free image data at high spa-tial resolution (MODIS images), a new generation ofapplications can be now implemented to help decision-makers in the field. The image (Fig. 5) shows the area
between Niger-Mali and Burkina Faso where a projectis currently underway (NOMADE project). The follow-ing image (Fig. 6) shows the presence of vegetation andwater bodies with sufficient spatial resolution to allow
analyses of where and when (i) vector can develop and(ii) where nomad herds can congregate for food andwater and therefore be at risk of malaria. TheNOMADE project will allow direct access of informa-tion to the user community by using MODIS imageswhich are free of charge via the Internet.The use of MODIS images is also operational in thedesert locust monitoring systems implemented in 20countries where the Department of Plant Protection(DPP) of the Ministry of Agriculture has access via a FTPsite at FAO to the MODIS images processed locally inRome. Each DPP downloads the images and integratesthem into a customized GIS developed specifically tomonitor desert locust. The desert locust Officer is thenable to analyze where and when to send survey teams inthe desert to scout for desert locust. Once found, infor-mation can be provided to the control team on the areato be treated (Ceccato, in press). This approach can alsobe adapted for the malaria control community.The launch of initiatives to reduce malaria such as theRoll Back Malaria (RBM), the Millennium DevelopmentGoals (MDGs) and the Global Fund to Fight AIDS,Tuberculosis and Malaria (GFATM) can also provide aplatform to help the transfer of these new technologiestoward the most affected countries. Data and goodintentions alone, however, are not sufficient. Developingcountries will also need assistance in the process of tech-nology transfer, and in structuring their national infor-mation systems and decision-making processes, if theyare to derive full benefit from this exceedingly powerfultechnology.
Integration GIS-RS-Models to produceMalaria Early Warning System
The ready availability of frequently updated data onenvironmental variables pertinent to malaria transmis-sion over large and remote regions makes RS a usefulsource of information for epidemic early warning sys-tems. The concept of an early warning system for theprediction of malaria epidemics predates satellite tech-nology by many decades. In fact an early warning sys-tem in response to the massive epidemics that occurredperiodically in pre-independence India was operatedroutinely in the Pubjab from the early 1920s until theearly 1950s (Najera, 1999). Christophers (1911)observed that between 1868-1908 severe and explosive‘fever’ epidemics of two-three month duration (August-October) were common in the region. In particular henoted that the worst of the epidemics, which had a peri-odicity of 7-8 years, coincided with high grain pricesand famine. Christophers saw this ‘human factor’ as an‘essential requirement’ which undermined the popula-tion and resulted in high death rates as a result of theepidemics (Christophers, 1911). Christophers’ sugges-tions for an early warning system were taken up by Gill(1923) who developed a system based on a set of riskindicators: epidemiological assessment of previousinfection, economic assessment of grain prices; the July-August rainfall levels; and occurrence of an epidemic
91P. Ceccato et al. - Geographical Information Systems, Remote Sensing and malaria
Fig. 5. Location of the MODIS image within the NOMADEproject.
Fig. 6. MODIS image September 2004 color compositeRGB where the SWIR channel is in red, the NIR channel ingreen and the RED channel in blue. This composition allowsthe vegetation to appear in green, the water in blue and thebare soil in brown-pink color.

92
within the last 5 years (Gill, 1923). Gill tested the sys-tem in 1921 and it went into routine operation in 1923.Retrospective reviews of the system outlined the statis-tical significance and its operational value in epidemicearly warning (Yacob and Swaroop, 1944; Swaroop,1949) but also identified the potential significance ofMay rainfall, offering a lead warning time of threemonths (Connor et al., 1999).Despite this example, much of the interest in early warn-ing systems for malaria epidemics was lost during theGlobal Malaria Control/Eradication Era (Najera, 1998).It was not until the 1990s when a number of epidemicswere reported from the East African highlands and aregional epidemic in Southern Africa stimulated renewedinterest. At its launch in 1998 the Roll Back Malaria part-nership identified Early Detection and Control ofEpidemics as one of its four key elements (RBM, 1998).RBM established a Technical Resource Network onEpidemic Prevention and Control which held its firstmeeting in Geneva in 1998. Among the recommenda-tions of the meeting was the development of a researchframework to establish Malaria Early Warning Systems(MEWS) in sub-Saharan Africa and the identification ofindicators and thresholds which could be used for earlydetection of epidemics by epidemiological surveillancesystems. The MEWS framework was developed and pub-lished in 2001 (WHO, 2001). It set out a series of activ-ities which together form the basis of an integrated mon-itoring process to identify changes in epidemic potentialand increased risk of transmission in areas prone to epi-demics (Fig. 7). A pre-requisite to MEWS is the mappingof areas prone to epidemics, either through historicalanalysis, or in combination with climatic suitability andenvironmental suitability for malaria transmission.Epidemic risk mapping should be dynamic and updatedfrequently to reflect changes in vulnerability factors.Clearly an epidemic response plan and the capacity torespond in the vulnerable areas are also essential.The first of the MEWS monitoring processes involvesconsideration of the dynamic factors which may makepopulations more vulnerable to severe epidemic out-
come. As with the Punjab model, drought, inadequatefood security and nutritional/economic status may beimportant. Increasing levels of drug or insecticideresistance, reduction in health service provision or ahigh burden of other diseases, such a HIV/AIDS, mayalso compromise any immunity and increase vulnera-bility to epidemics. While these factors are unlikely togive an indication of when an epidemic might occur,they do provide some warning of the severity that canbe expected if one does occur and is not prevented.The second MEWS monitoring process considers theforthcoming season’s climate. Will it be a drier, normal,or wetter season? What does this mean for epidemicrisk considering the recent history? A number of yearsof drought may disrupt populations, may lower immu-nity and make populations more susceptible when high-er, or even normal, rainfall levels occur. In recent yearsthere have been a number of regular regional meetings(Regional Climate Outlook Fora) where available cli-mate forecasts for the forthcoming seasons are dis-cussed, and considered by the various sectors, such asagriculture, water resources and, increasingly, health. InSeptember 2004, the first Southern African RegionalEpidemic Outlook Forum was held in Harare, Zimbabwe.The forthcoming seasons’ climate was presented and dis-cussed to develop action plans for epidemic preparednessand response in the countries that are part of theSouthern Africa Development Community (SADC)(http://www.malariajournal.com/content/3/1/37).The third MEWS process is monitoring the weather as itoccurs. Are temperatures unusual for this time of year?Is the rainfall higher than would normally be expected?The latter is now freely monitored through meteorolog-ical satellites and these are often more readily and fre-quently available than rain station data through the localmeteorological services, who often have to charge fortheir data. Considering where high rainfall, followingtwo or three years of drought occurs on a vulnerablepopulation in a desert-fringe area which has had epi-demics in the past may be one of the most realistic earlywarning systems available in many African countries.
P. Ceccato et al. - Geographical Information Systems, Remote Sensing and malaria
Fig. 7. MEWS integrated framework: gathering cumulative evidence for early and focused response (WHO, 2004).

However, the interplay of temperature with rainfall arecrucially important in highland-fringe epidemic settings,where the impact of high rainfall may increase epidemicrisk or cool the environment to levels which lower trans-mission potential. Current work is investigating thedevelopment and implementation of near-real-time tem-perature information along with rainfall as a routinelyavailable environmental monitoring product for use inthe highland-fringe epidemic settings (Fig. 8).
The fourth monitoring process is epidemiological sur-veillance. Entomological surveillance may offer valuableinsights into the vector- parasite-host dynamics and pro-vide warning of changes in epidemic risk. This is gener-ally beyond the scope of most African health services.However, the example of Desert Locust monitoring atMinistry of Agriculture level in 15 countries in Africa,Middle East and South-West Asia showed that surveil-lance is possible using simple GIS tools (Ceccato, inpress). It may be possible to establish sentinel sites inparticular locations, known to be epidemic prone and
where rapid detection and reporting is possible, and anumber of studies are attempting this. While the detec-tion of an epidemic through a rapid increase in the num-ber of cases would be the most reliable, it is unfortunatethat routine case reporting systems in sub-SaharanAfrican countries are, at present, unable to detect epi-demics in sufficient time to enable an effective response.Due to the complexity of the variables to be consideredand the remoteness of the areas affected, RS is an idealsource on which to base an early warning system formalaria epidemics. The research framework establishedby the RBM partnership provides a useful structure onwhich to base the required system. Specifically, a com-prehensive system must take into account 1) populationvulnerability, 2) the forthcoming season’s climate, 3)current weather conditions and 4) vector/parasite/hostdynamics. Ideally a country will monitor all of theseprocesses in an integrated framework, which whentaken together act as a series of compounding indica-tors which give control services sufficient confidence toprepare and act early (in accordance with their pre-for-mulated epidemic response plan) to prevent the rapidrise in cases before they occur.
Conclusions
Malaria is a deadly but preventable and curable disease.Although the environmental drivers that determine thelife cycles of both the vector, host and the Plasmodiumparasite are complex, they can be monitored and ana-lyzed using newly available technologies such as RS andGIS. Research has shown that the technological build-ing blocks are available to create an operational earlywarning system which could prevent epidemics andlimit the scale of outbreaks until such time as the dis-ease can be eradicated, as it has in Europe and the USA.A holistic early warning system must consider all of thefactors that influence the development of malaria aswell as their interactions. Rainfall, temperature, humid-ity, vegetation and seasonality in weather and climatecan all have an effect on the vector, the parasite andsusceptibility of the human to the disease. Over theyears, many tools have been developed to monitor thesefactors which are currently available. Rainfall Estimatesand Malaria Risk Analyses are available on the ADDSFEWS web page. The vectorial capacity model wasdeveloped to express malaria transmission risk and hassince been extended to enable temperature and rainfallto drive the model. Information on climate forecast andclimate anomalies is becoming more reliable withrecent scientific advances and is made availablethrough the IRI Data Library.Also to be considered in a comprehensive EarlyWarning System are the anthropogenic factors whichinfluence disease transmission. Changes in agriculturalpractices, development of urban areas and movementof populations for political and economic reasons canall help determine whether an outbreak will occur andif so, how severe it will be. The robustness of controlprocesses in countries can also, evidently, be a deter-
93P. Ceccato et al. - Geographical Information Systems, Remote Sensing and malaria
Fig. 8. Malaria incidence anomalies in Botswana related toclimate anomalies (reprinted with permission of theAmerican Society of Tropical Medicine and Hygiene, fromThomson MC, Mason SJ, Phindela T, Connor SJ, 2005. Useof rainfall and sea surface temperature monitoring forMalaria early warning in Botswana. Am J Trop Med Hyg 72:in press). Anomalies in Sea Surface Temperatures (SST)(Nino 3.4), December - February (DJF) a quadratic rainfallmodel (measured using satellite derived CMAP: ClimatePrediction Center Merged Analysis of Precipitation) for thesame months are overlaid on standardized malaria casesper 1000/population (incidence) anomalies (1982-2003;main transmission period January-May). The malaria datahas been standardized to remove non-climate relatedtrends in the data and the impact of a major policy inter-vention in 1997. There are many factors which can causechanges in malaria incidence data including changes inreporting, drug resistance and control initiatives. However,in the semi-arid areas of Africa rainfall is a major drivingforce of inter-annual variability in malaria.

94
mining factor. Effective control systems should: 1) haveaccess to forecast information on diseases outbreaksand 2) have the means and the organization required toimplement control measures. A good early warning sys-tem should take into account the effect of any strengthsor weaknesses in these areas.Research over the last three decades has shown RS tobe an efficient way to monitor many of these factorsboth on a global and regional scale. Global Monitoringand Human Health (GMHH) used a time-series ofLandsat MSS data to determine that high larval pro-ducing rice fields greened up faster and were located inareas where there was a mix of land uses. Temporal andspatial analyses in light of these two phenomena meantthat high larval-producing rice fields could be identifiedup to two months prior to peak larval production andcontrol measures, if the correct mechanisms were inplace, could be taken in time to avoid an outbreak.GMHH also showed that the proportions of two land-scape elements (unmanaged pasture and transitionalswamp) could predict village with high quantities ofadult mosquitoes, another factor which could be usedto target efficient control measures. Ongoing studies atGoddard Space Flight Center’s Health Planet Programand the Pasteur Institute of Madagascar are yieldingsimilar scientific advances. But while the successful evi-dence and the building blocks were accumulating, twofactors remained which impeded the operational use ofthe tools being developed: 1) the complexity of theinformation that needed to be considered, and 2) costof using the tools that were becoming available.Until recently, image and processing costs preventedlocal decision-makers from implementing RS decision-support systems on a large scale. More recently, com-puter processing and data storage facilities havebecome available at low cost and high spatial resolutionimages have become accessible free of charge.Processing tools are also being made available to theuser community at no cost by WHO and FAO. Thesedevelopments are paving the way toward making coun-tries more receptive to the implementation of remotesensing system. For example, a successful operationalearly warning system for Desert Locust which wasimplemented by FAO has proven the viability of imple-menting a similar system for malaria.The launch of the Roll Back Malaria partnership in1998 has also provided new impetus to the global fightagainst the disease. In 2001, an integrated frameworkwas developed which recognized the complexity of thefactors determining transmission and also serves as aconvenient framework on which to base a future EarlyWarning System. This MEWS framework establishedfour processes which must be monitored: 1) populationvulnerability, 2) the forthcoming season’s climate, 3)current weather conditions and 4) vector/parasite/hostdynamics. This integrated framework shows greatpromises to structure decision-support systems and aidin communications during implementation of responseto such a system.After 30 years of research and development to create
the capabilities to control malaria using RS technolo-gies, the pieces are finally falling into place to supportglobal implementation of such technologies. A compre-hensive and integrated Early Warning System isrequired to minimize the impact of the deadly diseaseand the barriers to implementation, namely cost anddata management capabilities are disappearing. At thisfateful moment, the Roll Back Malaria program is alsoproviding the impetus which should enable us to har-vest the fruits of many years of scientific research. Dataand good intentions alone, however, are not sufficient.Developing countries will also need assistance in theprocess of technology transfer, and in structuring theirnational information systems and decision-makingprocesses, if they are to derive full benefit from thisexceedingly powerful technology.
References
Adding D and Kauth R (1970). Estimation of sea surface temper-ature from space. Remote Sensing of Environment 1: 217-220.
Albonico M, De Giorgi F, Razanakolona J, Raveloson A,Sabatinelli G, Pietra V, Modiano D (1999). Control of epidem-ic malaria on the Highlands of Madagascar. Parassitologia41: 373-376.
Ariey F, Raharimalala L, Randrianarivelojosia M, Leon T,Rakotondramarina D, Sahondra-Harisoa JL, Rakotomalala R,Razafimahatratra JL, Migliani R, Rakotonjanabelo LA,Rabarijaona L, Jeanne I (2002). Le poids du paludisme àMadagascar. Atlas évolutif du paludisme à Madagascar. IPMEds, Antananarivo. http://www.pasteur.mg/AtlasPalu
Attaran A (2004). Where did it all wrong? Nature 430 (7002):932-933.
Barnes CM, Cibula WG (1979). Some Implications of Remote-Sensing Technology in Insect Control Programs IncludingMosquitoes. Mosquito News 39(2): 271-282.
Beck LR, Rodriguez MH, Dister SW, Rodriguez AD, RejmankvaE, Ulloa A, Meza RA, Roberts DR, Paris JF, Spanner MA,Washino RK, Hacker C, Legters LJ (1994). Remote sensingas a landscape epidemiological tool to identify villages athigh risk for malaria transmission. American Journal ofTropical Medicine and Hygiene 51(3): 271-280.
Beck LR, Rodriguez MH, Dister SW, Rodriguez AD, WashinoRK, Roberts DR, Spanner MA (1997). Assessment of aremote sensing-based model for predicting malaria transmis-sion risk in villages of Chiapas, Mexico. American Journal OfTropical Medicine And Hygiene 56(1): 99-106.
Beck LR, Lobitz BM, Wood BL (2000). Remote sensing andhuman health: New sensors and new opportunities. EmergingInfectious Diseases 6(3): 217-227.
Bouma MJ, Sorndorp HE, Van de Kaay HJ (1994). Health andclimate change. The Lancet 343: 302.
Bruce-Chwatt LJ (1991). Essential Malariology. Second Edition.Heinemann Medical Books. Ltd. London: 462 pp.
Ceccato P, Flasse S, Tarantola S, Jacquemoud S, Grégoire JM(2001). Detecting vegetation leaf water content usingreflectance in the optical domain. Remote Sensing ofEnvironment 77(1): 22-33.
Ceccato P, Gobron N, Flasse S, Pinty B, Tarantola S (2002).Designing a spectral index to estimate vegetation water con-tent from remote sensing data (Part 1: theoretical approach).Remote Sensing of Environment 82 (2-3): 188-197.
Ceccato P (in press). Operational Early Warning System UsingSPOT-VGT and TERRA-MODIS to Predict Desert LocustOutbreaks. Proceedings of the Second International SPOT-
P. Ceccato et al. - Geographical Information Systems, Remote Sensing and malaria

VEGETATION Users Conference (Editors. F. Veroustraete andE. Bartholomé), March 2004, Ghent, Belgium.
Chakraborty M, Panigrahy S, Sharma SA (1997). Discriminationof rice crop grown under different cultural practices usingtemporal ERS-1 synthetic aperture radar data. ISPRS Journalof Photogrammetry & Remote Sensing 52: 183-191.
Christophers SR (1911). Malaria in the Punjab. Scientific mem-oirs, by officers of the medical and sanitary departments ofIndia. New Series: 46-197.
Coll C, Casselles V, Sobrino JA, Valor E (1994). On the atmos-pheric dependence of the split-window equation for land sur-face temperature. International Journal of Remote Sensing15: 105-122.
Connor SJ, Thomson MC, Flasse SP, Williams JB (1995). Theuse of low-cost remote sensing and GIS for identifying andmonitoring the environmental factors associated with vector-borne disease transmission. GIS for Health and theEnvironment: 75-87.
Connor SJ, Thomson MC, Molyneux DH (1999). Forecastingand prevention of epidemic malaria: new perspectives on anold problem. Parassitologia 41: 439-448.
Connor SJ (2002). The use of Environmental InformationSystems (EIS) for malaria control in Africa. Faculty ofMedicine. University of Liverpool: 221 pp.
Connor SJ (2003). Improved knowledge on the climatic andenvironmental determinants of malaria distribution in sub-Saharan Africa: implications for improving control planningand reducing vulnerability to malaria (and other climate sen-sitive diseases) Consultancy Report DFID Malaria KnowledgeProgramme, LSTM: 94 pp.
Craig MH, Snow RW, le Sueur D (1999). A climate-based distri-bution model of malaria transmission in sub-Saharan Africa.Parasitology Today 15(3): 105-111.
DaSilva J, Garanganga B, Teveredzi V, Marx SM, Mason SJ,Connor SJ (2004). Improving epidemic malaria planning, pre-paredness and response in Southern Africa. Malaria Journal:3-37.
Dye C (1992). The analysis of parasite transmission by bloodsucking insects. Annual Review of Entomology 37: 1-19.
Eisele TP, Keating J, Swalm C, Mbogo CM, Githeko AK, RegensJL, Githure JI, Andrews L, Beier J (2003). Linking field-basedecological data with remotely sensed data using a geo-graphic information system in two malaria endemic urbanareas of Kenya. Malaria Journal 2(44): 1-17.
Fox RM (1957). Anopheles gambiae in relation to malaria andfilariasis in coastal Liberia. American Journal of TropicalMedicine and Hygiene 6: 598-620.
França GB and Cracknell AP (1994). Retrieval of land and seasurface temperature using NOAA-11 AVHRR data in north-eastern Brazil. International Journal of Remote Sensing 15:1695-1712.
Gao BC (1996). NDWI – A normalized difference water index forremote sensing of vegetation liquid water from space.Remote Sensing of Environment 58: 257-266.
Giada S, De Groeve T, Ehrlich D, Soille P (2003). Can satelliteimages provide useful information on refugee camps?International Journal of Remote Sensing 24 (22): 4249-4250.
Gill CA (1923). The prediction of malaria epidemics: with specialreference to an actual forecast in 1921. Indian Journal ofMedical Research 10: 1136-1143.
Gilles HM (1993). Epidemiology of malaria. Bruce-Chwatt’sEssential Malariology. Eds H.M. Gilles and D.A. Warrell, thirdedition, London, Arnold: 124-163 pp.
Goddard L, Mason SJ, Zebiak SE, Ropelewski CF, Basher R,Cane MA (2001). Current approaches to seasonal and inter-annual climate predictions. International Journal Climatology21 (9): 1111-1152.
Gommes R, du Guerny J, Glantz MH, Hsu L-N (2004). Climateand HIV/AIDS : A hotspots analysis for Early Warning RapidResponse Systems. Edited by Jesica White UNDP/FAO/NCAR,South-East Asia HIV and Development Programme, UNDP,Bangkok. ISBN: 974-92327-6-3: 24 p.
Gond V, Bartholomé E, Ouattara F, Nonguierma A, Bado L(2004). Monitoring and mapping of waters and wetlands inarid regions using the SPOT-4 VEGETATION imaging system.International Journal of Remote Sensing 25 (5): 987-1004.
Hay SI, Tucker CJ, Rogers DJ, Packer MJ (1996). Remotelysensed surrogates of meteorological data for the study of thedistribution and abundance of arthropod vectors of disease.Annals of Tropical Medicine and Parasitology 90(1): 1-19.
Hay SI, Omumbo JA, Craig MH, Snow RW (2000). Earth obser-vation, geographic information systems and Plasmodium fal-ciparum malaria in sub-saharan Africa. Book chapter:Remote Sensing and GIS in Public Health. Advances inParasitology. Eds. Hay, Randolph, Rogers, D. AcademicPress, 47: 173-215.
Hay SI, Were EC, Renshaw M, Noor AM, Ochola SA, OlusanmiL, Alipui N, Snow RW (2003). Forecasting, warning anddetection of malaria epidemics: a case study. Lancet361(9370): 1705-1706.
Ijumba JN, Lindsay SW (2001). Impact of irrigation on malaria inAfrica: paddies paradox. Medical and Veterinary Entomology15(1): 1-11.
Jeanne I (2000). Paludisme et schistosomoses: deux exemplesd’utilisation des SIG et de la télédétection à Madagascar.Bulletin de la Societé de Pathologie Exotique 93(3): 208-214.
Kandus P, Karszenbaum H, Pultz T, Parmuchi G, Bava J (2001).Influence of flood conditions and vegetation status on theradar backscatter of wetland ecosystems. Canadian Journalof Remote Sensing 27(6): 651-662.
Lactin DJ, Holliday NJ, Johnson DL, Craigen R (1995).Improved rate model of temperature-dependant developmentby arthropods. Environment Entomology 24: 68-75.
Lindsay SW, Wilkins HA, Zeiler HA, Daly RJ, Petrarca C, ByassP (1991). Ability of Anopheles gambiae mosquitoes to trans-mit malaria during the dry and wet seasons in an area of irri-gated rice cultivation. Journal of Tropical Medecine andHygiene 94: 313-324.
Macdonald G (1953). The analysis of malaria epidemics.Tropical Disease Bulletin 50: 871-889.
Manguin S and Boussinesq M (1999). Remote sensing in pub-lic health: applications to malaria and other diseases.Medecine Et Maladies Infectieuses 29(5) : 318-324.
Marrama L, Rajaonarivelo E, Laventure S, Rabarison P (1995).Anopheles funestus et la riziculture sur les plateaux deMadagascar. Cahiers Santé 5: 415-419.
Mayaux P, Bartholomé E, Fritz S, Belward A (2004). A new land-cover map of Africa for the year 2000. Journal ofBiogeography 31 (6): 861-877.
Milford JR and Dugdale G (1990). Estimation of rainfall usinggeostationary satellite data. In: Applications of RemoteSensing in Agriculture. Proceedings of the 48th Easter Schoolon Agriculture Science, University of Nottingham, July, 1989.Butterworth, London: 97-110.
Molesworth AM, Cuevas LE, Connor SJ, Morse AP, ThomsonMC (2003). Environmental Risk and Meningitis Epidemics inAfrica. Emerging Infectious Diseases 9: 1287-1293.
Moran MS, Clarke TR, Inoue Y, Vidal A (1994). Estimating cropwater deficit using the relation between surface-air tempera-ture and spectral vegetation index. Remote Sensing of theEnvironment 49: 246-263.
Mouchet J, Carnevale P, Coosemans M, Fontenille D,Ravaonjanahary C, Richard A, Robert V (1993). Typologie dupaludisme en Afrique. Cahiers Santé 3: 220-238.
95P. Ceccato et al. - Geographical Information Systems, Remote Sensing and malaria
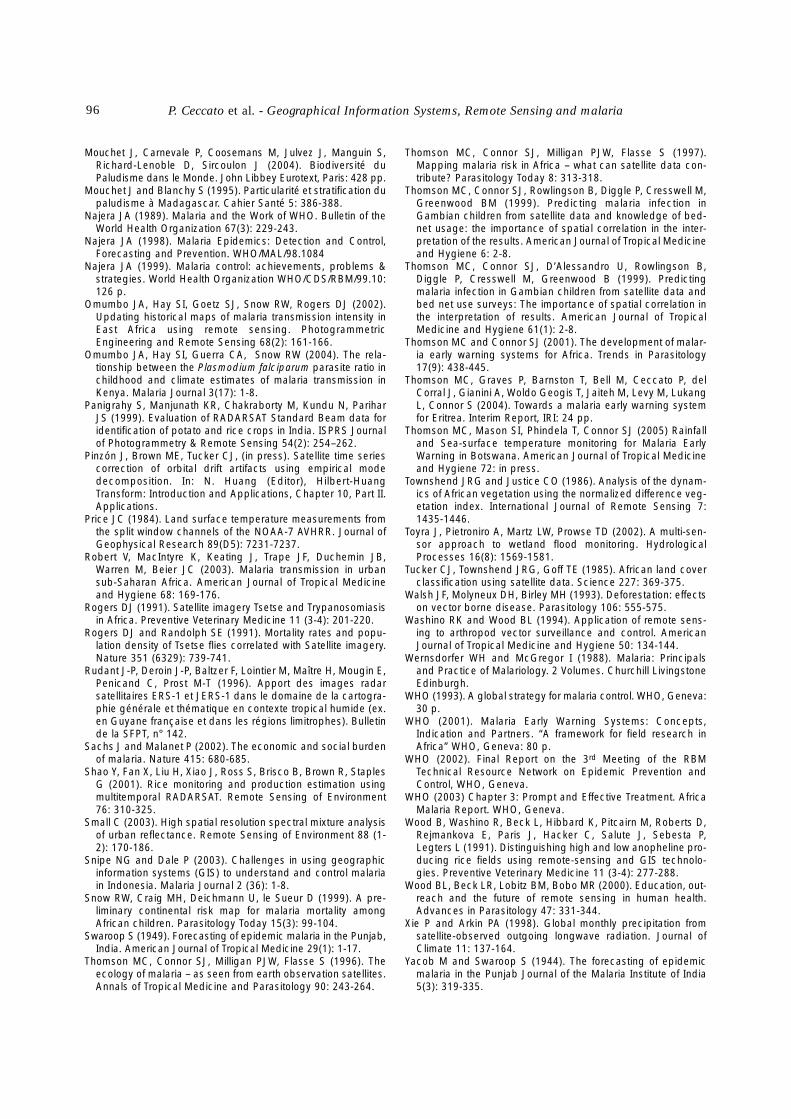
96
Mouchet J, Carnevale P, Coosemans M, Julvez J, Manguin S,Richard-Lenoble D, Sircoulon J (2004). Biodiversité duPaludisme dans le Monde. John Libbey Eurotext, Paris: 428 pp.
Mouchet J and Blanchy S (1995). Particularité et stratification dupaludisme à Madagascar. Cahier Santé 5: 386-388.
Najera JA (1989). Malaria and the Work of WHO. Bulletin of theWorld Health Organization 67(3): 229-243.
Najera JA (1998). Malaria Epidemics: Detection and Control,Forecasting and Prevention. WHO/MAL/98.1084
Najera JA (1999). Malaria control: achievements, problems &strategies. World Health Organization WHO/CDS/RBM/99.10:126 p.
Omumbo JA, Hay SI, Goetz SJ, Snow RW, Rogers DJ (2002).Updating historical maps of malaria transmission intensity inEast Africa using remote sensing. PhotogrammetricEngineering and Remote Sensing 68(2): 161-166.
Omumbo JA, Hay SI, Guerra CA, Snow RW (2004). The rela-tionship between the Plasmodium falciparum parasite ratio inchildhood and climate estimates of malaria transmission inKenya. Malaria Journal 3(17): 1-8.
Panigrahy S, Manjunath KR, Chakraborty M, Kundu N, PariharJS (1999). Evaluation of RADARSAT Standard Beam data foridentification of potato and rice crops in India. ISPRS Journalof Photogrammetry & Remote Sensing 54(2): 254–262.
Pinzón J, Brown ME, Tucker CJ, (in press). Satellite time seriescorrection of orbital drift artifacts using empirical modedecomposition. In: N. Huang (Editor), Hilbert-HuangTransform: Introduction and Applications, Chapter 10, Part II.Applications.
Price JC (1984). Land surface temperature measurements fromthe split window channels of the NOAA-7 AVHRR. Journal ofGeophysical Research 89(D5): 7231-7237.
Robert V, MacIntyre K, Keating J, Trape JF, Duchemin JB,Warren M, Beier JC (2003). Malaria transmission in urbansub-Saharan Africa. American Journal of Tropical Medicineand Hygiene 68: 169-176.
Rogers DJ (1991). Satellite imagery Tsetse and Trypanosomiasisin Africa. Preventive Veterinary Medicine 11 (3-4): 201-220.
Rogers DJ and Randolph SE (1991). Mortality rates and popu-lation density of Tsetse flies correlated with Satellite imagery.Nature 351 (6329): 739-741.
Rudant J-P, Deroin J-P, Baltzer F, Lointier M, Maître H, Mougin E,Penicand C, Prost M-T (1996). Apport des images radarsatellitaires ERS-1 et JERS-1 dans le domaine de la cartogra-phie générale et thématique en contexte tropical humide (ex.en Guyane française et dans les régions limitrophes). Bulletinde la SFPT, n° 142.
Sachs J and Malanet P (2002). The economic and social burdenof malaria. Nature 415: 680-685.
Shao Y, Fan X, Liu H, Xiao J, Ross S, Brisco B, Brown R, StaplesG (2001). Rice monitoring and production estimation usingmultitemporal RADARSAT. Remote Sensing of Environment76: 310-325.
Small C (2003). High spatial resolution spectral mixture analysisof urban reflectance. Remote Sensing of Environment 88 (1-2): 170-186.
Snipe NG and Dale P (2003). Challenges in using geographicinformation systems (GIS) to understand and control malariain Indonesia. Malaria Journal 2 (36): 1-8.
Snow RW, Craig MH, Deichmann U, le Sueur D (1999). A pre-liminary continental risk map for malaria mortality amongAfrican children. Parasitology Today 15(3): 99-104.
Swaroop S (1949). Forecasting of epidemic malaria in the Punjab,India. American Journal of Tropical Medicine 29(1): 1-17.
Thomson MC, Connor SJ, Milligan PJW, Flasse S (1996). Theecology of malaria – as seen from earth observation satellites.Annals of Tropical Medicine and Parasitology 90: 243-264.
Thomson MC, Connor SJ, Milligan PJW, Flasse S (1997).Mapping malaria risk in Africa – what can satellite data con-tribute? Parasitology Today 8: 313-318.
Thomson MC, Connor SJ, Rowlingson B, Diggle P, Cresswell M,Greenwood BM (1999). Predicting malaria infection inGambian children from satellite data and knowledge of bed-net usage: the importance of spatial correlation in the inter-pretation of the results. American Journal of Tropical Medicineand Hygiene 6: 2-8.
Thomson MC, Connor SJ, D’Alessandro U, Rowlingson B,Diggle P, Cresswell M, Greenwood B (1999). Predictingmalaria infection in Gambian children from satellite data andbed net use surveys: The importance of spatial correlation inthe interpretation of results. American Journal of TropicalMedicine and Hygiene 61(1): 2-8.
Thomson MC and Connor SJ (2001). The development of malar-ia early warning systems for Africa. Trends in Parasitology17(9): 438-445.
Thomson MC, Graves P, Barnston T, Bell M, Ceccato P, delCorral J, Gianini A, Woldo Geogis T, Jaiteh M, Levy M, LukangL, Connor S (2004). Towards a malaria early warning systemfor Eritrea. Interim Report, IRI: 24 pp.
Thomson MC, Mason SI, Phindela T, Connor SJ (2005) Rainfalland Sea-surface temperature monitoring for Malaria EarlyWarning in Botswana. American Journal of Tropical Medicineand Hygiene 72: in press.
Townshend JRG and Justice CO (1986). Analysis of the dynam-ics of African vegetation using the normalized difference veg-etation index. International Journal of Remote Sensing 7:1435-1446.
Toyra J, Pietroniro A, Martz LW, Prowse TD (2002). A multi-sen-sor approach to wetland flood monitoring. HydrologicalProcesses 16(8): 1569-1581.
Tucker CJ, Townshend JRG, Goff TE (1985). African land coverclassification using satellite data. Science 227: 369-375.
Walsh JF, Molyneux DH, Birley MH (1993). Deforestation: effectson vector borne disease. Parasitology 106: 555-575.
Washino RK and Wood BL (1994). Application of remote sens-ing to arthropod vector surveillance and control. AmericanJournal of Tropical Medicine and Hygiene 50: 134-144.
Wernsdorfer WH and McGregor I (1988). Malaria: Principalsand Practice of Malariology. 2 Volumes. Churchill LivingstoneEdinburgh.
WHO (1993). A global strategy for malaria control. WHO, Geneva:30 p.
WHO (2001). Malaria Early Warning Systems: Concepts,Indication and Partners. “A framework for field research inAfrica” WHO, Geneva: 80 p.
WHO (2002). Final Report on the 3rd Meeting of the RBMTechnical Resource Network on Epidemic Prevention andControl, WHO, Geneva.
WHO (2003) Chapter 3: Prompt and Effective Treatment. AfricaMalaria Report. WHO, Geneva.
Wood B, Washino R, Beck L, Hibbard K, Pitcairn M, Roberts D,Rejmankova E, Paris J, Hacker C, Salute J, Sebesta P,Legters L (1991). Distinguishing high and low anopheline pro-ducing rice fields using remote-sensing and GIS technolo-gies. Preventive Veterinary Medicine 11 (3-4): 277-288.
Wood BL, Beck LR, Lobitz BM, Bobo MR (2000). Education, out-reach and the future of remote sensing in human health.Advances in Parasitology 47: 331-344.
Xie P and Arkin PA (1998). Global monthly precipitation fromsatellite-observed outgoing longwave radiation. Journal ofClimate 11: 137-164.
Yacob M and Swaroop S (1944). The forecasting of epidemicmalaria in the Punjab Journal of the Malaria Institute of India5(3): 319-335.
P. Ceccato et al. - Geographical Information Systems, Remote Sensing and malaria