application of ga with svm for stock price prediction in financial ….pdf · 2020-03-31 ·...
TRANSCRIPT

International Journal of Science and Research (IJSR) ISSN (Online): 2319-7064
Impact Factor (2012): 3.358
Volume 3 Issue 10, October 2014 www.ijsr.net
Licensed Under Creative Commons Attribution CC BY
Application of GA with SVM for Stock Price Prediction in Financial Market
Om Prakash Jena1, Dr. Sudarsan Padhy2
Department of Computer Science and Applications, Utkal University Odisha, India
Abstract: Time series forecasting is receiving remarkable attention from the research community in using data mining techniques to analyze the extensive historical datasets for solving prediction problems. For such type of forecasting the indicators are required to be derived from relevant time series. In stock price forecasting in the financial sector more than 100 indicators have been developed to understand stock market behavior and thus the identification of the right indicators is a challenging problem. In such a case, optimized computer algorithms need to be investigated and applied for identifying really necessary indicators. From the various machine learning techniques available one of the technique recently investigated for time series forecasting is the Support Vector Regression (SVR) or Support Vector Machine (SVM)[7]. This study applies GA-SVM to predict the stock price index. In addition, the study also examines the feasibility of applying GA-SVM in financial forecasting by comparing it with Support Vector Machine (SVM) and case-based reasoning. The experimental results show that SVM with GA provides a more optimized and promising alternative to stock market prediction.
Keywords: SVM, GA, Prediction, Stock price 1. Introduction Machine learning methods are being used by several researchers for successfully predicting prices of financial instruments from the financial time series data of different markets. Support vector machines (SVMs) are promising methods for the prediction of financial time-series because they use a risk function consisting of the empirical error and a regularized term which is derived from the structural risk minimization principle. Excellent performances of SVR applications have been obtained during the recent decade[5][6]. These applications of the SVR for time series forecasting are based on indicators derived from relevant time series. In order to improve the prediction accuracy, one first needs to identify important indicators. However, in certain circumstances, e.g. stock price forecasting in the financial sector more than 100 indicators have been developed to understand stock market behavior and thus the identification of the right indicators is a challenging problem. In this paper, we have used GAs to choose the best inputs for forecasting SVM model from a given set of inputs These genetic algorithms offer a heuristic, population-based, evolutionary optimization method whereby defined populations evolve over generations using the Darwinian principle of survival of the fittest. GAs offers the best approach to solve optimization problems if the required characteristics are strongly present[2]. As the nature of markets in different regions are different, in this paper two machine learning techniques: Support Vector Machine Technique (SVM) and Support Vector Machine Technique with Genetic Algorithm (GA-SVM) have been used to predict futures prices traded in Indian stock market. The performances of these techniques are compared and it is observed that GA-SVM provides better performance results as compared to SVM technique. In our work optimization is achieved from GASVM application in realizing and removing the inputs that are not necessary for prediction or avoiding over fitting vulnerability that usually occurs in
models with too many parameters. It has lead to the improvement of the speed of the SVM processing and enhanced the prediction accuracy. 2. SVM for Regression Given a set of training data {(x1 , y1 ),..., (x , y )} , where each xi X Rn , (X denotes the input space of the sample) and corresponding target value yi R for i=1,…, (where l corresponds to the size of the training data), the objective of the regression problem is to determine a function that can approximate the value of y for an x not in the training set. The estimating function f is taken in the form: f (x)= (w. (x)) + b Eq(1) where wRm , b R is the bias and denotes a non-linear function from Rn to high dimensional space Rm (m > n). The objective is to find the value of w and b such that values of f (x) can be determined by minimizing the risk:
n
iregxfyLCfR
1
2)
2
1)( ,()( Eq(2)
where L is the extension of -insensitive loss function originally proposed by Vapnik and defined as:
zyzyzyL ,otherwise ,0),( Eq(3)
Introducing the slack variables i and 'i the above problem
may be reformulated as (P) Minimize
l
iiiC
1
2' )2
1)([ subject to the following
constraints yi -w. (xi) -b ≤ϵ+ iw. (xi )+ b- yi
Paper ID: OCT14145 498

International Journal of Science and Research (IJSR) ISSN (Online): 2319-7064
Impact Factor (2012): 3.358
Volume 3 Issue 10, October 2014 www.ijsr.net
Licensed Under Creative Commons Attribution CC BY
≤ϵ+ i ' , i ≥ 0 , i
' ≥ 0
for i = 1, 2,…, and where C above is an user specified constant. Solution of the above problem (P) using primal dual method. Determining the Lagrange multipliers
l
iil
ii and 1*
1 that maximizes the objective
function.
l
iiiii
l
iiii yQ
1
**
1
* )()(),(
2
1 ),())((.
1
**
1ji
l
jjjii
l
i
xxK
Subject to the following conditions:
(1)
l
iii
1
* 0)(
(2) Ci 0 , Ci *0 Eq(4)
for all i=1,2,………., where C is a user specified constant
and K: RXX is the Mercer Kernel defined by: K(x,z)=Φ(x).Φ(z) Eq(5) The solution of the primal yields
W =
l
iii
1
* )( Φ(x) Eq(6)
And b is calculated using Krush-Kuhn-Tucker (KKT) conditions
0)b)(x.(
,0)b)(x.(
i**
i
wy
wy
iii
iii
Eq(7)
0)( iiC and 0)( ** iiC
For i=1,2,3,……………….., Eq(8)
Since i , *
i =0 and *
i =0 for bCi ),,0(* can be
computed as follows:
b= )(. ii xwy for0< i <C b= )(. ii xwy
for 0<*
i <C Eq(9)
For those i and *
i for which the sxi ' corresponding to
0< i <C and
0<*
i <C are called support vectors.
Using expression for w and b in equations (6) and (7) f(x) is computed as
f(x)= bxxi
l
iii
))().(()(1
*
= bxxk i
l
iii
)),()(1
* Eq(10)
It is to be noted that we do not require function to compute f(x) which is one of the advantages of using the Kernel. 3. Genetic Algorithm Genetic algorithms (GAs) are search methods based on principles of natural selection and genetics (Fraser, 1957; Holland, 1975)[1][3]. GA encode the decision variables of a search problem into finite-length strings of alphabets of certain cardinality. The strings which are candidate solutions to the search problem are referred to as chromosomes, the alphabets are referred to as genes and the values of genes are called alleles. It consists of following steps. 1 Initialization- The initial population of candidate
solutions is usually generated randomly across the search space.
2 Evaluation- Once the population is initialized or an offspring population is created, the fitness values of the candidate solutions are evaluated.
3 Selection- Selection allocates more copies of those solutions with higher fitness values and thus imposes the survival-of-the-fittest mechanism on the candidate solutions.
4 Recombination- Recombination combines parts of two or more parental solutions to create new, possibly better solutions (i.e. offspring).
5 Mutation- While recombination operates on two or more parental chromosomes, mutation locally but randomly modifies a solution. In other words, mutation performs a random walk in the vicinity of a candidate solution.
6 Replacement- The offspring population created by selection, recombination, and mutation replaces the original parental population.
7 Repeat steps 2–6 until a terminating condition is met. The structure of SVM with GA can be figured as
Paper ID: OCT14145 499

International Journal of Science and Research (IJSR) ISSN (Online): 2319-7064
Impact Factor (2012): 3.358
Volume 3 Issue 10, October 2014 www.ijsr.net
Licensed Under Creative Commons Attribution CC BY
Figure 1: The architecture of a SVMG MODEL
Figure 2: Flow chart for Selecting Optimal Parameter By Genetic Algorithm
Paper ID: OCT14145 500
International Journal of Science and Research (IJSR) ISSN (Online): 2319-7064
Impact Factor (2012): 3.358
Volume 3 Issue 10, October 2014 www.ijsr.net
Licensed Under Creative Commons Attribution CC BY
4. Problem and Proposed Methodology Previously the Financial Time series forecasting was done by Kyoung-jae Kim of South Korea by taking SVM into consideration.[4] In the SVM some specific values of two parameter C and Ϭ were chosen. For finding the better prediction he used the values of C and Ϭ in between some range in a probabilistic manner. Here GA-SVM hybrid technique is used in order to improve the accuracy of the prediction by making an optimal choice of the parameter C and Ϭ. To set up the experiment to prove the accuracy of the prediction of our proposed methodology we have taken time series data of some Indian firms and calculated the prediction of their share prices by using SVM. Again the parameters those are used in SVM are passed in the proposed Genetic Algorithm to make the optimal values. The same data are also implemented in SVM-GA to compare the prediction accuracy of share price with SVM. 4.1 Data Sets The model of forecasting is used with the following real index futures data collected from the National Stock Exchange (NSE) of India Limited. They are S&P CNX NIFTY, S & P BSE FMCG INDEX, S&P INFOTECH 500, S & P BSE MIDCAP INDEX, and S & P BSE OIL & GAS INDEX. We have taken 650 samples for each of the futures contracts mentioned above. The time period for each contract is from 1st January, 2010 to 04 August, 2013. The data collected consists of daily previous closing price, open price, high price, low price, traded volume, and traded value. The daily closing prices are used as the data sets. Table 1 shows high price, low price, mean, median and standard deviation of the five futures prices collected for our experiment.
Table 1: Description of Data Sets
IND
EX
F
UT
UR
ES
HIG
H
LO
W
ME
AN
ME
DIA
N
SD
S&P CNX NIFTY 6312.45 2524.2 4627.85 4731.8 913.018 S&P BSE FMCG
INDEX 6202.23 2646.32 3880.67 3829.53 666.9697
S&P INFOTECH 500
6921.41 3713.8 5766.286 5755.53 426.5086
S&P BSE MIDCAP INDEX
7929.37 5073.25 6439.159 6397.05 502.5267
S&P BSE OIL & GAS INDEX
11270.45 6835.94 9250.007 9236.29 1013.173
4.2Preprocessing The first step in financial forecasting is to choose a suitable forecasting horizon. From the prediction aspect, the forecasting horizon should be short enough as the persistence of financial time series is of limited duration. A forecasting horizon of five days is a suitable choice for the daily data. The input variables are determined from four lagged RDP(relative difference in percentage of price) values based on five-day periods (RDP-5, RDP-10, RDP-15,
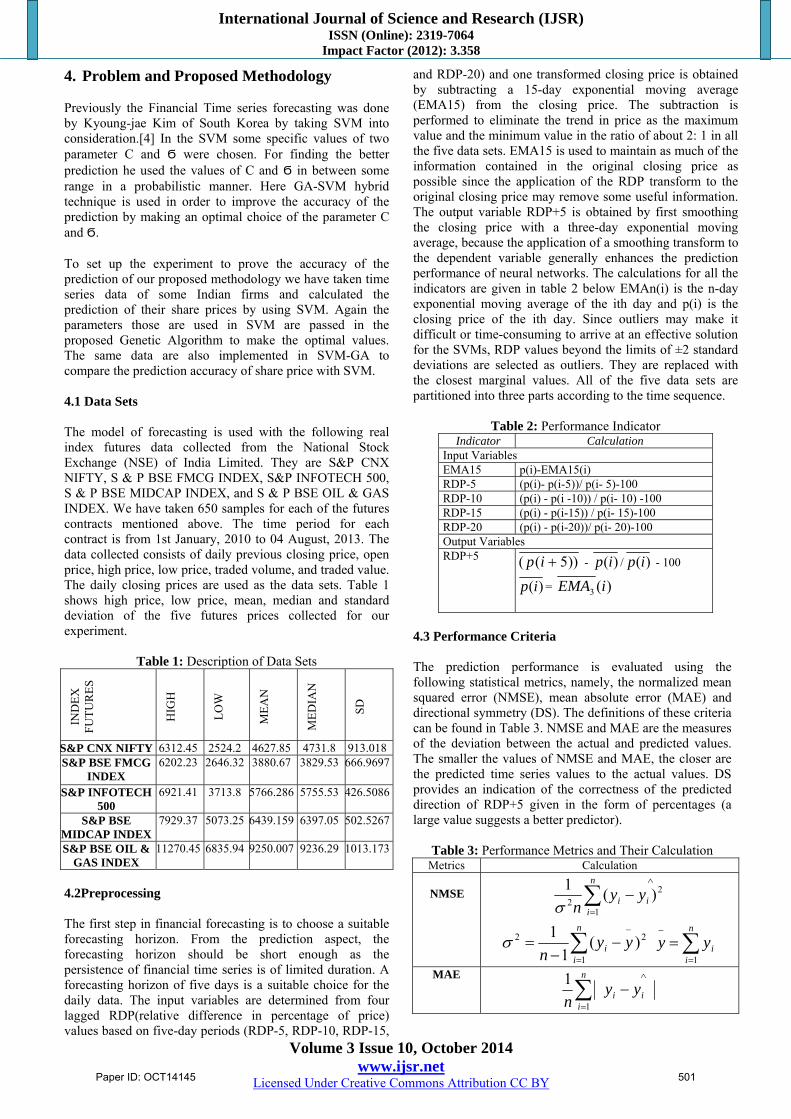
and RDP-20) and one transformed closing price is obtained by subtracting a 15-day exponential moving average (EMA15) from the closing price. The subtraction is performed to eliminate the trend in price as the maximum value and the minimum value in the ratio of about 2: 1 in all the five data sets. EMA15 is used to maintain as much of the information contained in the original closing price as possible since the application of the RDP transform to the original closing price may remove some useful information. The output variable RDP+5 is obtained by first smoothing the closing price with a three-day exponential moving average, because the application of a smoothing transform to the dependent variable generally enhances the prediction performance of neural networks. The calculations for all the indicators are given in table 2 below EMAn(i) is the n-day exponential moving average of the ith day and p(i) is the closing price of the ith day. Since outliers may make it difficult or time-consuming to arrive at an effective solution for the SVMs, RDP values beyond the limits of ±2 standard deviations are selected as outliers. They are replaced with the closest marginal values. All of the five data sets are partitioned into three parts according to the time sequence.
Table 2: Performance Indicator Indicator Calculation
Input Variables EMA15 p(i)-EMA15(i) RDP-5 (p(i)- p(i-5))/ p(i- 5)-100 RDP-10 (p(i) - p(i -10)) / p(i- 10) -100 RDP-15 (p(i) - p(i-15)) / p(i- 15)-100 RDP-20 (p(i) - p(i-20))/ p(i- 20)-100 Output Variables RDP+5 ))5(( ip - )(ip / )(ip - 100
)(ip = )(3 iEMA
4.3 Performance Criteria The prediction performance is evaluated using the following statistical metrics, namely, the normalized mean squared error (NMSE), mean absolute error (MAE) and directional symmetry (DS). The definitions of these criteria can be found in Table 3. NMSE and MAE are the measures of the deviation between the actual and predicted values. The smaller the values of NMSE and MAE, the closer are the predicted time series values to the actual values. DS provides an indication of the correctness of the predicted direction of RDP+5 given in the form of percentages (a large value suggests a better predictor).
Table 3: Performance Metrics and Their Calculation Metrics Calculation
NMSE
n
iii yy
n 1
22
)(1
n
ii yy
n 1
22 )(1
1
n
iiyy
1
MAE
n
iii yy
n 1
1
Paper ID: OCT14145 501

International Journal of Science and Research (IJSR) ISSN (Online): 2319-7064
Impact Factor (2012): 3.358
Volume 3 Issue 10, October 2014 www.ijsr.net
Licensed Under Creative Commons Attribution CC BY
DS
n
iid
n 1
100
id
0 ))((1 11
iiii yyyy
0 otherwise
Where N is the total number of data patterns. y and
y
represent the actual and predicted output value 4.4 Computation Techniques We have applied Vapnik’s SVM for regression by using LS-SVM tool box. The typical kernel functions used in SVRs
are the Polynomial Kernel dyxyxk )1 .(),( and the
Gaussian Kernel k (x, y) = exp (-(|x – y|) 2 /δ2) , where d is the degree of the polynomial kernel and δ2 is the bandwidth of the Gaussian Kernel. We have taken Gaussian Kernel function because it performs well under general smoothness assumptions. Polynomial Kernel gives inferior result compared to Gaussian Kernel and takes a longer time in training SVMs . In the SVR, those values of δ2 & epsilon are taken, that produces the best result on the validation set of our data. Again to select more optimal value of the parameter δ2 & epsilon Genetic algorithm is used as given in above diagram of the GA section so that the prediction is much more accurate.
5. Results and Discussion
After the training with Support Vector Machine Regression and Support Vector Machine with GA Regression, the forecasted price and the actual price for the test data are exhibited in the figures 3,4,5 ,6 and7.
Figure 3: Comparison of SVM and SVM-GA for S &P BSE
FMCG Index Futures Contract
Figure 4: Comparison of SVM and SVM-GA for S &P
CNX NIFTY Futures Contract
Figure 5: Comparison of SVM and SVM-GA for S &P BSE
Oil & Gas Index Futures Contract
Figure 6: Comparison of SVM and SVM-GA for S &P BSE
MIDCAP Index Futures Contract
Paper ID: OCT14145 502

International Journal of Science and Research (IJSR) ISSN (Online): 2319-7064
Impact Factor (2012): 3.358
Volume 3 Issue 10, October 2014 www.ijsr.net
Licensed Under Creative Commons Attribution CC BY
Figure 7: Comparison of SVM &SVM-GA for S &P
INFOTECH Index Futures Contract 5.1 Comparison of Results The forecasting results of the SVM and SVM-GA for the test set are collected in the table 4 which shows SVM outperforms the SVM-GA in most of the cases. SVM-GA provides a smaller NMSE and MAE and larger DS than those of SVM in most of the cases. The performance criteria set for our experiment showed a very good agreement of the predicted price with actual price when SVM-GA method is used in comparison to SVM . The NSME for all the futures stock index taken into consideration fall in the range of 0.799 to 1.173. The MAE fall in the range of 0.213 to 0.382 and the last criteria DS starts from 85.971 to 93.377.
Table 4: Comparison of the Results of SVM & SVM-GA
6. Conclusion In this research work, we have examined the feasibility of applying two machine learning models, Support Vector Machines (SVM) and Support Vector Machines with Genetic algorithm (SVM-GA) to financial time-series forecasting for the futures trading in Indian derivative markets. The proposed experiments demonstrated that: SVM-GA provide a promising alternative tool to the Support Vector Machines for financial time series
forecasting as it adopts the Structural Risk Minimization Principle, eventually leading to better generalization than that of conventional technique. For future work, we intend to optimize the kernel function, parameters and feature subset simultaneously. We would also like to expand this model to apply to instance selection problems. References
[1] Fraser, A. S., 1957, Simulation of genetic systems by
automatic digital computers.II: Effects of linkage on rates under selection, Austral. J. Biol. Sci.10:492–499.
[2] Gen, M. and Cheng, R. (2000), Genetic algorithms and engineering optimization, John Wiley, New York.
[3] Holland, J. H., 1975, Adaptation in Natural and Artificial Systems, University of Michigan Press, Ann Arbor, MI.
[4] Kyoung-jae Kim Financial time series forecasting using support vector machines , Neurocomputing 55 (2003) 307 – 319
[5] Tay FEH, Cao LJ (2001a). Application of support vector machines in financial time series forecasting. Omega, 29: 309-317.
[6] Tay FEH, Cao LJ (2001b). Improved financial time series forecasting by combining support vector machines with self-organizing feature map.Intell. Data Anal., 5: 339-354.
[7] Vapnik VN (1999). An overview of statistical learning theory. IEEE Trans Neural Networks, 10: 988-999.
Author Profile Om Prakash Jena received M.Tech in Comp Sc from Utkal University in 2013 and works as Research scholar in dept of Computer Science from 2014 in Utkal University.
Paper ID: OCT14145 503