application of fuzzy logic and clustering techniques for ... of fuzzy logic and clustering...
TRANSCRIPT

TECHNICAL PAPER
Application of Fuzzy Logic and Clustering Techniquesfor Pavement Maintenance
Amarendra Kumar Sandra1 &
Ashoke Kumar Sarkar2
Accepted: 28 September 2014 /Published online: 27 May 2015# Springer New York 2015
Abstract When a large number of pavement stretches are to be maintained, thedecision making becomes complicated and prioritization of individual stretches is notreally useful in taking maintenance management decisions. In such situations, groupingor clustering the pavement stretches having similar quantified distress characteristicswould be the practical and effective approach. Since a number of distresses areobserved on pavements and usually they are being represented in different levels ofseverity and extent, it gets rather hard to cluster them. The problem becomes furtheraggravated as the weights of various distresses also play an important role and it isdifficult to express them objectively. In this paper, a methodology has been proposed toquantify the pavement distresses and clustering the pavement stretches. The techniquehas been explained with the aid of a case study carried out in a few selected stretches inthe state of Rajasthan, India.
Keywords Pavement distresses . Pavement maintenance . Clustering and optimumnumber of clusters
Introduction
Besides construction of new highways, proper upkeep of the existing pavements isessential for the economic development of any nation. Inadequate and inappropriatemaintenance policies result in grievous financial losses in the strain of ever increasingroad user cost (RUC).With the rapid increase in the road construction activities in the less
Transp. Infrastruct. Geotech. (2015) 2:103–119DOI 10.1007/s40515-015-0021-z
* Amarendra Kumar [email protected]
Ashoke Kumar [email protected]; [email protected]
1 GMR Infrastructure Ltd.—EPC Division, GMR Hyderabad International Airport Ltd., PavementResearch Centre, Shamshabad, Hyderabad 560409, India
2 Birla Institute of Technology and Science, Pilani, Rajasthan 333031, India

developed countries, including India, the total funds required for pavementmaintenance iscontinuously increasing and is inadequate. Therefore, there is a need to develop anefficient and methodical system for maintaining the entire road network in an area tothe desired serviceability level with the available funds. Pavement Maintenance System(PMS) is an ideal tool in this kind of situation. In any PMS, prioritization of road stretcheseither individual or groupwise according to their functional condition plays a major part,especially when the funds available for road maintenance are limited [1, 6, 7, 20].
When a large number of pavement stretches are to be maintained in a certain area, itis possible that few stretches have the similar distress characteristics; hence, it isdifficult to prioritize within them. In such situations, grouping or clustering thepavement stretches having similar distress characteristics would be the practical andeffective approach. In the present study, an attempt has been made to group thepavement stretches according to the extent and severity of distresses. This helps toprioritize a group of pavement stretches instead of a single one so that maintenancemeasures could be taken accordingly.
Review of Various Clustering Techniques for Grouping of PavementStretches
Clustering is a division of data into groups of similar objects. Each group, called acluster, consists of the objects that are similar to one another and dissimilar to theobjects of the other groups [14]. Many diverse techniques have been developed in orderto discover similar groups in large data sets, out of which hierarchical and partitionaltechniques are being widely practiced [11, 16, 19].
Hierarchical algorithms create a hierarchical decomposition of the objects into eitheragglomerative (bottom-up) or divisive (top-down). On one hand, agglomerative algo-rithms start with each object number as a separate cluster by itself and in turn otherobjects merge and make a bigger cluster based on the distance between them. Theclustering process may terminate when all objects are in a single group or at any otherpoint where the user requires. On the other hand, divisive algorithms follow theopposite strategy. They start with one group of all objects and successively split groupsinto smaller ones, until each object falls into one cluster, or as desired. The hierarchicalalgorithms are highly user friendly in the sense that there is no need to specify thenumber of clusters at the outset. However, it suffers with the major limitation that it iscomputationally complicated [16, 22].
Partitional clustering algorithm constructs partitions of the data, where each clusterforms by minimization of the sum of squared distance from the mean within each cluster.The distance measure usually employed is the Euclidean distance. A close look into thehierarchical and partitional algorithms indicates very clearly that the limitations of onetechnique are being explained by another technique. Nevertheless, the partitional cluster-ing algorithm needs the number of clusters to be fixed at the beginning itself unlike in thehierarchical algorithm [16]. Though it looks to be a limitation, the flexibility is beingoffered by partitional algorithm in moving a given pattern from one cluster to anothercluster in a dynamically iterative manner. Due to this dynamism, this has been thepreferred choice by various researchers for a diversity of applications [14]. It is with thisbackground that these techniques have been used in the present research activity.
104 Transp. Infrastruct. Geotech. (2015) 2:103–119

Though a number of specific techniques have been grown within the domain ofpartitional clustering algorithm, K-means technique has been the preferred choice becauseof its ease, efficiency, and the simplest algorithms that solve most of the well-knownclustering problems [10, 12, 15, 16, 22]. K-means clustering technique was used to groupthe pavement sections based on several climate variables for studying their influence onlong-term pavement performance [24]. A combination of K-means clustering, analyticalhierarchy process, and integer liner programming was used for selecting a group of roadprojects for maintenance and rehabilitation activities [23]. However, most of the clusteringalgorithms, including K-means, require the user to set the number of clusters in advance[9, 24]. Determining the optimum number of clusters is often an ad hoc decision, based onprior knowledge, assumptions, and practical experience [9]. The problem of determiningoptimum number of clusters in a dataset has been the subject of research [8], and theoutcome is still unsatisfactory in this area [21].
After going over the clustering techniques, it has been decided to use K-meansclustering technique for grouping the pavement stretches because of its easy applica-tion, accuracy, and effective handling of a large amount of data. In all the clusteringtechniques, it is required to define the number of clusters initially and which is not acorrect way to groups the given data set; hence, an approach has been suggested todetermine the optimum number of clusters.
Case Study
Pavement Distress Parameters
Extent and severity of different pavement distress parameters affect the functional conditionof pavements. After visiting a number of road stretches as a part of reconnaissance surveyand also by interacting with the field engineers of the Public Works Department (PWD),Rajasthan, India, six different distress parameterswas identified asmajor distresses. They arecracking, raveling (disintegration of asphalt concrete surface due oxidization of asphalt, as aresult, dislodgement of aggregate particles), potholes, patching (laying asphalt concrete layeron localized failure), rutting, and edge failure. All of them were expressed in terms of threeseverity levels, namely, low, medium, and high, and their extents weremeasured. Each 1 kmlength of roadwas divided into ten stretches of 100m length. Datawas collected on stretchesrepresenting different functional classes of roads such as National Highways (NHs), StateHighways (SHs), and Major District Roads (MDRs). The severity levels of the distresseswere considered based on the studies carried out by various researchers [13, 17, 18]. Thedescriptions pavement distresses severities used in this study are shown in Table 1.
Extent of pavement distress parameters such as cracking, raveling, potholes, and patchingweremeasured in terms of area in squaremeters by encompassing distresses within a regulargeometric pattern such as square, rectangle, and triangle. The extents of rutting and edgefailures were measured in length along the longitudinal direction. A total of length 39.5 km(395 uniform sections of 100 m length) of a 3.5-m-wide lane was considered for datacollection. Sample data of pavement distress parameters collected on 20 stretches has beenpresented in Table 2. For example, in the table, Section 1, RUL 4.7 m means length of thelow severity rutting (described in Table 1) is 4.7m over length of 100m and Section 4, CL=26 m2 represents the area of cracking over a total area of 350 m2 (100×3.5 m).
Transp. Infrastruct. Geotech. (2015) 2:103–119 105

Steps Involved in Clustering the Pavement Stretches
There are three steps involved in determining the optimum number of clusters whiledeveloping a maintenance management system for a large road network involving hugeamounts of data. They are finding fuzzy prioritization values for pavement stretchesusing Fuzzy Multi Criteria Decision Approach (FMCDM), grouping of pavementstretches using clustering technique, and determination of optimum number of clustersand its validity.
Table 1 Description of flexible pavement distress severity levels
1 Cracking Low Width of the cracking is less than 3 mm
Medium Width of the cracking is greater than 3 mm and lessthan 6 mm
High Width of the cracking is greater than 6 mm
2 Potholes Low Depth of the pothole is less than 25 mm
Medium Depth of the pothole is more than 25 mm and lessthan 50 mm
High Depth of the pothole is more than 50 mm
3 Raveling Low The aggregate or binder has started to wear awaybut has not progressed significantly. The pavementappears slightly aged and somewhat rough
Medium The aggregate or binder has worn off and the surfacetexture is moderately rough and pitted. Looseparticles may be present and fine aggregate ispartially missing
High The aggregate and/or binder have worn offsignificantly, and the surface texture is deeplypitted and very rough. Fine aggregate is essentiallymissing from the surface, and pitting extends to adepth approaching half or more of the coarseaggregate size
4 Patching Low Patch has low severity distress of any type includingrutting <6 mm; pumping is not evident
Medium Patch has moderate severity distress of any typeor rutting from 6 to 12 mm; pumping is not evident
High Patch has high severity distress of any type includingrutting >12 mm, or the patch has additional differentpatch material within it; pumping may be evident
5 Rutting Low Barely noticeable, depth less than 6 mm
Medium Readily noticeable, depth more than 6 mm less than 25 mm
High Clear effect on vehicle control, depth more than 25 mm
6 Edge Failure Low Appearance of edge step with a few initial cracks on thebituminous surface along the edge portion of thecarriageway
Medium Appearance of edge step with a number of interconnectedhigh intensity cracks on the bituminous surface along theedge portion of the carriageway
High Permanent loss of part of carriageway and pothole formationalong the edge portion
106 Transp. Infrastruct. Geotech. (2015) 2:103–119

Tab
le2
Sampledatacollected
ontheentirewidth
ofthepavement
SectionNo
Criteria
CL
CM
CH
PLPM
PHRL
RM
RH
PAL
PAM
PAH
RUL
RUM
RUH
EL
EM
EH
10.00
0.00
0.00
0.60
0.88
0.00
2.47
10.01
44.81
3.20
26.91
10.10
4.7
0.0
0.0
0.78
0.00
0.00
20.00
0.00
0.00
0.27
1.05
0.00
36.07
31.07
4.05
11.18
15.64
0.00
0.0
6.8
0.0
0.63
0.00
0.00
31.71
0.00
0.00
1.47
0.14
0.00
54.00
20.00
1.43
0.00
3.43
1.71
0.0
0.0
0.0
0.00
0.00
0.00
426.00
0.00
0.00
0.31
0.00
0.00
50.00
10.00
0.00
0.00
0.00
0.00
8.4
0.0
9.0
0.29
0.00
0.00
52.00
2.00
0.00
0.71
0.71
0.21
56.00
10.00
26.00
0.00
1.71
0.00
9.4
8.1
0.0
0.57
0.00
0.00
618.00
14.00
0.00
0.50
0.06
0.00
48.00
18.00
0.00
0.00
0.00
0.00
7.5
0.0
0.0
0.17
0.00
0.00
70.00
0.00
0.00
0.29
2.14
0.35
20.00
50.00
18.00
0.00
0.00
0.00
0.0
0.0
0.0
0.00
0.00
0.00
80.00
0.00
0.00
0.14
0.21
1.33
0.00
20.21
28.87
0.00
11.43
0.00
16.9
8.1
9.0
1.71
0.00
0.00
90.00
0.00
0.00
0.00
0.00
1.91
0.00
48.00
26.00
0.00
18.00
0.00
20.6
10.8
5.0
0.20
0.00
0.00
100.00
0.00
0.00
0.29
0.86
1.86
0.00
24.57
54.00
0.00
0.06
4.00
0.0
0.0
0.0
0.00
0.00
0.00
110.00
0.00
0.00
10.29
30.63
8.14
0.00
43.14
0.00
0.00
3.00
0.00
11.3
0.0
0.0
0.00
0.00
0.00
120.00
0.00
0.00
0.34
1.42
1.08
2.00
0.00
38.00
6.00
24.86
15.00
0.0
0.0
0.0
0.00
0.00
0.00
130.00
0.00
0.00
2.52
11.86
1.66
0.00
12.29
32.00
0.00
0.86
0.00
22.5
11.5
8.0
0.00
1.26
1.00
140.00
0.00
0.00
0.86
2.77
3.21
0.00
58.00
8.00
0.00
4.00
0.00
0.0
0.0
0.0
0.43
0.51
0.00
150.00
0.00
0.00
0.17
1.34
5.05
14.00
14.00
37.14
20.00
0.00
0.00
9.4
0.0
0.0
0.46
0.00
1.37
160.00
0.00
0.00
0.26
0.79
3.63
30.00
22.00
14.00
18.00
0.00
0.00
15.0
4.1
2.0
0.57
1.71
0.00
172.00
0.00
0.00
0.43
0.00
0.00
96.00
0.00
0.00
0.00
0.00
0.00
0.0
0.0
0.0
0.00
0.00
0.00
180.00
0.00
0.00
0.09
0.73
1.76
70.00
16.14
6.14
0.00
0.00
0.00
12.2
3.4
4.0
0.00
0.00
0.00
194.00
0.00
0.00
0.31
0.14
0.00
86.17
0.00
0.00
0.00
6.00
0.00
0.0
0.0
0.0
0.00
0.00
0.00
204.00
0.00
0.00
0.57
0.71
0.00
68.00
9.00
0.00
0.14
14.21
0.00
19.7
0.0
0.0
0.00
0.00
0.00
CLlowlevelcracking(m
2),CM
mediumlevelcracking(m
2),CHhigh
levelcracking(m
2),PLlowlevelpotholes(m
2),PM
mediumlevelpothole(m
2),PHhigh
levelpotholes(m
2),
RLlowlevelraveling(m
2),RM
medium
levelraveling(m
2),RHhigh
levelraveling(m
2),PA
Llowlevelp
atching(m
2),PA
Mmedium
levelp
atching(m
2),PA
Hhigh
levelp
atching
(m2),RULlowlevelrutting(m
),RUM
medium
levelruttin
g(m
),RUHhigh
levelrutting(m
),ELlowleveledgefailu
re(m
2),EM
medium
leveledgefailu
re(m
2),EHhigh
leveledge
failu
re(m
2)
Transp. Infrastruct. Geotech. (2015) 2:103–119 107

Fuzzy Prioritization Values for Pavement Stretches
The extent and severity of pavement distresses would have a different impact on thepavement riding quality. Since it is difficult to represent distresses impact in quantifiableterms, normally they are expressed subjectively with the possibility of uncertainty andambiguity in judgment. In such situations, FMCDM approach provides an ideal option.
Pavement condition data collected on 20 sections of length 100 m each presented inTable 2 is being used for explaining the prioritization process. There are a few methodsavailable, but the one used by Bandara and Gunaratne [2] and Chen-Tung Chen [3] hasbeen used in this study for its simplicity. Pavement distresses data presented in Table 2was normalized in the scale of 0 to 100 with respect to the maximum value in the seriesthrough a simple normalization using Eq. 1.
Normalized value ¼ x jimax x ji
� �*100 ð1Þ
Where
xji is the extent of a criteria Cj of pavement section AiMax (xji) is the maximum extent value of a criteria Cj of pavement section Ai
These normalized values in the possible range between 0 and 100 thus obtainedwere given ratings between 1 and 10. The ratings were given with uniform range withthe lowest rating being 1 in the range 0–10 and the highest of 10 in the range 90–100.The ratings were then arranged in a matrix form, named as Rating Matrix (Rij)N×M asshown in Eq. 2. In the equation, each row mean pavement sections (A1, A…., AN) andeach column mean criteria or distress parameter. Rating given for distresses of thepavement stretches is presented in Table 3.
Ri j
� �N�M
¼R11 R12 ⋯ R1M
R21 R22 ⋯ R2M
⋮ ⋮ ⋯ ⋮RN1 RN2 ⋯ RNM
2664
3775 ð2Þ
Where
Rij is the real number for the pavement section Ai and criteria Cj
M is the total number of criteriaN is number of stretches
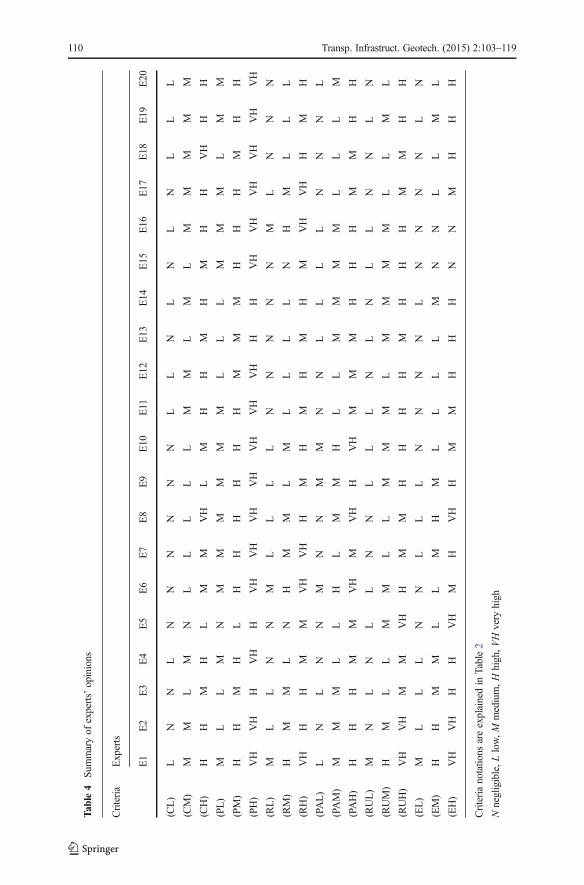
To find the weights of the distresses, the opinions of 20 experts from all over Indiacollected through questionnaire survey were utilized (Table 4). Due to the presence ofuncertainty and the weights being subjective in nature, the opinions were sought in fivelinguistic variables such as BNegligible (N)^, Blow (L)^, BMedium (M)^, BHigh (H)^,and BVery High (H)^.
These linguistic variables were converted into weights on a scale of 0 to 1 and thenwere expressed in Triangular Fuzzy Numbers (TFNs). The weights for various linguis-tic variables in terms of TFNs were decided by referring the literature for similarexamples ([2] and Chen-Tung [3]). TFNs for various linguistic variables are shown inTable 5 and also represented graphically in Fig. 1.
108 Transp. Infrastruct. Geotech. (2015) 2:103–119

The experts opinion obtained in the form of linguistic variables as presentedin Table 4 were then converted into TFNs using Table 5. To normalize thedifferences existing in expert opinion, a simple average of the fuzzy number foreach distress criteria was calculated and the corresponding weights were workedout. Fuzzy weights for all criteria can be expressed in the form of the columnmatrix as shown in Eq. 3.
eW j ¼ew1ew2
⋮ewM
26664
37775 ð3Þ
Where ew1 ; ew2 ::::::::::; ewM are the fuzzy weights for all criteria expressed in TFNs,i.e., ewj ¼ ewj1; ewj2; ewj3
� �∀ j ¼ 1; 2; 3……:M
Fuzzy prioritization value epið Þ was then calculated by multiplying the ratingmatrix with the fuzzy weight matrix and added up separately for each section,
Table 3 Rating Matrix
Where
C1 low severity cracking (CL), C2 medium severity Cracking (CM), C3 high severity cracking (CH), C4 lowseverity potholes (PL), C5 medium severity potholes (PM), C6 high severity potholes (PH), C7 low severityraveling (RL), C8 medium severity raveling (RM), C9 high severity raveling (RH), C10 low severity patching(PAL), C11 medium severity patching (PAM), C12 high severity patching (PAH), C13 low severity rutting(RUL), C14 medium severity rutting (RUM), C15 high severity rutting (RUH), C16 low severity edge failure(EL), C17 medium severity edge failure (EM), C18 high severity edge failure (EH)
Transp. Infrastruct. Geotech. (2015) 2:103–119 109
Tab
le4
Summaryof
experts’opinions
Criteria
Experts
E1
E2
E3
E4
E5
E6
E7
E8
E9
E10
E11
E12
E13
E14
E15
E16
E17
E18
E19
E20
(CL)
LN
NL
NN
NN
NN
LL
NL
NL
NL
LL
(CM)
MM
LM
NL
LL
LL
MM
LM
LM
MM
MM
(CH)
HH
MH
LM
MVH
LM
HH
MH
MH
HVH
HH
(PL)
ML
LM
NM
MM
MM
ML
LL
MM
ML
MM
(PM)
HH
MH
LH
HH
HH
HM
MM
HH
HM
HH
(PH)
VH
VH
HVH
HVH
VH
VH
VH
VH
VH
VH
HH
VH
VH
VH
VH
VH
VH
(RL)
ML
LN
NM
LL
LL
NN
NN
NM
LN
NN
(RM)
HM
ML
NH
MM
LM
LL
LL
NH
ML
LL
(RH)
VH
HH
MM
VH
VH
HM
HM
HM
HM
VH
VH
HM
H
(PAL)
LN
LN
NM
NN
MM
NN
LL
LL
NN
NL
(PAM)
MM
ML
LH
LM
MH
LL
MM
MM
LL
LM
(PAH)
HH
HM
MVH
MVH
HVH
MM
MH
HH
MM
HH
(RUL)
MN
LN
LL
NN
LL
LN
LN
LL
NN
LN
(RUM)
HM
LL
MM
LL
MM
ML
MM
MM
LL
ML
(RUH)
VH
VH
MM
VH
HM
MH
HH
HM
HH
HM
MH
H
(EL)
ML
LL
NN
LL
LN
NN
NL
NN
NN
LN
(EM)
HH
MM
LL
MH
ML
LL
LM
NN
LL
ML
(EH)
VH
VH
HH
VH
MH
VH
HM
MH
HH
NN
MH
HH
Criterianotations
areexplainedin
Table2
Nnegligible,L
low,M
medium,H
high,V
Hvery
high
110 Transp. Infrastruct. Geotech. (2015) 2:103–119

which has been shown in Table 6. This process is expressed mathematically asfollows:
ePi ¼XMj¼1
Ri j⊗ewj; ∀ i ¼ 1; 2;……:N and ∀ j ¼ 1; 2; 3……:M ð4Þ
WhereRij is the real number for the pavement section Ai and criteria Cjewj is the fuzzy weight matrix
Clustering of Pavement Stretches Using K-Means Clustering Technique
The objective of the K-means is to find the partition of the data, which minimize thesquared error or the sum of the squared distances between all the points and theirrespective cluster centers. In other words, K-means minimize the intra-cluster distance.The algorithm is composed of the following steps [14, 22]:
1. Choose K initial cluster centers.2. Assign each data point to the group that has the closest center by calculating the
distance between all the centers and the data points.3. After assigning all the data points, recalculate the positions of the K centers.4. Repeat second and third steps until the K centers will no longer move.
Fuzzy prioritization values for all the stretches which are shown in Table 6are then grouped with the help of K-means clustering technique. For this work,a suitable code was developed in MATLAB and used for clustering thepavement stretches. Flowchart for K-means clustering technique is shown inFig. 2.
Table 5 Triangular fuzzy numbers(TFNs) for linguistic variables
Linguistic variable Triangular fuzzy number
Negligible (0, 0, 0.1)
Low (0, 0.1, 0.3)
Medium (0.3, 0.5, 0.7)
High (0.7, 0.9, 1)
Very high (0.9, 1, 1)
Fig. 1 TFNs for different weights
Transp. Infrastruct. Geotech. (2015) 2:103–119 111
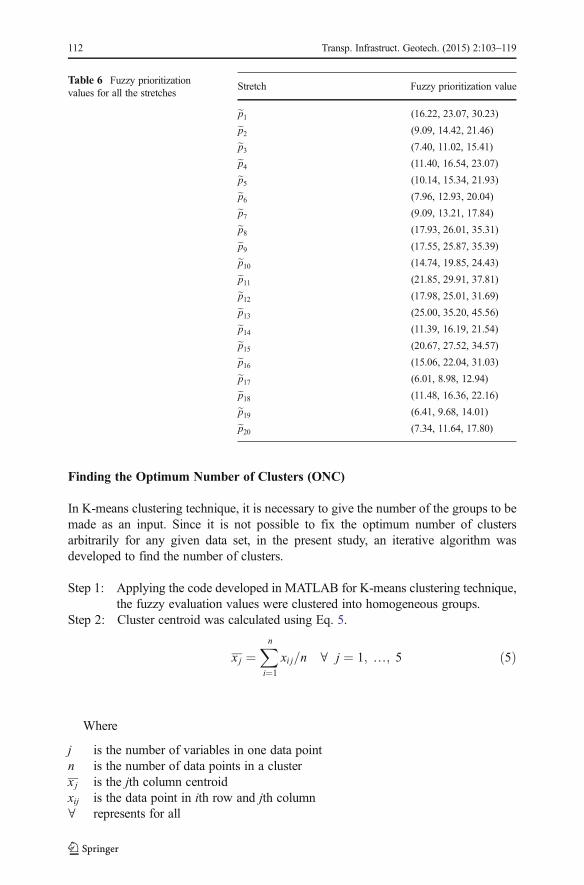
Finding the Optimum Number of Clusters (ONC)
In K-means clustering technique, it is necessary to give the number of the groups to bemade as an input. Since it is not possible to fix the optimum number of clustersarbitrarily for any given data set, in the present study, an iterative algorithm wasdeveloped to find the number of clusters.
Step 1: Applying the code developed in MATLAB for K-means clustering technique,the fuzzy evaluation values were clustered into homogeneous groups.
Step 2: Cluster centroid was calculated using Eq. 5.
x j ¼Xn
i¼1
xi j=n ∀ j ¼ 1; …; 5 ð5Þ
Where
j is the number of variables in one data pointn is the number of data points in a clusterx j is the jth column centroidxij is the data point in ith row and jth column∀ represents for all
Table 6 Fuzzy prioritizationvalues for all the stretches
Stretch Fuzzy prioritization value
ep1 (16.22, 23.07, 30.23)
ep2 (9.09, 14.42, 21.46)
ep3 (7.40, 11.02, 15.41)
ep4 (11.40, 16.54, 23.07)
ep5 (10.14, 15.34, 21.93)
ep6 (7.96, 12.93, 20.04)
ep7 (9.09, 13.21, 17.84)
ep8 (17.93, 26.01, 35.31)
ep9 (17.55, 25.87, 35.39)
ep10 (14.74, 19.85, 24.43)
ep11 (21.85, 29.91, 37.81)
ep12 (17.98, 25.01, 31.69)
ep13 (25.00, 35.20, 45.56)
ep14 (11.39, 16.19, 21.54)
ep15 (20.67, 27.52, 34.57)
ep16 (15.06, 22.04, 31.03)
ep17 (6.01, 8.98, 12.94)
ep18 (11.48, 16.36, 22.16)
ep19 (6.41, 9.68, 14.01)
ep20 (7.34, 11.64, 17.80)
112 Transp. Infrastruct. Geotech. (2015) 2:103–119

Step 3: For all the individual clusters in a cluster group, the distance between datapoints and its cluster centroid (also known as intra-cluster distance) wascomputed using Eq. 6.
Di ¼ffiffiffiffiffiffiffiffiffiffiffiffiffiffiffiffiffiffiffiffiffiffiffiffiffiXn
i¼1
ðxi j−x jÞ2vuut ∀ i ¼ 1;…; n and ∀ j ¼ 1;…; 5 ð6Þ
Where Di is the distance of ith row in a cluster from its centroid and theremaining parameters are as explained in Eq. 5.
Step 4: The average of all the distances from each data point and itscorresponding cluster centroid was computed for all the individualclusters in a chosen cluster group using Eq. 7. Further, the weight-ed averages of the distances of the each cluster group were
Yes
No
Start
Determination of the Centroid Distance
Select Number of Clusters
Are the objects are still moving from one
to other Group
Determination of distance between objects and Centroid
Grouping the objects based on Minimum distance
EndFig. 2 Flow chart for K-means clustering technique
Transp. Infrastruct. Geotech. (2015) 2:103–119 113

calculated using Eq. 8. The outcome of this exercise is presented inTable 7.
Dk ¼ 1
n
Xn
i¼1
Di ∀k ¼ 1;…; K and ∀n ¼ 1;…; K ð7ÞWhere
K is the total number of clusters in a cluster groupk is the individual cluster number in a cluster groupn is the total number of data points in individual cluster
KWA ¼
XKk¼1
Dk*nk
XKk¼1
nk
ð8Þ
Where
KWA is the weighted average distance of the cluster group
Step 5: A graph was plotted between weighted average distances of all the clustergroups and the number of cluster groups as shown in Fig. 3. It has been notedthat the weighted average distance decreases as the number of the clustersincreases.
The optimum number of clusters is observed to be the point where the increase in thenumber of clusters does not result in any appreciable reduction in the distances. It may beobserved from Fig. 3 that the distance of cluster groups rapidly decrease up to number fiveand then the gradient of the curve becomes comparatively flat and there is not much change
Table 7 Distances and weighted average distances of different cluster group
Numberof clustergroups
Number of data points in each cluster (average of distances of the data points from their respectivecluster centers)
1 2 3 4 5 6 7 Weighted averagedistance of clustergroup
1 20 (12.15) 12.15
2 8 (5.36) 12 (4.67) 4.946
3 3 (5.12) 6 (3.85) 11 (4.21) 4.238
4 7 (3.71) 1 (0.00) 5 (2.39) 7 (2.40) 2.736
5 3 (1.70) 4 (2.57) 5 (2.39) 7 (2.40) 1 (0.00) 2.2
6 3 (1.70) 1 (0.00) 4 (2.00) 4 (2.57) 7 (2.27) 1 (0.00) 1.96
7 2 (0.87) 1 (0.00) 4 (2.00) 7 (2.27) 4 (2.04) 1 (0.00) 1 (0.00) 1.8
114 Transp. Infrastruct. Geotech. (2015) 2:103–119

in the value from 6 to 7 and further. Thus, ONC in this may be considered to be six. Asample calculation to determine the weighted average distance of cluster group has beenshown in the Appendix.
Validation of the Optimum Number of Clusters
Though an algorithm has been developed and presented for finding the ONC, it wasdecided to cross-check its acceptability through the existing cluster validity techniques.Popular techniques viz. Dunn’s and Davies-Bouldin indices, as detailed in the follow-ing paragraphs, were chosen for validation.
Dunn’s Validity Index This technique [5, 16] is based on the idea of identifying thecluster sets that are compact and well separated. The main goal of Dunn’s validity indexis to maximize the inter-cluster distances (i.e., separation) while minimizing intra-cluster distances (i.e., increase compactness). The Dunn’s validation index (DV) canbe computed using Eq. 9. The number of clusters, which maximizes the DV, isconsidered as the ONC.
DV ¼ mink¼1;::::;K
minl¼kþ1;::::K
d ck ; clð Þmaxa¼1;…;K
d0cað Þ� �
8<:
9=;
8<:
9=; ð9Þ
Where
d(ck, cl) is the distance between clusters ck and cl in the cluster groupd′(ca) is diameter of the clusters in the cluster group aK is the number of clusters in a group
Davies-Bouldin Validity Index This index [4, 16] is a function of the ratio of the sumof intra-cluster scatter to inter-cluster separation. The ratio is small if the clusters arecompact and far from each other. Consequently, Davies-Bouldin index (DB) will have asmall value for ONC. The DB index can be computed using Eq. 10.
DB ¼ 1
K
XKk¼1
maxl¼1;::::;K
k≠l
d0ckð Þ þ d
0clð Þ
d ck ; clð Þ� �
ð10Þ
Fig. 3 Plot between number of cluster group and weighted average distance of cluster group
Transp. Infrastruct. Geotech. (2015) 2:103–119 115

All the parameters are as explained in Eq. 9.Using Eqs. 9 and 10, DVand DB values have been calculated for a different number
of clusters and presented in Table 8.It can be observed that the Dunn’s index gives maximum value at six numbers of clusters
while the DB index, which functions based onminimization criteria, also provides the ONCas six. It can be recalled here that the ONC obtained from the algorithm used in the presentstudy was also six. Hence, it was decided that the optimum number of clusters for the dataconsidered is ‘six’ and the technique proposed to find the ONC is acceptable.
Utility of Clustering in Pavement Maintenance Decision
The clusters may be prioritized for making decision on pavement maintenance man-agement. In a road network, each cluster may contain a large number of stretches, and itmay be necessary to cluster them further. The methodology suggested in this paper maybe applied for this purpose. This will help to prioritize clusters with small andmanageable number of pavement stretches.
Conclusions
& For a huge road network, it is necessary to cluster the pavements having similar distresscharacteristics for effective decision making in pavement management system.
& Level of discomfort to the road users by pavement distresses places an important rolein identifying the sections which needs prior attention. Since it is difficult to representthem in quantifiable terms, usually they are expressed subjectively with the possibilityof uncertainty. In such situations, FMCDM approach provides an ideal option.
& The approach suggested in clustering of a large number of pavement stretches into amanageable number of clusters is an ideal option for stagewise maintenance ofpavement stretches depending on the funds available.
Appendix
Calculation of Weighted Average Distance of Cluster Groups
In the present study, a total of 20 pavement stretches were considered as an example ofclustering. As discussed in BFinding the Optimum Number of Clusters (ONC)^ section,
Table 8 Dunn’s and DB validityindices
Number of clusters Dunn’s index DB index
2 1.70 0.93
3 0.94 1.33
4 1.69 0.72
5 1.32 0.65
6 2.29 0.49
7 1.94 0.56
116 Transp. Infrastruct. Geotech. (2015) 2:103–119

based on the fuzzy prioritization, values of all 20 stretches were clustered into homo-geneous groups using K-means clustering technique. The following steps explain thecalculation of weighted average distance when data points were made into two groups.The same procedure has been followed for more number of groups also.
Step 1: A total of 20 stretches were clustered into two groups. Out of the 20 datapoints eight are falling in first group as presented in Table 9 and 12 are fallingin second group as shown in Table 10.
Step 2: Cluster centroid (average of the data points in the column) and the intra-cluster distance (distance from the centroid to data point) was calculatedusing the expression given in Eq. 6. Cluster centroid and intra-cluster dis-tances are also appended in the respective tables.
Step 3: Average of each cluster group (average of all intra cluster distances)
Table 9 Data points in first groupSample number Fuzzy evaluation values Intra-cluster
distance
1 16.215 23.07 30.23 6.825564
2 17.93 26.01 35.305 1.370885
3 17.545 25.865 35.385 1.776309
4 21.845 29.91 37.81 4.933227
5 17.98 25.01 31.69 4.077818
6 25 35.2 45.56 14.60829
7 20.665 27.52 34.565 1.885166
8 15.06 22.035 31.03 7.480824
Cluster centroid 19.03 26.8275 35.19688
Table 10 Data points in secondgroup
Sample number Fuzzy evaluation values Intra-clusterdistance
1 9.085 14.415 21.455 2.170685
2 7.4 11.02 15.41 5.249276
3 11.395 16.54 23.065 5.001045
4 10.135 15.34 21.925 3.05412
5 7.96 12.925 20.04 1.798006
6 9.085 13.205 17.84 1.688328
7 14.735 19.845 24.43 9.510686
8 11.385 16.185 21.54 3.776937
9 6.01 8.98 12.935 8.739572
10 11.475 16.36 22.16 4.307206
11 6.405 9.675 14.005 7.414167
12 7.335 11.635 17.8 3.385122
Cluster centroid 9.367083 13.84375 19.38375
Transp. Infrastruct. Geotech. (2015) 2:103–119 117

has been calculated. First group and second group averages are 5.36and 4.67, respectively.
Step 4: Weighted average of the clustered group ((8*5.36+12*4.67)/20=4.94) hasbeen calculated using the expression given in Eq. 8.
References
1. Alsugair, A.M., Al-Qudrah, A.A.: Artificial neural network approach for pavement maintenance. J.Comput. Civ. Eng. ASCE 4(4), 249–255 (1998)
2. Bandara, N., Gunaratne, M.: Current and future pavement maintenance prioritization based on rapid visualcondition evaluation. J. Transp. Eng. ASCE 127(2), 116–123 (2001)
3. Chen, C.-T.: A fuzzy approach to select the location of the distribution center. Fuzzy Set. Syst. 118, 65–73(2001)
4. Davies, D.L., Bouldin, D.W.: A cluster separation measure. IEEE Trans. Pattern Anal. Mach. Intell. 1(2),224–227 (1979)
5. Dunn, J.C.: Well separated clusters and optimal fuzzy partitions. J. Cybern. 4, 95–104 (1974)6. Farhan, J., Fwa, T.: Incorporating priority preferences into pavement maintenance programming. J.
Transp. Eng. 138(6), 714–722 (2012)7. Fwa, T.F., Tan, C.Y., Chan, W.T.: Road-maintenance planning using genetic algorithms. II: analysis. J.
Transp. Eng. ASCE 120(5), 710–722 (1994)8. Halkidi, M., Batistakis, Y., Vazirgianni, M.: On clustering validation techniques. J. Intell. Inf. Syst. 17(2–
3), 107–145 (2001)9. Hamerly, G.J., Elkan, C.: Learning the K in K-Means. Department of Computer Science and Engineering,
University of California, San Diego (2003). http://books.nips.cc/papers/files/nips16/NIPS2003_AA36.pdf10. Hamerly, G.J.: Learning structure and concepts in data through data clustering. PhD thesis submitted to
Department of Computer Science, University of California, San Diego. (http://cs.baylor.edu/~hamerly/papers/thesis.pdf) (2003)
11. Han, J. and Kamber, M.: Data mining: concepts and techniques, second edition, Elsevier, MorganKaufmann Publishers. (http://www.cs.uiuc.edu/homes/hanj/bk2/toc.pdf) (2006)
12. Ilampiray, P.: Efficient resource utilization of web using data clustering and association rule mining. J.Theor. Appl. Inf. Technol. 37(2), 211–216 (2012)
13. IRC-82: Code practice for maintenance of bituminous surfaces of highways. Indian Road Congress, NewDelhi (1982)
14. Jain, A.K., Murthy, M.N., Flynn, P.J.: Data clustering: a review. ACM Comput. Surv. 31(3), 264–323(1999)
15. Jayanta, B.: Online adaptive hierarchical clustering in a decision tree framework. J. Pattern Recognit. Res.2, 201–229 (2011)
16. Mahamed G. H. O.: Particle swarm optimization methods for pattern recognition and image processing.PhD thesis submitted to Faculty of Engineering, Built Environment and Information Technology,University of Pretoria, Pretoria. (http://upetd.up.ac.za/thesis/available/etd-02172005-110834/unrestricted/00front.pdf) (2005)
17. Miller, J.S and William. Y.B.: Distress identification manual for long-term pavement performanceprogram. Report submitted to Office of Infrastructure Research and Development, Federal HighwayAdministration, Publication No.FHWA-RD-03-031. http://www.fhwa.dot.gov/publications/research/infrastructure/pavements/ltpp/reports/03031/03031.pdf) (2003)
18. NCHRP: Automated pavement distress collection techniques, National Cooperative Highway ResearchProgram, Synthesis 334. Transportation Research Board, Washington D.C. (2004) http://onlinepubs.trb.org/onlinepubs/nchrp/nchrp_syn_334.pdf
19. Pradeep, R. and Subha, S.: A survey of clustering techniques. Int. J. Comput. Appl. (0975–8887) Vol. 7—No.12, (2010)
20. Reddy, B.B. and Veeraragavan: Priority ranking model for managing flexible pavements at network level.Technical paper published in 62nd Annual Session of Indian Roads Congress (IRC), 8th–11th January,Kochi, India. (http://mail.mahapwd.com/technicalpapers/Volume%20623/paperno478.htm) (2002)
118 Transp. Infrastruct. Geotech. (2015) 2:103–119

21. Rosenberger, C., Chehdi, K.: Unsupervised clustering methods with optimal estimation of the number ofclusters: application to image segmentation. Proc. Int. Conf. Pattern Recog. 1, 1656–1659 (2002)
22. Turi, R.H.: Clustering based colour image segmentation. PhD thesis submitted to Monash University,Australia. (http://www.csse.monash.edu.au/~roset/thesis/thesis.pdf). (2001)
23. Wu, Z. and Flirtsch, C.W.: Optimal selection of pavement maintenance and rehabilitation programme; 7thInternational Conference on Managing Pavement assets, June 24–28, 2008, Calgary, Alberta. (http://pavementmanagement.org/ICMPfiles/2008098.pdf). (2008)
24. Yuhong, W.: Improving pavements with long-term pavement performance: products for today andtomorrow. Federal Highway Publication, Report No. FHWA-RD-03-049.(http://www.fhwa.dot.gov/publications/research/infrastructure/pavements/ltpp/03049/paper5.cfm). (2005)
Transp. Infrastruct. Geotech. (2015) 2:103–119 119