application of fishbein multi attribute model in analysing
TRANSCRIPT

Application of Fishbein Multi – Attribute Model in Analysing
Difference in Consumer Attitude Towards Selective Apparel
Brands in Bangalore
Abstract – The Indian apparel retail industry is swayed mostly by the preference of the
millennials as they are profoundly brand conscious, daily exposed to different advertisements,
their preference for a better standard of living and they possess ample disposable income with
them. With the presence of the various international and national brands in India their choices
of preference have increased and so did the competition among them. Some apparel brands
have become quite popular and many companies have set up their stores all over Bangalore
which makes it convenient and easily accessible for them to buy products of their preferred
brands from various retail outlets. Apparel brands must understand this and be congenial with
the latest market trends to compete in the market. Levi’s, Lee, Wrangler and Flying Machine
were selected for the study. This study is to explore the consumers’ attitude and their beliefs
towards selected apparel brands, to understand why a consumer prefers a particular brand using
the Multi-attribute Fishbein model, it also tries to explore the salient features of consumers’
attitude that they look out for regarding the apparel brands in Bangalore among price, quality,
design and variety. A structured questionnaire survey was conducted on 152 consumers for
their opinion on their beliefs and the evaluation on those beliefs. The Fishbein model evaluates
the attitude of the consumers towards the selected apparel brands based on their salient beliefs
to identify the most preferable brand contemplated in the study. A t-test was conducted to make
a paired comparison of the distinct attributes which are considered for the study among the
various selected brands to make a conclusion about the prevalent brand.
Keywords: Attitude, beliefs, Apparel brands, Multi-attribute Fishbein model, t-test.
Arshad Khan
Student
Ramaiah Institute of Management,
MS Ramaiah Nagar,
Bangalore.
Prof Mallieswari R
Assistant Professor
Ramaiah Institute of Management,
MS Ramaiah Nagar,
Bangalore.
Mukt Shabd Journal
Volume IX, Issue IX, SEPTEMBER/2020
ISSN NO : 2347-3150
Page No : 324
I. Introduction
In order to evaluate an attitude, it is very important to know why a consumer prefers a particular
brand. The present study is an attempt to understand the consumers’ attitude towards selective
apparel brands in Bangalore it also tries to explore the salient features of consumers’ attitude
that they look out for regarding the apparel brands in Bangalore among price, quality, design
and variety. The retail industry space demand is expected to increase at the rate of 81% and is
expected to include 39 million Sq ft of space by the end of 2022, of which 71% will be in
around the metro cities and tier-I cities. With the incoming of International brands in India it
has led to increase in competition with the Indian retailers. International brands are trying to
make an impact in the Indian market by penetrating in various cities across India. The organised
retail segment is growing at a steady rate of 19%.
Efforts which are made by the Financial Institutions from banking to non-banking sectors have
enabled consumers to purchase goods from the retailers with easy credit or loan options and
simple payment schemes. With the introduction of Goods and Service Tax (GST) as a form of
a single unified tax system four tax slabs at 5%, 12%, 18% and 28% for different types of items
has made a positive impact by lowering the indirect tax, improving the supply chain efficiency,
and effortless input tax credit.
Investments made through FDI has played a major role in the Indian retail sector, it has brought
global multi-national brands to our doorstep. It has brought growth in the economy, created job
opportunities, benefitted the consumers with quality products, in all FDI has opened up new
avenues for growth in the retail sector.
The Indian retail industry has emerged as one of the most dynamic and fast-moving industries
which is mainly cause due to the entry of several new upcoming players in the market. Retailing
in India contributes an account of over 10% of the country’s Gross Domestic Product (GDP)
and fulfils around 8% of the employment in the country. The Indian retail market which is
growing at a fast paced rate to reach US$1.1 trillion by 2020, while the modern retail market
in India is expected to double in its size over the next few years. The retail sector in India is
highly dominated by the unorganized retail sector, where it forms around 93% of the overall
trade that happens. This is in comparison with the developed countries where the organised
retail sector accounts for almost 80% of the total retail trade that occurs. This highlights a lot
of scope for further significant growth of the organized retail sector in India.
Mukt Shabd Journal
Volume IX, Issue IX, SEPTEMBER/2020
ISSN NO : 2347-3150
Page No : 325

The sector can be broadly classified into two parts, firstly Value retailing, it is typically a low
margin-high volume business which mostly consists of food and groceries and Lifestyle
retailing, a high margin-low volume business which consists of apparels, footwear, etc. The
sector is further sub classified into various categories, depending on the types of products
offered.
A change from the traditional retail sector to organised retail sector is taking place because of
the changing consumers’ due to the growing middle class, their expectations, higher disposable
income, preference for goods which are luxurious, changing demographic mix, etc. This is
further magnified with the convenience of shopping on online stores through online shopping,
multiple brands and choices coming under single roof, and due to the increase of mall culture,
etc. These factors are driving the organized retail growth in India in the long run.
The online retail is growing at a very fast pace and in India online retailing is expected to be at
more profitable with the physical stores in the upcoming years, which is driven by robust
investment and the increasing number of internet users in the country.
The retail market in India is expected to have a growth rate of 12% per annum, which is driven
by the growing urbanization, rising income of the population, younger demographics of the
people and rising aspirations of the people who belong to the middle class. Modern trade is
expanding twice as fast at 20% per annum and traditional trade is growing at 10%.
Indian apparel industry is currently undergoing a rapid change which is shaping out to become
an important part of the global supply chain. India is one among the few of the countries that
owns the complete supply chain through proximity from its diverse fibres to the large markets
and this supply chain does provide more than 70% of its production to the domestic market,
and is highly capable to offer a high variety of products and its applications.
II. Literature Review
In this study we have explored the relationship between beliefs and the evaluation of
various attributes which helps to find the attitude towards a product or a brand. The Fishbein
model is one among the most influencing Multi-attribute model which was developed in the
year 1967 considers the various attributes to evaluate the attitude, Tabassum and Rahman
(2012) analysed how the Fishbein model can be helpful in understanding the consumer
attitude towards fast food restaurants in Bangladesh. No previous comparative study was
Mukt Shabd Journal
Volume IX, Issue IX, SEPTEMBER/2020
ISSN NO : 2347-3150
Page No : 326

conducted using the multi-attribute attitude model, which measures the consumers’ attitude
in terms of salient beliefs. To fulfil this objective, based on a pretest on a small sample
conducted before the actual survey four restaurants namely Pizza hut, KFC, Helvetia and
Western Grill were selected and four attributes quality, price, quick service and environment
of the restaurant associated with every restaurant was evaluated based on the belief and the
attitude evaluation the overall attitude was found for every restaurant and it was found that
the respondents had different attitudes towards the restaurants another objective was to
compare the restaurants based on the attributes a paired comparison was conducted and the
signifying factors were evaluated. Similarly in an another study by Pratima Singh (2014)
which focused on the difference in beliefs and consumers’ attitude towards fast food
restaurants namely Domino’s, pizza hut and McDonalds in Gwalior by using survey method
(n=60). Various attributes such as the atmosphere, food quality, pricing and quick service
were considered to calculate the overall attitude on the restaurants and then a paired
comparative study was conducted among the restaurants based on those attributes the
Fishbein model was considered for the study to evaluate the overall attitude and to compare
the attributes among the restaurants a t-test was conducted with the mean pairs of the
attributes of the restaurants.
Sandip Sarker (2012) had conducted a study on the Financial Institutions and compared
the private and nationalized banks in Bangladesh to calculate the attitude of the customers
based on the various attributes using the Fishbein model which included the ATM booth
service, service charges, smooth service, reliability, credibility, hospitality etc. Mandeep
Kaur (2014) mainly focused on the customers behaviour towards apparel stores in Tier-1
and Tier- II cities in India to study the effect of on the buying behaviour towards organised
apparel stores, 30 attributes based on the price, colour, size, fabric type, quality etc were
considered for the study respondents were questioned about their buying behaviour. To
compare the attitude of the consumers’ from Tier I and Tier II cities a t-test was carried out
to compare their mean scores, priorly a Levene test of homogeneity of variance was also
applied to determine the suitability of t-test and to determine difference among the
respondents from both the categories. Fishbein model states that attitude of consumers’
leads to their buying behaviour.
Alsamydai (2015) analysed about individual’s attitudes on sent messages through
electronic communication means and the effect of these messages on individual attitudes.
The study included many attitudes which are considered in the sent messages through
different electronic communication means to determine the individual’s assessment for
Mukt Shabd Journal
Volume IX, Issue IX, SEPTEMBER/2020
ISSN NO : 2347-3150
Page No : 327

these elements and their importance, it also considered the belief aspect which is involved
in sending messages through twitter, Facebook, websites, mobile phones and e-mail for the
assessing these individual attitudes towards them and the effect of each means of
communication on individual attitude. Various attributes towards mobiles phone messages
were considered in the study which include the content, interactive, subjectivity,
dependency, credibility, understanding, interest, attractiveness, communication, flexibility,
convection and response. The main objective of the study was to understand the consumers’
attitude towards messages sent through various electronic communication mediums, also to
determine the consumers’ attitudes towards the sent messages by business organizations.
The study model included four dimensions: the first dimension was the evaluation which
includes the importance of attribute of the sent messages through electronic communication
means. The second dimension is based on the belief aspect evaluating on how far the
properties are available in electronic communication, the third dimension measures
individual attitudes and their value towards these messages and the fourth dimension focuses
on the effect of these media messages on individual attitudes.
The Fishbein model is used because it is based on the theory of creation and change of
the attitude, and that how attitude plays and important role in accepting or rejecting an
attribute, in this study it is used for measuring the attitudes to determine the consumers
attitude towards the messages of the electronic communication and the impact of these
messages that they have on these attitudes.
In a study conducted by M Rupesh Kumar (2016) analysed the factors influencing the
shoppers preference in selecting Multi-Brand Outlet were analysed in selecting a category
among three retail categories were considered such as staying with the same MBO or to
move from one MBO to another or to shift to an MBO from an Exclusive Brand Outlet
(EBO). Nine attributes and their subsets which defy a stores image which were merchandise
(assortment, quality and selection), service (sale-person, returns, self-service, delivery and
credit policy), physical facilities (elevators, lighting, air-conditioning and washroom
facilities), clientele (social class, self-image, congruency and store personnel), convenience
(location and parking facilities), promotion (sales promotion, advertising and displays),
outlet atmosphere (feeling of warmth and acceptance), institutional factors (reputation,
conservative or modern) and post-transaction satisfaction (return and adjustment policies by
the outlets). To analyse the data Kendall’s (W) coefficient of concordance is used to identify
the extent of similarity among respondents who stay with the same MBO. Adi Nugraha
(2017), made an analysis of consumers’ attitude using Fishbein Multi-attribute approach
Mukt Shabd Journal
Volume IX, Issue IX, SEPTEMBER/2020
ISSN NO : 2347-3150
Page No : 328

was used through descriptive method in the study a questionnaire on 405 samples on popular
smartphones operating systems such as Blackberry, Android and iOS in Bandung
(Indonesia). Subjective norm variable that was used in this study were mostly expert, family,
friends, media and sellers.
Jasuli (2018) in a study analysed how the students attitudes towards e-learning using
Fishbein Multi-attribute approach which was used to determine the attributes that were
considered to be dominant by the students in using e-learning. Non-probability sampling
with a sample of 100 respondents through a questionnaire. A semantic differential scale was
used in the questionnaire. The various factors or attributes attached to e-learning which were
considered in the study were non-linearity, self-managing, feedback interactivity,
multimedia learners, just in time, dynamic updating, easy accessibility and collaborative
learning. A validity test and reliability test was used for data analysis, the validity test is
used to know whether it already measured the right concept and reliability with the
consistency and stability of the measurement. Art Shala (2018) focused mainly on the e-
retailing service quality attributes and its effects in brand loyalty in e-commerce platforms,
the four attributes considered for this study of service quality were website design,
reliability/fulfilment, security or privacy and consumer service and their affects towards the
brand loyalty which is measured through the consumers’ intention to repurchase the same
brand on upcoming occasions and consumers’ incentives to pay a premium price for the
brand, when they are faced with a local and a global brand. In a study by Zobi Khan (2019)
an analysis of the influence of apparel/clothing brands through social media marketing
activities (SMMA) on brand equity and consumer response was analysed through a survey
on 406 respondents who use the apparel brand on various attributes such as brands
awareness, brand image, price premium willingness, consumer loyalty.
III. Methodology
Applied research is used in this study which intends to identify the selected apparel brands to
explore the salient beliefs and to find its evaluation regarding selected apparel brands. The
sampling plan included consumers’ who were users of the apparel brands in Bangalore. The
target population comprised of regular consumers’ of the apparel brands. A sample size of 152
respondents were taken in the survey based on convenience sampling. The primary source of
data was collected through a questionnaire and secondary sources of data were collected
through research papers, websites and journals.
Mukt Shabd Journal
Volume IX, Issue IX, SEPTEMBER/2020
ISSN NO : 2347-3150
Page No : 329

The Indian retail apparel industry has a potential of growth so it is important to understand the
consumers’ attitudes towards their preferred apparel brands in Bangalore. There are various
attributes through which a consumer perceives about a brand, this study intents to evaluate
those attributes and the major influencing factors among them through the Fishbein Multi-
attribute model. This model will help to represent different attributes and their beliefs and
evaluation through a linear equation.
The study aims to understand the perception of the consumers’ on different apparel brands their
beliefs and attitudes on those brands before the purchase and after their purchase. It also reveals
the factors that influence the consumers’ on their buying behaviour and preference. Various
attributes of the selected apparel brands are considered for the study.
The objectives of the study are:
To measure the consumers’ attitude towards well known apparel brands.
To distinguish between imperative values associated with apparel brands.
To explore the evaluation to beliefs regarding apparel brands.
The statistical testing has been performed using the tools: Fishbein Multi-Attribute Model
and t-test. A consumers’ attitude towards any particular product or an object (A0), the belief
that the product has certain benefits, value, or features termed as attributes which is the
result of his prior knowledge before acquiring the product through various sources or
advertisements, word-of mouth, social media influence, etc. (Bi), and the consumers’
evaluations based on these attributes which could be positive or negative after acquiring the
product (Ei).
Symbolically, it is represented as:
𝐴0 =∑𝐵𝑖𝐸𝑖
𝑛
𝑖=1
Graphs and charts (Bar Graph, Pie charts) were drawn in order to perform better analysis of
the subject. The present study has certain limitations like, the study is bounded only for the
residents of Bengaluru and confined to selected apparel brands.
Mukt Shabd Journal
Volume IX, Issue IX, SEPTEMBER/2020
ISSN NO : 2347-3150
Page No : 330
IV. Results
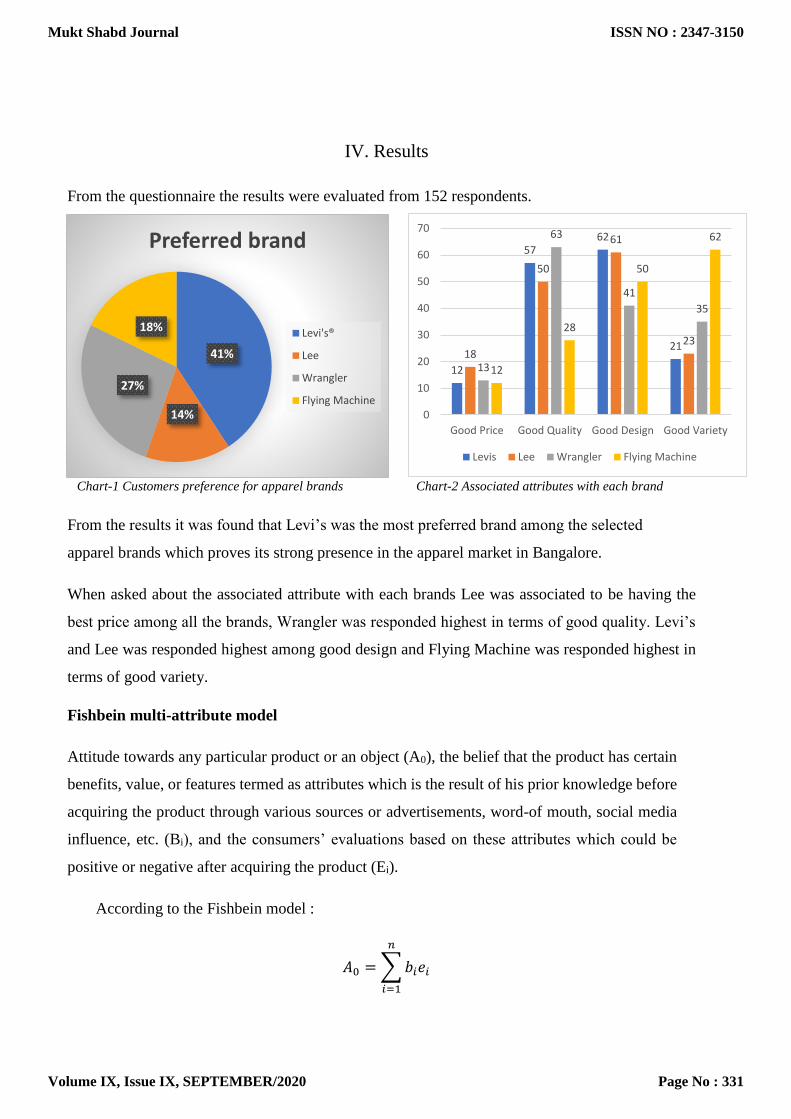
From the questionnaire the results were evaluated from 152 respondents.
Chart-1 Customers preference for apparel brands Chart-2 Associated attributes with each brand
From the results it was found that Levi’s was the most preferred brand among the selected
apparel brands which proves its strong presence in the apparel market in Bangalore.
When asked about the associated attribute with each brands Lee was associated to be having the
best price among all the brands, Wrangler was responded highest in terms of good quality. Levi’s
and Lee was responded highest among good design and Flying Machine was responded highest in
terms of good variety.
Fishbein multi-attribute model
Attitude towards any particular product or an object (A0), the belief that the product has certain
benefits, value, or features termed as attributes which is the result of his prior knowledge before
acquiring the product through various sources or advertisements, word-of mouth, social media
influence, etc. (Bi), and the consumers’ evaluations based on these attributes which could be
positive or negative after acquiring the product (Ei).
According to the Fishbein model :
𝐴0 =∑𝑏𝑖𝑒𝑖
𝑛
𝑖=1
41%
14%
27%
18%
Preferred brand
Levi's®
Lee
Wrangler
Flying Machine
12
5762
2118
50
61
23
13
63
41
35
12
28
50
62
0
10
20
30
40
50
60
70
Good Price Good Quality Good Design Good Variety
Levis Lee Wrangler Flying Machine
Mukt Shabd Journal
Volume IX, Issue IX, SEPTEMBER/2020
ISSN NO : 2347-3150
Page No : 331

Where,
A0 = Attitude towards the object
bi = The strength of the believe the object has attribute i
ei = The evaluation object i
n = number of salient beliefs about the object
Salient belief and belief evaluation based on price(p), quality(q), design(d) and variety(v) to
evaluate the overall attitude towards the apparel brands.
Attitude Towards Levi’s®
ALevi’s® = (bp×ep) + (bq×eq)+(bd×ed)+(bv×ev)
ALevi’s® = (12.23) + (14.38) + (12.67) + (12.72)
ALevi’s® = 52
Attitude towards Lee
ALee = (bp×ep) + (bq×eq)+(bd×ed)+(bv×ev)
ALee = (12.70) + (13.58) + (12.51) + (11.50)
ALee = 50.29
Attitude towards Wrangler
AWrangler= (bp×ep) + (bq×eq)+(bd×ed)+(bv×ev)
AWrangler = (13.16) + (14.47) + (13.02) + (13.06)
AWrangler = 53.71
Attitude Towards Flying Machine
AFlying Machine = (bp×ep) + (bq×eq)+(bd×ed)+(bv×ev)
AFlying Machine = (12.42) + (13.61) + (12.65) + (13.24)
Mukt Shabd Journal
Volume IX, Issue IX, SEPTEMBER/2020
ISSN NO : 2347-3150
Page No : 332
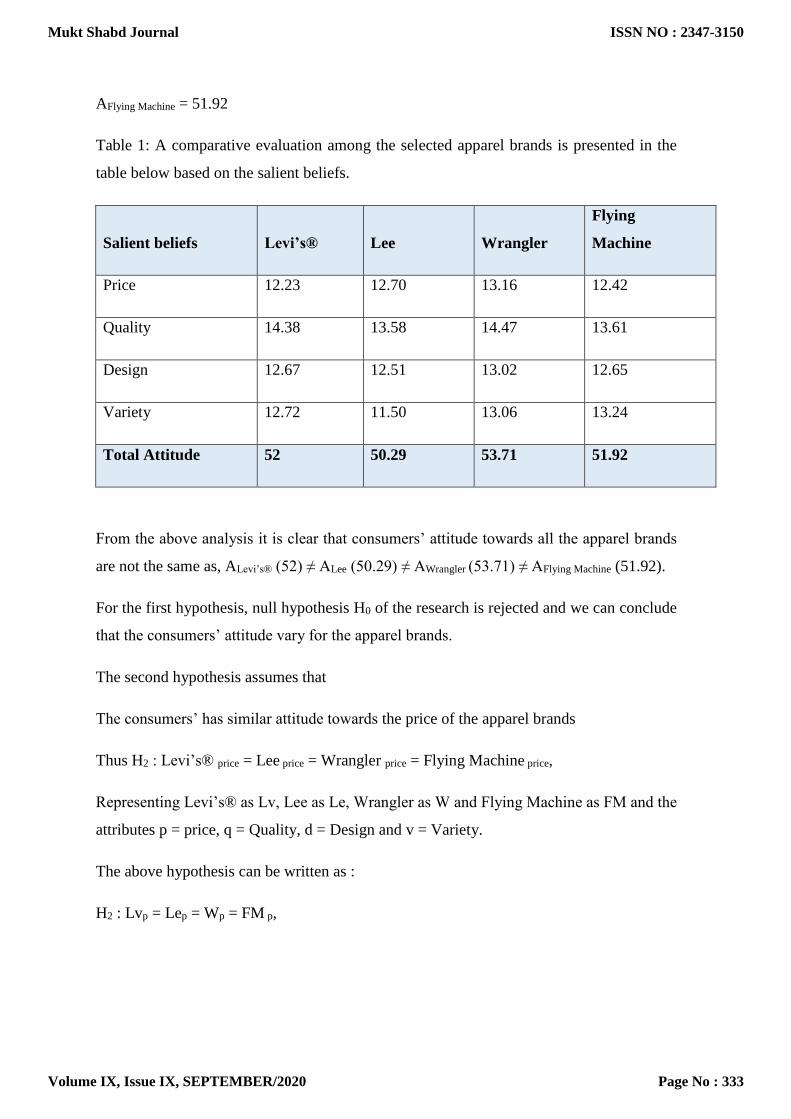
AFlying Machine = 51.92
Table 1: A comparative evaluation among the selected apparel brands is presented in the
table below based on the salient beliefs.
Salient beliefs Levi’s® Lee Wrangler
Flying
Machine
Price 12.23 12.70 13.16 12.42
Quality 14.38 13.58 14.47 13.61
Design 12.67 12.51 13.02 12.65
Variety 12.72 11.50 13.06 13.24
Total Attitude 52 50.29 53.71 51.92
From the above analysis it is clear that consumers’ attitude towards all the apparel brands
are not the same as, ALevi’s® (52) ≠ ALee (50.29) ≠ AWrangler (53.71) ≠ AFlying Machine (51.92).
For the first hypothesis, null hypothesis H0 of the research is rejected and we can conclude
that the consumers’ attitude vary for the apparel brands.
The second hypothesis assumes that
The consumers’ has similar attitude towards the price of the apparel brands
Thus H2 : Levi’s® price = Lee price = Wrangler price = Flying Machine price,
Representing Levi’s® as Lv, Lee as Le, Wrangler as W and Flying Machine as FM and the
attributes p = price, q = Quality, d = Design and v = Variety.
The above hypothesis can be written as :
H2 : Lvp = Lep = Wp = FM p,
Mukt Shabd Journal
Volume IX, Issue IX, SEPTEMBER/2020
ISSN NO : 2347-3150
Page No : 333

The hypothesis can be broken based on paired comparison technique
H2a : Lvp = Lep
H2b : Lvp = Wp
H2c : Lvp = FMp
H2d : Lep = Wp
H2e : Lep = FMp
H2f : Wp = FMp
Similarly, The third hypothesis assumes that
The consumers’ has similar attitude towards the quality of the apparel brands
Thus H3 : Levi’s® quality = Lee quality = Wrangler quality = Flying Machine quality,
Representing Levi’s® as Lv, Lee as Le, Wrangler as W and Flying Machine as FM.
The above hypothesis can be written as :
H3 : Lvq = Leq = Wq = FM q,
The hypothesis can be broken based on paired comparison technique
H3a : Lvq = Leq
H3b : Lvq = Wq
H3c : Lvq = FMq
H3d : Leq = Wq
H3e : Leq = FMq
H3f : Wq = FMq
Mukt Shabd Journal
Volume IX, Issue IX, SEPTEMBER/2020
ISSN NO : 2347-3150
Page No : 334
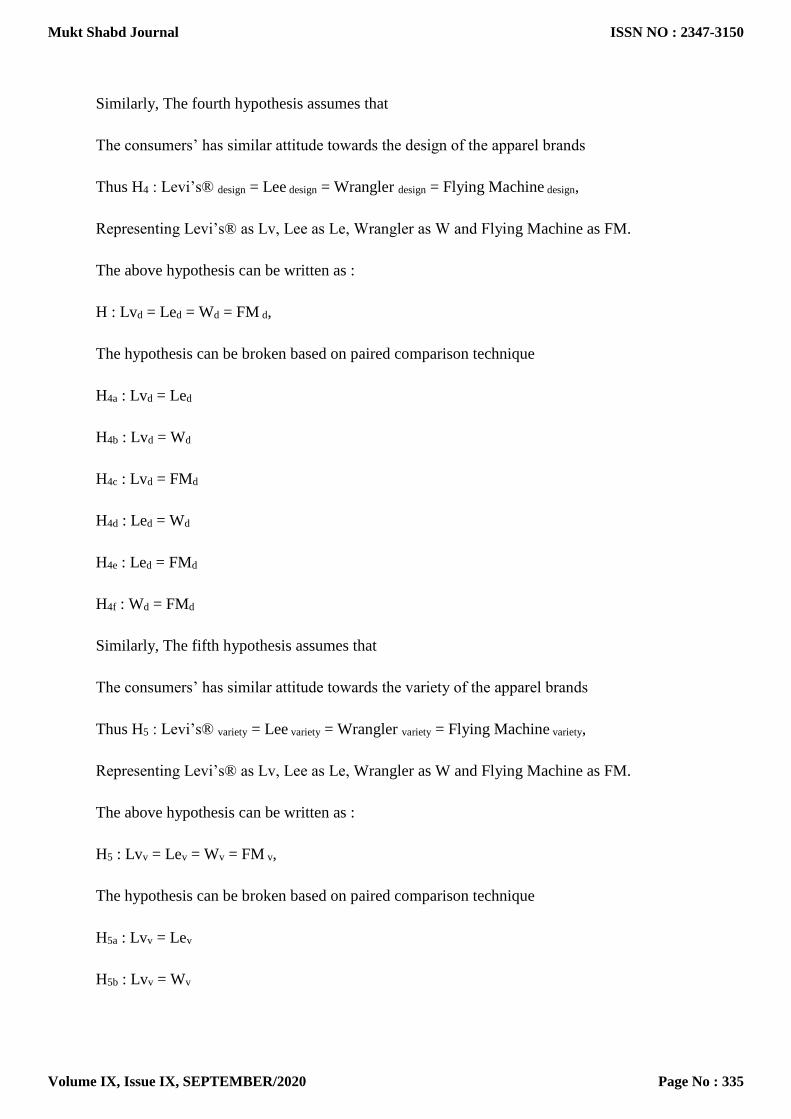
Similarly, The fourth hypothesis assumes that
The consumers’ has similar attitude towards the design of the apparel brands
Thus H4 : Levi’s® design = Lee design = Wrangler design = Flying Machine design,
Representing Levi’s® as Lv, Lee as Le, Wrangler as W and Flying Machine as FM.
The above hypothesis can be written as :
H : Lvd = Led = Wd = FM d,
The hypothesis can be broken based on paired comparison technique
H4a : Lvd = Led
H4b : Lvd = Wd
H4c : Lvd = FMd
H4d : Led = Wd
H4e : Led = FMd
H4f : Wd = FMd
Similarly, The fifth hypothesis assumes that
The consumers’ has similar attitude towards the variety of the apparel brands
Thus H5 : Levi’s® variety = Lee variety = Wrangler variety = Flying Machine variety,
Representing Levi’s® as Lv, Lee as Le, Wrangler as W and Flying Machine as FM.
The above hypothesis can be written as :
H5 : Lvv = Lev = Wv = FM v,
The hypothesis can be broken based on paired comparison technique
H5a : Lvv = Lev
H5b : Lvv = Wv
Mukt Shabd Journal
Volume IX, Issue IX, SEPTEMBER/2020
ISSN NO : 2347-3150
Page No : 335

H5c : Lvv = FMv
H5d : Lev = Wv
H5e : Lev = FMv
H5f : Wv = FMv
Paired evaluation of apparel brands:
Table 2: Paired Comparison and Hypothesis testing for Attitude about Price.
Pairs t-test Sig. (2-
tailed) Decisions
Pair 1 Lv vs Le -2.5 0.2422 H1aO : Accepted
Pair 2 Lv vs W -3.5 0.0163 H1bO : Rejected
Pair 3 Lv vs Fm -0.636 0.6392 H1cO : Accepted
Pair 4 Le vs W -2.714 0.0277 H1dO : Rejected
Pair 5 Le vs FM 4.333 0.1444 H1eO : Accepted
Pair 6 W vs FM 3.2 0.1928 H1fO : Accepted
After the paired comparison and the t-test conducted, significant differences were found
among the pairs Levi’s and Wrangler( Pair 2) and Lee and wrangler ( Pair 4) in terms of
attitude of the price, since p-value was less than 0.05, H1bO and H1dO (Null hypothesis) is
rejected. No significant differences were found in other pairs. Hence, we conclude that
consumers’ have a similar attitude of price towards the other pairs.
Table 3: Paired comparison of hypothesis testing for attitude about quality:
Pairs t-test Sig. (2-
tailed) Decisions
Pair 1 Lv vs Le 0.5 0.7048 H2aO : Accepted
Mukt Shabd Journal
Volume IX, Issue IX, SEPTEMBER/2020
ISSN NO : 2347-3150
Page No : 336
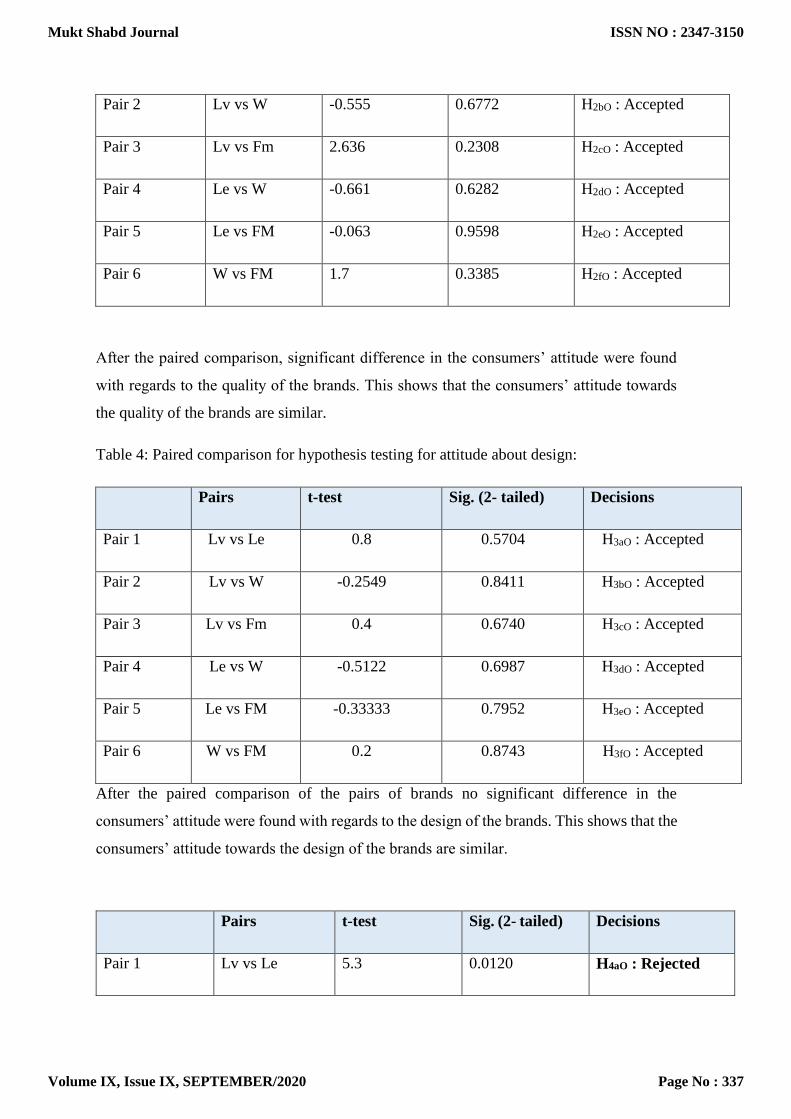
Pair 2 Lv vs W -0.555 0.6772 H2bO : Accepted
Pair 3 Lv vs Fm 2.636 0.2308 H2cO : Accepted
Pair 4 Le vs W -0.661 0.6282 H2dO : Accepted
Pair 5 Le vs FM -0.063 0.9598 H2eO : Accepted
Pair 6 W vs FM 1.7 0.3385 H2fO : Accepted
After the paired comparison, significant difference in the consumers’ attitude were found
with regards to the quality of the brands. This shows that the consumers’ attitude towards
the quality of the brands are similar.
Table 4: Paired comparison for hypothesis testing for attitude about design:
Pairs t-test Sig. (2- tailed) Decisions
Pair 1 Lv vs Le 0.8 0.5704 H3aO : Accepted
Pair 2 Lv vs W -0.2549 0.8411 H3bO : Accepted
Pair 3 Lv vs Fm 0.4 0.6740 H3cO : Accepted
Pair 4 Le vs W -0.5122 0.6987 H3dO : Accepted
Pair 5 Le vs FM -0.33333 0.7952 H3eO : Accepted
Pair 6 W vs FM 0.2 0.8743 H3fO : Accepted
After the paired comparison of the pairs of brands no significant difference in the
consumers’ attitude were found with regards to the design of the brands. This shows that the
consumers’ attitude towards the design of the brands are similar.
Pairs t-test Sig. (2- tailed) Decisions
Pair 1 Lv vs Le 5.3 0.0120 H4aO : Rejected
Mukt Shabd Journal
Volume IX, Issue IX, SEPTEMBER/2020
ISSN NO : 2347-3150
Page No : 337

Table 5: Paired comparison for hypothesis testing for attitude about variety:
After the paired comparison and t-test conducted it was found that significant difference in
the consumers’ attitude with regards to the variety of the pairs between Levi’s and Lee (Pair
1) was found, hence H4aO (Null hypothesis) is rejected and no other significant difference
was found for the other pairs hence it was accepted.
V. Discussions and Analysis
As found from the analysis and responses Lee was associated with good price, wrangler was
associated with good quality, Levi’s and Lee were associated with good design and Flying
Machine was associated with good variety of its products. The consumers’ attitude towards
Wrangler is the highest, the consumers’ attitude towards Levi’s is second highest closely
followed by Flying Machine, Lee had the least attitude calculated through the consumers’
beliefs and their evaluation using the Fishbein Model. It was found that most of the
respondents had a similar attitude when their belief before the purchase was considered and
the evaluation they had after purchasing the brand. Their evaluation of the brands had
increased in most of the cases when compared to their beliefs of the product before
purchasing it. Significant differences were found in the attitude of the respondents when
Levi’s was compared with Wrangler and Levi’s was compared with Wrangler based on their
prices. Significant differences were found in the attitude of the respondents when Levi’s
was compared with Lee in terms of their variety.
The consumers have a similar attitude towards the brands hence Levi’s, Lee, Wrangler and
Flying Machine should develop a unique selling proposition (USP) that differentiates them
from each other. The brands must try to bring in a budget friendly range of products because
most of the consumers preferred price as an influencing factor in their purchase.
Pair 2 Lv vs W -0.882 0.5397 H4bO : Accepted
Pair 3 Lv vs Fm -0.571 0.6695 H4cO : Accepted
Pair 4 Le vs W -3.777 0.164.7 H4dO : Accepted
Pair 5 Le vs FM -1.790 0.3242 H4eO : Accepted
Pair 6 W vs FM -0.36 0.7800 H4fO : Accepted
Mukt Shabd Journal
Volume IX, Issue IX, SEPTEMBER/2020
ISSN NO : 2347-3150
Page No : 338

Brands must improve their brands image since its plays a motivating factor to form their beliefs
about a product. Wrangler and Flying Machine must try to reduce their pricing. Flying Machine
should improve the quality of their products. Wrangler should improve their design. Levi’s,
Lee and Wrangler must improve the variety of their products.
VI. Conclusion
With this study we can conclude that the retail apparel sector has been growing
exponentially in India. More and more brands are making their presence in the Indian
market. The brands considered in this study have a similar attitude among the consumers’.
The respondents beliefs were slightly lower towards the factors such as price, quality, design
and variety before the purchase of the product but after the purchase the evaluation of the
brands had improved which suggests that the consumers’ are satisfied with the brands after
purchasing it. Lee’s evaluation about their product was poor after consumers’ purchased it
as most of the respondents evaluated its quality after the purchase poor quality. Lee was
associated as having the attribute of good price, Wrangler was associated as having good
quality, Levi’s and Lee were associated with having good design and Wrangler was
associated of having good variety among all the other brands. We can also conclude that
price, quality, design and variety aren’t the only factors which for a consumers evaluation,
beliefs of the products or brand formed from advertisements, word-of-mouth, social media,
etc are also contributing factors for the consumers.
VIII. References
1. Adi Nugraha1, Dini Turipanam Alamanda (2014), Telkom University, Bandung,
Indonesia Analysis of Consumer Attitude Using Fishbein Multi-Attribute Approach
(Case Study Popular Smartphones in Bandung) Telkom University, Bandung,
Indonesia
2. Ajzen, I & Fishbein, M 1980, Understanding Attitudes and Predicting Social Behavior,
Prentice Hall, New Jersey.
3. Art Shala (2018), Study on the service quality e-retailing variables affecting brand
loyalty, , Marketing Department, University Kadri Zeka, Gjilan, Kosovo Review Of
Innovation And Competitiveness VOLUME 4 ISSUE 4-2018
4. Ayesha, Tabassum and Rahman, Tasnuva. (2012). Differences in Consumer Attitude
towards Selective Fast Food Restaurants in Bangladesh: An Implication of Multi-
Mukt Shabd Journal
Volume IX, Issue IX, SEPTEMBER/2020
ISSN NO : 2347-3150
Page No : 339

attribute Attitude Model. World Review of Business Research, 2: (3). Vol. 2. No. 3.
May 2012. Pp. 12 – 27
5. Fishbein, M & Ajzen, I 1981, Belief, Attitudes, Intention and Behavior‟, in AA
Mitchell and JC Olson, Are Product Attributes the Only Mediator of Advertising
Effects on Brand Attitude? Journal of Marketing Research, pp. 318-332.
6. ISSN(P): 2249-6939; ISSN(E): 2249-8044, Vol . 5, Issue 2, Apr 2015, 1-18
7. Jasuli (2018), Analysis of student attitudes towards e-learning using Fishbein Multi-
attribute approach The Consortium of Asia-Pacific Education Universities (CAPEU)
IOP Publishing IOP Conf. Series: Materials Science and Engineering 296 (2018)
012011 doi:10.1088/1757-899X/296/1/012011, Review Of Innovation And
Competitiveness Volume 4- Issue 4- 2018
8. Lewis, CR 1981, Restaurant advertising: Appeals and consumer intentions‟, Journal of
Advertisement Research, vol. 21, no. 5, pp. 69–74.
9. M Rupesh Kumar* and A G V Narayanan (2016), Store Choice: Understanding the
Shoppers’ Preference in Selecting an Apparel Multi-Brand Outlet. The IUP Journal of
Marketing Management, Vol. XV, No. 1, 2016
10. Mahmood Jasim Alsamydai, Husam Mustafa Alnaimi & Dima Mousa Dajani (2015),
using Fishbein model to measure individual’s attitudes Toward electronic
communication means, international journal of sales & marketing management
research and development (ijsmmrd)
11. Mandeep Kaur* and Deepak Devgan (2014), Consumer Behaviour towards Organized
Apparel Stores in India : An Empirical Study of Tier I and Tier II Cities ASCI Journal
of Management 43 (2): 52-67 Copyright © 2014
12. Pratima Singh (2014), Difference in Beliefs, Consumer Attitudes towards Fast Food
Restaurants in Gwalior Region, International Journal of Scientific Engineering and
Research (IJSER), ISSN : 2347-3878, Impact Factor (2014): 3.05, Volume 3 Issue 5,
May 2015
13. SandipSarker1, TarunKanti Bose 2 and Arifuz Zaman Khan3 (2012), A comparison
between private commercial banks and nationalized commercial banks in Bangladesh
with implications of Fishbein model.” International Journal of Managing Value and
Supply Chains (IJMVSC) Vol. 3, No. 4, December 2012
DOI:10.5121/ijmvsc.2012.3402 13
Mukt Shabd Journal
Volume IX, Issue IX, SEPTEMBER/2020
ISSN NO : 2347-3150
Page No : 340

14. Turley, LW & Milliman, RE 2000, Atmospheric Effects on Shopping Behavior: A
Review of the Experimental Evidence‟, Journal of Business Research, vol. 49, no. 2,
pp. 193-211.
15. Zobi Khan 1, Yongzhong Yang 1,*, Mohsin Shafi 2 and Ruo Yang 1 (2019), Role of
Social Media Marketing Activities (SMMAs) in Apparel Brands Consumer Response:
A Moderated Mediation Analysis, Sustainability 2019, 11, 5167;
doi:10.3390/su11195167
Mukt Shabd Journal
Volume IX, Issue IX, SEPTEMBER/2020
ISSN NO : 2347-3150
Page No : 341