application of experimental design for the characterisation of a novel elution system for...
TRANSCRIPT

Journal of Chromatography A, 855 (1999) 91–109www.elsevier.com/ locate /chroma
Application of experimental design for the characterisation of anovel elution system for high-capacity anion chromatography with
suppressed conductivity detectiona a,b ,*Michael Nowak , Andreas Seubert
aUniversity of Hannover, Institute of Inorganic Chemistry, Callinstrasse 9, D-30167 Hannover, GermanybUniversity of Kassel, FB 19 Biology and Chemistry, Heinrich-Plett-Strasse 40, D-34132 Kassel, Germany
Received 14 January 1999; received in revised form 4 May 1999; accepted 31 May 1999
Abstract
A novel elution system for the application of high-capacity anion exchangers with suppressed conductivity detection in ionchromatography is presented. The ternary elution system is based on perchloric acid, sodium hydroxide and sodiumcarbonate. The novel elution system was applied to a self-made high-capacity anion-exchange column (Q5453 mequiv.
2Cl ). A central composite design with 20 experiments was used to investigate the influence of the eluent compounds, whichvaried from 0.2 to 1.0 mM HClO , 20 to 100 mM NaOH and 0 to 20 mM Na CO , on the retention factor k9 of seven4 2 3
common anions. A quadratic model including interactions was postulated. The model equations were used to estimateretention factors at known eluent compositions. No significant differences of calculated and experimental retention factorswere found. Further statistical analysis was done by analysis of variance. The results showed that the three eluent compoundshave completely different effects on the retention behaviour of the anions investigated. The elution of soft and weaklyhydrated anions like bromide and nitrate is strongly influenced by the content of perchloric acid, whereas strongly hydratedanions like fluoride and sulphate are mainly affected by the hydroxide or carbonate content of the eluent. The results canqualitatively be explained comparing the relation of ionic radii to charge for eluent and analyte anions. As a consequence, theretention of the anions investigated can easily be manipulated by varying the contents of the eluent compounds. Theusefulness of the novel elution system and high-capacity anion chromatography is demonstrated by the determination oftrace anions in phosphate and fluoride matrices. 1999 Elsevier Science B.V. All rights reserved.
Keywords: Experimental design; Mobile phase composition; Detection, LC; Suppressed conductivity detection; Retentionfactors; Anion exchangers
1. Introduction
Until now, the application of low-capacity ion*Corresponding author. Corresponding address: University of exchangers dominates most separations in anionHannover, Institute of Inorganic Chemistry, Callinstrasse 9, D- chromatography, mainly caused by the widespread30167 Hannover, Germany. Tel.: 149-511-7623-174; fax: 149-
use of conductivity detection as the most universal511-7622-923.detection technique in ion chromatography. ForE-mail addresses: [email protected] (M.
Nowak), [email protected] (A. Seubert) direct conductivity detection, eluents must have a
0021-9673/99/$ – see front matter 1999 Elsevier Science B.V. All rights reserved.PI I : S0021-9673( 99 )00683-4
92 M. Nowak, A. Seubert / J. Chromatogr. A 855 (1999) 91 –109
low background conductance in order to enable tection. Until now, high-capacity anion chromatog-satisfying sensitivity [1]. Therefore hydroxide- or raphy has been possible only with detection modescarbonate-based eluents are used in combination with that are not that much limited by the elution system,chemical suppression (suppressed conductivity de- e.g., spectrophotometric, fluorimetric or amperomet-tection). For non-suppressed conductivity detection, ric detection [3].aromatic acids like phthalic or benzoic acid as well Our aim was to establish an elution systemas inorganic buffers are utilised [2,3]. suitable for high-capacity anion-exchange chroma-
Low-capacity anion exchangers encounter prob- tography with suppressed conductivity detection.lems when trace anions have to be determined in When continuously working membrane-suppressorssamples with high matrix contents. This may be the are used, the upper concentration limits are aboutcase in speciation analysis, quality control of high 100 mM for hydroxide and 20 mM for carbonatepurity chemicals or the monitoring of water disinfec- eluents. Further increase of eluent concentrationstion by-products where analyte ion concentrations leads to incomplete suppression and unstableare four- to five-orders of magnitude lower than baselines.matrix ion concentrations. If the matrix ion cannot be The idea was then to modify the standard elutioneliminated or reduced, it will in most cases strongly systems for low-capacity columns and suppressedinterfere the separation process resulting in a signifi- conductivity detection. This was done by addition ofcant loss of separation efficiency due to column perchlorate to the eluent. With spectrophotometricoverload or peak overlapping. detection techniques, perchlorate has been an effec-
Because of their higher content of functional tive driving ion for the elution of high-capacity aniongroups, high-capacity anion exchangers can enable exchangers because of its high affinity to quarternarythe analysis of samples of high ionic strength without ammonia functional groups [4,6,7,11,12]. The resultmatrix elimination steps. In addition, the use of large is a ternary elution system based on perchlorate,injection volumes or concentrated samples is pos- hydroxide and carbonate. Perchlorate cannot besible. The usefulness of high-capacity anion ex- chemically suppressed by an anion-suppressor.changers has been demonstrated in several applica- Therefore the maximum perchlorate content of thetions, e.g., the determination of bromate in disinfect- ternary elution system should not exceed 1 mMed water samples [4–6], the determination of anions corresponding to a background conductivity of aboutin concentrated hydrofluoric acid [7] or the de- 380 mS/cm. As discussed above, the upper con-termination of nitrite and nitrate in water [8]. centration limits are 100 mM for hydroxide and 20
Despite the possibilities offered by high-capacity mM for carbonate.anion-exchange columns the number of publications The novel ternary elution system offers the possi-is very small for two main reasons. First, high- bility to vary the contents of three eluent compoundscapacity anion-exchange columns with satisfying in order to manipulate the retention behaviour of thechromatographic efficiencies are not commercially analytes. Applying an anion-exchange column with aavailable. Today, the highest capacities available for capacity of 450 mequiv., the concentrations of theanion chromatography are up to 180 mequiv. per eluent compounds may be varied from 0.2 to 1.0 mMcolumn [9]. Therefore either self-preparation [4–8] HClO , 20 to 100 mM NaOH and 0 to 20 mM4
or the application of commercial high-capacity ex- Na CO .2 3
changers with poor chromatographic efficiency is To investigate the influence of the eluent com-necessary [10]. The second reason is the lack of an pounds on the retention of the so-called standardelution system suitable for conductivity detection. anions (fluoride, chloride, nitrite, bromide, nitrate,Even at elevated concentrations, common eluents for sulphate and phosphate), a statistical approach hassuppressed /non-suppressed conductivity detection been used. The application of an experimental designare much too weak to elute anion-exchange columns and statistical analysis of data provides high qualitywith capacities above 200 mequiv. per column. But information about the retention behaviour of thehigher eluent concentrations lead to a higher back- analytes investigated by performing a rather smallground conductance lowering the sensitivity of de- number of experiments [13–15]. By mathematically

M. Nowak, A. Seubert / J. Chromatogr. A 855 (1999) 91 –109 93
fitting the measured data, model equations enable to reaction scheme for the preparation of the packingestimate retention factors or selectivities at any material used in this study is shown in Fig. 1.eluent composition within the concentration range 5-bromo-1-pentene was chosen for alkylation andinvestigated. Furthermore, the effect of the eluent 2-(dimethylamino)-ethanol for amination of thecompounds on the retention of the analytes can alkylated substrate.accurately be quantified and the recognition ofinteractions between eluent compounds is possible. 2.2. Synthesis procedure
In an argon atmosphere, 15 g PS–DVB copolymer2. Experimental were suspended in 80 ml dry 1,2-dichloropropane at
208C in a pre-dried 500-ml flask. After stirring for 102.1. Basic substrate and modification min, 9.5 g (0.062 mol) trifluormethanesulphonic acid
was added. The reaction mixture immediately turnedFor preparing the high-capacity anion-exchange dark cherry red. A solution of 25 ml 5-bromo-1-
material, a custom-made polystyrene–divinylbenzene pentene (0.205 mol) in 25 ml 1,2-dichloropropanecopolymer (PS–DVB) was used [16]. The resin had was added dropwise to the mixture during a 45-mina degree of crosslinking of about 65% DVB with an period. After the addition was complete, the reactionaverage particle size of 6 mm. The surface area of mixture was stirred for 48 h at 508C under argon.
2the unmodified resin was about 580 m /g. The mixture was then cooled to 108C, filtered andFor the modification of the PS–DVB copolymer, washed with 400 ml tetrahydrofuran (THF) and 200
the bromoalkylation method first introduced by ml 2 M HCl, deionised water, 2-propanol, methanolTomoi et al. was used [17]. This one-pot synthesis and finally acetone. The yield of functionalisedwas originally intended for the preparation of poly- polymer was 17.56 g.mer-supported spacer-modified phase-transfer The bromoalkylated resin was aminated for 24 hcatalysts. The synthesis involves v-bromoalkenes as under reflux conditions using a mixture of 125 mlalkylating agents and trifluoromethanesulphonic acid 2-(dimethylamino)-ethanol and 125 ml ethanol. The(Triflic acid) as Lewis catalyst. In a second step, the resin was filtered and washed with 200 ml 2 M HCl,alkylated polymer is treated with a tertiary amine to deionised water, 2-propanol, methanol and acetone.give a strong-basic anion exchanger. The principle The aminated polymer was dried at 508C.
Fig. 1. Reaction scheme for the synthesis of the high-capacity anion exchanger: (a) Friedel–Crafts alkylation with 5-bromo-1-pentene; (b)amination with 2-(dimethylamino)-ethanol.

94 M. Nowak, A. Seubert / J. Chromatogr. A 855 (1999) 91 –109
2.3. Instrumentation and chromatographic using a down-fill-slurry-technique. The functional-conditions ised polymer (ca. 1 g) was dispersed in 60 ml of a
mixture of 100 ml glycerine and 42.5 g NaNO3
The high-performance liquid chromatography diluted to 1000 ml with deionised water. The slurry(HPLC) system consisted of the IC Pump 709, the was ultrasonically shaken for 15 min. It was immedi-Separation Center 733 which is equipped with a ately pressed into the column at a constant pressuresix-port stainless steel injection valve and the con- of 25 MPa with a mixture consisting of 100 mlductivity detector 732 (all Metrohm, Herisau, Swit- methanol and 68 g KH PO diluted to 2000 ml with2 4
zerland). For chemical suppression of the eluent, the deionised water. At least 250 ml of this mixture wasAnion-Self-Regenerating-Neutraliser ASRN I pumped through the columns. The back-pressure of(Dionex, Idstein, Germany) was used in an external the columns was about 8 MPa at a flow-rate of 1mode with 0.025 M H SO . All tubings, fittings and ml /min.2 4
column housings (12534 mm I.D.) were made of To determine the strong-base capacities, the col-polyether ether ketone (PEEK). The eluent flow-rate umns were rinsed with each 60 ml 0.2 M KCl andwas 1 ml /min in all cases. The injection volume was deionised water. The chloride was then eluted with300 ml. All investigations were carried out using 60 ml 0.2 M KNO and quantified by potentiometric3
analyte concentrations of 10 mg/ l. Other chromato- titration with 0.05 M AgNO . This procedure was3
graphic conditions are as noted in the figure captions. repeated at least three times. The average columncapacity was 450 mequiv. per column or 290 mequiv.
2.4. Reagents per ml bed volume. The column used for this studyhad an exchange capacity of 453 mequiv. for chlo-
Trifluoromethanesulphonic acid and 5-bromo-1- ride.¨pentene were obtained from Riedel-de Haen (Seelze,
Germany). 2-(Dimethylamino)-ethanol and all sol-2.6. Statisticsvents were from Fluka (Buchs, Switzerland) with a
purity grade of at least 99% and were used asreceived. 2.6.1. Choice of experimental design
All reagents for chromatographic investigations To study the effects of varying concentrations ofwere of analytical grade (Merck, Darmstadt, Ger- eluent compounds on the retention behaviour of themany). Working standards were made by diluting so-called ‘‘standard-anions’’, an experimental designstock solutions of sodium salts (1000 mg/ l) with technique was utilised. If k factors are involved, thedeionised water (Milli-Q, Eschborn, Germany). simplest experimental design is a full factorial designAliquots of stock solutions of perchloric acid (0.5 (FFD) in which each factor can assume two levelsM), sodium hydroxide (4 M) and sodium carbonate (in coded units: 61) [14]. The number of experi-
k(1 M) were used to prepare eluents. The concen- ments is then 2 to explore all possible combinations.trations of NaOH were corrected for each eluent Considering k53 factors, the experimental domain iscomposition in order to neutralise the amount of a cube whose eight corner points represent theperchloric acid used. Eluents were titrated with 0.025 locations of the experiments. A full factorial designM H SO to verify the hydroxide and carbonate enables studying linear effects of variables and their2 4
contents. The resulting eluent concentrations varied interactions, but no statements can be made aboutfrom 0.2 to 1.0 mM HClO , 20 to 100 mM NaOH second-order effects (curvature) because each factor4
and 0 to 20 mM Na CO according to the ex- has only two levels. The aim of this study is to2 3
perimental design. describe the relationship between the concentrationof eluent compounds c and the retention factor k9.
2.5. Column packing and determination of The retention factor was calculated according to Eq.exchange capacities (1)
12534 mm I.D. PEEK columns were packed k9 5 (t 2 t ) /t (1)R 0 0

M. Nowak, A. Seubert / J. Chromatogr. A 855 (1999) 91 –109 95
using the retention time t of each anion and the role for the appearance of the CCD. If a 51, theR
system dead volume t which was determined by the star-points lie on the faces of the cube and the0kretention time of the negative water dip at the experimental domain is the same as defined by a 2
beginning of each chromatogram. There is, following full factorial design. Each variable assumes threethe common retention model for ion chromatography levels (21/0 / 11). If a ±1, each variable will[3], an exponential dependence of k9 on c. For assume five levels (2a / 21/0 / 11/ 1a). In thispractical use, as it is the case in this study, the investigation, a CCD with a 52 was chosen with aretention factor may as well be fitted using a six-fold repetition of the center point (c56) [18], asquadratic model. shown in Table 1. The value of a 52 allows the
An adequate model describing second-order ef- levels of the three factors (concentration of eluentfects must have at least three levels. In this case a compounds) to be set equally spaced. The sixcentral composite design (CCD) was used with three replicates of the center-point allow an accuratefactors (eluent compounds) on five levels (concen- evaluation of the experimental error, so that thetrations of the eluent compounds) [13]. The CCD is significance of effects can be estimated. Note that the
kbuild up of a full factorial 2 design to which a star run-order of the experiments as shown in Table 2design is added. The length of the arms of the star must be randomised, which is the basic requirementdetermines the number of levels and the shape of the for obtaining statistically independent responses andexperimental design. The CCD is completed by the correct determination of effects [13].addition of a center point. The principal representa-tion of the CCD is shown in Fig. 2. The total number 2.6.2. Statistical calculationsN of experiments with k factors is: The response of the experiments was the retention
factor k9 of the anions investigated. The retentionkN 5 2 1 2k 1 c (2) factors were fitted by a so-called response surfaceregression (RSR) including second-order and inter-
The first term is related to the full factorial design, action terms. When k9 is the response and the factorsthe second to the star points and the third to the are A, B and C, the model equation would be thecenter point. From the repetition of the center point, following:the experimental variance at the center of the domain
2 2k9 5 y 1 x A 1 x B 1 x C 1 x A 1 x BA B C AA BBcan be estimated. For three factors to be considered,2at least 81611515 experiments are necessary. 1 x C 1 x AB 1 x AC 1 x BC (3)CC AB AC BC
The length of the arms of the star a plays a major
The equation describes a four-dimensional surface.If one factor is kept constant at a medium level (‘‘0’’in coded units), the retention factor may be visual-ised in dependence on the other two variables in athree-dimensional response surface (RS).
The contribution of linear, quadratic and inter-action terms to the regression polynoms was calcu-lated by an analysis of variance (ANOVA) followed
2by an e -test [19]. The ANOVA shows the variances2s of different sources (e.g., linear or quadratic terms,
residual error) and their significance as parts of the2total variance. The e -test is a statistical method to
determine the practical significance of an effect anddemonstrates the extent of variability caused by the
2input to be investigated. e is calculated as follows:Fig. 2. Representation of a CCD with three factors on five levels.
2 2 2The length of the arm of the star is a 52. e (%) 5 s /s ? 100% (4)(Source) (Total)

96 M. Nowak, A. Seubert / J. Chromatogr. A 855 (1999) 91 –109
Table 1Experimental matrix of the central composite design used for the investigation of the novel elution system (the values in parentheses indicatethe coded levels of the factors which were used for data analysis and statistical calculations. The run-order is not randomised)
Experiment No. c(HClO ) (mM) c(NaOH) (mM) c(Na CO ) (mM)4 2 3
Factor A Factor B Factor C
1 0.4 (21) 40 (21) 5 (21)2 0.8 (11) 40 (21) 5 (21)3 0.4 (21) 80 (11) 5 (21)4 0.8 (11) 80 (11) 5 (21)5 0.4 (21) 40 (21) 15 (11)6 0.8 (11) 40 (21) 15 (11)7 0.4 (21) 80 (11) 15 (11)8 0.8 (11) 80 (11) 15 (11)9 0.2 (22) 60 (0) 10 (0)
10 1.0 (12) 60 (0) 10 (0)11 0.6 (0) 20 (22) 10 (0)12 0.6 (0) 100 (12) 10 (0)13 0.6 (0) 60 (0) 0 (22)14 0.6 (0) 60 (0) 20 (12)15 0.6 (0) 60 (0) 10 (0)16 0.6 (0) 60 (0) 10 (0)17 0.6 (0) 60 (0) 10 (0)18 0.6 (0) 60 (0) 10 (0)19 0.6 (0) 60 (0) 10 (0)20 0.6 (0) 60 (0) 10 (0)
In a similar way the influence of the main factors out all calculations, the level of significance was(concentration of eluent compounds) on the retention P$95% corresponding to a type I error of a #0.05.factor was estimated. This was done by a one-way All further calculations were done with a spreadsheetANOVA, which represents the contribution of vari- program.ance of a main factor (e.g., the content of perchloricacid in the eluent) to the total variance, again
2followed by an e -test.3. Results and discussion
Basic statistical calculations (regression, ANOVA)were carried out using the MINITAB software package,Release 12 (Minitab, State College, USA). Through- 3.1. Modification of the basic substrate
Considering chromatographic efficiency, spacer-Table 2 modified PS–DVB copolymers for low-capacityAverage theoretical plate numbers per meter for the high-capacity anion chromatography were found to be superior toaanion-exchange column at the center point of the CCD
chloromethylated resins [20,21]. Therefore theAnion TP (m) k9 bromoalkylation route proposed by Tomoi et al. wasFluoride 9460 0.80 chosen for the preparation of a suitable high-capacityChloride 21 000 2.72 anion-exchange resin [17]. 5-Bromo-1-penteneNitrite 18 500 4.51 reacted as alkylation reagent, resulting in a (1-Bromide 26 300 7.53
methyl)-butylene chain between the polymer back-Nitrate 24 000 10.41bone and the functional group, in this case 2-(di-Sulphate 18 500 4.21
Phosphate 11 400 10.24 methylamino)-ethanol (Fig. 1). Although this alkylat-a ing reaction is less reactive than chloromethylation,Eluent composition: 0.6 mM HClO , 60 mM NaOH, 10 mM4
Na CO (coded units: 0 /0 /0). especially when applied to copolymers with a high2 3

M. Nowak, A. Seubert / J. Chromatogr. A 855 (1999) 91 –109 97
degree of crosslinking, the reactivity is high enough conclusion can be drawn. In this study, two mono-to give exchange capacities of about 600 mequiv. /g. valent and one divalent driving species are used.
According to Eq. (5), the retention of di- or multival-ent analytes is stronger influenced by the variation of3.2. Performance of the separation columnthe eluent concentration than those of monovalentanions, independent of the charge of the driving ion.The chromatographic performance of surface-As a consequence, changes of selectivities should befunctionalised, high-capacity anion exchangers ispossible only when analytes differ significantly inoften very poor with theoretical plate numbers lesstheir charge.than 10 000 per meter. Besides the lack of con-
ductivity detection, this may be another reason for3.3.1. Chemical properties of the eluentsthe minor use of high-capacity anion exchangers ininvestigatedion chromatography. Table 2 shows the average
Table 3 shows some important chemical propertiestheoretical plate numbers for the separation columnof the eluents investigated. The parameters displayedemployed at the center point of the central compositeare calculated with regard to the formation ofdesign. With exception of fluoride and phosphate, thehydrogencarbonate from carbonate by hydrolysis intheoretical plate numbers range from 20 000 towater. The dissociation constants used for the calcu-26 000, which are excellent values for a high-capaci-lations were derived from Ref. [25]. They are notty anion exchanger. The plate numbers are two- tocorrected for the ionic strength of the eluent orthree-times higher than those obtained with a chloro-activities of the eluent compounds. Perchloric acid ismethylated packing of the same substrate, functionalexcluded from the calculations of the pH value sincegroup and similar exchange capacity [16]. An expla-the concentrations of NaOH were corrected for eachnation for this phenomenon is given by severaleluent composition in order to neutralise the amountauthors [22,23]. The chromatographic efficiency ofof perchloric acid used. The effective pH of thethe high-capacity column used in this study iseluents undergoes only small changes from 12.27comparable to commercially available, PS–DVB-(eluent 11) to 12.99 (eluent 12). The effective pHbased surface functionalised, low-capacity aniontherefore seems to be of minor importance for theexchangers, e.g., Hamilton PRP-X-100 or Star-Ion Ainterpretation of the retention data. In contrast the300 [24].ionic strength varies from 29.49 (eluent 11) to 69.63mM (eluent 12).3.3. Retention behaviour of the standard anions
The effective concentrations of hydroxide differsonly slightly from the theoretical concentrationsThe effect of the concentration of the driving ion
2(Table 1) because of the formation of HCO fromon the retention of an analyte ion can be explained 322the reaction of CO with water. The highestby a common retention model for anion chromatog- 3
deviation from the theoretical value (6.2%) is ob-raphy [3]. If some conditions are kept constant, theserved at eluent 11. With regard to the effectivemodel can be simplified and the following relation-concentrations of bicarbonate and carbonate as wellship between the retention factor k9 and the con-as to the resulting effective charge, the formation ofcentration of the driving ion c is found:
2HCO is negligible for the discussion of the re-3x]log k9 5 2 ? log c 1 const. (5) tention data. The molar ratio of hydrogencarbonatey
to carbonate is always smaller than 0.005 resulting inIn Eq. (5), x is the charge of the analyte ion and y an effective charge of carbonate of more than 1.99
the charge of the driving ion. A plot of log k9 vs. log for each eluent composition. Therefore the only22c should give a straight line. During an experimental driving carbonate species is CO since the species3
design, all factors (eluent concentrations) are varied distribution of carbonate is almost independent of theat the same time. In this case it is not possible to eluent composition or the effective pH.visualise the retention behaviour of the analytes Phosphate is the only analyte investigated whoseaccording to Eq. (5). Nevertheless, an important charge is dependent on the eluent pH. Therefore

98 M. Nowak, A. Seubert / J. Chromatogr. A 855 (1999) 91 –109
Table 3Important chemical properties of the eluents investigated in consideration of the carbonate–hydrogencarbonate equilibrium (in addition, thedistribution of the phosphate species and the resulting effective charge of phosphate are displayed for each eluent composition)
2 2 22 22 32Eluent Effective Ionic strength c(OH ) c(HCO ) c(CO3 ) Effective charge c(HPO ) c(PO ) Effective charge3 3 4 4a a a a a b bpH (mM) (mM) (mM) (mM) carbonate (%) (%) phosphate
1 12.59 29.73 39.14 0.03 4.97 1.99 28.20 71.18 2.702 12.59 29.93 39.14 0.03 4.97 1.99 28.20 71.18 2.703 12.90 49.75 79.14 0.01 4.99 2.00 16.68 83.32 2.834 12.90 49.95 79.14 0.01 4.99 2.00 16.68 83.32 2.835 12.58 49.28 38.40 0.08 14.92 1.99 29.22 70.78 2.716 12.58 49.47 38.40 0.08 14.92 1.99 29.22 70.78 2.717 12.89 69.34 78.40 0.04 14.96 2.00 16.86 83.18 2.838 12.89 69.53 78.40 0.04 14.96 2.00 16.86 83.18 2.839 12.77 49.41 58.72 0.02 9.96 2.00 21.25 78.75 2.79
10 12.77 49.80 58.72 0.02 9.96 2.00 21.25 78.75 2.7911 12.27 29.49 18.72 0.11 9.89 1.99 45.84 54.16 2.5412 12.99 69.63 98.72 0.02 9.98 2.00 13.83 86.17 2.8613 12.77 30.30 60.00 0.00 0.00 0.00 20.90 79.10 2.7914 12.77 29.25 58.13 0.07 19.93 2.00 21.42 78.58 2.7915 12.77 49.61 58.72 0.04 9.96 2.00 21.25 78.75 2.79
a 2 1 2 27Calculated with regard to the formation of HCO from hydrolysis of Na CO in water. H CO 5H 1HCO ; K 54.47?10 [25],3 2 3 2 3 3 12 1 22 211HCO 5H 1CO ; K 54.68?10 [25].3 3 2
b 22 1 32 213Calculated for the effective pH of each eluent composition in consideration of the equilibrium. HPO 5H 1PO ; K 54.73?104 4 3
[25].
Table 3 is completed by percentile amounts of phosphate will reverse at higher perchlorate con-22 32HPO and PO in dependence on the eluent centrations. From the retention model for anion4 4
composition. The resulting effective charge of phos- chromatography it is expected that the variation ofphate varies from 2.54 at pH 12.27 (eluent 11) to the concentration of a monovalent driving ion on the2.86 at pH 12.99 (eluent 12) which may to a certain retention multivalent analytes is significantly higherextend have an influence on the retention behaviour than on the retention of monovalent analytes likeobserved for phosphate. sulphate or phosphate [3]. As demonstrated in Fig. 3,
this assumption cannot be confirmed for the variation3.3.2. Variation of perchlorate content of perchlorate.
Fig. 3 shows two chromatograms representing theexperiment Nos. 9 and 10 of the design matrix, 3.3.3. Variation of the hydroxide contentwhere the concentration of perchlorate in the eluent The influence of the variation of the hydroxidewas altered from 0.2 (22) to 1.0 mM (12) while the content is shown in Fig. 4. The two chromatogramsconcentrations of hydroxide and carbonate were kept represent the experiments Nos. 11 and 12, where theconstant. Therefore the pH as well as the ionic hydroxide concentration is increased from 20 mM tostrength of the eluent is constant. At a concentration 100 mM at a constant content of perchlorate (0.6of 0.2 mM, all analytes are baseline-resolved within mM) and carbonate (10 mM). At a concentration of25 min (Fig. 3a). Changing the perchlorate content to 20 mM NaOH, all analytes are separated within 351 mM, the chromatogram is compressed resulting in min with a high selectivity for phosphate eluting 15a coelution of nitrite and sulphate as well as nitrate min after nitrate (Fig. 4a). By increasing the hy-and phosphate (Fig. 3b). Nitrite, bromide and nitrate droxide content to 100 mM, all peaks were shifted toseem to be stronger influenced by the variation of the shorter retention times, but in contrast to the vari-perchlorate content than the other anions. Probably ation of perchlorate, the retention order of thethe retention order of nitrite / sulphate and nitrate / analytes has drastically changed (Fig. 4b). Sulphate

M. Nowak, A. Seubert / J. Chromatogr. A 855 (1999) 91 –109 99
Fig. 3. Selectivity variations of the anions investigated in dependence on the perchlorate content of the eluent. s 5Background0
conductivity. Analytes: 15fluoride; 25chloride; 35sulphate (10 mg/kg each); 45nitrite; 55bromide; 65nitrate; 75phosphate (20 mg/kgeach).
is now eluted in front of nitrite while phosphate is power due to the higher hydroxide content. As it isshifted from 32 to 7 min. While the retention expected from the retention model, the effect ofbehaviour of sulphate is consistent with the retention increasing hydroxide concentration on the retentionmodel, the dramatic shortening of the retention times rises with increasing effective charge of the analytes.for phosphate is somewhat surprising. Considering But the extend of the influence of hydroxide on thethe data from Table 3, the effective pH increases retention of phosphate cannot satisfactorily be ex-from 12.27 (eluent 11) to 12.99 (eluent 12). There- plained with the variation of the effective eluent pHfore the effective charge of phosphate increases from and the corresponding changes of the effective
222.54 to 2.86 due to further dissociation of HPO to charge of phosphate (Table 3). Nevertheless, the432PO . At first sight longer retention times for hydroxide dependent changes of the retention times4
phosphate are to be expected since the affinity to the of phosphate and sulphate, whose effective charge isstationary phase increases with the charge of the constant, are to a certain extend corresponding withanalyte. But the effect of increasing charge seems to the common retention model for anion chromatog-be negligible compared to the increase of elution raphy since the variation of the concentration of a
100 M. Nowak, A. Seubert / J. Chromatogr. A 855 (1999) 91 –109
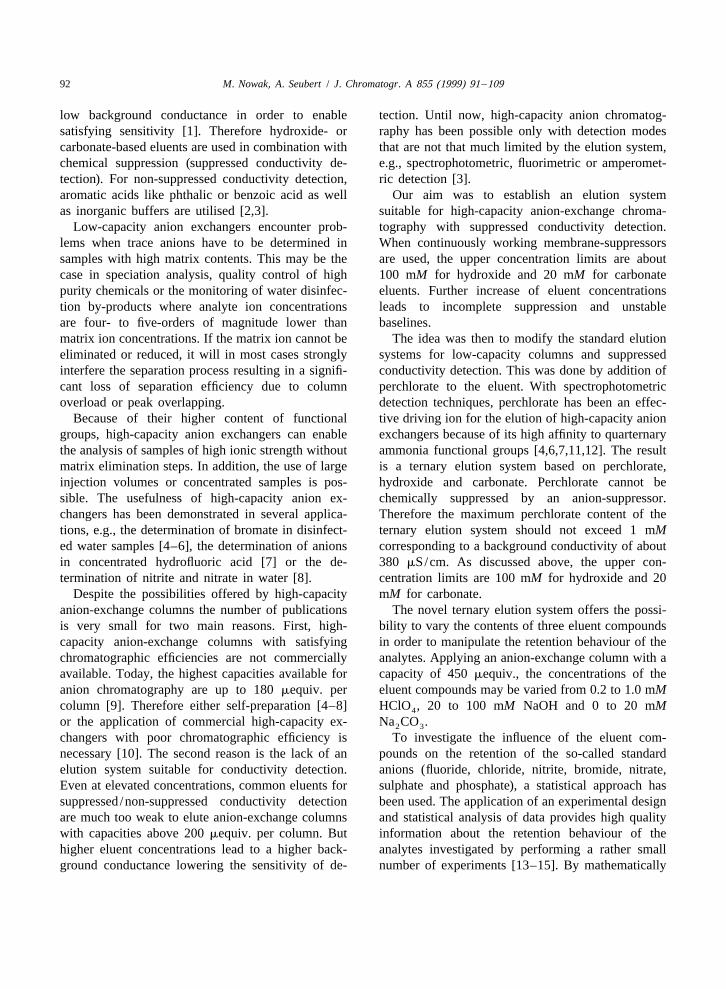
Fig. 4. Selectivity variations of the anions investigated in dependence on the hydroxide content of the eluent. s 5Background conductivity.0
Analytes: 15fluoride; 25chloride; 35nitrite; 45sulphate; 55bromide; 65nitrate; 75phosphate (analyte concentrations as in Fig. 3).
monovalent driving ion has a greater influence on (Fig. 5b), sulphate is eluted in front of nitrite whilemultivalent analytes than on monovalent. phosphate is shifted from 37 to 8 min, now eluting in
front of bromide. The observations are consistent3.3.4. Variation of the carbonate content with the conclusions drawn from the retention
The effect of the variation of the carbonate content model. The strong effect of carbonate on the re-on the retention of the anions investigated at constant tention of sulphate and especially phosphate cannotconcentrations of perchlorate and hydroxide is simi- be explained by variations of the eluent pH. Thelar to the variation of hydroxide, as shown in Fig. 5, effective pH and so the species distribution ofwhere the carbonate content was changed at constant phosphate are nearly independent from the com-concentrations of perchlorate and hydroxide (experi- position of eluents 13 and 14 (Table 3).ment Nos. 13 and 14). The influence of the carbonatecontent on the retention of the multivalent anions 3.4. Statistical analysis of the retention datasulphate and phosphate is significantly higher thanthe effect on monovalent analytes. In Fig. 5a (0 mM 3.4.1. Model equationscarbonate), a high selectivity for phosphate is ob- The retention data for each anion investigated wasserved. By altering the carbonate content to 20 mM mathematically fitted by means of a response surface

M. Nowak, A. Seubert / J. Chromatogr. A 855 (1999) 91 –109 101
Fig. 5. Selectivity variations of the anions investigated in dependence on the carbonate content of the eluent. s 5Background conductivity.0
Analytes: 15fluoride; 25chloride; 35nitrite; 45sulphate; 55bromide; 65nitrate; 75phosphate (analyte concentrations as in Fig. 3).
regression (RSR) postulating a quadratic model retention factor of each anion resulting from theincluding interaction terms according to Eq. (3). analysis of the retention data performed on the codedTable 4 shows the estimated coefficients for the variables.
Table 4Estimated regression coefficients for retention factors k9 using a full quadratic model including second-order and interaction terms [theregression equations are presented in coded forms. (A: c(HClO ); B: c(NaOH); C: c(Na CO ). Coefficients marked with asterisks are not of4 2 3
2statistical significance (P,95%). R is the quadratic correlation coefficient, D is the deviation of regression]2Anion y x x x x x x x x x R DA B C AA BB CC AB AC BC
Fluoride 0.794 20.048 20.087 20.113 20.011 20.003* 0.026 20.002* 0.015 0.032 0.977 0.024Chloride 2.704 20.367 20.290 20.290 0.059 0.009 0.072 0.005 0.060 0.100 0.991 0.053Nitrite 4.486 20.738 20.457 20.412 0.136 0.010* 0.085 0.042* 0.103 0.119 0.988 0.106Bromide 7.493 21.391 20.683 20.613 0.295 20.001* 0.122 0.056* 0.188 0.195 0.986 0.205Nitrate 10.364 22.216 21.004 20.790 0.555* 0.031* 0.155 0.100* 0.258 0.320 0.989 0.273Sulphate 4.149 20.659 21.393 21.382 0.080 0.246 0.423 0.181 0.220 0.589 0.997 0.117Phosphate 10.239 22.088 26.035 26.284 0.270 1.307 2.266 1.032 1.123 3.454 0.993 0.803
102 M. Nowak, A. Seubert / J. Chromatogr. A 855 (1999) 91 –109
The parameter y represents the intercept of the sign of the quadratic terms is positive in most cases.equation, corresponding to the estimated retention For monovalent anions, the absolute values of thefactors at the center point of the experimental quadratic terms are one-order of magnitude lowerdomain where all factors assume the coded level 0 than those of the main factors. Only for phosphate,
2 2 22(0.6 mM ClO , 60 mM OH , 10 mM CO ). x , x they play a major role.4 3 A B
and x are the first-order parameters for each factor The interaction parameters x , x and xC AB AC BC
(eluent concentration). They represent the main-ef- responsible for curvature and twisting effects of thefects and describe the variation of the retention factor response surfaces. They are with one exceptionk9 corresponding to the increase of one coded unit of positive in sign. While interactions between per-
2 2each factor (0.2 mM ClO , 20 mM OH , 5 mM chlorate and hydroxide are not significant in most422CO ). If, for example, the concentration of carbon- cases, perchlorate–carbonate and hydroxide–carbon-3
ate in the eluent is increased from level 0 (10 mM) ate interactions are always significant. With excep-to level 1 (15 mM), a decrease of the predicted tion of sulphate and phosphate, the interaction termsretention factor for phosphate of 26.035 units is are of minor importance for the retention of theobserved. As expected, all main-effects have a anions investigated.negative sign since the retention factor has to The importance of the different kind of termsdecrease with increasing eluent concentration. All becomes more clear from Table 5, in which thefirst-order parameters are of statistical significance contribution of linear, quadratic and interaction terms(P$95%). The ratio of the absolute values of the to the complete regression equation for each anion iscoefficients x , x and x undergoes significant presented. The sum of the contributions equals to theA B C
2changes from anion to anion. While for nitrate, quadratic correlation coefficient R . The differencecoefficient x (perchlorate) is twice as high as x to 100%, which would mean the complete fitting ofA B
(hydroxide) and x (carbonate), the ratio is reversed the measured retention data, is the residual error,C
for phosphate, for which x and x are three-times representing the sum of the so-called lack of fit andB C
higher than x . This means an indication for a higher pure error. For monovalent anions, the contributionA
influence of perchlorate on the retention of nitrate of linear terms is greater than 89% in all cases.compared to hydroxide and carbonate. For phos- Quadratic and interaction terms are of minor impor-phate, the opposite seems to be true. tance. The fitting of experimental data is very good
The quadratic parameters x , x and x de- for monovalent anions since the correlation is 97.7%AA BB CC
scribe curvature effects which are to expected be- (fluoride) or higher. For sulphate, the contribution ofcause of the (theoretically) exponential dependence linear terms is somewhat lower compared to mono-of the retention factor on the eluent concentration valent anions, caused by a higher influence of[3]. With one exception, all x and x coefficients interaction terms. For phosphate, this trend is moreAA CC
are of statistical significance. Most of the x pronounced, since linear terms are decreased to 82%BB
quadratic terms fail to be significant. Note that the for the benefit of quadratic (9.64%) and interaction
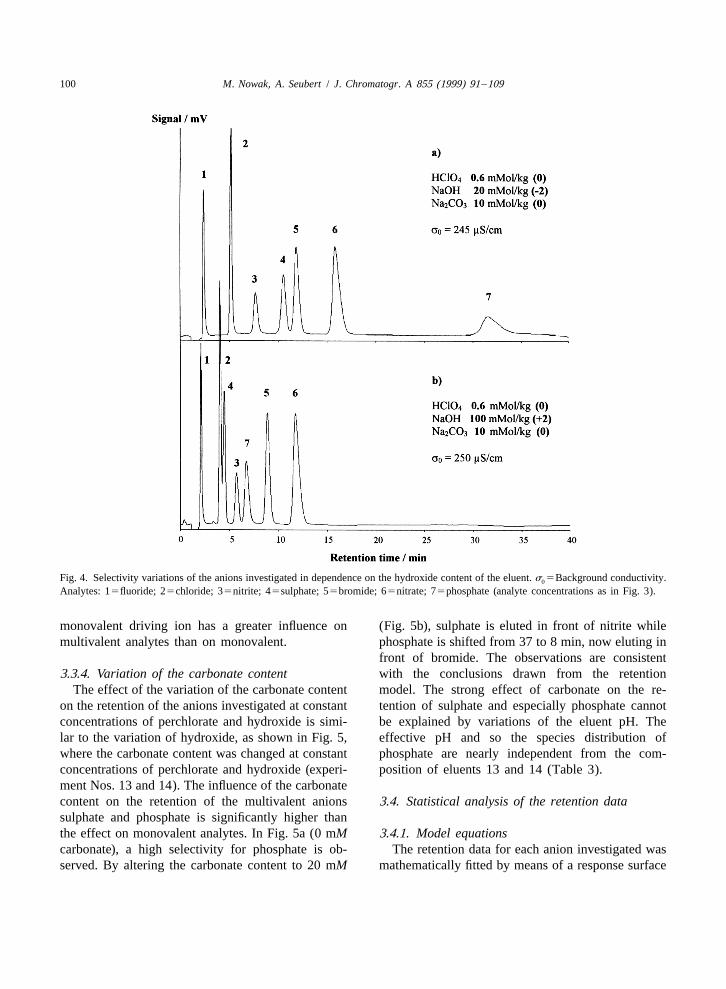
Table 5Contribution of linear, quadratic and interaction terms to the regression polynoms for k9 as a result of an analysis of variance (ANOVA)
2followed by an e -test (all data are in percent)2 aAnion Linear Quadratic Interaction R Residual error
Fluoride 89.19 6.11 2.44 97.74 2.26Chloride 93.58 3.60 2.12 99.11 0.89Nitrite 93.83 3.63 1.35 98.81 1.19Bromide 92.25 5.03 1.27 98.55 1.45Nitrate 90.73 6.96 1.24 98.92 1.08Sulphate 88.60 6.68 4.42 99.70 0.30Phosphate 82.35 9.64 7.31 99.31 0.69
a Residual error5lack of fit1pure error.

M. Nowak, A. Seubert / J. Chromatogr. A 855 (1999) 91 –109 103
terms (7.31%). The correlation for multivalent an- 3.4.3. Examples of response surfacesions is slightly better compared to monovalent anions The model equations according to Table 4 de-
2(R .99%). scribe four-dimensional hyper-planes representingTable 5 implies that for practical use the retention the dependence of the retention factor on the varying
factors of the anions investigated can be described concentrations of the eluent compounds. If onepostulating a full quadratic model including inter- concentration is kept constant at a medium level (0action terms although in theory there is an exponen- in coded units), the dependence may be visualised intial dependence of k9 on eluent concentrations. a three-dimensional plot. Therefore three responseConsidering this fact it is somewhat surprising that at surfaces are necessary if three variables are involved.least for monovalent anions the retention factors may Note that the surfaces do not display the originalas well be fitted using only linear terms. data.
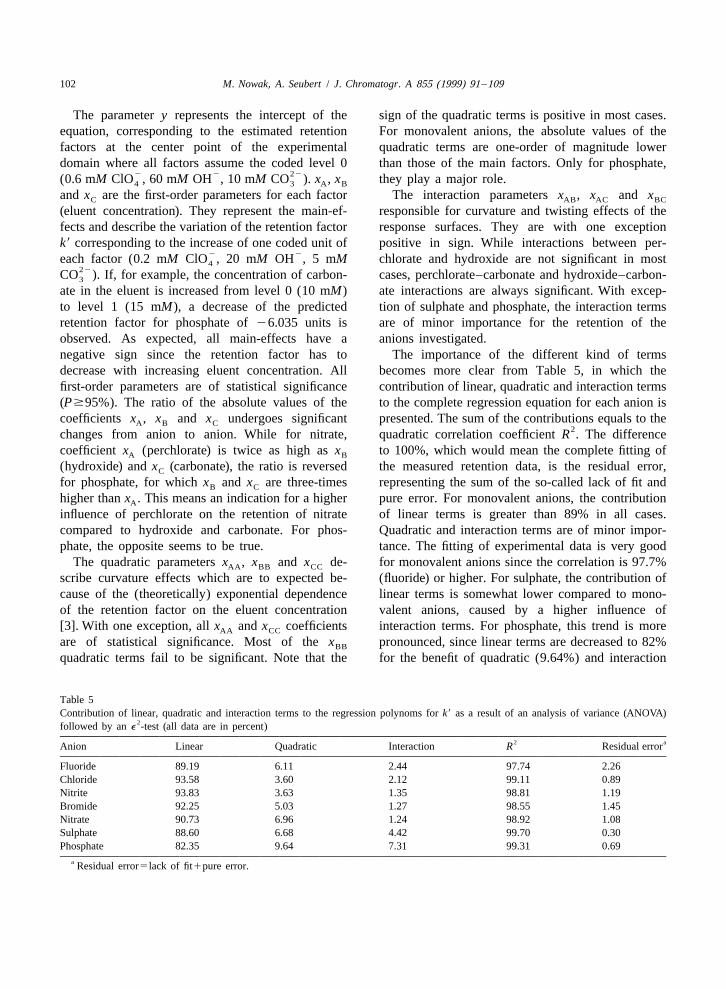
Fig. 6 shows the response surfaces for sulphate,3.4.2. Verification of the model equations based on fitted retention factors. The dimensions of
The model equations as presented in Table 4 allow the factors are real concentrations. For coded units,to calculate retention factors at any eluent com- the surfaces would have the same appearance. Allposition within the experimental design. The very planes are similarly shaped since the retention factorgood correlation of the experimental data, expressed of sulphate must decrease with increasing eluentby the quadratic correlation coefficient, implies a concentrations. The response surfaces show no twist-precise prediction of retention factors. Table 6 shows ing, an indication for a negligible role of interactionthe results of a comparison of experimental and terms. The variation of hydroxide and carbonatecalculated retention factors. The calculation was concentrations has a much higher influence on thedone by inserting the corresponding coded concen- retention of sulphate than the variation of perchloratetration units into the model equations. All coeffi- which is obvious from the curvature effects (Fig. 6acients were used independent of their statistical and b). These conclusions are consistent with thesignificance. The results show that with few excep- chromatograms (Figs. 3–5). The effects of hydroxidetions no significant differences between calculated and carbonate are almost equal since the responseand experimental data are found. It is important to surface is nearly symmetric in shape.note that the model equation are reasonable only The response surfaces for nitrate are presented inwithin the experimental domain. They may be ap- Fig. 7. In this case, the retention factor is highlyplied to outliers, but in this investigation the equa- influenced by the variation of perchlorate (Fig. 7ations failed to estimate the retention factors correctly and b). The response surfaces seem to be mirroreven if only one concentration was outside of the images of those corresponding to sulphate (Fig. 6aconcentration ranges investigated. and b). As shown in Fig. 7c, the effect of hydroxide
Table 6Calculated and experimental retention factors k9 for two eluent compositions within the experimental design (values in parentheses are coded
aconcentrations)
Anion Calculated 1 Experimental 1 Calculated 2 Experimental 2
Fluoride 0.6660.02 0.6660.01 0.8660.02 0.8460.01Chloride 2.4860.05 2.4360.02 2.7760.05 2.6560.01Nitrite 4.1760.11 4.1160.04 4.4460.11 4.3960.03Bromide 7.1660.21 7.0760.05 7.2560.21 7.2460.06Nitrate 10.1760.27 9.9560.07 9.9060.27 9.8260.02Sulphate 2.9060.12 2.8560.03 5.2560.12 5.0360.04Phosphate 5.8960.80 5.4560.05 15.9360.80 15.7560.06
a Eluent 1: 0.5 mM HClO ; 75 mM NaOH; 17.5 mM Na CO (20.5 /0.75 /1.5). Eluent 2: 0.75 mM HClO ; 50 mM NaOH; 7.5 mM4 2 3 4
Na CO (0.75/ 20.5 / 20.5). For calculations, coded concentrations were inserted in the equations from Table 2. Experimental values are2 3
the mean of three runs.
104 M. Nowak, A. Seubert / J. Chromatogr. A 855 (1999) 91 –109
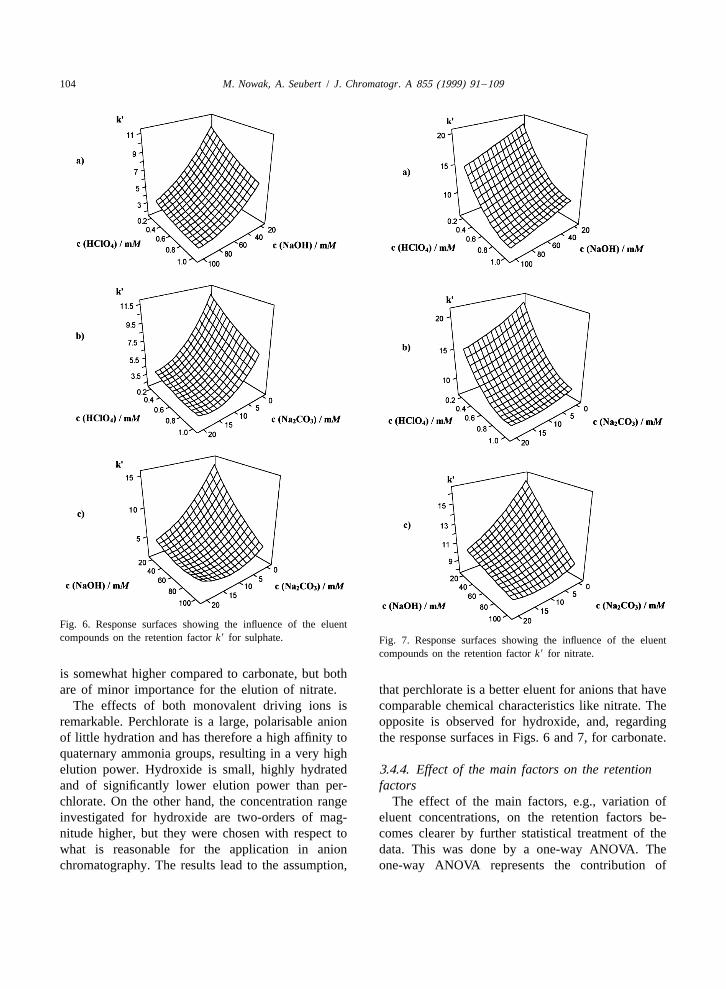
Fig. 6. Response surfaces showing the influence of the eluentcompounds on the retention factor k9 for sulphate. Fig. 7. Response surfaces showing the influence of the eluent
compounds on the retention factor k9 for nitrate.
is somewhat higher compared to carbonate, but bothare of minor importance for the elution of nitrate. that perchlorate is a better eluent for anions that have
The effects of both monovalent driving ions is comparable chemical characteristics like nitrate. Theremarkable. Perchlorate is a large, polarisable anion opposite is observed for hydroxide, and, regardingof little hydration and has therefore a high affinity to the response surfaces in Figs. 6 and 7, for carbonate.quaternary ammonia groups, resulting in a very highelution power. Hydroxide is small, highly hydrated 3.4.4. Effect of the main factors on the retentionand of significantly lower elution power than per- factorschlorate. On the other hand, the concentration range The effect of the main factors, e.g., variation ofinvestigated for hydroxide are two-orders of mag- eluent concentrations, on the retention factors be-nitude higher, but they were chosen with respect to comes clearer by further statistical treatment of thewhat is reasonable for the application in anion data. This was done by a one-way ANOVA. Thechromatography. The results lead to the assumption, one-way ANOVA represents the contribution of

M. Nowak, A. Seubert / J. Chromatogr. A 855 (1999) 91 –109 105
variance of a main factor to the total variance. The (Figs. 3–5). The main problem is the difference incontribution includes linear and quadratic effects. the concentration range investigated. The perchlorateThe variance of a main factor was then related to the concentration is two-orders of magnitude lower than
2total variance (e -test) representing the contribution the hydroxide range with carbonate lying in-between.of the main factor in percent. On the other hand, the concentration ranges represent
The results of these calculations are displayed in the elution power of the eluent anions applied2 22 2Table 7, showing the extend of variation of the (ClO 4CO .OH ), and the choice of the eluent4 3
retention factor caused by the variation of eluent concentrations is reasonable for practical use.concentrations within the experimental domain. For The first attempt to explain the data from Table 7monovalent analytes, 97 to 99% of the variation of was to correlate the effects with the hydrated ionicthe retention factor can be explained with main radii of analyte and eluent anions. The hydrated ioniceffects. Only for multivalent analytes sulphate and radii can be calculated from the limiting conduct-phosphate interaction terms are of importance since ances [26,27]. But the argumentation with hydratedthe sum of the main effects is smaller than 95%. This ionic radii is misleading. For example, the hydratedis consistent with the conclusions drawn from Table ionic radii of chloride and bromide are 121 and 1185. From Table 7 it is obvious that within the pm, respectively. This would lead to the assumption,concentration ranges investigated the eluent com- that both analytes should be influenced in the samepounds have very different effects on the analytes way by the eluent compounds. Furthermore, theywhich can be divided into three groups. The first should have almost the same retention factors at agroup are analytes mainly influenced or eluted by given eluent composition. But this assumption is inhydroxide or carbonate. These analytes are fluoride, contrast to the chromatograms (Figs. 3–5) and to thesulphate and phosphate. Although perchlorate does results from Table 7. The reason is that the hydratedof course have an effect on the elution of these ionic radii derived from the limiting conductances doanions, the effect is not of statistical significance not display chemical properties since two ions,(P,95%). As shown in Table 3, the effects of independent of their chemical origin, have the samehydroxide an carbonate on the retention of phosphate hydrated ionic radii in case their limiting conduct-cannot be satisfactory explained by the influence of ances are equal.the eluent pH or the carbonate species distribution. A better approach is to explain the effects fromThe second group, chloride and nitrite, are anions Table 7 considering the unhydrated ionic radiiaffected by all eluent compounds but with different related to the nominal charge. Although this is only acontributions and the third group, bromide and simplification since the effective charges of allnitrate, is influenced significantly only by perchlorate anions are significantly smaller than the nominalwith minor effects of hydroxide and carbonate. charge when concentrated eluents and high-capacity
The results of Table 7 are somewhat surprising anion exchangers are applied [7,28], this model isand difficult to explain although the results are in able to qualitatively explain the effects observed.good agreement with the chromatograms obtained Table 8 shows the ionic radii of the eluent and
Table 72Effect of the main factors (eluent compounds) on the retention factors as a result of a one-way ANOVA followed by an e -test [all data are
in percent, effects marked with asterisks are not of statistical significance (P,95%)]
Anion HClO NaOH Na CO Sum Residual error4 2 3
Fluoride 11.04* 30.60 57.47 99.11 20.89Sulphate 9.27* 41.12 44.33 94.72 25.28Phosphate 5.39* 39.26 47.69 92.34 27.66Chloride 42.81 26.02 28.18 97.02 22.98Nitrite 58.28 21.38 18.11 97.78 22.22Bromide 69.30 15.79* 12.97* 98.07 21.93Nitrate 75.36 14.21* 8.75* 98.33 21.67

106 M. Nowak, A. Seubert / J. Chromatogr. A 855 (1999) 91 –109
Table 8 effects of hydroxide and carbonate on nitrate than onRatios of ionic radii related to nominal charge for eluent and bromide (Table 7).analyte anions
Somewhat difficult to explain are the effects fora bAnion R (pm) z R /z (pm) chloride (R /z5172 pm) and nitrite (R /z5192 pm),
Perchlorate 240 1 240 which are significantly influenced by all eluentHydroxide 130 1 130 compounds although perchlorate is of major impor-Carbonate 178 2 89 tance. The large ionic radius of nitrite is caused byFluoride 126 1 126
its deviation from a spherical symmetry [29]. Con-Sulphate 258 2 129c d sidering the ionic radius only, nitrite should show thePhosphate 280 2.79 101
Bromide 188 1 188 same behaviour as bromide and nitrate which is inNitrate 179 1 179 contrast to the chromatograms (Figs. 3–5) and to theChloride 172 1 172 results of Table 7. Although chloride is 16 pmeNitrite 192 1 192
smaller than bromide, the difference of the ionica Thermochemical radii [28]. radii is no satisfying explanation for the effectsb Nominal charge. observed. On the other hand, the effect of the eluentc Estimated value, no data available.d compounds on the retention factor for the halide ionsAt pH512.77 (see Table 3).e investigated correlates with their ionic radii orLarge value due to deviation from spherical symmetry.
polarisability. The effect of perchlorate increases in2 2 2the order F ,Cl ,Br while the influence of
hydroxide and carbonate decreases. If iodide wouldanalyte anions related to their nominal charge. For have been included in this study, the effect ofthe eluent ions, the R /z ratio decreases drastically perchlorate on iodine would probably be greater asfrom perchlorate (240 pm) to hydroxide (130 pm) on bromide with decreasing effects of hydroxide andand carbonate (89 pm). In the same way, the extend carbonate.of hydration increases, leading to the conclusion that Although the data available in this study coversperchlorate is a soft and polarisable anion while the retention behaviour of only seven analyte anions,hydroxide and carbonate are much harder and to a the results lead to the conclusion that there arelesser extend polarisable. Regarding the analyte interactions between analyte anions and eluent an-anions, fluoride, sulphate and phosphate have similar ions during the elution process. The affinity to theR /z ratios ranging from 101 to 129 pm. These anions functional groups seem to be of minor importance.therefore are hard, strongly hydrated and their re- Considering the effects of Table 7, the following cantention factors are highly influenced by the hard be stated: hard, strongly hydrated anions (fluoride,eluent anions carbonate and hydroxide. Although sulphate, phosphate) are eluted by hard and stronglyperchlorate is a very strong driving ion, its effect on hydrated eluent anions (hydroxide, carbonate) whilestrongly hydrated anions is of minor importance soft and less hydrated anions (bromide, nitrate) aresince perchlorate is weakly hydrated and polarisable. eluted by perchlorate. Analytes in-between theseTherefore the influence of the eluent compounds critical cases (chloride, nitrite) are influenced by alldecreases in the order carbonate.hydroxide4 eluent compounds. It has to be noted that the effectsperchlorate. described are due to a single separation column
The opposite trend is observed for the larger and covering a special kind of functional group ofmore polarisable anions bromide (R /z5188 pm) and medium polarity. Applying functional groups ofnitrate (R /z5179 pm) which are less hydrated. different polarity or a different polymer backbone,Consequently, the retention factor of these anions is e.g., methacrylate polymers, the numeric values ofinfluenced in the order perchlorate4hydroxide. the effects may found to be different from this study.carbonate. Since nitrate elutes after bromide, it seems For example, functional groups of higher polarityto be more polarisable than bromide although nitrate (e.g., triethanolamine) will have a higher affinity tohas a smaller ionic radius. This assumption is proved hydroxide which is known as hydroxide selectivityby the higher effect of perchlorate and the smaller [3]. Therefore the effect or elution power of hy-

M. Nowak, A. Seubert / J. Chromatogr. A 855 (1999) 91 –109 107
droxide on such stationary phases will be more disturbed due to baseline deviation caused by thepronounced [28]. fluoride matrix, while sulphate and nitrate are well
resolved. Again, the retention times of the analytes3.5. Application of the novel elution system to are not influenced by the matrix. The separation ofsamples of high matrix content chloride from the fluoride peak may be enhanced by
further optimisation of the eluent composition. Con-To demonstrate the potential of high-capacity sidering the conclusions from Table 7, this could be
anion chromatography and conductivity detection the done increasing the carbonate and decreasing thenovel elution system is applied to samples with high perchlorate content of the eluent.matrix content. Fig. 8 shows a chromatogram of a
2sample containing 1000 mg/ l H PO spiked with2 4
fluoride, chloride, sulphate and nitrate (1 mg/ l each).Although there is a baseline drift due to matrix 4. Conclusionseffects, all analytes are well resolved from thephosphate peak. Compared to a standard chromato- The novel ternary elution system based on per-gram with the same eluent composition (Fig. 4a), no chlorate, hydroxide and carbonate offers the possi-shift of retention times or decrease of separation bility to apply conductivity detection as the mostefficiency or selectivity was found. universal detection technique in ion chromatography
The determination of trace anions (1 mg/ l) in a to anion-exchange columns of more than 4002NH F matrix (10 000 mg/ l F ¯2%, w/w, NH F) is mequiv. The sensitivity of detection is limited due to4 4
shown in Fig. 9. Unfortunately the chloride peak is the non-suppressible perchlorate. The background
2Fig. 8. Determination of trace anions (1 mg/ l each) in 1000 mg/ l H PO matrix. Chromatographic conditions: 0.6 mM HClO , 20 mM2 4 4
NaOH, 10 mM Na CO ; flow-rate: 1 ml /min; injection volume 100 ml; suppressed conductivity detection.2 3

108 M. Nowak, A. Seubert / J. Chromatogr. A 855 (1999) 91 –109
2Fig. 9. Determination of trace anions (1 mg/ l each) in 10 000 mg/ l F matrix (¯2%, w/w, NH F). For chromatographic conditions see4
Fig. 8.
conductivity varies from 90 to 380 mS/cm, and for a high-capacity anion chromatography with conduc-typical eluent composition, the background conduct- tivity detection.ance of the eluent is comparable to those observed in Future work will include the application of high-non-suppressed conductivity detection (180 mS/cm). capacity anion chromatography with conductivityThe characterisation of the novel elution system by detection to real world samples as well as themeans of a statistical approach shows that the three investigation of the retention behaviour of anionseluent compounds have very different effects on the covering a wider range of chemical properties.retention of the anions investigated. Whereas hard Furthermore, the effect of eluent compounds on theand strongly hydrated anions like fluoride or sulphate analytes has to be investigated in dependence of theare mainly eluted by hydroxide and carbonate, the polarity of the functional group or polymer back-opposite is found for large and weakly hydrated bone.analytes like bromide and nitrate which are sig-nificantly influenced by perchlorate only. To acertain extend, the retention behaviour observed canbe explained with the relation of ionic radii and Acknowledgementscharge of both analyte and eluent anions. The use of
¨model equation enables to predict retention times of Financial support from the Bundesministerium furthe analytes in dependence on the eluent composition Bildung, Wissenschaft, Forschung und Technologiewhich is very helpful for solving analytical prob- (BMBF) and the Fonds der Chemischen Industrielems. The application of the novel elution system to (FCI) is gratefully acknowledged. The authors would
¨samples of high ionic content shows the potential of also like to thank Dr. Helwig Schafer (Metrohm,

M. Nowak, A. Seubert / J. Chromatogr. A 855 (1999) 91 –109 109
[14] K. Doerffel, Statistik in der Analytischen Chemie, 5th ed.,Switzerland) for providing parts of the chromato-¨VEB Deutscher Verlag fur Grundstoffindustrie, Leipzig,graphic equipment.
1990.[15] S.J. Haswell (Ed.), Practical Guide to Chemometrics, Marcel
Dekker, New York, 1992.¨References [16] K. Kohler, Ph.D. Thesis, University of Hannover, Hannover,
1998.[17] M. Tomoi, N. Kori, H. Kakiuchi, React. Polym. 3 (1985)[1] J. Weiss, Ionenchromatographie, 2nd ed., Verlag Chemie,
341.Weinheim, 1991.[18] G. Contarini, R. Leardi, J. High Resolut. Chromatogr. 17[2] D.T. Gjerde, J.S. Fritz, Ion Chromatography, 2nd ed.,
(1994) 91.¨Huthig, Heidelberg, 1987.[19] Minitab User’s Guide, Release 12, Minitab Inc., State[3] P.R. Haddad, P.E. Jackson, in: Ion Chromatography –
College, PA, USA, 1998.Principles and Applications, Journal of Chromatography[20] L.M. Warth, Ph.D. Thesis, Iowa State University, 1988.Library, Vol. 46, Elsevier, Amsterdam, 1990.[21] L.M. Warth, J.S. Fritz, J. Chromatogr. Sci. 26 (1988) 630.¨[4] K. Kohler, M. Nowak, A. Seubert, Fresenius J. Anal. Chem.[22] R.M. Diamond, J. Phys. Chem. 67 (1963) 2513.358 (1997) 551.[23] R.E. Barron, J.S. Fritz, J. Chromatogr. 284 (1984) 13.[5] M. Nowak, A. Seubert, Anal. Chim. Acta 359 (1998) 193.[24] Metrohm IC Application Notes, Metrohm LTD, Herisau,¨ ¨[6] M. Nowak, G. Schminke, K. Kohler, H. Schafer, A. Seubert,
1998.poster presented at the 10th International Ion Chromatog-[25] A.F. Holleman, E. Wiberg, Lehrbuch der Anorganischenraphy Symposium, Santa Clara, CA, 1997.
Chemie, 91–100th ed., Walter de Gruyter, Berlin, 1985.[7] G. Petzold, Ph.D. Thesis, University of Hannover, Hannover,[26] Handbook of Chemistry and Physics, 73 ed., CRC Press,1995.
Boca Raton, FL, 1992–1993.[8] L. Eek, N. Ferrer, J. Chromatogr. 332 (1985) 491.[27] G. Wedler, Lehrbuch der Physikalischen Chemie, 3rd ed.,[9] Product Selection Guide, Dionex Corporation, Idstein, 1998.
Verlag Chemie, Weinheim, 1988.[10] J. Diemer, K.G. Heumann, Fresenius J. Anal. Chem. 357 (1)[28] M. Nowak, Ph.D Thesis, University of Hannover, Hannover,(1997) 74.
1999.[11] K. Ito, Anal. Chem. 69 (1997) 3628.[29] H.D.B. Jenkins, K.P. Thakur, J. Chem. Educ. 56 (1979) 576.´ ˇ[12] F. Vlacil, I. Vins, J. Chromatogr. 391 (1987) 133.
[13] M. Otto, Chemometrics, Verlag Chemie, Weinheim, 1997.