application of dea-ann for best performance modeling · the performance framework can significantly...
TRANSCRIPT

LV14034/059
Application of DEA-ANN for Best Performance Modeling
He-Boong Kwon Colorado State University-Pueblo, Pueblo, USA
Jooh Lee
Rowan University, Glassboro, New Jersey, USA
James Jungbae Roh Rowan University, Glassboro, New Jersey, USA
ABSTRACT
The purpose of this study is to present a complementary modeling approach using data envelopment analysis (DEA) and artificial neural network (ANN) as an adaptive decision support tool in promoting best performance benchmarking and performance modeling. DEA and ANN are combined to take advantages of optimization and prediction capabilities inherent in each method. DEA is used as a preprocessor to measure relative efficiency of decision making units (DMUs) and to generate test inputs for subsequent ANN prediction module. The combined modeling approach proves effective through sequential processes by streamlining DEA analysis and ANN prediction. DEA model, in addition to capturing efficiency trend of the Japanese electronics manufacturing industry, further extends its capacity as a preprocessor to the subsequent neural network prediction module. Back propagation neural network (BPNN), in conjunction with DEA, demonstrates promising performance in predicting efficiency scores and best performance outputs for DMUs under evaluation. This research paper proposes an innovative performance measurement and prediction approach in support of superiority driven best performance modeling and stepwise improvement initiatives.
Keywords: Data Envelopment Analysis, Artificial Neural Network, Best Performance Modeling, Decision Making, Japanese Electronic Industry

LV14034/059
1. INTRODUCTION
DEA has been a popular optimization tool with its theoretical basis on linear programming. As an extreme point method, DEA identifies best practice DMUs, measures relative efficiency, and projects quantity of variables necessary for each inefficient DMU to become efficient. However, despite its popularity in benchmarking studies, DEA has shortfalls in prediction capability and limits its usage (Mostafa, 2007; Mostafa, 2009; Wang et al., 2013). For this reason, introduction of advanced method that can integrate measurement and prediction framework still remains as a challenging task (McAdam, et al., 2008). Furthermore, with a notion of managerial dilemma in selecting options between theoretical and practical alternatives and lack of progress monitoring technique make methodological advancement more than a pressing need, especially in this volatile business environment (Francis and Holloway, 2007). ANN, modeled after human thinking paradigm, acquires knowledge through iterative learning process and weight adjustment between interconnected neurons. In doing so, ANN achieves generalization and abstract learning from limited set of information and provides nonlinear mapping and predictive power (Fausett, 1994; Yi and Thomas, 2009). ANN, especially BPNN model used for this study, searches for weight sets to form a best fit through observed data sets. Therefore, BPNN resembles regression type of learning and excels in predicting central tendency of observed data rather than approximating extreme data sets (Pendharkar and Rodger, 2003; Wu et al., 2006). Clearly, predictive potential of ANN and optimization capacity of DEA expose complementary features, thus envisioning a prominent modeling option. Literature shows encouraging but rare outcomes of combined approach with most of studies focused on predicting DEA efficiency scores as an indirect performance measure. Researchers extended pilot study conducted by Athanassopoulos and Curram (1996) through comparative and complementary studies using DEA-ANN and reported promising potential of combined approach (Emrouzneja and Shale, 2009; Hsiang-His et al., 2013; Kuo, et. al,2010). However, very limited empirical studies have been conducted in the past and more promising successes yet to be made in this research stream. Recent literature reports possibility of extending combined model to the application of best performance benchmarking through prediction of optimal outputs beyond efficiency scores (Kwon, 2014). This study explores an innovative performance measurement and prediction framework using DEA-ANN, to fulfill practical necessity, thus improving benchmarking and decision making process. The proposed combined model utilizes DEA as a preprocessor and the subsequent ANN model conducts prediction task for best performance output for each DMU. In addition to methodological progressions, this paper provides a brief insight on Japanese electronics manufacturing firms and their operations through efficiency analysis. In summary, the main purpose and motivations for this research paper is three-fold:
(1) to present a new integrated performance measurement and prediction model, thus bridging the research gap. (2) to enhance managerial flexibility in selecting actionable options from theoretical and practically feasible alternatives and potential progress monitoring through adaptive decision support measure. (3) to provide empirical support on the proposed model using a large size sample data through streamlining sequential processes of DEA measurement and ANN prediction.
This paper is organized as follows. Section 2 reviews related studies and Section 3 briefly discusses innovative input-output modeling system. Section 4 describes empirical processes followed by empirical analysis and results in section 5. Concluding remarks and suggestions for future studies are presented in section 6.
2. RELATED STUDIES
A growing number of recent studies (Hsiang-Hsi et al., 2013; Yi and Thomas, 2009) signify ANNs as one of emergent performance exploitation methods, particularly with respect to input-output based performance schemes. In fact, ANN as one of the promising performance benchmarks motivates further exploration and awaits a wider scope of empirical successes as a relatively new modeling tool in the areas of clustering, classification, and prediction. ANNs, modeled after biological neurons, are characterized by adaptive learning and generalization therefore provides robust data processing capabilities in the presence of complex and nonlinear relationships between input/output variables. Most of previous studies, therefore, have investigated feasibilities of using ANN and reported superior performance of standalone ANN model over traditional approaches. Indeed, literature shows rich

LV14034/059
applications exploring predictive potentials of ANNs in the broad subject areas of operations and performance management (Alolayyan et al., 2011; Alpay and Yuzugulla, 2009; Carlucci et al., 2013; Georgy et al., 2005; Kourentzes, 2013; Kuo et al., 2010; Lau et al., 2013; Li and Dai, 2009; Li and Liu, 2012). In these applications, a BPNN model has been a popular choice. BPNN has its strength in learning general patterns but has limitation in learning optimal performance patterns as a standalone method (Athanassopoulis and Curram, 1996; Pendharkar and Rodger, 2003; Ülengin et al., 2011). Up to this date, rare attempts have been made to further explore strengths of BPNN and overcome its drawbacks, especially within a context of superiority driven benchmarking and performance prediction arena. DEA has been widely used in best practice benchmarking studies as a nonparametric optimization method since its introduction in late 1970s. As a frontier method, DEA measures relative efficiency of DMUs and projects improvement levels for inefficient DMUs in terms of resource utilization and output generation. DEA has been a well suited method for best practice benchmarking as evidenced by a plethora of articles and its proven applications to cover all sorts of organizations, business sectors, and practices such as airport (Adler et al., 2013; Georges and Gillen, 2012) banking (Paradi and Zhu, 2013; Paradi et al., 2011), healthcare (Ferrier and Trivitt, 2013; Gok and Sezen, 2012), hotel (Huang, et al., 2012; Peng et al., 2013) railroad (Bhanot and Singh, 2014; Feli, et al., 2011), production (Chen, et al., 2014; Lozano, 2014), supplier selection (Mirhedayatian, 2014; Pitchipoo, 2012), and socially responsible operations (Lu et al., 2013; Sun and Stuebs, 2013). However, despite its proven capability, DEA lacks predictive capacity which is a strength of ANN in contrast. Notably enough, both ANN and DEA exhibit complementary features that can be built into a promising combined model. Possibility of exploiting complementary attribute of DEA and ANN was first proposed by Athanassopoulos and Curram (1996). They investigated ANN’s feasibility in assessing efficiency of DMUs and determined both DEA and ANN as comparable and potentially complementary methods in performance assessment. Since then, a few researchers extended the initial work and reported encouraging outcomes. In these previous attempts, DEA was used as a preprocessor to select ‘efficient’ training sets and to improve computational efficiency for subsequent neural networks (Emrouznejad and Shale, 2009; Pendharkar and Roger, 2003). Most of studies, even a rarity, focused on predicting DEA efficiency scores as a surrogate measure of performance (Hsiang-His et al., 2013; Kuo et al., 2010; Sreekumar and Mahapatra, 2011; Wang, 2003). Distinguished from previous studies, this study attempts to build an adaptive prediction model for best performance outcomes. It is also expected that addition of predictive capacity to the performance framework can significantly enhance managerial decision making process in promoting improvement initiatives and add significant value to existing literature.
3. INNOVATIVE INPUT-OUTPUT MODELING SYSTEM
3.1 DEA
Emergence of DEA dates back to late 1970s when Charnes et al. (1978) first developed DEA CCR model as a frontier technology with its theoretical root in Farrel’s (1957) work on technical efficiency. DEA, as a linear programming based mathematical modeling tool, envelopes extreme data points to form a frontier surface. DEA model, then, identifies efficient DMUs (with score of 1), measures relative inefficiency and potential improvement for DMUs under the envelopment surface. In assessing relative efficiency, the original CCR DEA model assumes constant returns- to- scale (CRS) where increase of input scale yields a proportionate increase of outputs. Theoretical foundations and mathematical formulations can be found in Charnes et al (1978). In addition to CCR model, BCC model is also used in this study. As a variation to CCR model, the BCC model assumes variable returns-to-scale (VRS) and takes into account the scale effects (Banker et al., 1984). A DEA model can be either input oriented or output oriented, however, the selection is dependent on characteristics of problems and applications (Abate et al., 2013; Afzal and Lawrey, 2012). In this study, with an emphasis on predicting best output by subsequent neural network model, output oriented model is used. 3.2 ANN ANN is an AI-based information processing system resembling biological nervous system of a human brain and are characterized by intelligent processing and adaptive learning in its core, as a consequence, their strength reside in the capability to capture nonlinear patterns from complicated data sets (Fausett, 1994; Haykin, 1994; Rumelhart et al., 1986). ANNs are composed of an array of highly interconnected processing elements, alias neurons, which process and exchange information with neurons in adjacent layers in a sequential and iterative manner according to a set protocol, and the process continues until the network learns input patterns or meets termination conditions. Learning in ANN models can be either supervised or unsupervised and impact network topology and weight update rules. In

LV14034/059
this research, three layered BPNN, most popular supervised learning model, is used for its proven strength in prediction tasks. Figure 1 Neuron and BPNN Model (3-2-1 structure)
Figure 1 shows a neuron and a typical three layered BPNN model with (3-2-1) neurons in each (input, hidden, output) layer. The figure exhibits connections between neurons in the adjacent layers, and hints massive parallelism inherent in BPNN as a connectionist model. In this layered structure, neurons in a hidden layer conduct a critical role in capturing nonlinearity between input and output variables, thus learning complex patterns. Indeed, nonlinear modeling capabilities supported by hidden neurons greatly contributed to the resurgence of ANNs since 1980s and positioned BPNN as one of the most attractive neural network models for prediction and classification problems. Number of hidden layers and neurons depends on complexity of data patterns and desired level of accuracy, however, literature shows one hidden layer is sufficient in most of applications with varying number of neurons depending on applications (Azadeh, et al., 2011; Ciampi and Gordini, 2013; Fausett, 1994; Haykin, 1994). BPNN learning adopts least mean squared error approach through iterative information feed forward and error back propagation processes as summarized below (Fausett, 1994):
Input feed forward: in this process, input neurons receive incoming signals, and hidden neurons calculate weighted net output and activate output to neurons in the output layer. Output neuron k, upon receipt of hidden output, calculates actual output (Yk) and total error (E) between target (Tk) and actual outputs for all pairs of training input and output.
21 / 2 [ ]k k
k
E T Y= −∑
Error back propagation: upon completion of feed forward process, error information propagates backward following a reverse path, output-hidden-input layers. Then, weight between interconnected neurons are updated in a way to minimize E. This process continues until minimum error is achieved or termination conditions are met.
Final weight sets thus obtained through repetitive presentations of training data and weight adjustments store abstract information and nonlinear relationships between variables. In other words, these set of weights memorize the best potential fit over presented data and enable the network to learn general patterns and central tendency of observed data (Athanassopoulos and Curram, 1996; Pendharkar, 2005; Ülengin et al., 2011). In this combined DEA and ANN approach, BPNN model is designed to learn and predict best performance outputs in addition to efficiency scores.
4. EMPIRICAL PROCESSES
4.1 Samples and variables
For the empirical support of the proposed model, the data sample being used in this study is from Japanese electronic manufacturing firms (SIC 3600-3600) that are listed in the stock market. The basic strategic data and economic performance data were selected from S&P Research Insight-Global Vantage. In order to generalize the test result, only 225 electronic firms with complete set of data on all adopted variables were included in the modeling system for the analysis. In order to generalize combined modeling approaches to technology oriented industry like electronic sector, this study employs longitudinal value of each variable employed over past ten year timeframe (2003-2012). Each firm-time period is treated as an individual DMU in this study. But DMUs with negative values or extreme values (beyond 3 standard deviations in ratio variables) were additionally excluded from the experiment for the integrity of the analysis. The final resulting sample consists of 1,419 DMUs which is deemed
LV14034/059
sufficient for this empirical test of model. The full set of DMUs with complete data in longitudinal period record would bolster the overall analytical advantages of combined innovative modeling system for performance strategy. The Table 1 shows the summary statistics of the variables used for this sequential modeling experiment. Table 1 Descriptive Statistics of Variables
Variables Mean SD Maximum Minimum EMP (000) 10.2 31 366.9 0.1 AST (USM$) 2,649.1 10,231.0 150,855.9 13.4 OPX (USM$) 2,170.6 8,417 93,820 10.9 REV (USM$) 2,430.4 9,242.4 101,686,7 12.1 MKV(USM$) 1,617.5 4,850.7 50,832.6 4.50
Note: EMP (=Number of employees: 000); AST(=Total Assets in USM$); OPX (= Operating expenses in USM$); REV (= total sales revenue in USM$); MKV(=market value in USM$); Three variables including number of employees (EMP), total assets (AST), and operating expenses (OPX) were considered as major input variables that well represent firms’ collective resources and efforts to generate key outputs, revenue (REV) and market value (MKV), in this study. Throughout DEA experiments, these input variables were paired with both output variables to constitute RM model, a base model in this study, and with a single output to form RV model and MV model, respectively. These input/output pairs were further utilized in ANN experiments in a subsequent stage. 4.2 The proposed empirical model
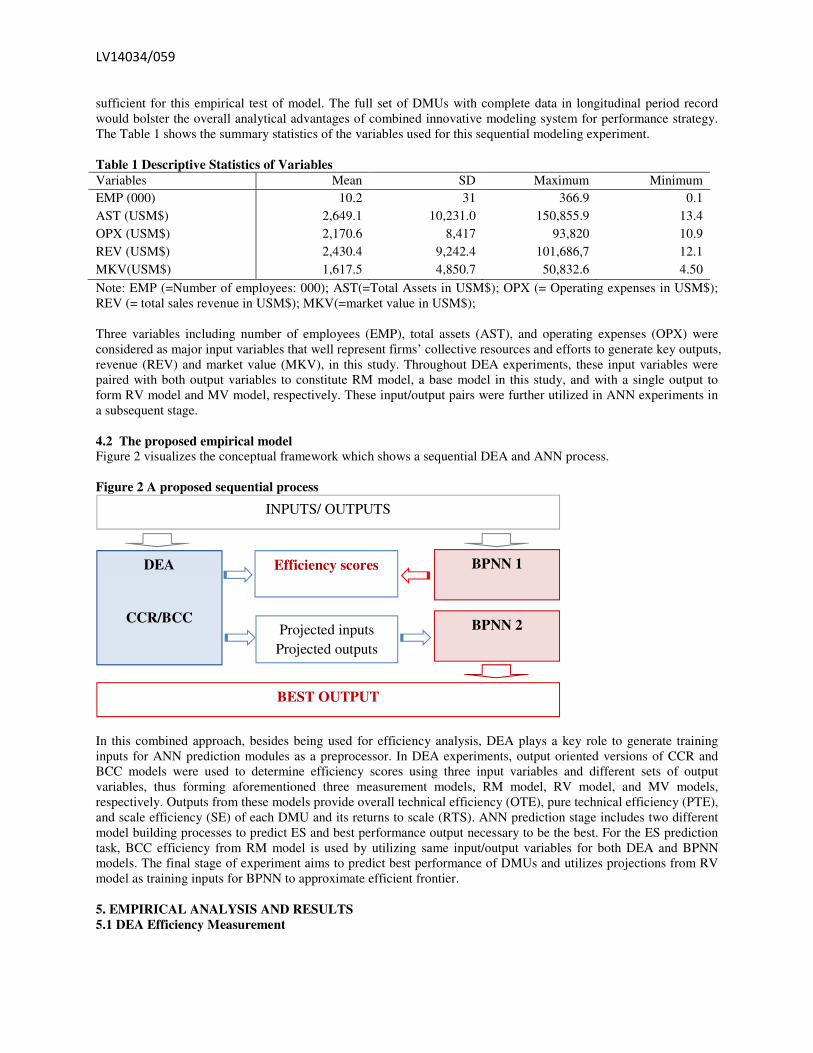
Figure 2 visualizes the conceptual framework which shows a sequential DEA and ANN process.
Figure 2 A proposed sequential process
In this combined approach, besides being used for efficiency analysis, DEA plays a key role to generate training inputs for ANN prediction modules as a preprocessor. In DEA experiments, output oriented versions of CCR and BCC models were used to determine efficiency scores using three input variables and different sets of output variables, thus forming aforementioned three measurement models, RM model, RV model, and MV models, respectively. Outputs from these models provide overall technical efficiency (OTE), pure technical efficiency (PTE), and scale efficiency (SE) of each DMU and its returns to scale (RTS). ANN prediction stage includes two different model building processes to predict ES and best performance output necessary to be the best. For the ES prediction task, BCC efficiency from RM model is used by utilizing same input/output variables for both DEA and BPNN models. The final stage of experiment aims to predict best performance of DMUs and utilizes projections from RV model as training inputs for BPNN to approximate efficient frontier.
5. EMPIRICAL ANALYSIS AND RESULTS
5.1 DEA Efficiency Measurement
Projected inputs Projected outputs
Efficiency scores DEA
CCR/BCC
BPNN 1
BPNN 2
INPUTS/ OUTPUTS
BEST OUTPUT

LV14034/059
Table 2 shows DEA experiment results using CCR-O and BCC-O models. In this experiment, RM model which utilizes revenue and market value as outputs was considered a base model and additional experiments using single output variable were conducted for further analysis by forming RV model and MV model. The DEA CCR model which works on CRS assumptions determines OTE of each DMU and OTE can be decomposed into a product of PTE and SE by using VRS based BCC model. While PTE assesses how efficiently a DMU transforms its input to output without considering the scale effects, SE addresses optimality of the scale of operation. The BCC model figures out RTS in a form of increasing returns to scale (IRS), constant returns to scale (CRS), or decreasing returns to scale (DRS). IRS (CRS, DRS) implies that a DMU operates at a suboptimal (optimal, supra optimal) size and an increase of input scale will result in a bigger (proportional, less) increase of output, respectively.
Table 2 DEA Experiment (Summary)
Measurement Model
Average Efficiency Efficient DMUs RTS
OTE PTE SE CCR BCC IRS CRS DRS
RM 0.829 0.856 0.970 16 58 41 158 1220 RV 0.828 0.853 0.972 10 33 89 116 1214 MV 0.211 0.260 0.879 4 20 119 698 602 Note. RM: revenue and market value, RV: revenue, MV: market value RM model shows lower OTE (0.829) than PTE (0.856) and identifies sixteen and fifty eight efficient DMUs in each measure by using CCR and BCC models, respectively. In this model, 1,220 DMUs (86%) are operating at DRS, thus indicating supra optimal size of operations of Japanese firms in the electronics manufacturing industry in creating revenue and market value. In other words, most of DMUs are not operating at the most productive scale size therefore reduction of excessive resources may contribute to the increase of efficiency. To observe efficiency patterns in generating single output, additional experiments were conducted by using RV and MV models. As shown from the table, RV model shows a similarity to the RM model in terms of average efficiency and DRS dominant operations but with less number of efficient DMUs. In contrast, MV model reveals much lower efficiency levels than RV model while using the same inputs. In addition, number of DMUs at DRS reduced to less than a half with a greater increase of DMUs at CRS and IRS. The results reveal relatively lower efficiency of Japanese firms in this specific industry in adding market value when compared to revenue generating efficiency and, at the same time, pose potential improvement of market value with scale increase due to majority of DMUs operating at IRS or CRS. Overall, these firms in the industry do not seem to properly translate their revenue generating performance into market value creation. From this perspective, financial performance such as revenue can be used as an intermediate output variable and its impact to market value will provide meaningful findings; however, this discussion is beyond the scope of the paper and can be examined in a future research. Table3 shows BCC efficiency trends for 10 year period. RM and MV models exhibit peak efficiency in 2005 and RV model in 2006. Overall efficiency of RM model reveals gradual improvement since 2010. RV model, as discussed earlier, shows higher efficiency scores than MV model throughout the observation period and exhibits consecutive improvement in recent four years. In contrast, MV model reveals overall decrease since its peak in 2005 and reduced to half in recent years. Table 3 BCC Efficiency trends (2003-2012)
Model 2003 2004 2005 2006 2007 2008 2009 2010 2011 2012 RM 0.856 0.854 0.871 0.869 0.854 0.855 0.854 0.850 0.860 0.864 RV 0.833 0.851 0.863 0.864 0.851 0.854 0.840 0.848 0.855 0.863 MV 0.273 0.275 0.389 0.330 0.239 0.194 0.257 0.219 0.197 0.199
5.3 Performance Prediction Using ANN
Efficiency prediction. The second stage of the analysis is centered on exploring predictive potential of ANNs for the development of integrated performance measurement and prediction model as a key empirical process. For this challenging task, three layered BPNN model was used by exploiting its adaptive learning paradigms. The first experiment was aimed at predicting BCC efficiency scores from RM model by taking both DEA input and output variables as BPNN training inputs, thus learning efficiency patterns. For this experiment, the data set was partitioned into training and test data with a 7:3 ratio, therefore 993 DMUs and 426 DMUs were used for the training and test,

LV14034/059
respectively. The adaptive learning capability of BPNN model can be observed by high correlations and low error rates for both training and test data sets as summarized in table 4. Table 4 BPNN performance for efficiency prediction
Data R AAE1 MAE2 DMUs
All 0.985 0.008 0.114 1419
Train 0.985 0.008 0.102 993 Test 0.984 0.008 0.114 426
Note. R: Correlation between actual and predicted efficiency, AAE: Average absolute error, MAE: Maximum absolute error Figure 3 visualizes performance of trained BPNN in terms of error between actual and predicted efficiency score of each DMU. In this figure, DMUs were sorted by the scale of errors. High level of prediction accuracy can be observed from the figure with only six DMUs beyond 10% error and with the maximum error of 17%, corresponding to actual error scale of 0.11. As expected and in consistency with previous literature (Athanassopoulis and Curram, 1996; Ülengin et al., 2011; Pendharkar and Rodger, 2003), the result exhibits a regression type learning of the neural networks which detect central tendency of data set. In this experiment, the BPNN splits 1,419 DMUs into 772 and 647 according to the error determined by under/over predictions. Figure 3 BPNN learning and prediction error
Best performance prediction. Successful implementation of the BPNN model to predict efficiency scores prompted this research to further explore its predictive potential in predicting output, a direct measure of performance beyond efficiency scores. This attempt is motivated by a practical necessity of predicting target output, thus providing managers with adaptive decision support tool in setting performance goals and testing what-if scenarios under volatile business environment. Capability to set and forecast best performance to sustain superiority is a critical necessity which significantly advances performance management paradigm and enables mangers to select actionable measures. For this experiment, RV model was used by taking revenue as a target output to improve. As stated earlier, DEA model not only determines efficiency scores for DMUs but also projects optimal input and output values for each inefficient DMU to become efficient. In this unique modeling approach, DEA projected data is used for neural networks to learn frontier surface and predict best output performance. In this sense, DEA is functioning as a preprocessor for a subsequent prediction module. The developed BPNN model for this task demonstrates high correlation and prediction accuracy of less than 10% error for 95% DMUs as shown in table 5. Table 5 BPNN performance for best performance prediction
Data R AAE MAE DMUs Accuracy
All 0.994 168.3 27,782.4 1419 Error 10% 20% 30% BT 30%
Train 0.993 170.8 27,782.4 993 DMUs 1,343 43 11 22
Test 0.996 162.6 11,991.0 426 (94.6%) (3%) (0.8%) (1.6%)
(0.2)
(0.1)
-
0.1
0.2
1 151 301 451 601 751 901 1051 1201 1351
Pre
dic
tion
err
or
(ES
)
DMUs
Under pred. Over pred.

LV14034/059
Interestingly enough, 31 out of 33 DMUs beyond 20% error happen to be the first 31 smallest DMUs in terms of projected revenue. This implies generalized learning property of ANNs, which makes ANNs learn general patterns rather than memorize specific inputs of extreme or sparsely populated points. Figure 4 BPNN prediction error of best output
For the experiments, DMUs with slacks of up to 50% in number of employees were considered as new test inputs for BPNN prediction module and these DMUs were categorized into five groups depending on their slack levels in 10% interval. Be reminded that BPNN was trained by using slack-adjusted optimal set of data; therefore, these original test inputs with no slack adjustment form new and unseen test cases for the trained BPNN model. Due to inclusion of slacks in test inputs, BPNN is expected to estimate higher output for each DMU than DEA projection. Consequently, BPNN output represents target performance and the gap between these two outputs reveals expected improvement to be made at the cost of maintaining input slacks. Test results are summarized in table 6. Table 6 Target Improvement for Additional Inputs
Slack level (number of employees) Upper limit 10% 20% 30% 40% 50% Number of DMUs 109 142 146 123 141 Average slack 5.06% 15.01% 24.98% 35.08% 44.69% Average improvement 0.37% 1.16% 2.18% 3.25% 4.58%
The table shows average input slacks of DMUs and expected performance improvement in each category. For example, in order to save 50% employees, those DMUs, on the average, need to improve performance by 4.58%. The test results hint managerial flexibility in selecting practically feasible option through what-if analysis by trading off input reductions and output increases. Figure 5 visualizes these test results and shows increasing trend of expected output according to the increase of input level.
Figure 5 Prediction results without slack adjustment
0%30%60%90%
120%150%
1 201 401 601 801 1001 1201 1401
Err
or
sca
le
DMUs (sorted by revenues in ascending order)
0.0%
2.5%
5.0%
7.5%
10.0%
12.5%
1 101
Additio
nal outp
ut
DMU Gp1
Slack: upto10%
1 101
DMU Gp2
Slack: upto 20%
1 101
DMU Gp3
Slack: upto 30%
1 101
DMU Gp4
Slack: upto 40%
1 101
DMU Gp5
Slack: upto 50%

LV14034/059
As observed from the experiment, the BPNN model, especially in combination with DEA, demonstrates its potential usage as an adaptive decision support system in pursuit of improvement initiatives. Despite DEA optimizations being mathematically sound, managerial intuition is highly required to determine whether projections are viable and actionable options. As Mostafa (2007, 2009) points out, it might be practically impossible to achieve DEA targets and DEA does not even consider operational environment and company specific situations. Indeed, discernible decision making rests with managerial intuitions and expertise. From this perspective, the proposed combined model can support managers to opt for a practical solution through adaptive prediction support mechanisms, thus adding feasibility and effectiveness of the proposed model in this research. 6. CONCLUDING REMARKS
This study presents an adaptive performance metric that integrates measurement and prediction capabilities by jointly using DEA and ANN to take advantages of complementing two methods. The emergent methodology introduced in this paper provides a salient modeling approach to support superiority driven best performance benchmarking and performance modeling. Both theoretical and practical contributions have been made in this research. First, the presented approach incorporates measurement and prediction modules to form an integrated performance framework. Furthermore, distinguished from most of previous studies, the proposed approach approximates frontier patterns and predicts best performance output in addition to efficiency score. In so doing, this paper fills the research gap and advances a research in best performance benchmarking and performance modeling arena. Second, the proposed model can solve a traditional theory-practice dilemma and help managers as a useful decision support tool. In reality, managers cannot solely rely on mathematical modeling such as DEA projections; rather they try to tradeoff between theoretical suggestions and managerial intuitions. For example, as in this experiment, managers might consider alternatives to reducing 50% of employees in pursuit of best practice, by balancing levels of input reduction and output increase. In essence, adaptive prediction capability to test hypothetical scenarios is a critical business necessity. Using empirical data and test cases of employee slacks, the proposed model proves effective in this endeavor, therefore can serve as a valuable decision support tool not only in planning but also in implementation stages for progress monitoring. Third, this research paper provides a two stage empirical process with its application to Japanese electronics manufacturing industry. This is a first attempt of using this sequential modeling approach to Japanese manufacturing firms and can be a promising and universal method which invites extended development efforts and empirical applications in the future.
LV14034/059
REFERENCES
Abate, M., Lijesen, M., Pels, E. and Roelevelt, A., “The impact of reliability on the productivity of railroad companies”, Transportation Research: Part E, pages 5141-5149, 2013. Adler, N., Liebert, V., and Yazhemsky, E., “Benchmarking airports from a managerial perspective”, Omega, Volume 41, Number 2, pages 442-458, 2013. Afzal, M. and Lawrey, R., “Evaluating the comparative performance of technical and scale efficiencies in knowledge-based economics in ASEAN: A Data Envelopment Analysis (DEA) application”, European Journal of
Economics, Finance and Administrative Sciences, Number 51, pages 81-95, 2012. Alolayyan, M., Mohd Ali, K., Idris, F. and Ibrehem, A., “Advance mathematical model to study and analyse the effects of total quality management (TQM) and operational flexibility on hospital performance”, Total Quality
Management & Business Excellence, Volume 22, Number 12, pages 1371-1393, 2011. Alpay, S. and Yuzugullu, N., “Dynamic job shop scheduling for missed due date performance”, International
Journal of Production Research, Volume 47, Number 15, pages 4047-4062, 2009. Anand, R.K., “Benchmarking the benchmarking models”, Benchmarking: An International Journal, Vol. 15 No. 3, pages 257-291, 2008. Athanassopoulos, A. D., and Curram, S. P., “A comparison of data envelopment analysis and artificial neural networks as tools for assessing”, Journal of the Operational Research Society, Volume 47 Number 8, pages 1000-1016, 1996. Azadeh, A.A., Saberi, M. M., and Anvari, M. M., “An Integrated Artificial Neural Network Fuzzy C-Means-Normalization Algorithm for performance assessment of decision-making units: The cases of auto industry and power plant”, Computers & Industrial Engineering, Volume 60, Number 2, pages 328-340, 2011. Bhanot, N. and Singh, H. “Benchmarking the performance indicators of Indian Railway container business using data envelopment analysis”, Benchmarking: An International Journal, Volume 21, Number 1, 101-120, 2014. Carlucci, D., Renna, P., and Schiuma, G., “Evaluating service quality dimensions as antecedents to outpatient satisfaction using back propagation neural network”, Health Care Management Science, Volume 16, Number 1, pages 37-44, 2013. Camp, R.C., Business Process Benchmarking: Finding and Implementing Best Practices, Wisconsin: ASQC Quality Press, 1995. Charnes, A., Cooper, W., Wand, E., “Measuring the efficiency of decision making units”, European Journal of
Operation Research”, Volume 2, Number. 6, pages 429-444, 1978. Chen, P., Chang, C., and Lai, C., “Incentive regulation and performance measurement of Taiwan's incineration plants: an application of the four-stage DEA method”, Journal Of Productivity Analysis, Volume 41, Number 2, pages 277-290, 2014. Ciampi, F., and Gordini, N., “Small enterprise default prediction modeling through Artificial Neural Networks: an empirical analysis of Italian small enterprises”, Journal Of Small Business Management, Volume 51, Number 1, pages 23-45, 2013. Emrouznejad, A. and Shale, E., “A combined neural network and DEA for measuring efficiency of large scale data sets”, Computers & Industrial Engineering, Volume 56, Number 1, pages 249-254, 2009. Farrell M.J., “The measurement of productive efficiency”, Journal of the Royal Statistical Society, Series A (III), pages 253-90, 1957. Feli X., S., Siew Hoon, L., and Junwook, C., “Railroad productivity analysis: case of the American Class I railroads,” International Journal Of Productivity & Performance Management, Volume 60, Number 4, 372-386, 2011. Fernandes, E. and Pacheco, R.R., “Efficient use of airport capacity. Transportation Research: Part A: Policy and Practice, 36(3), pages 225-238, 2002. Ferrier, G., and Trivitt, J., Incorporating quality into the measurement of hospital efficiency: a double DEA approach”, Journal of Productivity Analysis, Volume 40, Number 3, pages 337-355, 2013. Francis, G., and Holloway, J., “What have we learned? Themes from the literature on best-practice benchmarking”, International Journal of Management Reviews, Volume 9, Number 3, pages 171-189, 2007. Georges Assaf, A. A., and Gillen, D., “Measuring the joint impact of governance form and economic regulation on airport efficiency”, European Journal of Operational Research, Volume 220, Number 1, pages 187-198, 2012. Georgy, M. E., Luh-Maan, C., and Lei, Z., “Prediction of Engineering Performance: A Neurofuzzy Approach”, Journal Of Construction Engineering & Management, Volume 131, Number 5, pages 548-557, 2005. Haykin, S., Neural Networks: A Comprehensive Foundation, Macmillan Publishing, New York, NY, 1994. Kourentzes, N., “Intermittent demand forecasts with neural networks”, International Journal of Production
Economics, Volume 143, Number 1, pages 198-206, 2013.

LV14034/059
Gok, S., and Sezen, B., “Capacity inefficiencies of teaching and non-teaching hospitals”, Service Industries
Journal, Volume 32, Number 14, pages 2307-2328, 2012. Hsiang-Hsi, L., Tser-Yieth, C., Yung-Ho, C., and Fu-Hsiang, K., “A comparison of three-stage DEA and Artificial Neural Network on the operational efficiency of semi-conductor firms in Taiwan”, Modern Economy, Volume 4, Number 1, pages 20-31, 2013. Huang, Y., Mesak, H. I., Hsu, M. K., and Qu, H., “Dynamic efficiency assessment of the Chinese hotel industry,” Journal of Business Research, Volume 65, Number 1, pages 59-67, 2012. Kuo, C., Hsu, C., Fang, C., Chao, S., and Lin, Y., “Automatic defect inspection system of colour filters using Taguchi-based neural network,” International Journal of Production Research, Volume 51, Number 5, pages 1464-1476, 2013. Kuo, R. J., Wang, Y. C., and Tien, F. C., “Integration of artificial neural network and MADA methods for green supplier selection”, Journal of Cleaner Production, Volume 18, Number 12, pages 1161-1170, 2010. Kwon, H., “Performance modeling of mobile phone providers: a DEA-ANN combined approach”, Benchmarking:
an International Journal, Volume 22, Number 6, 2015. Lau, H. W., Ho, G. S., and Zhao, Y., “A demand forecast model using a combination of surrogate data analysis and optimal neural network approach,” Decision Support Systems, Volume 54, Number 3, pages 1404-1416, 2013. Li, D., and Dai, W., “Determining the optimal collaborative benchmarks in a supply chain,” International Journal of
Production Research, Volume 47, Number 16, pages 4457-4471, 2009. Li, Y., and Liu, L., “Hybrid artificial neural network and statistical model for forecasting project total duration in earned value management,” International Journal of Networking & Virtual Organizations, Volume 10, Number 3/4, pages 402-413, 2012. Liu, J. S., Lu, L. Y., Lu, W., and Lin, B. Y., “A survey of DEA applications”, Omega, Volume 41, Number 5, pages 893-902, 2013. Liu, J. S., Lu, L. Y., Lu, W., and Lin, B. Y., “Data envelopment analysis 1978–2010: A citation-based literature survey”, Omega, Volume 41, Number 1, pages 3-15, 2013. Lozano, S., “Company-wide production planning using a multiple technology DEA approach,” Journal Of The
Operational Research Society, Volume 65, Number 5, pages 723-734, 2014. Lu, W., Wang, W., and Lee, H., “The relationship between corporate social responsibility and corporate performance: evidence from the US semiconductor industry”, International Journal Of Production
Research, Volume 51, Number 19, pages 5683-5695, 2013. Maire, J-L., Bronet, V. and France, A., “A typology of best practices for a benchmarking process”, Benchmarking: An International Journal, Volume 12, Number 1, pages 45-60, 2005. McAdam, R., Hazlett, S.A., and Gillespie, K.A., “Developing a conceptual model of lead performance measurement and benchmarking: a multiple case analysis”, International Journal of Operations & Production Management, Volume 28, Number 12, pages 1153-1185, 2008. Mirhedayatian, S., Azadi, M., and Farzipoor Saen, R., “A novel network data envelopment analysis model for evaluating green supply chain management”, International Journal of Production Economics, Number 147 (Part B), 544-554, 2014. Mostafa, M.M., “Evaluating the competitive market efficiency of top listed companies in Egypt”, Journal of
Economic Studies, Volume 34, Number 5, pages 430-452, 2007. Mostafa, M.M., “A probabilistic neural network approach for modeling and classifying efficiency of GCC banks”, International Journal of Business Performance Management, Volume 11, Number 3, pages 236-258, 2009. Paradi, J. C., Rouatt, S., and Zhu, H., “Two-stage evaluation of bank branch efficiency using data envelopment analysis”, Omega, Volume 39, Number 1, pages 99-109, 2011. Paradi, J. C. and Zhu, H., “A survey on bank branch efficiency and performance research with data envelopment analysis", Omega, Volume 41, Number 1, pages 61-79, 2013. Prašnikar, J., Debeljak, Ž., and Ahčan, A., “Benchmarking as a tool of strategic management”, Total Quality
Management & Business Excellence, Volume 16, Number 2, pages 257-275, 2005. Pastor Tejedor, J. J., Navarro Elola, L. L., and Pastor Tejedor, A. C., “The application of neural networks in the study of the influence of temporality on strategy map indicators in a Spanish hospital”, Total Quality Management
& Business Excellence, Volume 19, Number 6, 643-659, 2008. Pendharkar, P. C., “A hybrid radial basis function and data envelopment analysis neural network for classification”, Computers & Operations Research, Volume 38, Number 1, pages 256-266, 2011. Pendharkar, P. C. and Rodger, J. A., “Technical efficiency-based selection of learning cases to improve forecasting accuracy of neural networks under monotonicity assumption”, Decision Support Systems, Volume 36, Number 1, pages 117-136, 2003.

LV14034/059
Peng, K., Huang, J., and Wu, W., “Rasch model in data envelopment analysis: application in the international tourist hotel industry”, Journal Of The Operational Research Society, Volume 64, Number 6, 938-944, 2013. Pitchipoo, P., Venkumar, P., and Rajakarunakaran, S., “A distinct decision model for the evaluation and selection of a supplier for a chemical processing industry”, International Journal Of Production Research, Volume 50, Number 16, 4635-4648, 2012. Sreekumar, S. and Mahapatra, S.S., “Performance modeling of Indian business schools: a DEA-neural network approach”, Benchmarking: An International Journal, Volume 18, Number 2, pages 221-239, 2011. Sun, L., and Stuebs, M., “Corporate Social Responsibility and Firm Productivity: Evidence from the Chemical Industry in the United States”, Journal Of Business Ethics, Volume 118, Number 2, 251-263, 2013. Tirkel, I., “Forecasting flow time in semiconductor manufacturing using knowledge discovery in databases”, International Journal Of Production Research, Volume 51, Number 18, pages 5536-5548, 2013. Ülengin, F., Kabak, Ö., Önsel, S., Aktas, E., and Parker, B. R., “The competitiveness of nations and implications for human development”, Socio-Economic Planning Sciences, Volume 45, Number 1, pages 16-27, 2011. Wang, C-H, Lu, Y-H, Huang, C-W, and Lee, J-Y., “R&D, productivity, and market value: an empirical study from high-technology firms”, Omega, Volume 41, pages 143-155, 2013. Wang, S., “Adaptive non-parametric efficiency frontier analysis: a neural-network-based model”, Computers &
Operations Research, Volume 30, Number 2, pages 279-296, 2003. Wu, D., Yang, Z., and Liang, L., “Using DEA-neural network approach to evaluate branch efficiency of a large Canadian bank”, Expert Systems with Applications, Volume 31, pages 108-115, 2006. Yi, L. and Thomas, H., “A decision support system for the environmental impact of ICT and e-business”, International Journal of Information Technology & Decision Making, Volume 8, Number 2, pages 361-377, 2009.