application of dcp in prediction of resilient modulus … of dcp in...application of dcp in...
TRANSCRIPT

Application of DCP in Prediction of Resilient Modulus of Subgrade Soils
Louay Mohammad, Ph.D.Louisiana Transportation Research CenterLouisiana State University
2006 Pavement Performance SeminarApril 10, 2006, Ruston, LouisianaApril 11, 2006, Alexandria, LouisianaApril 12, 2006, Baton Rouge, Louisiana

Topics• Background• Objective• Scope• Methodology• Experimental program• Results

What is Resilient Modulus?MR
Stiffness of SoilsUnder Dynamic Loading

Why Resilient Modulus was Selected?• More realistic way to characterize moving
wheel loads
Subgrade
AC
Base

D
TimeStress or load pulse
Deviator stress
Plastic R
Total
P
Resilient
StrainDeformation of soil sample
RD=RM σ
ε
σ
ε
ε
ε
Deviator stress

Where is MR Used?
• Design of New & Rehabilitated pavements• Forensic analysis of Pavement Failures • Quality Control for fill or cut sections

Where is MR Used?• Design of New & Rehabilitated pavements
– LADOTD 1993 AASHTO
( )
log . log ( )
.log
. .
.. log .
.
10 18 10
10
5 19
10
9 36 1
0 20 4 2 15
0 40 10941
2 32 8 07
W Z S SNPSI
SN
M
R o
R
= + + −
+ −⎛⎝⎜
⎞⎠⎟
++
+ −
Δ

Sensitivity Example of Mr to Flexible Pavement Thickness Design (1993)
-4-3-2-1012345
-4 -3 -2 -1 0 1 2 3 4 5 6 7 8
Change in Mr (ksi)
Cha
nge
in o
verl
ay (i
n)

Where is MR Used?• Design of New & Rehabilitated
pavements –M-E Design Guide
• Traffic• Climate• Structure• Thermal

Where is MR Used?• Design of New & Rehabilitated pavements
– M-E Design Guide
Default MREstimated
MRMeasured MRSubgrade
Default MREstimated MRMeasured MRGranular Materials
Default MREstimated MRMeasured MRStabilized Materials
Default EMEstimated EMMeasured EMPCC
Default DM
Estimated DMMeasured DMAsphalt Concrete
InputLevel 3
InputLevel 2
InputLevel 1
Material

Where is MR Used?• Forensic analysis of Pavement Failures
– Assessment of soil conditions – develop an appropriate rehabilitation
strategy

Where is MR Used?• Quality Control for fill or cut sections
– pavement section is designed based upon a targeted resilient modulus

How is Resilient Modulus Determined?• Direct Measurement
– Lab Test: AASHTO T 307– Undisturbed– Disturbed, remolded and compacted
• Reverse Engineering– in-situ
• DCP, Minincone– nondestructive test (NDT) methods
• FWD, Dynaflect
• Prediction– Soil properties
• SSV (DOTD)• other
– Unconfined compressive strength– CBR

Limitations: Direct Measurement
• Direct Measurement– triaxial type of test– Laborious and time consuming– Require advanced testing
equipment– Skilled Personnel

Limitations: MR Predictions Models• Static properties of soils
– SSV, etc: average value for each Parish – Do not represent the dynamic behavior
of traffic loadingMR=1500 + 450[(53/5)(SSV-2)] - 2.5[(53/5)(SSV-2)]2

Alternative InAlternative In--situ Techniquesitu Technique
MR Prediction Models Dynamic cone penetration (DCP)
fast, simple, and economicalGeotechnical investigation

ObjectivesDevelop MR prediction Models
– In-situ• DCP test results• Soil properties
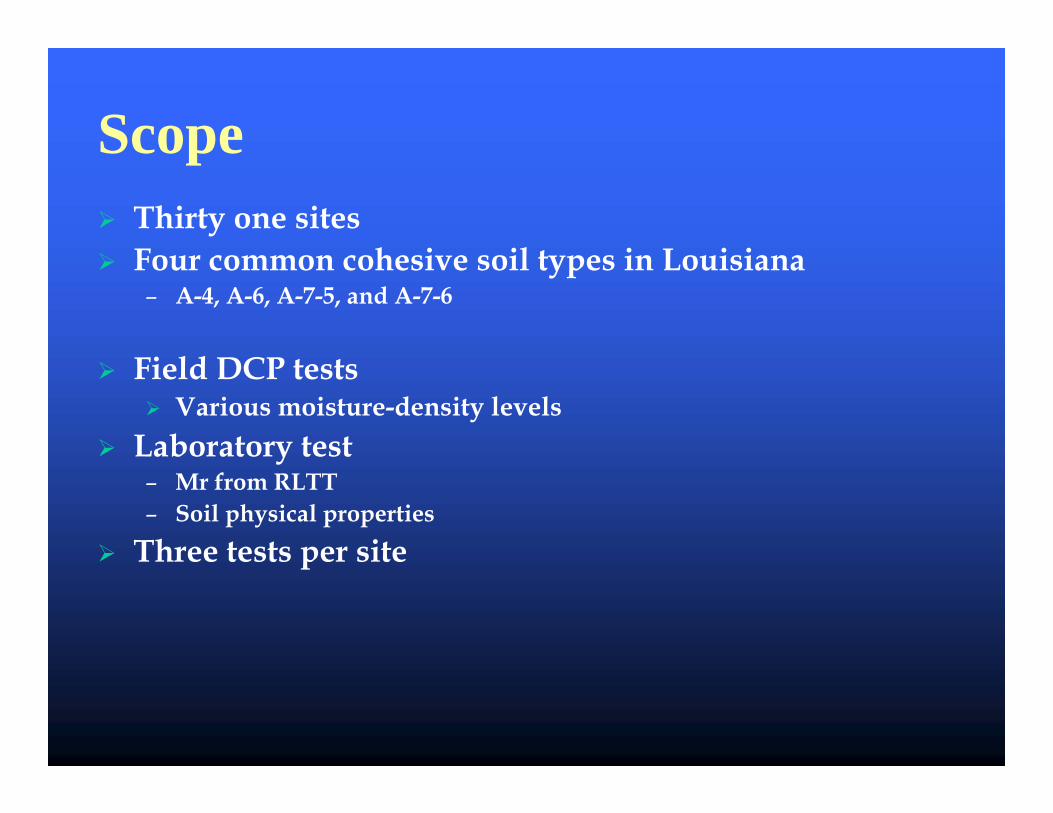
ScopeThirty one sitesFour common cohesive soil types in Louisiana– A-4, A-6, A-7-5, and A-7-6
Field DCP testsVarious moisture-density levels
Laboratory test– Mr from RLTT– Soil physical properties
Three tests per site

EXPERIMENTAL PROGRAM• Field Activities
– Field projects• DCP• Soil Sampling
• Laboratory tests– Repeated load triaxial test– Physical properties– Compaction and strength characteristics

Field Testing Layout• Three sections of testing at each field
project– A, B, and C
• Each section contains nine points
1 2 3 4 5 6 7 8 9
DCP DCP DCP
Core Core Core
Mini-Cone
3' 3' 3' 3' 3' 3'15' 15'
Mini-Cone
Mini-Cone
Set A

-40.0
-30.0
-20.0
-10.0
0.0
10.0
20.0
30.0
0 50 100 150 200 250 300Blow Count
Cum
ulat
ive
Pene
tratio
ncm
Stone
Cement TreatedSubgrade
Compacted Embankment
Blow countD
epth
Dep
th
0
20
40
60
10
30
50
70
5 mm/blow
1 mm/blow
7 mm/blow
Dep
th(c
m)
Dynamic Cone Penetrometer Test: DCPI

Repeated Load Triaxial Test: MR
10 100Deviator stress, σd (kPa)
10
100R
esili
ent m
odul
us, M
r (M
Pa)
Sample depth=0.8 m
Confining stressσc =41.3 kPa
σc =20.7 kPa
σc =0.0 kPa
Silty clay

Relationship B/W Mr and 1/DCPI
R2 = 0.82
0
20
40
60
80
100
0 0.02 0.04 0.06 0.08 0.1 0.121/DCPI, Blows/mm
Mr,
MPa

Development of MR Prediction Models
Moisture ContentDensity
DCPI
MR = f(DCPI, physical properties)M
R

Resilient Modulus Prediction Models
⎟⎠⎞
⎜⎝⎛=
DCPIM R
14.122
Direct Model: R2=0.82
42-97Passing #200 Sieve (%)
8-86Clay (%)9-72Silt (%)22-98LL (%)8-82W (%)50-115γd (pcf)4-61PI (%)
9-85DCPI(mm/blow)
1.0-14Mr (ksi)RangeParameter
Soil Property Model: R2=0.89
⎟⎠⎞
⎜⎝⎛+⎟
⎠⎞
⎜⎝⎛=
wDCPIM d
Rγ42.010.221
32.1

0
40
80
120
0 40 80 120
Measured Mr (MPa)
Pred
icte
d M
r (M
Pa) Modeling
Equality line
Verification
UCL- UpperControl LimitLCL- LowerControl Limit
Measured vs. Predicted: Direct Model
⎟⎠⎞
⎜⎝⎛=
DCPIM R
14.122

Measured vs. Predicted: Soil Property Model
⎟⎠⎞
⎜⎝⎛+⎟
⎠⎞
⎜⎝⎛=
wDCPIM d
Rγ42.010.221
32.1
0
40
80
120
0 40 80 120
Measured Mr (MPa)
Pred
icte
d M
r (M
Pa) Modeling
Equality line
Verification
UCL- UpperControl LimitLCL- LowerControl Limit

0
3
6
9
12
15
0 3 6 9 12 15
Lab Mr (ksi)
Pari
sh M
r (k
si)
Equality Line
7.6-9.2Parish-Mr(ksi)
0.9-14Lab-Mr(ksi)
RangeMr
Measured vs. Predicted: Parish Map

Summary• MR prediction Models were developed
– DCP• Good agreement
– Measured and predicted– Improvement
• Current practice
• Tools– Design of New & Rehabilitated pavements
• Current & M-E Design Guide– Forensic analysis of Pavement Failures – Quality Control for fill or cut sections
⎟⎠⎞
⎜⎝⎛=
DCPIM R
14.122
⎟⎠⎞
⎜⎝⎛+⎟
⎠⎞
⎜⎝⎛=
wDCPIM d
Rγ42.010.221
32.1

Report No. 417
