application of an elongated kelvin model to space … · application of an elongated kelvin model...
TRANSCRIPT

JOURNAL OF SPACECRAFT AND ROCKETS
Vol. 46, No. 2, March—April 2009
Application of an Elongated Kelvin Modelto Space Shuttle Foams
Roy M. Sullivan,* Louis J. Ghosn, t and Bradley A. LerchtNASA John H. Glenn Research Center at Lewis Field, Cleveland, Ohio 44135
DOI: 10.2514/1.37555
The space shuttle foams are rigid closed -cell polyurethane foams. The two foams used mostextensively oil spaceshuttle external tank are BX-265 and NCFL4-124. Because of the foaming and rising process, the foammicrostructures are elongated in the rise direction. As a result, these two foams exhibit a nonisotropic mechanicalbehavior. A detailed microstructural characterization of the two foams is presented. Key features of the foam cellsare described and the average cell dimensions in the two foams are summarized. Experimental studies are alsoconducted to measure the room temperature mechanical response of the two trams in the two principal materialdirections (parallel to the rise and perpendicular to the rise). The measured elastic modulus, proportional limit stress,ultimate tensile strength, and Poisson's ratios are reported. The generalized elongated Kelvin foam model previouslydeveloped by the authors is reviewed and the equations which result from this model are summarized. Using themeasured microstructural dimensions and the measu r ed stiffness ratio, the foam tensile strength ratio and Poisson'sratios are predicted for both foams and are compared with the experimental data. The predicted tensile strength ratiois in close agreement with the measured strength ratio for both BX-265 and NCFI24-124. The comparison betweenthe predicted Poisson 's ratios and the measured values is not as favorable.
NomenclatureA = edge cross-sectional area, Amtb = cell edge length, Am
C, = nondimensional constant relating the edge cross-sectional area to r'-
C2 = nondimensional constant relating the edge momentof inertia to A • r2
C3 = nondimensional constant relating the edge sectionmodulus to A • r
D = unit cell width, AmE = solid material Young's modulus, MPaEx = perpendicular-to-rise direction foam Young's
modulus (along the x direction), MPaEy = perpendicular-to-rise direction foam Young's
modulus (along the y direction), MPaEz = foam rise direction Young's modulus
(along the z direction), MPaG = solid material shear modulus, MPaH = unit cell height, Am1 = edge moment of inertia, Am
Presented as Paper 1786 at the 49th AIAA/ASME/ASCE/AHS/ASCStructures, Structural Dynamics, and Materials Conference, 16th AIAA/ASME/AHS Adaptive Structures Conference, 10th AIAA Non-Determin-istic Approaches Conference, 9th AIAA Gossamer Spacecraft Forum, 4thAIAA Multidisciplinary Design Optimization Specialist Conference,Renaissance Schaumburg Hotel and Convention Center, Schaumbur g , 1L,7-10 April 2008; received 14 March 2008; revision received 15 July 2008;accepted forpublication 13 Au gust 2008. Copyright © 2008 by the AmericanInstitute of Aeronautics and Astronautics, Inc. The U.S. Government has aroyalty-free license to exercise all rights under the copyright claimed hereinfor Governmental purposes. All other rights are reserved by the copyrightowner. Copies of this paper may be made for personal or internal use, oncondition that the copier pay the $10.00 per-copy fee to the CopyrightClearance Center, Inc., 222 Rosewood Drive, Danvers, MA 01923; includethe code 0022-4650/09 $10.00 in correspondence with the CCC.
*Material Research Engineer, Structures and Materials Division,Mechanics and Life Prediction Branch, 21000 Brookpark Road, Mail Stop49-7. AIAA Member.
tPrincipal Engineer, Structures and Materials Division, Ohio AerospaceInstitute, 21000 Brookpark Road, Mail Stop 49-7.
tMaterial Research Engineer, Structures and Materials Division,Mechanics and Life Prediction Branch, 21000 Brookpark Road, Mail Stop49-7.
Ix' = moment of inertia of L,, edges about the neutralaxis parallel to the unit cell x axis, Am
Iy* = moment of inertia of L, edges about the neutralaxis parallel to the unit cell y axis, Am
Ib = moment of inertia of b-length edges about theneutral axis parallel to the unit cell z axis, /tm4
J = edge torsional constant, Am4L = cell edge length, /emLx = L-length edges that bend about the neutral axis
parallel to the unit cell y axis, AmLy = L-length edges that bend about the neutral axis
parallel to the unit cell x axis, Amn = number of measurementsQ = nondimensional cell shape parameter,
Q = b/(L cos 0)Q = nondimensional cell shape parameter,
Q=2+.2_Q=2+( 21,)1(Lcos0)R = average cell aspect ratio, HIDRe = foam stiffness ratio, E, /Ex = EzIEy
Ra= foam strength ratio, oiz^^xx = 6zz^6,,
r = edge cross section characteristic dimension (equalto the cross section radius for a circular or Plateauborder cross section), Am
S = section modulus, /.em3
41 = section modulus of L, edges about the neutral axisparallel to the unit cell x axis, prn'
Syx = section modulus of Lx edges about the neutral axisparallel to the unit cell y axis, Am'
sb = section modulus of b-length edges about theneutral axis parallel to the unit cell z axis, Am
T = nondimensional cell shape parameter,
16 + QZ RZ =16 + (2 + fQ)Rl
X = Cartesian coordinate perpendicular to the risedirection and normal to the v direction
y = Cartesian coordinate perpendicular to the risedirection and normal to the x direction
Z = Cartesian coordinate along the rise direction
Y = foam relative density
9 = inclination angle, deg
vxy = vyx = foam Poisson's ratio in the plane perpendicular tothe rise direction
411
https://ntrs.nasa.gov/search.jsp?R=20090042977 2018-07-09T00:20:10+00:00Z
412
SULLIVAN, GHOSN, AND LERCH
vZX = foam Poisson's ratio for contraction in the xdirection due to tensile loading in the rise direction
vZy = foam Poisson's ratio for contraction in the ivdirection due to tensile loading in the rise direction
vXZ = foam Poisson's ratio for contraction rise directiondue to tensile loading in the x direction
vyz = foam Poisson's ratio for contraction rise directiondue to tensile loading in the v direction
cr, = solid material intrinsic strength, kPa
^xX = foam perpendicular-to-rise direction strength (alongthe x direction), kPa
any = foam perpendicular-to-rise direction strength (alongthe y direction), kPa
vZZ = foam rise direction strength (along the z direction),kPa
I. LitroductionPRAY-ON foam insulation is applied to the exteriorof the spaceshuttle's external tank to limit propellant boil off and to prevent
ice formation. As a result of the catastrophic loss of the Space ShuttleColumbia, numerous studies have been conducted which aim toreduce the likelihood and the severity of foam shedding eventsduring the Shuttle's ascent to space. Some of these studies havefocused on understanding the mechanisms that cause foam fractureand debris liberation. This requires a thorough understanding of thefoam mechanical response behavior and the mechanics of foamfracture.
The space shuttle foams are rigid polyurethane, closed-cell foams.The two foams used most extensively on the space shuttle externaltank are BX-265 and NCFI24-124. NCFI24-124 is applied with anautomated spray process and covers the majority of the exteriorsurface of the tank. The BX-265 is generally sprayed manually with ahandheld spray gun. The microstructure of BX-265 and NCFI24-124foams is illustrated in the photomicrographs shown in Fig. 1. Noticethat both foams possess a distribution of cell sizes and shapes and thatthe cells in both foams tend to have an elongated shape. Because ofthe foaming and rising process, the foam microstructure is elongatedin the rise direction. The elongated microstructure causes the foammechanical response and strength behavior to be nonisotropic.Wright and Lerch [1] measured the average cell dimensions andaverage number of faces per cell in both BX-265 and NCFI24-124using a scanning electron microscope. They found that the average
a) BX-265
b) NCFI24-124Fig. I Photomicrographs of a) BX-265 and b) NCFI24-124.
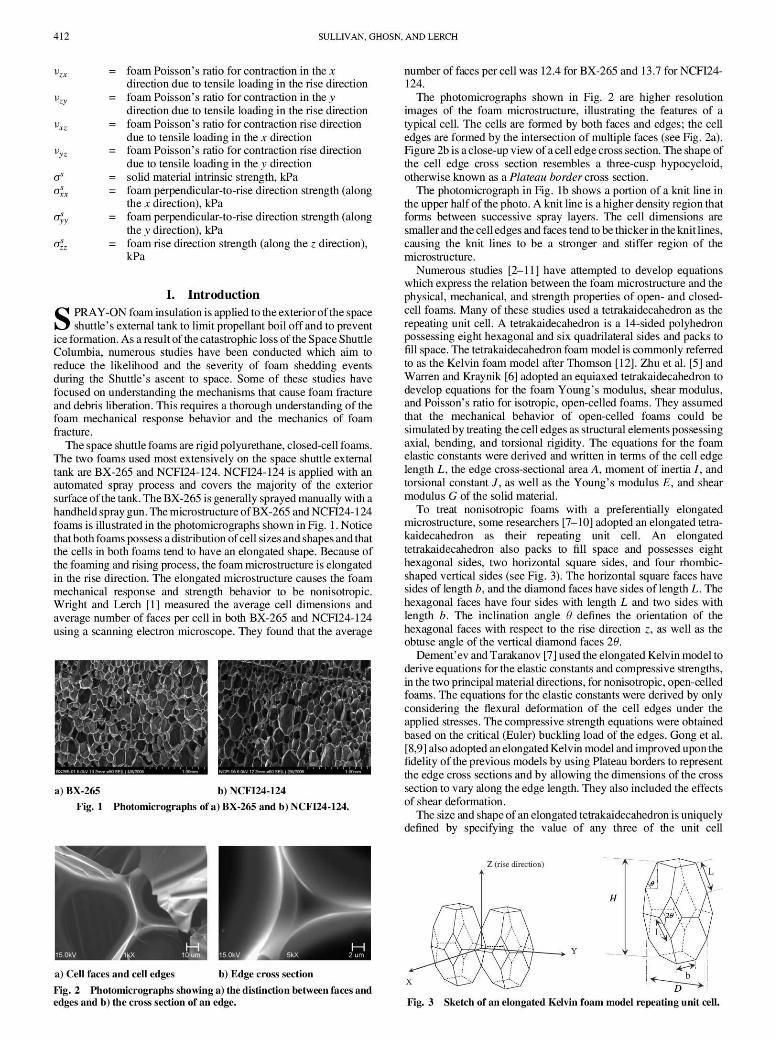
a) Cell faces and cell edges b) Edge cross sectionFig. 2 Photomicrographs showing a) the distinction between faces andedges and b) the cross section of all
number of faces per cell was 12.4 for BX-265 and 13.7 for NCFI24-124.
The photomicrographs shown in Fig. 2 are higher resolutionimages of the foam microstructure, illustrating the features of atypical cell. The cells are formed by both faces and edges; the celledges are formed by the intersection of multiple faces (see Fig. 2a).Figure 2b is a close-up view of a cell edge cross section. The shape ofthe cell edge cross section resembles a three-cusp hypocycloid,otherwise known as a Plateau border cross section.
The photomicrograph in Fig. 1 b shows a portion of a knit line inthe upper half of the photo. A knit line is a higher density region thatforms between successive spray layers. The cell dimensions aresmaller and the cell edges and faces tend to be thicker in the knit lines,causing the knit lines to be a stronger and stiffer region of themicrostructure.
Numerous studies [2—I1] have attempted to develop equationswhich express the relation between the foam microstructure and thephysical, mechanical, and strength properties of open- and closed-cell foams. Many of these studies used a tetrakaidecahedron as therepeating unit cell. A tetrakaidecahedron is a 14-sided polyhedronpossessing eight hexagonal and six quadrilateral sides and packs tofill space. The tetrakaidecahedron foam model is commonly referredto as the Kelvin foam mode] after Thomson [12]. Zhu et al. [5] andWarren and Kraynik [6] adopted an equiaxed tetrakaidecahedron todevelop equations for the foam Young's modulus, shear modulus,and Poisson's ratio for isotropic, open-celled foams. They assumedthat the mechanical behavior of open-celled foams could besimulated by treating thecell edges as structural elements possessingaxial, bending, and torsional rigidity. The equations for the foamelastic constants were derived and written in terms of the cell edgelength L, the edge cross-sectional area A, moment of inertia 1, andtorsional constant J, as well as the Young's modulus E, and shearmodulus G of the solid material.
To treat nonisotropic foams with a preferentially elongatedmicrostructure, some researchers [7-10] adopted an elongated tetra-kaidecahedron as their repeating unit cell. An elongatedtetrakaidecahedron also packs to fill space and possesses eighthexagonal sides, two horizontal square sides, and four rhombic-shaped vertical sides (see Fig. 3). The horizontal square faces havesides of length b, and the diamond faces have sides of length L. Thehexagonal faces have four sides with length L and two sides withlength b. The inclination angle B defines the orientation of thehexagonal faces with respect to the rise direction z, as well as theobtuse angle of the vertical diamond faces 20.
Dement'ev and Tarakanov [7] used the elongated Kelvin model toderive equations for the elastic constants and compressive strengths,in the two principal material directions, for nonisotropic, open-celledfoams. The equations for the elastic constants were derived by onlyconsidering the flexural deformation of the cell edges under theapplied stresses. The compressive strength equations were obtainedbased on the critical (Euler) buckling load of the edges. Gong et a].[8,9] also adopted an elongated Kelvin model and improved upon thefidelity of the previous models by using Plateau borders to representthe edge cross sections and by allowing the dimensions of the crosssection to vary along the edge length. They also included the effectsof shear deformation.
The size and shape of an elongated tetrakaidecahedron is uniquelydefined by specifying the value of any three of the unit cell
Z (rise direction)
Fig. 3 Sketch of an elongated Kelvin foam model repeating unit cell.

SULLIVAN, GHOSN, AND LERCH
413
dimensions H, D, b, L, and 0, because the cell height H and cellwidth D are related to b, L, and 0 by
H = 4L sin 0 and D = 2L cos 0 + fb (1)
Thus, to apply the elongated Kelvin unit cell model to predict foambehavior, one must specify three foam microstructural dimensions todefine the size and shape of the repeating unit cell, in addition tospecifying the edge cross section shape and cross section
dimensions.Previous authors [7-10] have developed their equations by
placing the restriction on the unit cell geometry that bIL = .f cos B.This reduces the complexity of the derivations by reducing thenumber of independent dimensions. However, this restriction on theunit cell shape limits the generality of the model and could jeopardizeits applicability to the widest range of foams.
Recently, Sullivan et al. [11] has developed equations for theelastic constants and tensile stren gths for nonisotropic, open-celledfoams using the most general description of an elongated Kelvin unitcell geometry. Using an approach similar to Zhu et al. [5], equationswere derived and written as a function of the repeating unit celldimensions b, L, and 0, the modulus E, and strength (TI of the solidmaterial and the edge cross section properties. Sullivan et al. [11]demonstrated the effect of this additional variation in the cellmicrostructure on the nonisotropic stiffness and strength behavior.
The objective of this paper is to apply the equations from Sullivanet al. [11] and attempt to model the elastic response and strengthbehavior of the two space shuttle external tank foams: BX-265 andNCFI24-124 foams. In applying the open-cell micromechanicsmodel to simulate the mechanical and strength behavior of theclosed-cell space shuttle foams, we must proceed under the as-sumption that the majority of the solid mass is concentrated in the celledges and that the faces do not contribute significantly to the overallmechanical behavior of these foams.
In this paper, the micromechanics model from Sullivan et al. [1 I ]is first reviewed. We then report on the results of some recentexperimental studies that have been conducted on BX-265 andNCFI24-124 specimens. We report on our efforts to measure theaverage cell dimensions, the average mass density, and the tensilemechanical behavior of the two foams. In the mechanical testing, wemeasured the elastic modulus, the proportional limit stress, theultimate strength, and the Poisson's ratios for the two foams in theprincipal material directions (parallel to the rise and perpendicular tothe rise). The micromechanics model is applied to BX-265 andNCFI24-124 foams. Using some of the measured microstructuraldimensions, the measured relative densities and the ratio of themeasured elastic modulus in the rise direction to that in theperpendicular-to-rise direction, the remaining microstructuraldimensions are predicted. We also predict the ratio of the tensilestrengths in the two directions as well as the Poisson's ratios for bothfoams.
II. Review of the General Micromechanies ModelSullivan et al. [1 l] derived the equations for the elastic constants
and strengths in the principal material directions by treating the celledges as structural members possessing both axial and flexuralrigidity and by applying the minimum potential energy theorem tothe unit cell (Fig. 3) deformation. They developed their equationsusing the simplifying assumption that the edge cross sections wereconstant along the length, and they wrote the equations for the elasticconstants and strengths in terms of the unit cell dimensions b, L, and0, the modulus E, and strength cr' of the solid material and the edgecross section properties. The equations for the elastic constants andthe tensile strengths are listed in the Appendix. Note that, due tosymmetry of the unit cell, E ,, = Ey , V" = vyZ , and ar r = 6 ,.
Under the action of the applied stresses or, vyy, and 6__, the edgeswill experience both axial and flexural deformations. The L-lengthedges will bend about the neutral axis, which is parallel to the unit eel lx or axis (see Fig. 3). Under x-direction loading, half the L-lengthedges will bend about the neutral axis, which is parallel to the unitcell
y axis. We will denote these edges as the L, edges, and we will denotethe moment of inertia and section modulus for this flexuraldeformation as 1-,` and S; `, respectively. Likewise, undery-directionloading, the other half of the L-length edges (L,, edges) will bendabout the neutral axis, which is parallel to the unit cell x axis. We willdenote the section properties for this flexural deformation as I,Y' andSX'. Under z direction loading, both the Lx edges and the Ly edgeswill bend about their respective neutral axes.
Under a perpendicular-to-rise (x or y) direction loading, the b-length edges will bend about the neutral axis, which is parallel to theunit cell z axis. The section properties for this flexural deformationmay be denoted as Ie and Sd. If the Lx edges, the L, edges, and the b-length edges are all assumed to have the same cross section, thenIXY - 1; = Z and S,t' = S; ` - Sb. The equations for the elasticconstants and strengths in the Appendix are therefore written in termsof a single moment of inertia I and section modulus S, where1=Ix =1,'=handS=Sx'=Sy."=5b.
In addition, we note that, for any of the shapes which are typicallyused, the section properties are a function of a single cross sectiondimension. For example, the section properties, for a Plateau bordercross section, are only a function of the cross section radius r, as seenin Fig. 4. We can thus specify all the cross section properties byspecifying the value of the cross section radius. Note also that, if weassume a Plateau border cross section, the section modulus isS= (60 - l l v/_3_n) r r /24.
The tensile strength equations were derived under the assumptionthat foam failure initiated when the maximum stress in any cell edgewas equal to the intrinsic strength of the solid (polyurethane) materialv'. Under loading in the perpendicular-to-rise (x ory) direction, foamfailure may occur due to failure of the L-length edges or the b-lengthedges. As a result, there are two equations listed in the Appendix forthe perpendicular-to-rise direction foam strength. Equation (A3a)will always result in a lower estimate of the perpendicular-to-risedirection strength than Eq. (A3b) as long as the foam microstructureis such that 2S cos 0 + AL sin 0 > vl'2S + Ab/vf2-. If this conditionis met, the edges with length L will fail at a lower applied stress thanthe edges of length b. We will proceed under the assumption that theperpendicular-to-rise direction strength is limited by failure of the L-length edges.
We would like to rewrite the equations in the Appendix in terms ofthe unit cell aspect ratio R and the foam relative density y, which isdefined as the ratio of the foam density to the solid density. Theaspect ratio of the unit cell is simply the ratio of the cell height to thecell width. Using Eq. (1), the aspect ratio may be written as
H 4L sin BR = — _(2)
D 2L cos 0+ fb
Using the unit cell shown in Fig. 3 and assumin g thatthe edge cross-sectional area A is constant along the edge length, the foam relativedensity may be written as
_ 2A(2L + b) 3
y L sin 0(2L cos 0 + b)' ( )^
Sullivan et al. [11] also introduced a new shape parameter whichthey defined as Q = bl(L cos 6). Using this expression, Eq. (2) canbe rewritten as R = 4 tan 0/(2 + v/'2-Q), which leads to
A=(v-3 -,c12)r2
11- 1 = /2_2 =(20,r3-11^^r°/24
S -,=(60-1IV3 -3/24
S1-2= (20,r3- 11,),'/l2
Fig.4 Equations for the crass section properties of a three-cusphypocycloid (Plateau border).

4v03R
(16+ 02R2)(2Q + 16 + 02R2)
A
L2(5)
414
SULLIVAN, GHOSN, AND LERCH
cos B= 4 sing=QR b _ 4Q
16+02R'- V1_6L 71 6=+=j
(4)
where Q = 2 + fQ. Notice that the restriction placed on themicrostructure by previous authors [7-10] is such that Q = .V12.
Using Eq. (2), Eq. (3) can be rearranged to obtainA IL = 8ysin3 B/(2 + b/L)R2 . Upon substituting Eqs. (4), thisbecomes
ERE = =
R2 r(32Q 3 + 62 R2 T)C, + 8C, 63 Ry(8 + Q7')1(2QT + T-)8 4C,T + C2 05 R 3 y/(2QT + 7' 2 ) j
(9)
The strength ratio follows from Eqs. (8a) and (8b) as
__ Q z _ R C 6R + 16Cd"Ro.5 ^1.5 1(2QT2 + 7.3)0.5
RQ 6xx 4 C C, + C3Qzs R 1 s^1s /(2QTz + T3)os
(10)
Defining the constants C,, C2 , and C3 as C, = A/r2 , C2 = 121/Ar2,and C3 = S/Ar, then 121/AL2 = (C2 1C,) • (AIL 2) andS/AL = (C3 1 C,) A/L 2 . Substituting these relations along withEqs. (4) and (5), the expressions in the Appendix for the elasticconstants and strengths may be written in terms of the two shapeparameters R and Q and the relative density y as
Ez = C2 05 R3)121 ( 2 Q + T)2 (6a)
E 4C,T + C,QS R 3 y/(2QT +T2)
Ex _ 8C20'R),21(2Q + T )2E (32Q 3 + 02 R2 T)C, + 8C' 03 Ry(8 + Q7')1(2Q7 + 7,2)
(6b)
8Q[4C,Q 2 - C263R yl (2Q + T)]Vim' _ (32Q 3 + 0 2 R 2 T)C, + 8C203Ry (8 + QT)l (2 Q T + T2)
(7a)
4Q[TC, — 4C2 Q3 Ry/(2QT + T2)]vxz = (32Q3 + 02 R 2 T)C, + 8C2 03 Ry(8 + QT)1(2Q7' + 7,2)
(7b)
_ QR2 [C, -4C203Ryl(2QT2+T3)] (7c)vu8C, + 2C205R3yl(2Q 72 + T3)
6s _ C3 Q2-5R1.5 y1.5
r I.5 5 1.5 U.5 T3 )0.5] (8a)(2 Q + T) [ C 1 + C3Q - . R y l(2QT- +
6xx
(F
4C302.5 R1.5.y1.5
R(2Q + 1OR + 16C3 0 1.5 Ro.5 YP.5 1(2QT2 + T3)a5]
(8b)
where T =16 + Q R2For a Plateau border cross section, the constants are
C, = f v/2, C2 = (20 1 3— I1n)/(2f — rc), and C3=(60 — I I frr)/24(f — r/2).
The ratio of the stiffness in the rise direction to the stiffness in theperpendicular-to-rise direction can be written using Eqs. (6a) and(6b) as
III. Experimental StudiesThe foam microstructure is dependent on many variables such as
the geometric constraints imposed on the foam during the foamingprocess, the ambient temperature, and the ambient relative humidity.As such, there can be considerable variation in the microstructuralfeatures between two spray applications of the same foamformulation. To address this, samples for the microstructuralmeasurements and mechanical properties were excised from thesame block of foam. The mass density was measured on the tensiletest specimens before performing the tensile tests. Thus, the density,the average microstructural dimensions, and the average tensileproperties were measured from the same spray block. Thiseliminated any error associated with spray-to-spray variability.
Although the tensile specimens contain knit lines, the volume ofthe knit lines is only a small fraction of the specimen volume. Weassume that the knit lines do not significantly affect the measureddensity, mechanical behavior, or strength of the specimens.
A. Microstructural Characterization
We measured the average cell height and average cell width in theBX-265 and NCFI24-124 spray blocks using a scanning electronmicroscope. We also measured the average cross section radius in theNCFI24-124 block. Unfortunately, we did not measure the averagecross section radius in the BX-265 block. The results of themicrostructural measurements are summarized in Table 1, where theaverage values are listed for each of the foams along with the numberof measurements taken n to obtain each average value. Table I alsolists the average aspect ratio R = HID for each foam. It appears thatthe cells in NCFI24-124 are more elongated than the cells in BX-265.
B. Mechanical Property Testing and Density Measurements
Specimens were excised from the BX-265 and NCFI24-124blocks for mechanical property testing. The room temperature tensilestress-strain behavior of BX-265 and NCFI24-124 was measuredusing 50.8-mm-long (2.0 in.) parallelepiped specimens. TheBX-265specimens had a square cross section with the dimensions of 12.7 x12.7 mm (0.5 x 0.5 in.) and the NCFI24-124 specimens had arectangular cross section with the dimensions of 15.24 x 10.16 mm(0.6 x 0.4 in.). To measure the material response in both materialdirections, specimens were cut so that the length dimension wascoincident with the rise and perpendicular-to-rise directions.
The samples were glued to aluminum platens using epoxy andtested in a standard load frame. A stroke rate of 0.762 mm per minutewas employed. A calibrated 222.4 N (50 ]b) load cell was used tomeasure loads. Displacement was measured using both a linearvariable displacement transducer (LVDT) associated with the loadframe and a laser micrometer, which read the distance between twoHags glued onto the sample. Both methods gave similar values.However, only the strains calculated from the LVDT will be usedhere, as the LVDT method resulted in a larger signal-to-noise ratio.
The tensile stress-strain curves are shown in Fig. 5. Figure 5ashows the BX-265 stress-strain response in the perpendicular-to-riseand rise direction, and Fig. 5b shows the NCFI24-124 results. Notethat the strength and stiffness in the rise direction is considerablyhigher than in the perpendicular-to-rise direction for both materials.

failed at the glue line. In two of these tests (TI and T5), the adhesivedid not fully cure, which led to premature separation of the glue. AllNCF124-124 specimens failed in the gauge section.
In some of the tensile tests, the lateral strain in the specimen wasalso measured to determine the Poisson's ratios. The test specimensthat were used to measure the Poisson's ratios are identified byfootnote markers in Tables 2 and 3. The lateral strains were measuredusing a high-resolution noncontacting laser micrometer. Multiplelateral strain measurements were made within the same specimen atvarious locations within the gauge section. The Poisson's ratio foreach specimen was calculated from the average lateral strain in thespecimen divided by the measured longitudinal strain. The measuredPoisson's ratios are listed in Table 4 along with the standarddeviations.
The ratio of the modulus in the rise direction to that in theperpendicular-to-rise direction, as well as the ratio of the strengths inthe two material directions, is indicative of the extent of elongation of
0.45
0.4
0.35
0.3a
0.25
0.2
0.15
0.1
0.05
0
0
NCFI24-124
0.01 0.02 0.03 0.04
Strain
SULLIVAN, GHOSN, AND LERCH 415
Table 1 Summary of nricrostructural measurements
Cell height, H Cell width, D Edge cross section radius, r Aspect ratio R = HID
Avg., µm n Avg., /,cm n Avg., µm n
BX-265 193 100 136 100 NAB 1.42NCFI24-124 248 100 142 100 26.0 27 1.75
Data not available.
Table 2 Summary of tensile test results on BX-265
Specimen Density, g/cm3 No. of knit lines E, Wa PL, kPa UTS, kPa Fail location
L2 0.0405 3.0 8.21 227.5 359.8 GaugeL3 0.0368 2.0 6.82 165.4 3019 GaugeL4' 0.0378 2.0 7.12 179.2 357.1 Gauge
Perpendicular to rise L5 0.0368 1.0 6.69 137.9 312.2 GaugeL6-l a 0.0362 1.7 6.60 179.2 268.8 GaugeL7 0.0373 1.0 6.71 151.6 316.4 GaugeAvg. 7.03 173.5 319.4
T1 0.0370 7.5 13.08 Glue lineT2 0.0376 8.5 15.47 324.0 575.6 GaugeT3 0.0357 6.5 12.66 303.3 526.6 GaugeT4 0.0353 6.0 13.58 317.1 -- Gauge at flag glue line
Rise T5 0.0367 7.0 12.16 Glue lineT6 0.0376 8.0 14.82 317.1 565.2 GaugeTT 0.0337 3.0 12.33 Glue lineT8a 0.0370 4.0 14.14 -- Glue lineAvg. 13.53 315.4 555.8BX Avg. 0.0369
'Specimen used for Poisson's ratio measurements
Also, both materials exhibit an initial linear region followed by anonlinear response leading up to failure. The nonlinear behavior ofBX-265 is much more pronounced than NCFI24-124.
The initial modulus and proportional limit was estimated for eachspecimen from the stress-strain curves shown in Fig. 5. Theestimated initial modulus, the estimated proportional limit (PL), andultimate tensile strength (UTS) for the BX-265 and NCFI24-124tensile tests are summarized in Tables 2 and 3, respectively. Alsolisted in Tables 2 and 3 are the density of the specimen, the number ofknit lines in the specimen, and the location of fracture. The averagedensity of the BX-265 and NCFI24-124 test specimens is0.0369 g/cm3 and 0.0373 g/cm3 , respectively. Assuming a densityof 1.2 g/cm 3 for polyurethane, the relative density of both BX-265and NCFI24-124 is approximately 0.03 1.
A large number of the BX-265 rise direction specimens failedprematurely and, as a result, the strength values associated with thesetests are not reported in Table 2. In all of these tests, the specimens
0
0 0.02 0.04 0.06 0.08 0.1 0.12 0.14
Strain
0.7
0.6
0.5
0.4
ai 0.3
C0.2
0.1
a) BX-265 b) NCF124-124
Fig. 5 Stress vs strain curves from tensile tests on a) BX-265 and b) NCFI24-124.

416 SULLIVAN, GHOSN, AND LERCH
Table 3 Summary of tensile test results on NCF124-124
Specimen Density, , /cm ; No. of knit lines E, MPa PL, kPa UTS, kPa Fail location
L1 0.0367 2.1 7.09 131.0 182.7 GaugeL2 0.0393 2.2 7.53 103.4 227.5 GaugeL3 0.0385 2.6 7.49 110.3 208.2 Gauge
Perpendicular to rise L4 0.0382 2.8 7.73 117.2 220.6 GaugeL5' 0.0369 2.0 6.54 75.8 148.2 Gauge
L5-2a 0.0369 2.0 6.56 117.2 157.8 GaugeL6-4a 0.0370 2.0 6.52 124.1 172.3 GaugeAvg. 7.07 111.3 188.2
T1 0.0367 7.0 20.35 220.6 360.5 GaugeT2 0.0350 7.0 20.27 255.0 377.7 GaugeT3 0.0364 8.0 19.90 248.1 330.2 Gauge
Rise T4 0.0364 8.0 20.95 248.1 382.6 GaugeT6a 0.0390 4.0 22.52 282.6 426.0 Gauge
Avg. 20.80 250.9 375.4NCFI Avg. 0.0373
'Specimen used for Poisson's ratio measurements
Table 4 SUmmal'V' of measured Poisson's ratios
Specimen Avg. measured Poisson's ratio Standard deviation
v y. L6-1 0.355 0.06
BX-265 °xz L4 0.273 0.0007v T7 0.536 0.29V, T8 0.675 0.17vxy L6-4 0.382 0.14
NCFI24-124v,z L5 0.183 0.04vx, L5-2 0.160 0.03v, K T6 0.641 0.10
Table 5 Strength and stiffness ratios from tensile test results
Stiffness ratio Proportional limit ratio Ultimate tensile strength ratio
BX-265 1.92 1.82 1.74NCF124-124 2.94 2.25 1.99
the cells. The stiffness and strength ratios were calculated from theaverage strengths and average moduli listed in Tables 2 and 3. Theseare listed in Table 5. Because the stiffness and strength ratios for BX-265 are lower than for NCFI24-124, one would expect that an"average" cell in the NCFI24-124 specimens is more elongated thanin the BX-265 specimens. This is consistent with the measuredaverage aspect ratios listed in Table 1.
IV. Application of the Model to BX-265and NCFI24-124
Using Eq. (9), the stiffness ratio R E is plotted in Fig. 6 as a functionof the aspect ratio R for various values of the shape parameter Q. APlateau border cross section and a relative density of 0.03 have beenassumed. We have also plotted the measured stiffness ratio versus theaverage measured aspect ratio for BX-265 and NCFI24-124 asindividual data points. These results indicate that Q N 1 for BX-265and Q < 1 for NCFI24-124.
The value of Q was obtained for BX-265 and NCFI24-124 bysolving Eq. (9) using the measured values for y, R, and R E . Once thevalue of Q was obtained, the tensile strength ratio R Q for the twofoams was calculated from Eq. (10). The results of these calculationsare summarized in Table 6. The measured strength ratios fromTable 5 are also included for the sake of comparison. There is goodagreement between the predicted strength ratios and the measureratios for both BX-265 and NCFI24-124. In particu lar, the agreementbetween the predicted strength ratios and the measured proportionallimit strength ratios are quite good.
The edge length b was calculated from b = D/(-,1-2 + 21Q),which is obtained from the second expression in Eq. (1) and from the
expression Q = b /(L cos B). The edge length L was then determined
from b/L = 4Q1 16 + Q'R Z, and the inclination angle 0 was
determined from cos 0 = b/QL. The predicted cross section radius rwas calculated from A= C I r2 = yRD 3 /(16L + 8b), which isobtained from Eqs. (2) and (3).
Plateau Border Cross-sections, y = 0.03
oC 60 5M
°C 4NN
3
Fn 2
1.00 1.20 1.40 1.60 1.80 2.00 2.20
Aspect Ratio, R
Fig. 6 Plot of the stiffness ratio RE vs cell aspect ratio R for variousvalues of the shape parameter Q, assuming Plateau border crass sectionand a relative density of y = 0.03. Individual data points indicate themeasured stiffness ratio and average measured aspect ratio for BX-265and NCFI24-124.

Analysis results
BX-265 NC17I24-124
y 0.031 0.031D, µm 136 142
Input parameters R 1.42 1.75RE 1.92 2.94
Q 1.0747 0.7765R Q 1.75 2.34
b, µm 41.5 35.6L, µm 61.8 77.2
r, µm 22.8 25.2Model results 0, deg 51.33 53.57
2S cos 0 + AL sin 0, µm3 4134.0 6475.2,11-2-S+Ab/ /4µtn3 2560.9 2714.2
VXy 0.177 0.060vX, 0.422 0.373v„ 0.811 1.097
SULLIVAN, GHOSN, AND LERCH
417
Table 6 Summary of analysis results and comparison to measurements
Measured values
BX-265 NCFI24-124
BX-265 NCFI24-124
1.82 PL 2.25 PL1.74 UTS 1.99 UTS
35.0° NA''63.0' NA18.0 1 26.0NA NA
0.355 f 0.06 0.382 f 0.14
0.273 f 0.0007 0.183 f 0.04; 0.160 f 0.030.536 f 0.29: 0.675 f 0.17 0.641 f 0.10
'Meastuements from another BX-265 spray block'Data not available.
The predicted edge lengths and cross section radius for BX-265and NCFI24-124 are listed in Table 6. The predicted edge crosssection radius for NCF124-124 compares very well with themeasured average radius. Unfortunately, we do not currently have ameasurement of the average edge lengths for this block of NCF124-124. We also do not have a measurement of the average edge lengthsand average cross section radius for the specific block of BX-265 thatwas the subject of this study. We have obtained measurements of theaverage edge lengths and the average cross section radius in anotherblock of BX-265 (see [13]). These measurements are shown inTable 6 in bold print. Note that the predicted values for the BX-265edge lengths and cross section radius are close to the aveface valuesmeasured in the other block of BX-265. This provides us with furthervalidation of the micromechanics model and its application to thesetypes of foams.
Notice that the microstructure of both foams is such that2S cos 0 + AL sin 0 > f5' + Ab/ f. Thus, we are justified inusing Eq. (A3a) to represent the perpendicular-to-rise directionstrength in calculating the foam strength ratios.
The predicted values of the Poisson ratios vXy , vXZ , and v, areobtained from Eqs. (7a-7c), respectively. The predicted Poisson'sratios are listed in Table 6 along with the measured values fromTable 4. Note that the predicted values for the Poisson's ratios do notagree with the measured values. For both foams, the predicted valuesfor i X,, are significantly lower than the measured values, and the pre-dicted values for vXz and vZX are significantly higher than themeasured values. In all cases except one ( vZX for BX-265), thepredicted Poisson's ratios fall outside the range of values establishedby the measured average value plus or minus one standard deviation.The most likely reason for the poorcorrelation between the measuredand predicted Poisson's ratios is that the open-celled micro-mechanics model neglects the effect of the cell faces and, in reality,the strain energy of the cell faces will effect the unit celldisplacements in the direction normal to loading. We have recentlyperformed finite element analysis of an elongated Kelvin unit cellwith and without the cell faces [13]. The results of these finiteelement analyses [13] reveal that the effect of including the cell facesin the model is to increase the value of VX, and to decrease the valuesof vXZ and vZX.
V. Conclusions
Using the average measured cell dimensions H and D, the averagemeasured density and the measured stiffness ratio R E , the equationswhich result from the general elongated Kelvin micromechanicsmodel were successfully applied to predict the measured tensilestrength ratio of BX-265 and NCFI24-124. These equations were
also successful in predicting other microstructural dimensions, suchas the edge lengths b and L and the edge cross section radius r.Consequently, we could expect that, given the average values forfour of the microstructural dimensions, the model would predict themeasured stiffness ratio and measured tensile strength ratio of thesetwo foams. If the modulus and strength of the solid material is known,the model would then be capable ofpredicting the foam modulus andstrength in the principal material directions. We thus conclude thatthe general elongated Kelvin foam model is a convenient tool forestimating the foam strength and stiffness from the average micro-structural dimensions.
The comparison between the predicted Poisson's ratio and themeasured values was not as favorable. The micromechanics modelpredicted a value for vxy , which was less than the measured value forboth BX-265 and NCFI24-124. Conversely, the model predictedvalues for vX, and vZX that were greater than what was measured forboth foams. The reason for this discrepancy is due to the fact that thecurrent micromechanics model neglects the cell faces and we believethe cell faces have a significant effect on the strains transverse to theloading direction.
Finally, we note that the microstructure of the BX-265 andNCFI24-124 foams appears to have a shape parameter Q = 1.075and Q = 0.777, respectively. Thus, a model which restricts thefoam microstructure to Q = v^2_ is inappropriate for BX-265 andNCFI24-124.
Appendix: Summary of the Equations for the ElasticConstants and Strengths
From Sullivan et al. [111, we summarize the equations for theelastic constants and strengths written in terms of b, L, 0, A,1, and S.
Young's modulus:
12EIE.Y = Ey = L sin 9[2L 3 sin2 9 + b3 + (121/A)(2Lcos2 0 + b)]
(Ala)
24E1 sin 9Ez =(A 1 b)
L2 [cos1 9 + (121 /AL')sin2 0](^L cos 0 + b)2
Poisson's ratio:
b(AbZ - 121)v '' = vy'X - 121(2Lcos 2 9 + b) + A(2L 3 Si11 2 9+ b3)
(A2a)

418
SULLIVAN, GHOSN, AND LERCH
(AL2 — 127) (2L cos B + fib) cos B
vy' 2[127(2Lcos2 B+ b) +A(2L 3 sin2 B+ 63)] (A2b)
v = v =fL(ALZ — 127) cos Nin2B (
A2c )zy (127sin 2 o + ALz cosz B)(.f L cos B + h)
Strength:
x or y direction (failure of L-length members):
t — s m`o.Yx vyy [(L
cos Bsin BSA) + (L' sin 2 0/2S)](2L cos B + .f b)
(A3a)
x or y direction (failure of b-length members):
ra.r
zx — )) —v ^-rl
^" [(L sin H/A) + (Lb sin 012S)](2L cos B +
(A3b)
z direction:6s
azzs
[(sin 0/2A) + (L cos B/4S)](f L cos B + b)2(A3c)
Acknowledgment
The authors are grateful for funding from the External TankProject under NASA's Space Shuttle Program.
References
[11 Wright, L. S., and Lerch, B. A., "Characterization of Space ShuttleInsulative Materials," NASA TM-2005-213596, April 2005.
[2] Gent, A. N., and Thomas, A. G., "The Deformation of Foamed ElasticMaterials," Journal of Applied Polymer Science, Vol. 1, No. 1, 1959,pp. 107-113.doi: 10.1002/app. 1959.070010117
[3] Huber, A. T., and Gibson, L. J., "Anisotropy of Foams," Journal of
Materials Science, Vol. 23, No. 8, 1988, pp. 3031-3040.doi: 10.1007/6 F00547486
[4] Gibson, L. J., and Ashby, M. F., Cellular Solids: Structure andProperties, 2nd ed., Cambridge Univ. Press, Cambridge, England, UK,1997.
[5] Zhu, H. X., Knott, J. F., and Mills, N. J., "Analysis of the ElasticProperties of Open-Cell Foams with Tetrakaidecahedral Cells,"Journal of the Mechanics and Physics of Solids, Vol. 45, No. 3, 1997,pp. 319-343.doi:10.1 0 1 6/5002 2-509 6(96)00090-7
[6] Warren, W. E., and Kraynik, A. M., "Linear Elastic Behavior of a Low-Density Kelvin Foam with Open Cells,".Ioaernal ofAppliedMechanics,Vol. 64, No. 4, 1997, pp. 787-794.doi: 10.1115/1.2788983
[7] Dement'ev, A. G., and Tarakanov, O. G., "Model Analysis of theCellular Structure of Plastic Foams of the Polyurethane Type,"Mekhanika Polimerov, Vol. 5, Sept.—Oct. 1970, pp. 859-865; also inPolymer Mechanics, Vol. 6, No. 5, 1970, pp. 744-749 (in English).doi: 10.1007/B F00856206
[8] Gong L., Kyriakides, S., and Jang W. Y., "Compressive Response ofOpen-Celled Foams, Part I: Morphology and Elastic Properties,"huernational.loaiinal of Solids and Structures, Vol. 42, Nos. 5-6,2005,pp. 1355-1379.doi:10.1016/j.ijsolstr.2004.07.023
[9] Gong, L., Kyriakides, S., and Triantafyllidis, N., "On the Stability ofKelvin Cell Foams Under Compressive Loads," Journal of theMechanics and Physics of Solids, Vol. 53, No. 4, 2005, pp. 771-794.doi: 10. 101 6/j .j m p s. 2004.10.007
[101 Ridha, M., Shim, V. P. W., and Yang, L. M., "An ElongatedTetrakaidecahedral Cell Model for Fracture in Rigid PolyurethaneFoam," Key Engineering Materials, Vols. 306-308, Pt. 1, 2006, pp. 43-48, http://www.scientific.net .
[11 1 Sullivan, R. M., Ghosn, L. J., and Lerch, B. A., "A GeneralTetrakaidecahedron Model for Open-Celled Foams," InternationalJournal of Solids and Structures, Vol. 45, No. 6, 2008, pp. 1754-1765.doi: 10.1016/j .ij solstr.2007.10.028
[12] Thomson, W., Lord Kelvin, "On the Division of Space with MinimumPartitional Area," Philosophical Magazine, Vol. 24, No. 151, 1887,pp. 503-514, http://zapatopi.net/kelvin/papers/on_the—division—of -space.html.
[13] Sullivan, R. M., Ghosn, L. J., Lerch, B. A., and Baker, E. H., "AnElongated Tetrakaidecahedron Micro-Mechanics Model for SpaceShuttle External Tank Foams," NASA TP-2008-215137, 2008.
L. PetersonAssociate Editor