application notes handbook - gilson springsummer app... · analysis of sucralose in water by liquid...
TRANSCRIPT

Application Notes HandbookPipettes | Purification | Solid Phase Extraction | Liquid Handling
2012–Volume 2 Issue 1

2 3
About Gilson
Gilson has worldwide sales and service supporting the pharmaceutical, biotech, environmental, clinical, food & beverage, and forensic laboratories. Our primary focus is on purifying samples via preparative HPLC, automated and manual liquid handling, automated SPE, and GPC clean-up.
Gilson pipettes and automated instruments support a large variety of applications in numerous markets. This Application Notes Handbook provides some examples of applications for different laboratories. This handbook is published on a bi-yearly basis to keep scientists updated with current liquid handling and sample preparation methods.
Gilson Knowledge [email protected]: 800-445-7661 | Fax: 608-831-4451
There is an extensive education and training program available from the Gilson Knowledge Center. The program offers complimentary Instrument TechTips and web seminars, along with additional options for personalized web-based training, local hands-on workshops, and on-site training. Contact the Gilson Knowledge Center for additional Information.
Gilson, Inc. World HeadquartersPO Box 620027 | Middleton, WI 53562-0027, USATel: 800-445-7661 | Fax: [email protected] | [email protected] | [email protected] | [email protected]
Gilson S.A.S.19, avenue des Entrepreneurs | BP 145, F-95400 VILLIERS LE BEL, FRANCETel: 33-(0)1-34295000 | Fax: 33-(0)1-34295020
Table of Contents
Environmental Automated Solid Phase Extraction Method for the Determination of Pesticides in Tea using GC-MS/MS Analysis of Sucralose in Water by Liquid Chromatography/Time-of-Flight Mass Spectrometry (LC/TOF-MS) After Automated Solid Phase Extraction
Food & Beverage The Impact of Sample Temperature and Pipetting Modes on Volumetric Pipetting Accuracy of Positive and Air Displacement Pipettes Automation of AOAC 970.16 Bitterness of Malt Beverages and AOAC 976.08 Color of Beer Through Unique Software Control of Common Laboratory Instruments with Real-Time Decision Making and Analysis The Impact of Environmental Influences on Volumetric Pipetting Accuracy of Air Displacement Pipettes
Clinical/Forensic Automation of a Solid Phase Extraction Multi-Method for GC/MS Analysis of Drugs of Abuse in Human Serum Automated Solid Phase Extraction of THC and Metabolites from Whole Blood using the Gilson GX-274 ASPEC™ Improving Laboratory Efficiency & Flexibility with Automated Sample Preparation Systems - The Impact of the Gilson GX-281 Dual Z-Arm Weighing Station
Pharmaceutical Natural Product Purification of Lycopene and β-Carotene Using Flash Column Sample Clean-up Prior to High Pressure Normal Phase Chromatography on the Gilson PLC 2020 Automated High Throughput Separation of Crude Extracts into Fractions for HTS Primary Screening Analysis of Extract from Marine Yeast with Semi Micro 2D HPLC System
Resources
1
6
13
16
22
25
29
35
41
4955
59
i ii
Experimental Conditions
A Gilson GX-271 Liquid Handler with 402 Dual With Tee Syringe Pump was used to automate a Solid Phase Extraction (SPE) method for the extraction of pesticides from tea samples. The extracted pesticide samples were then analyzed by GC-MS/MS (Figure 1). The scope of the investigation included roughly 80 relevant pesticides (organophophorous, organochlorine, pyrethroids, etc.), and the method has been tested in several tea varieties (green tea, mate tea, herbal tea, black tea and chamomile).
Materials• GX-271 Liquid Handler with 402 With Tee Dual Syringe Pump • SPE Cartridges: Phenomenex Strata™ SI-1 Silica (55 µM, 70 Å) 1 g/6 mL• SPE Solutions
• Toluene• Acetonitrile:Acetone (4:1)
• GC- MS/MS (Waters Quattro micro GC™)
Method• Weigh 1 g of tea sample spiked with pesticide standard
• Add 10 mL of toluene• Shake for 1 hour
• Spin at 5000 rpm for 5 minutes• Filter the extract• Reduce filtrate to 1.5 mL in Turbovap®• Automated SPE (using Gilson)
• Load: 1.5 mL sample extract• Elution 1: Toluene• Elution 2: Acetonitrile:Acetone (4:1)
• Reduce to dryness with Turbovap• Reconstitute in Acetonitrile• Filter the extract• Transfer into ALS vial• Analyze by GC-MS/MS
4 5
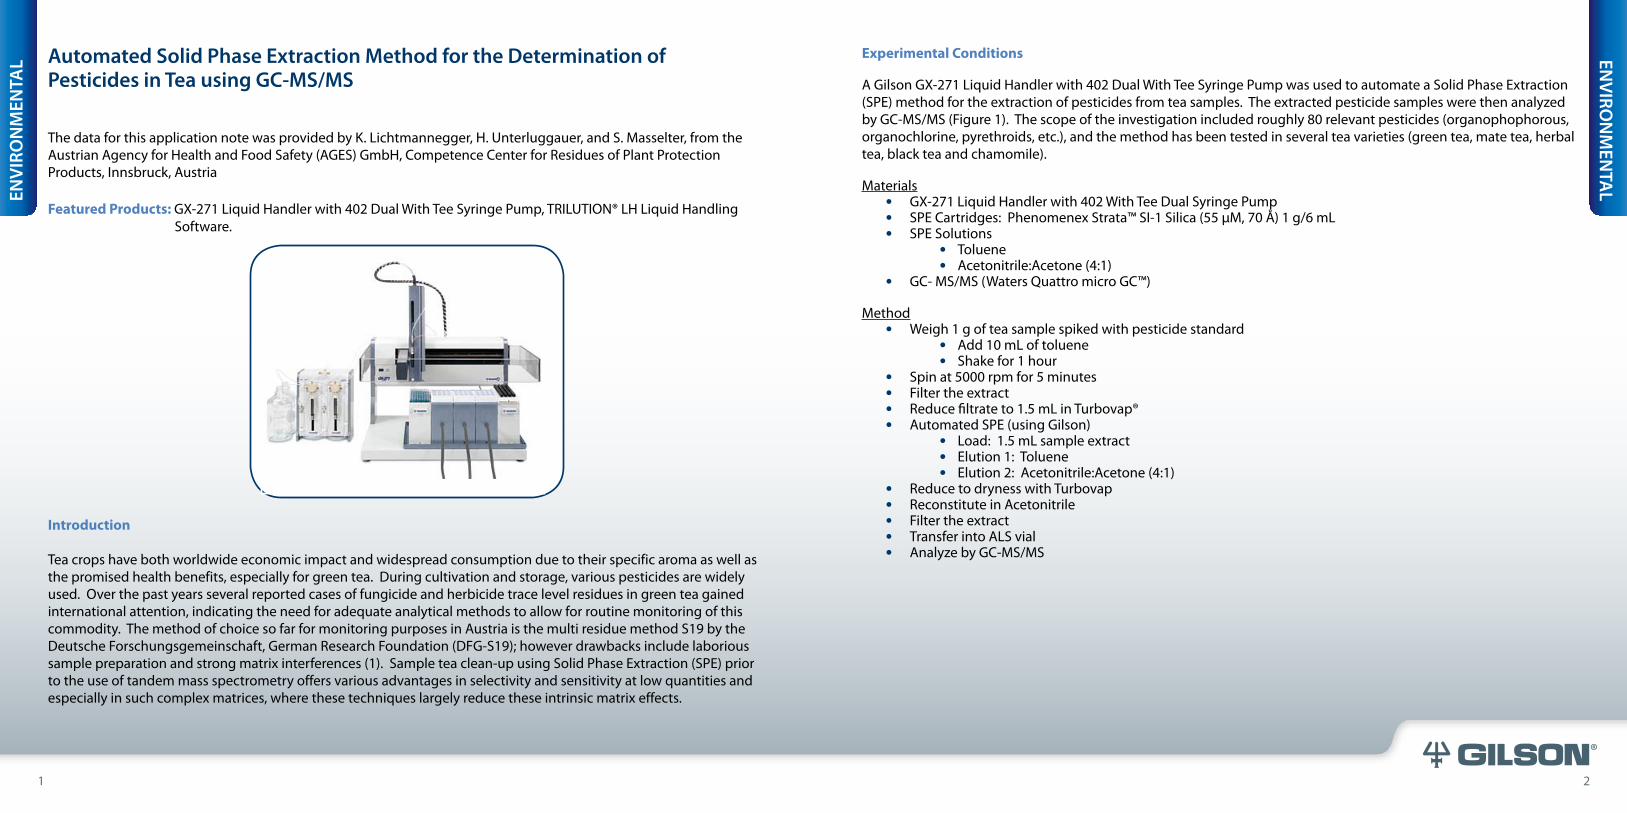
Automated Solid Phase Extraction Method for the Determination of Pesticides in Tea using GC-MS/MS
The data for this application note was provided by K. Lichtmannegger, H. Unterluggauer, and S. Masselter, from the Austrian Agency for Health and Food Safety (AGES) GmbH, Competence Center for Residues of Plant Protection Products, Innsbruck, Austria Featured Products: GX-271 Liquid Handler with 402 Dual With Tee Syringe Pump, TRILUTION® LH Liquid Handling Software.
Introduction
Tea crops have both worldwide economic impact and widespread consumption due to their specific aroma as well as the promised health benefits, especially for green tea. During cultivation and storage, various pesticides are widely used. Over the past years several reported cases of fungicide and herbicide trace level residues in green tea gained international attention, indicating the need for adequate analytical methods to allow for routine monitoring of this commodity. The method of choice so far for monitoring purposes in Austria is the multi residue method S19 by the Deutsche Forschungsgemeinschaft, German Research Foundation (DFG-S19); however drawbacks include laborious sample preparation and strong matrix interferences (1). Sample tea clean-up using Solid Phase Extraction (SPE) prior to the use of tandem mass spectrometry offers various advantages in selectivity and sensitivity at low quantities and especially in such complex matrices, where these techniques largely reduce these intrinsic matrix effects.
ENVI
RON
MEN
TAL
1 2
ENVIRO
NM
ENTA
L
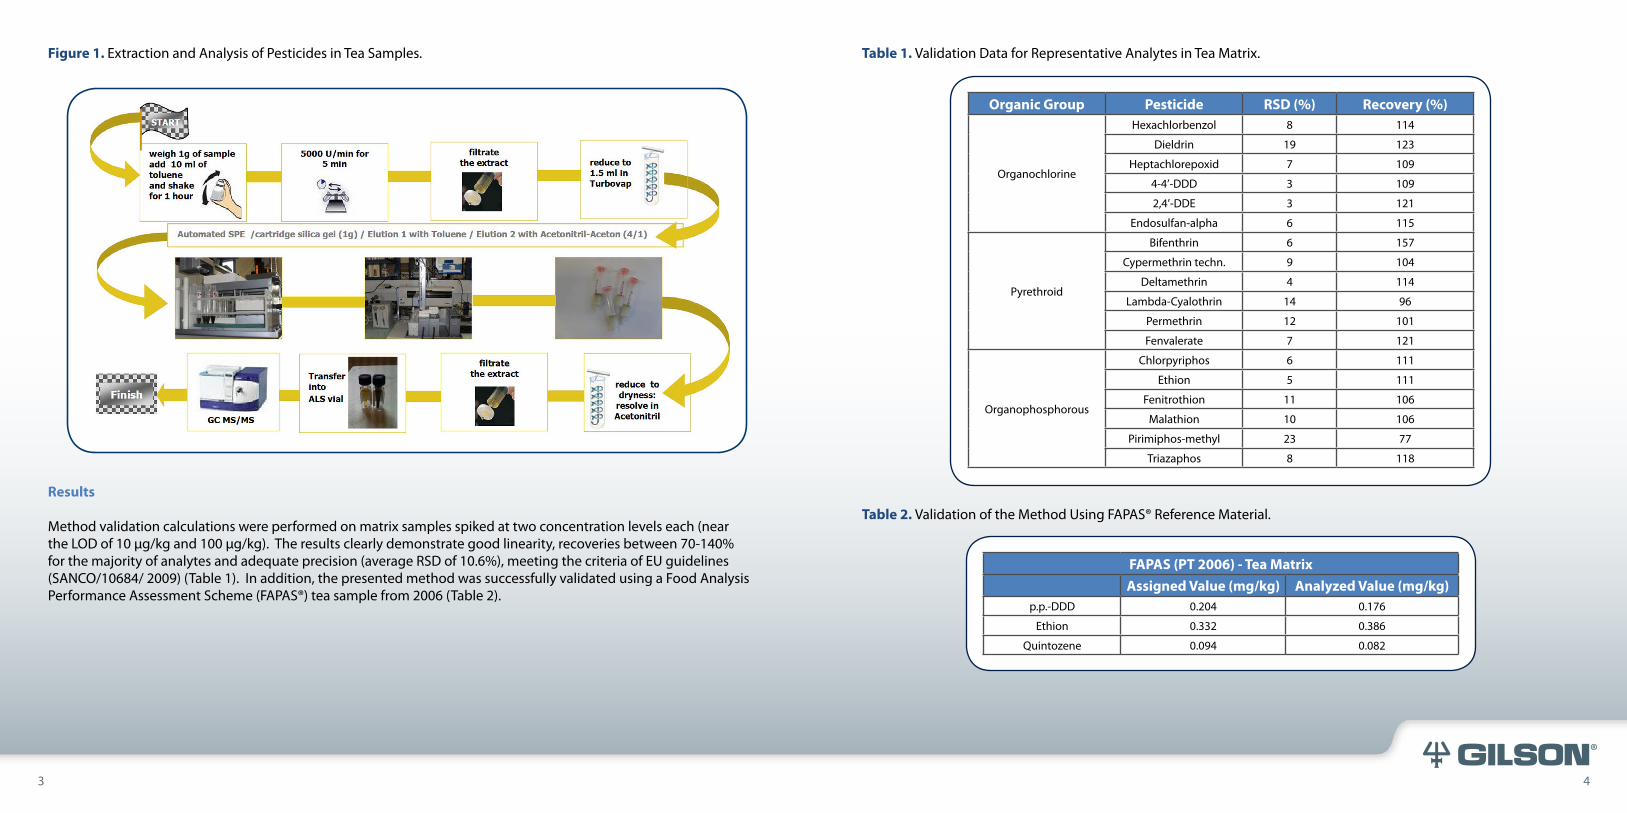
Table 1. Validation Data for Representative Analytes in Tea Matrix.
Table 2. Validation of the Method Using FAPAS® Reference Material.
6 7
Figure 1. Extraction and Analysis of Pesticides in Tea Samples.
Results
Method validation calculations were performed on matrix samples spiked at two concentration levels each (near the LOD of 10 µg/kg and 100 µg/kg). The results clearly demonstrate good linearity, recoveries between 70-140% for the majority of analytes and adequate precision (average RSD of 10.6%), meeting the criteria of EU guidelines (SANCO/10684/ 2009) (Table 1). In addition, the presented method was successfully validated using a Food Analysis Performance Assessment Scheme (FAPAS®) tea sample from 2006 (Table 2).
3 4
Organic Group Pesticide RSD (%) Recovery (%)
Organochlorine
Hexachlorbenzol 8 114
Dieldrin 19 123
Heptachlorepoxid 7 109
4-4’-DDD 3 109
2,4’-DDE 3 121
Endosulfan-alpha 6 115
Pyrethroid
Bifenthrin 6 157
Cypermethrin techn. 9 104
Deltamethrin 4 114
Lambda-Cyalothrin 14 96
Permethrin 12 101
Fenvalerate 7 121
Organophosphorous
Chlorpyriphos 6 111
Ethion 5 111
Fenitrothion 11 106
Malathion 10 106
Pirimiphos-methyl 23 77
Triazaphos 8 118
FAPAS (PT 2006) - Tea MatrixAssigned Value (mg/kg) Analyzed Value (mg/kg)
p.p.-DDD 0.204 0.176
Ethion 0.332 0.386
Quintozene 0.094 0.082

8 9
The method was also tested for several real tea samples. In every sample batch, two spiked blank matrices (10 µg/kg and 100 µg/kg) were analyzed and used for calibration purposes. Only in cases of Maximum Residue Limit (MRL) violations was the alternative approach of standard addition for quantification performed. In the Chinese green tea, Fenvalerate was found to be nearly twice the MRL (Table 3).
Table 3. Analysis of Chinese Green Tea.
Summary
The method presented demonstrates a rapid, sensitive and straightforward multi-residue approach for pesticide residue analysis in tea samples combining an automated extraction and clean-up procedure with the strength of GC-MS/MS tandem mass spectrometry and is thus suitable for food monitoring according to EU legal requirements. As a next step, the method has to be validated for its suitability in daily routine analysis - with the possibility to broaden the scope of investigation.
References
1. JMPR, 2004. Pesticide residues in Food 2004. Report of the Joint Meeting of the FAO Panel of Experts on Pesticide Residues in Food and the Environment and the WHO Core Assessment Group on Pesticide Residues, Rome, Italy, 20-29 September 2004. WHO and FAO, Rome 2004.
Quattro micro GC™ is a trademark of Waters CorporationFAPAS® is a registered trademark of The Food and Environment Research AgencyTurboVap® is a registered trademark of Caliper Life SciencesStrat™ is a trademark of PhenomenexTRILUTION® is a registered trademark of Gilson, Inc.
5 6
Analysis of Sucralose in Water by Liquid Chromatography/Time-of-Flight Mass Spectrometry (LC/TOF-MS) After Automated Solid Phase Extraction
This study was performed by Imma Ferrer, Ph.D. and E. Michael Thurman, Ph.D. at the Center for Environmental Mass Spectrometry, Dept. of Civil, Environmental & Architectural Engineering, University of Colorado, Boulder, CO, USA
Featured Products: Gilson GX-271 ASPEC™ System with 406 Single Syringe Pump, TRILUTION® LH Liquid Handling Software.
Introduction
Non-nutritive sweeteners are steadily growing in importance with increased awareness of diabetes and with more consumers becoming concerned about obesity and dental caries. Some of the most widely used non-nutritive sweeteners include saccharin, aspartame and sucralose (Table 1). Sucralose is a water soluble tri-chlorinated disaccharide that is 600 times sweeter than sucrose. It is highly stable and will not readily degrade at high temperatures (1). In 1991, Canada’s Health Protection Branch became the first national regulatory agency to permit the use of sucralose in foods and beverages. In 1999, the U.S. Food & Drug Administration (FDA) approved permitting the use of sucralose as a general-purpose sweetener in a broad range of products. The European Union amended its Sweeteners Directive to permit the use of sucralose in a variety of foods and beverages in January 2004. Sucralose is now permitted for use in over 60 countries and has been consumed by millions worldwide.
Compounds Analyzed Value (mg/kg) MRL (mg/kg) % of MRLBifenthrin 0.197 5.00 3.9
Chlorpyriphos 0.009 0.10 9.0
Cypermethrin 0.048 0.50 9.6
Fenvalerate 0.093 0.05 186
1-Cyhatothrin 0.07 1.00 7.0
Endosulfane 0.092 30.00 0.3

10 11
• HPLC system: Agilent Series 1200 (Agilent Technologies)• HPLC column: Zorbax Eclipse XDB-C8, 150 mm x 4.6 mm, 5 µ (Agilent Technologies)• HPLC Mobile phase
• A: Acetonitrile with 0.1% formic acid • B: Water with 0.1% formic acid
• Time-of-Flight mass spectrometer: Agilent 6220 MSD TOF• MassHunter software
• Turbovap Concentration Workstation (Caliper Life Sciences)• Analytical standards:
• Aspartame, Saccharin and Sucralose (Sigma-Aldrich) • Stock solutions (1000 µg/mL) in 100% methanol stored at -18 °C
• Water samples were collected from various locations around the USA• Wastewater: Effluent locations downstream from wastewater treatment plants• Surface water: Rivers and reservoirs• Groundwater: Wells
Method
The SPE steps are summarized with the schematic provided in the GX-271 ASPEC control software, TRILUTION LH (Figure 1).
1. Initialization Step: Gilson Mobile SPE Racks are moved above the waste rack and probe rinsed with 10% methanol. 2. Condition SPE cartridge with 4 mL of methanol at a flow rate of 1 mL/min. 3. Condition SPE cartridge with 6 mL of water at 1 mL/min. 4. Load 200 mL of water sample at a flow rate of 10 mL/min. Follow this with an air push of 25 mL to remove any excess water. 5. Move the Gilson Mobile SPE Rack over the collection tubes. 6. Elute the analytes of interest with 5 mL methanol at 1 mL/min. 7. Evaporate to 0.5 mL with nitrogen at a temperature of 45 °C in a water bath with TurboVap.
Figure 1. TRILUTION LH SPE Tasks for Extraction of Sweeteners from Water.
Table 1. Elemental Composition, Base Peak Ions, and Chemical Structures of Aspartame, Saccharin and Sucralose.
In humans, the majority of orally ingested sucralose is eliminated through the gastrointestinal tract, while 11-27% is absorbed with a half life of 2 to 5 hours. Of the absorbed sucralose, only 20-30% is metabolized (2). As the majority of ingested sucralose passes unmetabolized, one would expect the presence of sucralose in wastewater effluent. While sucralose does not bioaccumulate in the environment, there is a lack of knowledge of its long-term biological effects in the aquatic environment. This has lead to an interest in monitoring levels of sucralose in water samples (3, 4, 5).
Recently, some methods employing liquid chromatography-mass spectrometry (LC/MS) have been published for the analysis of sucralose and other artificial sweeteners in water samples (6, 7). This study describes the analysis of several sweeteners in water using liquid chromatography coupled to time-of-flight mass spectrometry (LC/TOF-MS) as well as the automated extraction of these sweeteners from wastewater, surface water and groundwater utilizing the Gilson GX-271 ASPEC™ System (8).
Experimental Conditions
Materials• GX-271 ASPEC with 406 Single Syringe Pump
• TRILUTION® LH software• SPE Cartridges: Oasis™ HLB 500 mg / 6 mL (Waters Corporation)
7 8
Name Elemental Composition Base Peak Chemical Structure
Aspartame C14H18N2O5
[M+H]+
C14H18N2O5+
295.1288
Saccharin C7H5NSO3
[M+H]+
C7H5NSO3+
184.0063
Sucralose C12H19Cl3O8
[M+Na]+
C12H19Cl3O8+
419.0038

12 139 10
LC/TOF-MS Analysis
Samples (50 µL) were injected onto the LC/TOF-MS and quantified (Tables 2, 3). Accurate mass measurements of each peak from the total ion chromatograms were obtained by means of an automated calibrant delivery system using a dual-nebulizer ESI source that introduces the flow from the outlet of the chromatograph together with a low flow of a calibrating solution (calibrant solution A, Agilent Technologies), which contains the internal reference masses (purine [C5H4N4] at m/z 121.05 and HP-921 [hexakis-(1H,1H,3H-tetrafluoro-pentoxy)phosphazene] [C18H18O6N3P3F24] at m/z 922.01).
Table 2. HPLC Mobile Phase Gradient (Flow rate = 0.6 mL/min).
Table 3. Mass Spectrometer Conditions (Capillary Voltage: 4000 V, Nebulizer Pressure: 45 psig, Drying Gas: 9 L/min, Gas Temp: 300 ºC, Fragmentor Voltage: 190 V, Skimmer Voltage: 60 V, Octopole RF: 250 V, Mass Spectra Recorded 50-1000 m/z at 4 GHz) & Analyte Detection Specifications.
Results
Figure 2. LC/TOF-MS Ion Chromatograms for Saccharin (m/z 184, ret. time = 7.9 min), Aspartame (m/z 295, ret. time = 12.9 min) and Sucralose (m/z 419, ret. time = 12.8 min). The concentration of each standard is 0.5 µg/mL.
Figure 3. Mass Spectrum for Sucralose.
Table 4. Analytical Performance Parameters for Sweeteners in Water with SPE Followed by LC/TOF-MS.
Step No. Time (min) %A %B1 0 10 90
2 5 10 90
3 30 100 0
Compound External Calibration Range (µg/mL) R2 % Recovery
(RSD)Method
LODs (µg/L)Method
LOQs (µg/L)Aspartame 0.05 - 5 0.997 90 (6) 0.02 0.2
Saccharin 1 - 10 0.994 53 (8) 0.5 5
Sucralose 0.5 - 5 0.999 73 (5) 0.05 0.5
Analyte Polarity m/z RT(min)Saccharin + 184 7.9
Aspartame + 295 12.9
Sucralose + 419 12.8

14 15
Table 5. Analysis of Saccharin and Sucralose from Various Wastewater, Surface Water and Groundwater Locations in the USA. No Positive Findings for Aspartame Were Found. [n.d.=Below Level of Detection; <LOQ = Below Level of Quantification].
Summary
This application note describes the conditions necessary to automate the solid phase extraction of sucralose, saccharin and aspartame from water samples prior to analysis by LC/TOF-MS using the Gilson GX-271 ASPEC™ system. Extraction recoveries were 90% for aspartame, 53% for saccharin and 73% for sucralose (Table 4). The RSD for
Samples Saccharin (µg/L)
Sucralose (µg/L)
Wastewater Location 1 (CO) 5 1
Wastewater Location 1 (CO) n.d. 1.8
Wastewater Location 2 (CO) n.d. 0.8
Wastewater Location 3 (OH) n.d. 1.5
Wastewater Location 3 (OH) n.d. 1.8
Surface Water Location 2 (CO) (n=4) n.d. n.d.
Surface Water Location 4 (CO) (n=4) n.d. n.d.
Surface Water Location 5 (TX) (n=4) n.d. n.d.
Surface Water Location 6 (AL) (n=3) n.d. <LOQ
Surface Water Location 6 (AL) n.d. n.d.
Surface Water Location 7 (CO) n.d. 0.8
Surface Water Location 7 (CO) n.d. 1.6
Surface Water Location 7 (CO) n.d. 1.0
Surface Water Location 7 (CO) n.d. 1.8
Surface Water Location 8 (MN) n.d. <LOQ
Surface Water Location 8 (MN) n.d. n.d.
Ground Water Location 9 (CO) n.d. 0.8
Ground Water Location 9 (CO) n.d. 2.4
Ground Water Location 9 (CO) n.d. 1.4
Ground Water Location 9 (CO) n.d. 2.2
Ground Water Location 10 (CO) n.d. 0.6
Ground Water Location 10 (CO) n.d. 1.6
Ground Water Location 10 (CO) n.d. 2.0
Ground Water Location 10 (CO) n.d. 2.0
inter-day (n=5) values were between 5 and 8% showing good reproducibility of the methodology. The LC/TOF-MS limit of detection for sucralose was 0.05 µg/L.
Sucralose was the most detected sweetener, showing up in wastewater, surface water and groundwater samples. Five wastewater samples from three different locations all showed positive detections for sucralose (Table 5). Eight surface water samples out of 22 were positive for sucralose and had no detections for the other two sweeteners. Eight alluvial groundwater samples from two locations were positive for sucralose. These are the first reports of sucralose in groundwater, which are most likely the effect of surface water being drawn into these alluvial wells during pumping.
The study data suggest that sucralose may be an excellent tracer of wastewater-contaminated surface water because of its widespread occurrence and its apparent stability in wastewater and surface water. Studies are currently underway to compare sucralose to caffeine as tracers of sewage wastewater in groundwater and drinking water supplies.
References
1. McNeil Nutritionals, LLC (2007). Sucralose: a scientific and safety review. http://www.splendaprofessional.com/sucraloseareview.
2. Friedman, MA., Food Additives Permitted for Direct Addition to Food for Human Consumption; Sucralose Federal Register: 21 CFR Part 172, Docket No. 87F-0086, April 3, 1998.
3. Dye, C. Sucralose - a new persistant pollutant in the environment? Norwegian Institute for Air Research (NILU). http://www.nilu.com News Bulletin, 29th May 2007.
4. Brorström-Lundén, E., et al. Measurements of Sucralose in the Swedish Screening Program. Swedish Environmental Institute (IVL) Report B1769, January 2008.
5. Mead, RN., et al. Occurrence of the artificial sweetener sucralose in coastal and marine waters of the United States. Marine Chemistry. 2009; 116 (1-4):13-17.
6. Loos, R., et al. Sucralose screening in European surface waters using a solid-phase extraction-liquid chromatography-triple quadrupole mass spectrometry method. J. Chromatogr. A. 2009; 1216 (7):1126-1131.
7. Scheurer, M., Brauch, H.J. and Lange, F.T. Analysis and Occurence of seven artificial sweeteners in German waste water and surface water and in soil aquifer treatment (SAT). Analytical and Bioanalytical Chemistry. 2009; 394 (6):1585-1594.
8. Ferrer, I. and Thurman E.M. Analysis of sucralose and other sweeteners in water and beverage samples by liquid chromatography/time-of-flight-mass spectrometry. J. Chromatogr. A. 2010 Jun 18; 1217(25): 4127-34.
ASPEC™ is a trademark of Gilson, Inc.Oasis™ is a trademark of Waters CorporationTurboVap® is a registered trademark of Caliper Life SciencesTRILUTION® is a registered trademark of Gilson, Inc.
11 12

16 17
The Impact of Sample Temperature and Pipetting Modes on Volumetric Pipetting Accuracy of Positive and Air Displacement Pipettes
This application note was part of a collaboration study between Gilson, Inc. and Terra Thimm, University of Wisconsin, Madison, WI, USA, during a summer internship at Gilson, Inc. in Middleton, WI. Featured Products: PIPETMAN Classic™, PIPETMAN® M, MICROMAN®, and DISTRIMAN®.
Introduction
Accurate pipetting is a required and fundamental liquid transfer technique for numerous industries. From method development to validation to routine quality control, laboratory groups rely on the ability to accurately pipette liquid samples for daily sample analysis. FDA regulations for food safety, food labeling and nutrition, food ingredients, as well as dietary supplements, require regular testing that involves pipetting for liquid transfer. Pipette manufacturers continue to provide a wide variety of mechanical, electronic and motorized pipettes to choose from. The instrument specifications for these pipettes are typically generated from tests using room temperature, deionized water measured in a controlled environment. The physical properties of typical food and beverage samples can be quite different; however, from room temperature water.
This experiment was established to test the accuracy of pipetting hot and cold beverage samples using different pipettes and techniques. The different pipetting techniques included standard pipetting, pre-wetting pipetting and reverse pipetting. Both positive displacement pipettes (single and repeater) and air displacement pipettes (motorized and standard) were tested. The pipetting was performed by an undergraduate student with basic pipette training to mimic an academic laboratory setting. The comprehensive data shows which pipette and pipetting method provides the lowest error for hot and cold beverages.
13
Figure 1: PIPETMAN Classic Figure 2: PIPETMAN M Figure 3: MICROMAN Figure 4: DISTRIMAN
Experimental Conditions
Materials• Samples and solvents
• NanoPure Water @ 22 °C• Tap Water @ 75-85 °C, 10-13 °C• Brewed Regular Coffee @ 75-85 °C• 2% Milk @ 10-13 °C
• Apparatus• Mettler Toledo Balance• Gilson PIPETMAN Classic™ P200 with Gilson PIPETMAN® D200 tips• Gilson PIPETMAN M M200 with Gilson PIPETMAN D200 tips• Gilson MICROMAN® M100 with Gilson CP tips• Gilson DISTRIMAN® D100 with Gilson DISTRITIPS®
Sample Testing & Calculations:All sample tests were run in quintuplet as follows:
• Pipettes/Modes used• POS – Positive displacement pipette• PPOS – Pre-wet tip with positive displacement pipette• SAD – Standard air displacement pipette• PSAD - Pre-wet tip with standard air displacement pipette• SADR - Standard air displacement pipette in reverse mode• SADRP - Pre-wet tip with standard air displacement pipette in reverse mode
• Aspirate and dispense 100 μL into pre-tared sample cups and record weight. • Move sample cups with tweezers to eliminate natural oils from impacting results. • Record five mass weights for each pipette, mode, and liquid. (For the DISTRIMAN pipette, discard the first two 100 μL samples prior to taking five sample measurements.) • Convert mass to volume by using the Z factor of each liquid (V = M*Z).
• V = Calculated Volume• M = Mass Observed• Z = Correction (Z) Factor = 1/Density of liquid
• Calculate the systematic error (E = (V-Vs)/ Vs*100).• V = Calculated volume• Vs= Expected volume
Results
The most accurate results (lowest systematic error) for pipetted hot and cold liquids were generated by the DISTRIMAN using PPOS mode (Figures 5, 6). The PIPETMAN M in SADR mode was the most accurate air displacement
14
FOO
D &
BEVERAG
EFOO
D &
BEV
ERA
GE

18 19
Automation of AOAC 970.16 Bitterness of Malt Beverages and AOAC 976.08 Color of Beer through Unique Software Control of Common Laboratory Instruments with Real-Time Decision Making and Analysis
This application note was part of a collaboration study between Gilson, Inc., Middleton, WI, USA, Peter Defrancesca, Torrey Pines Scientific, Carlsbad, CA, USA, and Judy Hadley, Ph.D. and Rick Laurell, Agilent Technologies, Santa Clara, CA, USA
Featured Products: Gilson GX-271 ASPEC™ with 406 Single Syringe Pump, TRILUTION® LH v3.0 Liquid Handling Software, Agilent 8453 UV-Visible Spectrophotometer with Multicell Transport, Torrey Pines Scientific EchoTherm™ SC20XT.
Introduction
A typical laboratory is frequently looking for ways to increase consistency and throughput. A common way to achieve this is through finding an automated solution for manual techniques. One of the largest hurdles for automation of manual methodology, no matter how simple, is the necessity of decision making based on real-time sample analysis, which typically requires the coordination of input from multiple components with varying manufacturers. In this study, a unique, single software control of a liquid handler, spectrophotometer equipped with multiple flow cells and shaker block with temperature control capabilities brings each component together into a single automated solution from multiple manual AOAC methods.
Agilent 8453 UV-Visible Spectrophotometer GX-271 ASPEC
EchoTherm SC20XT
pipette. Despite oils in coffee and fat content in milk, results followed trends with water of the same temperature for all pipettes.
Figure 5 (Left). Mean Volume of Pipetting 100 µL of Hot or Cold Liquid With the MICROMAN® (purple), DISTRIMAN® (green), PIPETMAN Classic™ (blue), and PIPETMAN® M (orange): Hot Coffee (red), Hot Tap Water (pink), 2% Milk (dark blue), and Cold Tap Water (light blue).
Figure 6 (Right). Systematic Error of Pipetting 100 µL of Hot or Cold Liquid With the MICROMAN (purple), DISTRIMAN (green), PIPETMAN Classic (blue), and PIPETMAN M (orange): Hot Coffee (red), Hot Tap Water (pink), 2% Milk (dark blue), and Cold Tap Water (light blue).
Summary
This application provides laboratory considerations and recommendations from an undergraduate perspective on pipetting various food/beverage samples. Understanding that the temperature of a sample can impact pipetting accuracy will assist scientists with choosing the ideal pipette for a given application. The DISTRIMAN and the PIPETMAN M are excellent choices for accurate pipetting of hot or cold liquids, while the PIPETMAN Classic remains the standard for room temperature liquids.
PIPETMAN Classic™ is a trademark of GilsonPIPETMAN® is a registered trademark of GilsonDISTRIMAN® is a registered trademark of GilsonMICROMAN® is a registered trademark of Gilson
2115 16

20 21
Figure 2. TRILUTION® LH v3.0 Protocol for Conditional Logic in Temperature Equilibration.
AOAC method 976.08 for Color of Beer results are derived from a simple spectrophotometer reading at two wavelengths after degassing. Based on the absorbance readings, the sample may require filtration and the readings repeated. The study showcases online absorbance readings for the software to react in real-time and use conditional logic to perform the automated rework of the sample when necessary.
AOAC method 970.16 for Bitterness of Malt Beverages requires temperature controlled samples to undergo liquid-liquid extraction (LLE) prior to absorbance readings. Control of the chilled shaker block allows for a record of sample temperature at run time and shaking of the sample when required. Online transfer to the spectrophotometer records absorbance values, taking sample readings immediately and without the need for physical intervention.
Samples and solvents• Beers supplied by microbrewery (Figure 3)• Isopropanol (B&J, P/N 10071758)• Hydrochloric Acid (Sigma, P/N 258148)• 2,2,4-Trimethylpentane (isooctane)(Sigma, P/N 155012)• 1-Octanol (Sigma, P/N 293245)• NanoPure Water
Figure 3. Beer Samples Used for the Study; A: American Pale Lager, B: Cream Ale, C: American Pale Ale, D: German Pilsner, E: English Brown Ale, F: Bock.
17
A B C D E F
Experimental Conditions
The focus of this experiment was to utilize unique software control of common laboratory equipment to allow for real-time protocol alteration by automated equipment. Through the use of conditional logic based upon inputs from a spectrophotometer and shaker block, TRILUTION® LH v3.0 Software was able to alter the course of the protocol to accommodate necessary changes. An example of the conditional logic used to determine if filtering of the beer sample was necessary during AOAC method 976.08 is displayed below in Figure 1. Figure 2 demonstrates the software protocol used to ensure proper sample temperature for AOAC method 970.16. In each of the protocols, the IF steps (orange tasks) are used to direct future operation.
Figure 1. TRILUTION LH v3.0 Protocol for Conditional Logic in Beer Filtration.
18
22 23
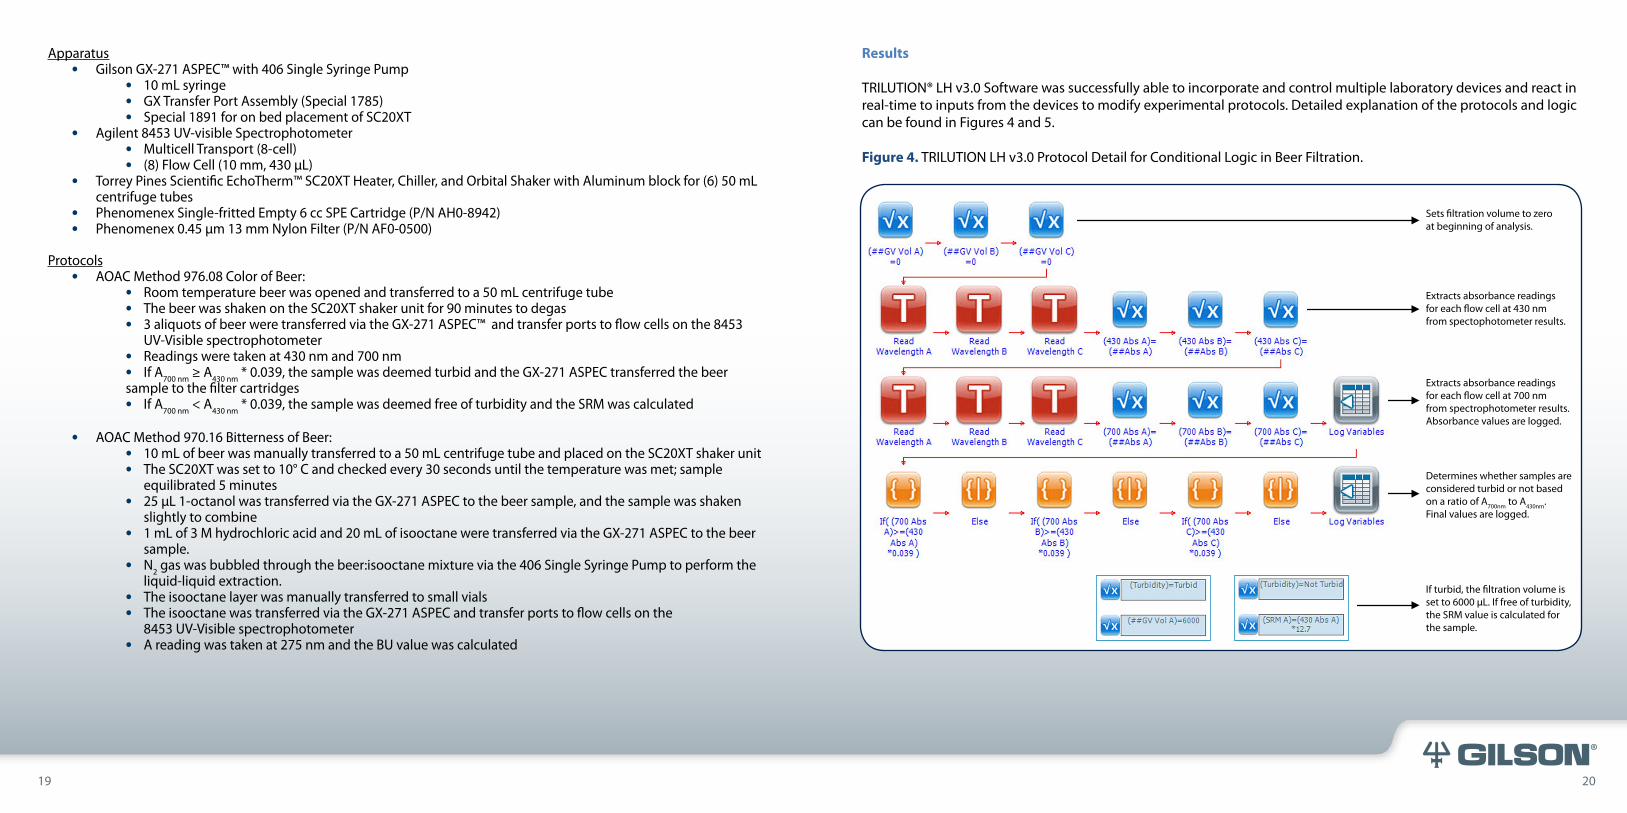
Results
TRILUTION® LH v3.0 Software was successfully able to incorporate and control multiple laboratory devices and react in real-time to inputs from the devices to modify experimental protocols. Detailed explanation of the protocols and logic can be found in Figures 4 and 5.
Figure 4. TRILUTION LH v3.0 Protocol Detail for Conditional Logic in Beer Filtration.
19
Sets filtration volume to zero at beginning of analysis.
Extracts absorbance readings for each flow cell at 430 nm from spectophotometer results.
Extracts absorbance readings for each flow cell at 700 nm from spectrophotometer results. Absorbance values are logged.
Determines whether samples are considered turbid or not based on a ratio of A700nm to A430nm. Final values are logged.
If turbid, the filtration volume is set to 6000 µL. If free of turbidity, the SRM value is calculated for the sample.
Apparatus• Gilson GX-271 ASPEC™ with 406 Single Syringe Pump
• 10 mL syringe• GX Transfer Port Assembly (Special 1785) • Special 1891 for on bed placement of SC20XT
• Agilent 8453 UV-visible Spectrophotometer • Multicell Transport (8-cell)• (8) Flow Cell (10 mm, 430 µL)
• Torrey Pines Scientific EchoTherm™ SC20XT Heater, Chiller, and Orbital Shaker with Aluminum block for (6) 50 mL centrifuge tubes• Phenomenex Single-fritted Empty 6 cc SPE Cartridge (P/N AH0-8942)• Phenomenex 0.45 µm 13 mm Nylon Filter (P/N AF0-0500)
Protocols• AOAC Method 976.08 Color of Beer:
• Room temperature beer was opened and transferred to a 50 mL centrifuge tube• The beer was shaken on the SC20XT shaker unit for 90 minutes to degas• 3 aliquots of beer were transferred via the GX-271 ASPEC™ and transfer ports to flow cells on the 8453 UV-Visible spectrophotometer• Readings were taken at 430 nm and 700 nm• If A700 nm ≥ A430 nm * 0.039, the sample was deemed turbid and the GX-271 ASPEC transferred the beer sample to the filter cartridges• If A700 nm < A430 nm * 0.039, the sample was deemed free of turbidity and the SRM was calculated
• AOAC Method 970.16 Bitterness of Beer:• 10 mL of beer was manually transferred to a 50 mL centrifuge tube and placed on the SC20XT shaker unit• The SC20XT was set to 10° C and checked every 30 seconds until the temperature was met; sample equilibrated 5 minutes• 25 µL 1-octanol was transferred via the GX-271 ASPEC to the beer sample, and the sample was shaken slightly to combine• 1 mL of 3 M hydrochloric acid and 20 mL of isooctane were transferred via the GX-271 ASPEC to the beer sample.• N2 gas was bubbled through the beer:isooctane mixture via the 406 Single Syringe Pump to perform the liquid-liquid extraction.• The isooctane layer was manually transferred to small vials• The isooctane was transferred via the GX-271 ASPEC and transfer ports to flow cells on the 8453 UV-Visible spectrophotometer• A reading was taken at 275 nm and the BU value was calculated
20

24 2522
The Impact of Environmental Influences on Volumetric Pipetting Accuracy of Air Displacement Pipettes
This application note was part of a collaboration study between Gilson, Inc. and Terra Thimm, University of Wisconsin, Madison, WI, USA, during a summer internship at Gilson, Inc. in Middleton, WI.
Featured Products: PIPETMAN Classic™.
Introduction
Accurate pipetting is a required and fundamental liquid transfer technique for numerous industries. From method development to validation to routine quality control, laboratory groups rely on the ability to accurately pipette liquid samples for daily analysis. Pipette manufacturers continue to provide a wide variety of mechanical, electronic and motorized pipettes to choose from. The specifications for these pipettes are typically generated from tests using room temperature deionized water measured in a controlled environment. Typical laboratory settings can deviate greatly from these controlled environments. Therefore, this experiment was performed to establish the impact of deviations in environmental conditions on pipetting accuracy. The pipetting was performed by an undergraduate student with basic pipette training to mimic an academic laboratory setting. Daily pipette weighings were performed at various temperatures and humidities to act as a ‘worse case’ scenario with the objective of determining what impact if any there was on error values.
Figure 5. TRILUTION® LH v3.0 Protocol Detail for Conditional Logic in Temperature Equilibration.
Microbrewery beer sample test results in Table 1 show some inconsistencies with the values provided by the brewery; however, they show the same trends that were anticipated.
Table 1. Beer Characteristics Provided and Testing Results.
Summary
Automation of AOAC methods 970.16 and 976.08 using conditional logic to modify experimental protocols in real time was successful. Further method and procedural optimization can be done to improve result correspondence.
ASPEC™ is a trademark of Gilson, Inc.EchoTherm™ is a trademark of Torrey Pines ScientificTRILUTION® is a registered trademark of Gilson, Inc.
21
Sets the desired sample temperature and reads current temperature. If the desired temperature matches current temperature, temperature is logged and the sample equilibrates for 5 minutes.
If the desired temperature does not match the current temperature, the current temperature is logged, the system waits 30 seconds, then returns to the Read Temp label to begin check again.
Beer Style Provided Color (converted from EBC to SRM)
Tested Color (SRM)*
Provided BU**
Tested BU
A American Pale Lager 2.4 3.8 7 12.5
B Cream Ale 4.7 5.6 11 14
C American Pale Ale 5.8 8.1 35.5 23.5
D German Pilsner 12.1 10.4 20 18
E English Brown Ale 24.5 21.6 20 18.5
F Bock 59.6 48.9 19.5 13* Note: None of the microbrew beers passed the turbidity requirement, even after filtration. A macrobrew beer was also tested for method verification and did pass the turbidity requirement. ** Note: Beer was tested 6 months after provided numbers were given; potential degradation of bitterness compounds is a possible explanation for the result inconsistency.

26 27
Figure 2. Gravimetric Results.
Summary
Gravimetric results for 100 µL water are graphed. Green circles represent data points that correlate with systematic error values above 0.8% and humidity values above 90%. The black circle represents data point that had systematic error value above 0.8%, but did not have a humidity value above 90%, so it is considered as an experimental outlier (Figure 2).
This application provides laboratory considerations and recommendations from an undergraduate perspective on pipetting. Systematic error was found to be outside of the PIPETMAN Classic specifications on 5 out of the 38 days observed. The outdoor humidity was found to be above 90% in four out of the five days, indicating a strong connection between decreased accuracy and environmental factors. Maintaining reasonable humidity and temperature levels in the laboratory is an important parameter for producing reliable pipetting results.
PIPETMAN Classic™ is a trademark of Gilson, Inc.PIPETMAN® is a registered trademark of Gilson, Inc.
23 24
Experimental Conditions
Materials• NanoPure Water @ 22 °C• Mettler Toledo Balance• Gilson PIPETMAN Classic™ P200 with Gilson PIPETMAN® D200 tips
Daily Gravimetric Test:• Pipetting was performed for 38 consecutive days.• The outdoor relative humidity and barometric pressure were recorded each day.• The sample water temperature was recorded immediately prior to weighing.• The pipette tip was pre-rinsed 5 times before sample weighing.• Water (100 μL) was aspirated and dispensed 10 times into pre-tared sample cups. The weight was recorded after each dispense.• Sample cups were moved with tweezers to eliminate natural oils from impacting results. • The volume of the sample was calculated from the mass and density of the water (V = M/D). • Systematic error (E = (V-Vs)/ Vs*100) was calculated each day.
• V = Calculated volume• Vs= Expected volume
• Results compared to the specifications of the PIPETMAN Classic.
Results
The daily gravimetric tests performed by the undergraduate were mapped to show daily % systematic error and standard deviation over 38 days (Figure 2). Systematic error specification for the PIPETMAN Classic P200 at 100 μL is < 0.8%. Five daily readings were observed above the PIPETMAN Classic specifications. A comparison of these gravimetric measures shows there is an 80% correlation between systematic error values above the specification on days where humidity values were above 90%.

28 2925 26
Automation of Solid Phase Extraction Multi-method for GC/MS Analysis of Drugs of Abuse in Human Serum
The application was developed and supported by: Institut für Rechtsmedizin Mainz A.Schlägel, Dr.Zörntlein, Dr.Röhrich, Dr.Becker, Prof. Dr.Dr. Urban.
Featured Products: GX-271 ASPEC™, TRILUTION® LH Liquid Handling Software.
Introduction
Psychotropic drugs (cannabis, amphetamines, opiates, cocaine) are illegal; however, widely used in Germany. The quantitative detection of these substances in blood is essential to determine drug use in cases of driving under the influence, which is forbidden by law. The use of solid phase extraction (SPE) for the preparation of clinical samples is an established method for the analysis of drugs of abuse. An automated SPE method was used to process human serum samples for the analysis of several standard drugs and their metabolites. TRILUTION LH software and the GX-271 ASPEC system was employed to perform the liquid handling and SPE method. The samples were derivatized after extraction and analyzed by gas chromatography-mass spectrometry. The automated method was transferred and validated from a previously used manual method. This application demonstrates the extraordinary flexibility of the GX-271 ASPEC and TRILUTION LH software since the desired SPE products can be eluted in fractionated mode.
CLIN
ICA
L/FO
REN
SIC CLIN
ICAL/FO
RENSIC
Experimental Conditions
Materials• Gilson GX-271 ASPEC™• TRILUTION® LH• SPE Cartridges: JT Baker® BAKERBOND C18 500 mg / 3 mL • SPE Solutions:
• Methanol• Water• Acetic Acid• Dichloromethane: Acetone (1:1)• Dichloromethane: Isopropanol: Ammonia (40:20:2)• Phosphate buffer
• Human serum (6-8 replicates per analysis)• Analytes of interest
• THC • THC-OH• THC-COOH • 6-Monacetylmorphine• Codeine • Morphine• Methadone • Benzoylecgonine• Methylecgonine • Cocaine• MDE • MDMA• MDA • Methamphetamine• Amphetamine
30 3123 2827
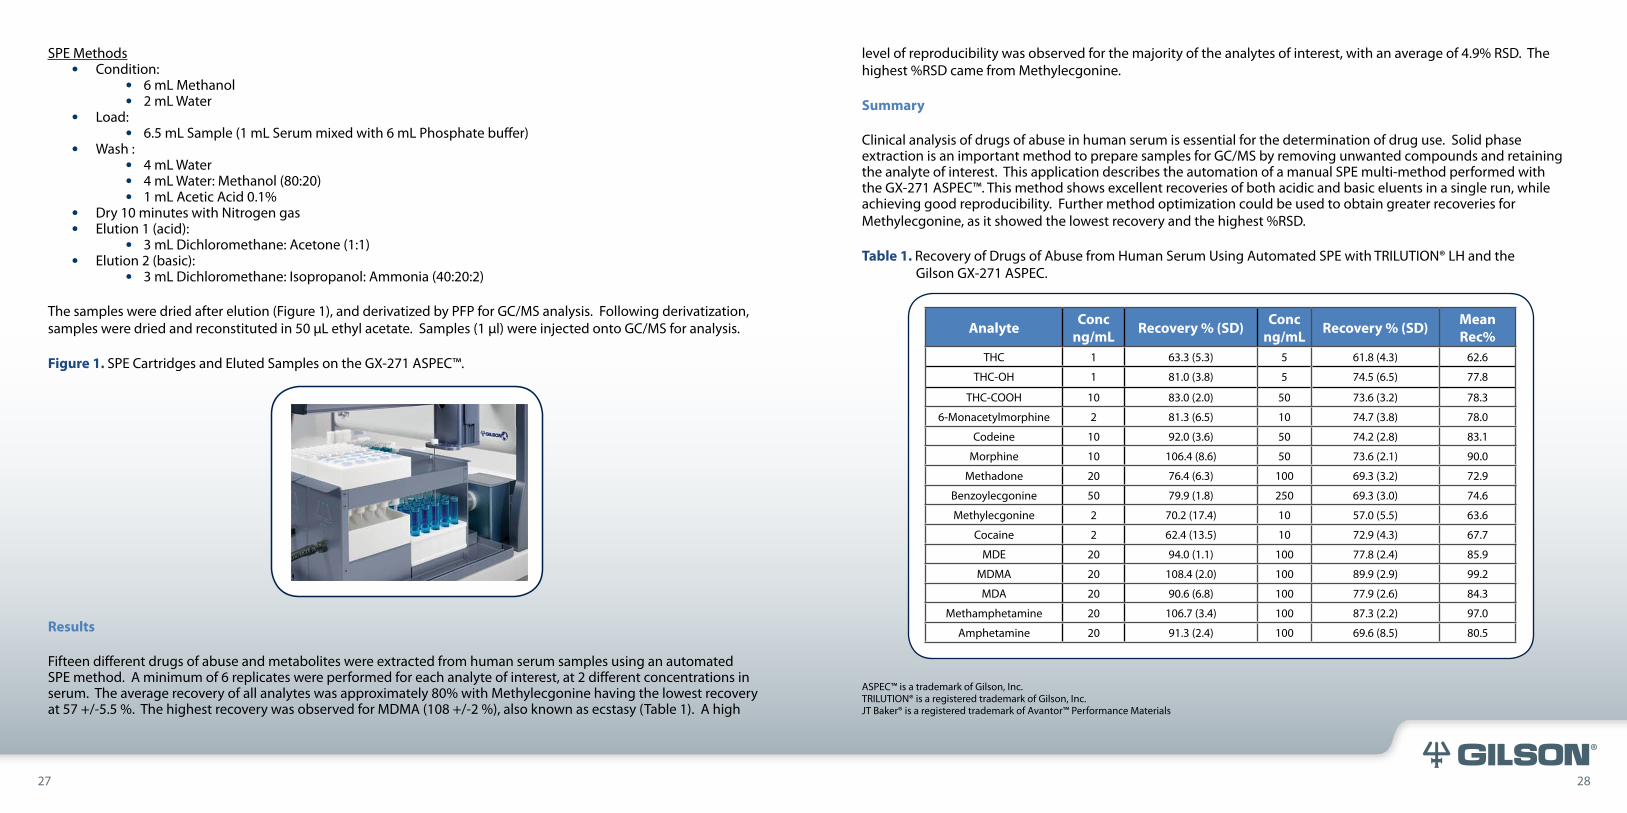
SPE Methods• Condition:
• 6 mL Methanol• 2 mL Water
• Load:• 6.5 mL Sample (1 mL Serum mixed with 6 mL Phosphate buffer)
• Wash :• 4 mL Water• 4 mL Water: Methanol (80:20)• 1 mL Acetic Acid 0.1%
• Dry 10 minutes with Nitrogen gas• Elution 1 (acid):
• 3 mL Dichloromethane: Acetone (1:1)• Elution 2 (basic):
• 3 mL Dichloromethane: Isopropanol: Ammonia (40:20:2)
The samples were dried after elution (Figure 1), and derivatized by PFP for GC/MS analysis. Following derivatization, samples were dried and reconstituted in 50 µL ethyl acetate. Samples (1 µl) were injected onto GC/MS for analysis.
Figure 1. SPE Cartridges and Eluted Samples on the GX-271 ASPEC™.
Results
Fifteen different drugs of abuse and metabolites were extracted from human serum samples using an automated SPE method. A minimum of 6 replicates were performed for each analyte of interest, at 2 different concentrations in serum. The average recovery of all analytes was approximately 80% with Methylecgonine having the lowest recovery at 57 +/-5.5 %. The highest recovery was observed for MDMA (108 +/-2 %), also known as ecstasy (Table 1). A high
level of reproducibility was observed for the majority of the analytes of interest, with an average of 4.9% RSD. The highest %RSD came from Methylecgonine.
Summary
Clinical analysis of drugs of abuse in human serum is essential for the determination of drug use. Solid phase extraction is an important method to prepare samples for GC/MS by removing unwanted compounds and retaining the analyte of interest. This application describes the automation of a manual SPE multi-method performed with the GX-271 ASPEC™. This method shows excellent recoveries of both acidic and basic eluents in a single run, while achieving good reproducibility. Further method optimization could be used to obtain greater recoveries for Methylecgonine, as it showed the lowest recovery and the highest %RSD.
Table 1. Recovery of Drugs of Abuse from Human Serum Using Automated SPE with TRILUTION® LH and the Gilson GX-271 ASPEC.
ASPEC™ is a trademark of Gilson, Inc.TRILUTION® is a registered trademark of Gilson, Inc.JT Baker® is a registered trademark of Avantor™ Performance Materials
Analyte Conc ng/mL Recovery % (SD) Conc
ng/mL Recovery % (SD) Mean Rec%
THC 1 63.3 (5.3) 5 61.8 (4.3) 62.6
THC-OH 1 81.0 (3.8) 5 74.5 (6.5) 77.8
THC-COOH 10 83.0 (2.0) 50 73.6 (3.2) 78.3
6-Monacetylmorphine 2 81.3 (6.5) 10 74.7 (3.8) 78.0
Codeine 10 92.0 (3.6) 50 74.2 (2.8) 83.1
Morphine 10 106.4 (8.6) 50 73.6 (2.1) 90.0
Methadone 20 76.4 (6.3) 100 69.3 (3.2) 72.9
Benzoylecgonine 50 79.9 (1.8) 250 69.3 (3.0) 74.6
Methylecgonine 2 70.2 (17.4) 10 57.0 (5.5) 63.6
Cocaine 2 62.4 (13.5) 10 72.9 (4.3) 67.7
MDE 20 94.0 (1.1) 100 77.8 (2.4) 85.9
MDMA 20 108.4 (2.0) 100 89.9 (2.9) 99.2
MDA 20 90.6 (6.8) 100 77.9 (2.6) 84.3
Methamphetamine 20 106.7 (3.4) 100 87.3 (2.2) 97.0
Amphetamine 20 91.3 (2.4) 100 69.6 (8.5) 80.5

32 3329 30
Automated Solid Phase Extraction of THC and Metabolites from Whole Blood using the Gilson GX-274 ASPEC™
This application note information was performed by Phenomenex (www.phenomenex.com) and referenced in Phenomenex HPLC Application ID No.: 19947. (1,2) Featured Products: Gilson GX-274 ASPEC™, TRILUTION® LH Liquid Handling Software.
Introduction
Tetrahydrocannabinol (THC) is the principle active component in marijuana (Figure 1). It is rapidly absorbed by inhalation and also through the gastrointestinal tract. Being stored in the fat tissue of the body, it is released over a long period of time. THC is metabolized into two main metabolites: 11-hydroxy-THC (11-THC-OH) and 11-Nor-9-carboxy-THC (THC-COOH) (3).
Figure 1. Chemical Structure of A: Tetrahydrocannabinol, B: 11-THC-OH, C: THC-COOH.
Positive identification of THC is commonly performed through enzyme immunoassay screening tests using a urine sample, with confirmatory tests performed using urine and blood samples by Mass Spectrometry. Enzyme immunoassays may produce false positives with the proton pump inhibitor Protonix® (Pantoprazole) which is used to treat gastroesophageal reflux disease (GERD) (4). Blood testing is commonly performed to detect the recent use of THC, and therefore is commonly used to investigate accidents and suspicion of driving under the influence (DUI) because blood testing can provide an indication of whether the subject was actually under the influence. Studies have shown that high THC blood levels are correlated with impaired driving (5). This application note discusses a simple and effective automated solid phase extraction (SPE) method using the GX-274 ASPEC™ prior to sample analysis via LC/MS-MS for THC and its major metabolites in whole blood. Quantitative analytical testing for THC using urine and blood can be complimentary to one another, as urine testing can test THC levels as it is continuously released from the fat cells over time (Figure 2) (6).
Figure 2. Distribution of THC in the Body (6).
A B C

34 353231
Experimental Conditions
Materials• Gilson GX-274 ASPEC™ operating TRILUTION® LH software• SPE Cartridges: Phenomenex Strata™ X-Drug B 33 u Polymeric Strong Cation 60 mg / 6 mL• SPE Solutions:
• Acetonitrile:Water (15:85) (ACN:H2O)• Ethyl Acetate:Isopropyl Alcohol (85:15) (EA:IPA)
• HPLC System with Binary Gradient Mobile Phase Pumps• Column: Phenomenex Kinetex™ 2.6 u C18 100 Å, 50 x 2.1 mm ID• Column Temperature: ambient• Flow rate: 0.4 mL/min• Mobile Phase:
• A: 1 mM Ammonium Formate with 0.1% Formic Acid• B: Methanol:Acetonitrile (1:1) with 0.1% Formic Acid
• Mass Spectrometer: API 3000™ (AB SCIEX)
Pre-Sample Treatment1. Samples spiked @ 100 ng/mL with 6 THC analytes/metabolites 2. Protein precipitation performed by adding 1.0 mL cold ACN:MeOH (85:15 v:v) to 0.5 mL whole blood sample3. Vortex 1-2 mins using a maximix II (Barnstead International) with maximum force4. Centrifuge 10,000 rpm, for 10 min5. Discard pellet6. Dilute sample obtained from protein precipitation step with 3 mL of 1% Formic acid in water7. Load directly onto SPE cartridge - NO CONDITIONING REQUIRED
SPE Method (Figure 3)1. Load 4.5 mL of pre-treated sample onto SPE cartridge at 3 mL/min2. Wash with 2 mL ACN:H2O at 6 mL/min3. Dry for 5 minutes at 7-15 psi regulated gas (nitrogen, argon, or purified air)4. Elute SPE cartridge with 2 mL EA:IPA at 3 mL/min
Figure 3. TRILUTION LH THC SPE Method Using the Gilson GX-274 ASPEC System.
Final Sample Treatment Prior to Analysis1. Evaporate eluent to dryness under 50 °C nitrogen2. Reconstitute in 500 µL of 50:50 Mobile Phase A:Mobile Phase B3. Inject 5 µL on LC/MS-MS (Table 1, 2)
Table 1. HPLC Mobile Phase Gradient.
Table 2. Mass Spectrometer Conditions.
Step No. Time (min) %A %B1 0 50 50
2 3 5 95
3 4.5 5 95
4 4.51 50 50
5 6 50 50
Analyte Polarity Q1 m/z Q3 m/z DP CETHC-OH + 331.0 193.3 55 31
THC-OH-d3 + 334.0 196.3 55 31
THC-COOH + 345.2 327.0 55 29
THC-COOH-d3 + 348 330.1 55 29
THC + 315.2 193.1 60 31
THC-d3 + 318.2 196.1 60 25
CAD: 7 GS1: 60 GS2: 45 TEM: 600 CUR: 25 IS: 5500Dwell: 25ms

36 373433
Results
Table 3. Recovery of THC Parent and Metabolites.
Figure 4. Example Chromatogram of Extracted THC Analyte/Metabolite from Whole Blood. Peak #; 1 (THC-OH), 2 (THC-OH-d3), 3 (THC-COOH), 4 (THC-COOH-d3), 5 (THC), 6 (THC-d3).
Summary
Automated SPE prior to LC/MS-MS analysis of THC analytes/metabolites in whole blood provides a confirmatory test for the positive or negative presence of THC most notable for drivers under the influence. This application involves three simple SPE steps, saving time by not requiring the general SPE cartridge condition steps or mutliple wash steps. Fast LC/MS-MS analysis in under five minutes creates efficiency for THC analysis.
References
1. Phenomenex Application Note 19947: Analysis of THC & Metabolites from Whole Blood on Strata-X-Drug B and Kinetex C18 by LC-MS-MS2. Phenomenex Application Note: Analysis of THC & Metabolites from Whole Blood on Strata-X-Drug B and Kinetex C18 by LC-MS-MS3. Huestis, MA. Pharmacokinetics and metabolism of the plant cannabinoids, delta9-tetrahydrocannabinol, cannabidiol and cannabinol. Handb Exp Pharmacol. 2005;(168):657-90. PubMed PMID: 165967924. Protonix® [package insert]. Philadelphia, PA: Pfizer, Inc; 20115. Asbridge M, Hayden JA, Cartwright JL. Acute cannabis consumption and motor vehicle collision risk: systematic review of observational studies and meta-analysis. BMJ 2012;344:e5366. Kreutz DS and Axelrod J. Delta-9-tetrahydrocannabinol: localization in body fat. Science 1973 Jan 26;179(4071):391-3 PubMed PMID: 4682965
Protonix® is a registered trademark of Pfizer, Inc.Kinetex™ is a trademark of PhenomenexStrata™ is a trademark of PhenomenexASPEC™ is a trademark of Gilson, Inc.TRILUTION® is a registered trademark of Gilson, Inc.API 3000™ is a trademark of AB SCIEX
Peak #/Analyte Mass Range % Recovery % RSD (n=3)1 / THC-OH 331.0>193.3 100.3 3.1
2 / THC-OH-d3 334.0>196.3 NA NA
3 / THC-COOH 345.2>327.0 103.9 5.4
4 / THC-COOH-d3 348.0>330.1 NA NA
5 / THC 315.2>193.1 99.3 3.9
6 / THC-d3 318.2>196.1 NA NA

38 393635
Improving Laboratory Efficiency & Flexibility with Automated Sample Preparation Systems – the Impact of the Gilson GX-281 Dual Z-Arm Weighing Station
Featured Products: GX-281 Liquid Handler, TRILUTION® LH v3.0 Liquid Handling Software.
Introduction
Automating sample preparation procedures eliminates variability and improves efficiency of the overall process, allowing the scientist to be confident in the resulting data from laboratory applications.
This application outlines the use of the Gilson TRILUTION LH v3.0 software to automate liquid handling, as well as other common procedures, to improve laboratory efficiency. The use of TRILUTION LH v3.0 to incorporate third party devices (barcode readers, balances, pH meters, etc.) is discussed. This application uses a GX-281 Liquid Handler used to perform automated liquid handling with the inclusion of a balance in the system operation.
The primary goal of any laboratory is to collect and analyze data, and it is rare for many samples to be ready for analysis the moment they enter the lab. Samples may need clean up or purification prior to downstream analysis. Standards and controls may need to be created and analyzed with the samples in order to form a baseline against which the samples will be compared. Samples may need to be modified (pH adjustments, solvent composition, sample derivatization, etc.) in order to make them more amenable to the analysis technique(s) that will be used. Obtaining data is generally more complicated than simply inserting a sample into a machine for analysis and getting the desired result at the end.
Sample preparation procedures are often among the most time consuming and labor intensive functions within the laboratory, and because of this, they are often a prime candidate for the introduction of error and inefficiencies into the sample analysis process. Sample preparation procedures often consist of a series of monotonous tasks, which by their nature make it difficult for laboratory personnel to maintain focus and concentration for long periods of time, when these procedures are performed using manual methods. These procedures require just as much care and attention as the final sample analysis, because small errors can be magnified and propagated throughout the process, and skew the final results.
Automation can address many potential bottlenecks and sources of error within the sample preparation process, improving process efficiency, personnel efficiency, and confidence in data obtained. When comparing automated solutions vs. manual methods, the following items should be considered:
Throughput• The potential throughput of laboratory personnel is limited to the hours present within a workday.• Automated solutions operate at any time of the day, including unattended operation overnight or over the weekend.
Consistency• The consistency of work completed by laboratory personnel can vary from person to person, and even from one instance of work to another when completed by the same person. For example, procedures such as pipetting can vary depending on the skill level of the user, and their ability to consistently apply the skill. • Liquid handling instrumentation can be used to produce reliable and consistent results every time.
Flexibility• Liquid handling instrumentation and software packages provide a level of fine-tuned control over the sample preparation process. This level of control is typically not possible when performing procedures using manual methods. Time dependent parameters such as flow rate, or the parallelization of time dependent processes, such as incubations or derivatizations, would be difficult, or nearly impossible, for laboratory personnel to perform on a consistent basis.

40 41
Table 1. Gilson GX-281 Dual Z-Arm Weighing Station Configuration*.Experimental Conditions
In order to highlight the benefits of an automated workflow, an application which involves sample weighing is presented below. This application was performed on a GX-281 Prep Liquid Handler utilizing a CPA324S Analytical Balance (Sartorius AG: Goettingen, Germany), under software control using TRILUTION® LH v3.0 (Table 1). Software control of the balance was achieved using GEARS, a set of software tools designed to integrate third party devices with TRILUTION LH v3.0. A summary of the liquid handling procedure is below:
1. Tare balance, prior to transfer of tube.2. Transfer tube (empty) in specified Well from rack to balance, and record the Tube Weight.3. Transfer specified Sample Volume to tube, and record Total Weight.4. Calculate Sample Weight.5. Transfer tube (with sample) to original rack location.6. Record Well, Sample Volume, Tube Weight, Total Weight, and Sample Weight to spreadsheet for later analysis.7. Repeat steps 1-6, for each sample to be processed.
The liquid handling procedure was programmed in TRILUTION LH v3.0, by utilizing a sequence of Operators and Tasks which were dragged into the Method Builder Workspace, resulting in a series of actions which mirrored the manual process. A Sample List was then created using the Application Builder of TRILUTION LH v3.0, where a Well and Sample Volume was defined (Figure 1). Finally, the Application was executed, and the instrumentation performed the sample preparation procedure, unattended.
Figure 1. TRILUTION LH v3.0 - Method Builder and Application Builder.
3837
Description Part NumbersGX-281 Liquid Handler Base Unit – No Z-Arm 261036
GX-281 Liquid Handler Dual Z-Arm Special 1852
Barcode Reader for GX-281 Dual Z-Arm -Barcode Reader (Keyence SR-600) with Fixed Mount
Special 1852BRequires: Tube Gripper (Special 1852E)
Tube Gripper for GX-281 Dual Z-Arm -Tube Gripper (Schunk PGN + 50) with Fixed Mount
Special 1852ERequires: Solenoid Valve Manifold (Special 1852F or Special 1852G), and Gripper Fingers (Special 1852H)
Solenoid Valve Manifold for GX-281 Dual Z-Arm -Solenoid Valve Manifold (Festo VUVG-S10-M52-RT-M5-1S2RL-S3), 4 Valves
Special 1852F
Solenoid Valve Manifold for GX-281 Dual Z-Arm -Solenoid Valve Manifold (Festo VUVG-S10-M52-RT-M5-1S2RL-S3), 2 Valves
Special 1852G
Gripper Fingers for Tube Gripper (Special 1852E) - Gripper Fingers, 12-16 mm Test Tubes
Special 1852H
Balance Sartorious CPA324S
Balance Adapter Plate for GX-281 Special 1904
Tube Locator Options: Special 1904A
for Special 1904, 12x32mm Vial Special 1904A
for Special 1904, 15x45mm Vial Special 1904B
for Special 1904, 16x100mm Test Tube Special 1904C
GX-281 Pump Options:
GX Prep Solvent System 261350
402 Syringe Pump, Single F410511
402 Syringe Pump, Dual with Tee F410512
402 Syringe Pump, Dual with 2 Valves F410513
TRILUTION® LH v3.0 Software Package 210630R30
TRILUTION LH v3.0 License, Lifetime 21063023* The GX-281 Dual Z-Arm Weighing Station supports the same Z-Arm options as the standard GX-281 Z-Arm (probes, probe holders, probe guides, transfer tubing, etc.). These items are not included and should be ordered separately to fit each application.

42 43
Results
During the execution of the Application, data obtained from the balance was recorded to a spreadsheet (in addition to the Well and Sample Volume), which was later used to determine the precision and accuracy of sample delivery performed on the liquid handling system (Table 2).
Table 2. Results and Analysis of Data Obtained from Weighing Application.
Well Sample (µL)
Tube Weight
(g)
Total Weight
(g)
Sample Δ(g) Ave.
(g)
Std. Dev. (g)
% CV
Expected Δ(g)*
Error Δ(g) % Error Ave %
Error
1 250 4.6764 4.9229 0.2465 0.2505 0.0032 1.29 0.2480 -0.0015 -0.59% 1.01%
2 4.6472 4.8978 0.2506 0.0026 1.06%
3 4.4681 4.9025 0.2544 0.0064 2.59%
4 4.6751 4.9255 0.2504 0.0024 0.98%
5 500 4.6581 5.1509 0.4928 0.4956 0.0040 0.80 0.4959 -0.0031 -0.63% -0.07%
6 4.7068 5.2010 0.4942 -0.0017 -0.35%
7 4.6783 5.1798 0.5015 0.0056 1.12%
8 4.6622 5.1561 0.4939 -0.0020 -0.41%
9 750 4.6837 5.4401 0.7564 0.7471 0.0071 0.95 0.7439 0.0125 1.68% 0.43%
10 4.6635 5.4027 0.7392 -0.0047 -0.63%
11 4.6863 5.4317 0.7454 0.0015 0.20%
12 4.6788 5.4262 0.7474 0.0035 0.47%
13 1000 4.6844 5.6714 0.9870 0.9907 0.0028 0.29 0.9919 -0.0049 -0.49% -0.12%
14 4.6993 5.6912 0.9919 0.0000 0.00%
15 4.6772 5.6675 0.9903 -0.0016 -0.16%
16 4.6650 5.6587 0.9937 0.18%
*Sample Density: 0.9919 g/mL
4039
Summary
The procedure described above represents a typical workflow for a laboratory process which requires the transfer of liquid samples from one location to another, coupled with the integration of a balance to record data for auditing purposes (in this case, to provide a means of measuring the volume of sample delivered, gravimetrically). As part of a larger overall sample analysis process, the data obtained in this application could provide a valuable piece of information for auditing purposes, or perhaps could be used as an input into a subsequent part of the process.
TRILUTION® is a registered trademark of Gilson, Inc.
44 45
PHA
RMA
CEU
TICA
L PHA
RMA
CEUTICA
L
Natural Product Purification of Lycopene and β-Carotene Using Flash Column Sample Clean-up Prior to High Pressure Normal Phase Chromatography with the Gilson PLC 2020
Featured Products: Gilson PLC 2020 Personal Purification System.
Introduction
Purifying low level compounds, such as those typically isolated from natural products, is an area of growing interest for the purpose of discovering new chemical entities. Natural product purification from plants and food products is of particular interest for any pharmacological or biological activity that may be useful in drug discovery and human health. Synthesis may not be an option for all natural products where it may be too complex, expensive or too time consuming to accomplish.
Purification of low level compounds from natural products can be challenging due to the isolation of a small compound presence among other interfering sample compounds and the sample matrix. Flash purification provides an optimal environment for low concentration compounds by allowing for a large amount of sample to be injected and purified via large particle flash columns and organic solvents that can be quickly evaporated post purification. The tedious and labor intensive process of manual fraction transfer from multiple injections into a single pooled tube requires extra rinse solvent, additional dry-down time, and can create error from transferring. All of these are eliminated by automated fraction pooling.
The Gilson PLC 2020 Personal Purification System purified β-Carotene and Lycopene, naturally occurring plant carotenoid of particular interest for their antioxidant activity and possible health benefits, from tomato peel and various tea extracts using flash chromatography and solvent selection to decrease overall run time (Figure 1). The purified and pooled fraction was re-injected to determine percent recovery.
Figure 1. β-Carotene (top) and Lycopene (bottom). Both Compounds Have a Chemical Formula of C40H56.
Experimental Conditions
Materials• Gilson PLC 2020• Lycopene standard (Wako chemicals)• β-Carotene standard (Sigma Aldrich)• Pectinase from Aspergillus niger (Sigma Aldrich)• Pectinase from Aspergillus aculeatus (Sigma Aldrich)• Dried tomato peel from roma and cherry tomato• Lipton Darjeeling Black tea (India)• Brooke Bond Label Special (India)• Hojicha green tea (Japan)• O’sulloc Premium green tea: Jaksulsoo (Korea)• Lan Bao Cha Kuding tea (China)• Silica Flash cartridge - SiliaSep™ 12 g, 40-63 µm, 60 Å (Figure 2) (SiliCycle)• Silica Semi-Preparative column - Luna® 5 u Silica(2) 100 Å AXIA Packed, 50x21 (Phenomenex)• Mobile phase
• A: Hexane• B1: Hexane : triethylamine (99.9:0.1)• B2: Hexane : tetrahydrofuran (80:20)
4241
46 47
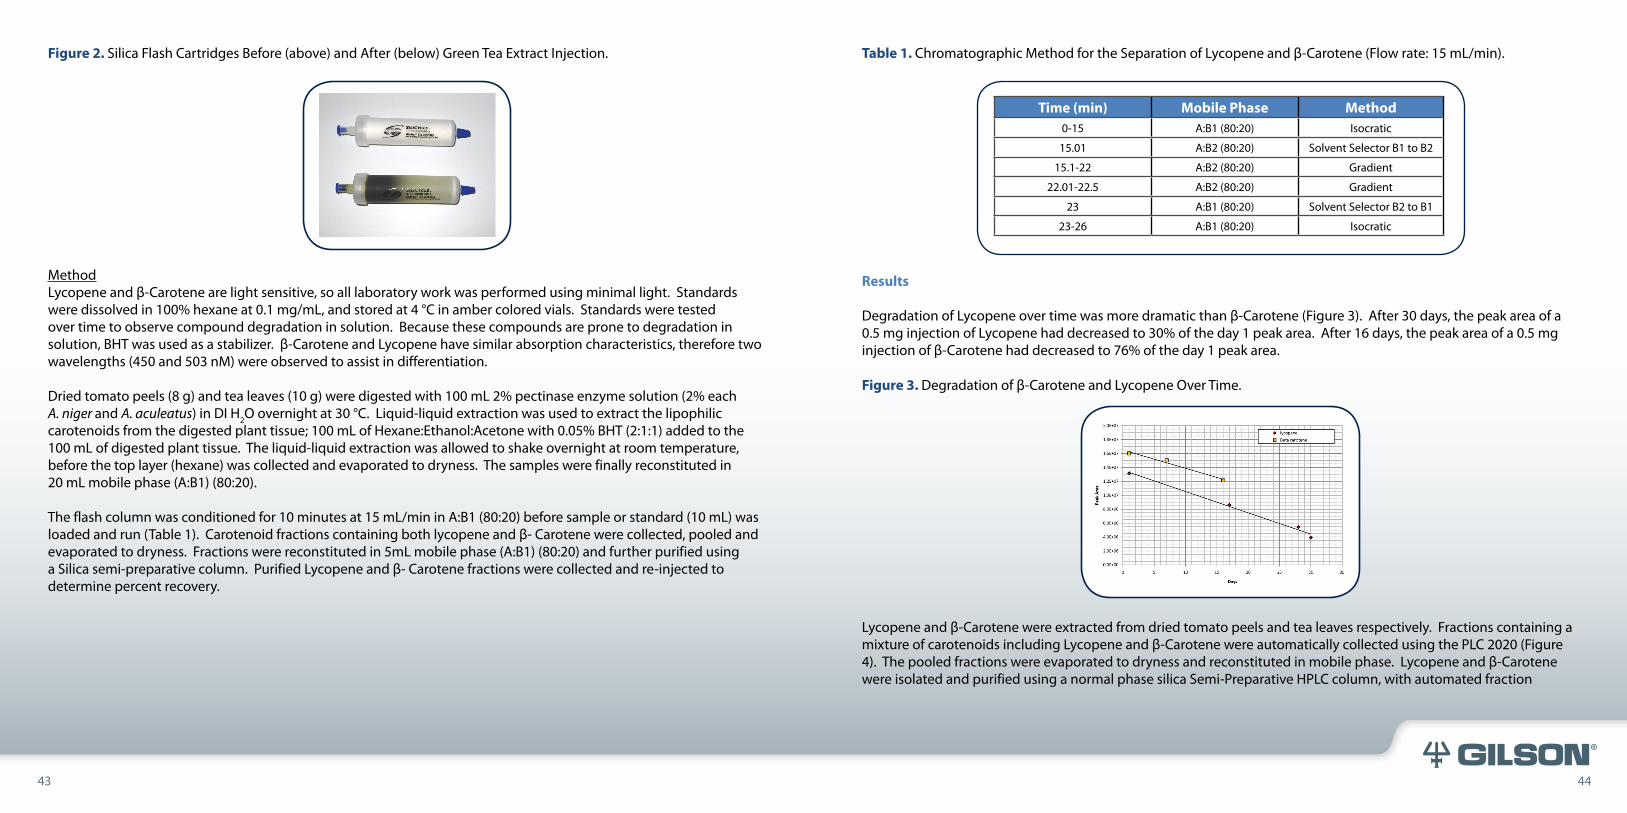
Figure 2. Silica Flash Cartridges Before (above) and After (below) Green Tea Extract Injection.
MethodLycopene and β-Carotene are light sensitive, so all laboratory work was performed using minimal light. Standards were dissolved in 100% hexane at 0.1 mg/mL, and stored at 4 °C in amber colored vials. Standards were tested over time to observe compound degradation in solution. Because these compounds are prone to degradation in solution, BHT was used as a stabilizer. β-Carotene and Lycopene have similar absorption characteristics, therefore two wavelengths (450 and 503 nM) were observed to assist in differentiation.
Dried tomato peels (8 g) and tea leaves (10 g) were digested with 100 mL 2% pectinase enzyme solution (2% each A. niger and A. aculeatus) in DI H2O overnight at 30 °C. Liquid-liquid extraction was used to extract the lipophilic carotenoids from the digested plant tissue; 100 mL of Hexane:Ethanol:Acetone with 0.05% BHT (2:1:1) added to the 100 mL of digested plant tissue. The liquid-liquid extraction was allowed to shake overnight at room temperature, before the top layer (hexane) was collected and evaporated to dryness. The samples were finally reconstituted in 20 mL mobile phase (A:B1) (80:20).
The flash column was conditioned for 10 minutes at 15 mL/min in A:B1 (80:20) before sample or standard (10 mL) was loaded and run (Table 1). Carotenoid fractions containing both lycopene and β- Carotene were collected, pooled and evaporated to dryness. Fractions were reconstituted in 5mL mobile phase (A:B1) (80:20) and further purified using a Silica semi-preparative column. Purified Lycopene and β- Carotene fractions were collected and re-injected to determine percent recovery.
Table 1. Chromatographic Method for the Separation of Lycopene and β-Carotene (Flow rate: 15 mL/min).
Results
Degradation of Lycopene over time was more dramatic than β-Carotene (Figure 3). After 30 days, the peak area of a 0.5 mg injection of Lycopene had decreased to 30% of the day 1 peak area. After 16 days, the peak area of a 0.5 mg injection of β-Carotene had decreased to 76% of the day 1 peak area.
Figure 3. Degradation of β-Carotene and Lycopene Over Time.
Lycopene and β-Carotene were extracted from dried tomato peels and tea leaves respectively. Fractions containing a mixture of carotenoids including Lycopene and β-Carotene were automatically collected using the PLC 2020 (Figure 4). The pooled fractions were evaporated to dryness and reconstituted in mobile phase. Lycopene and β-Carotene were isolated and purified using a normal phase silica Semi-Preparative HPLC column, with automated fraction
Time (min) Mobile Phase Method0-15 A:B1 (80:20) Isocratic
15.01 A:B2 (80:20) Solvent Selector B1 to B2
15.1-22 A:B2 (80:20) Gradient
22.01-22.5 A:B2 (80:20) Gradient
23 A:B1 (80:20) Solvent Selector B2 to B1
23-26 A:B1 (80:20) Isocratic
4443

48 49
collection (Figures 5, 6). A portion of the final fraction of Lycopene and β-Carotene was re-injected onto the semi-preparative HPLC column to determine the percent of the desired peak that was recovered. A 99.5% (standard error 2.7%) average recovery was observed in the standards and samples.
Figure 4. Lycopene From Dried Tomato Peel (A) and β-Carotene From Lipton Darjeeling Tea (B) Separated on Low Pressure Silica Flash Cartridge.
Figure 5. Lycopene (A) and β-Carotene (B) Separated on Silica Semi-Preparative HPLC Column.
A
B
A
B
4645

50 51
Figure 6. Lycopene (PN:2) and β-Carotene(PN:1) Separated on Silica Semi-Preparative HPLC Column.
The dried tomato peels yielded more than 0.5 mg Lycopene per 8 g extraction. The highest amount of β-Carotene came from the O’sulloc Premium Jaksulsoo green tea (Korea), and the lowest yield came from the Kudingcha Holly leaf tea (China) (Figure 7). The O’sulloc Premium Jaksulsoo green tea (Korea) yielded less than 0.5 mg β-Carotene per 10 g extraction; however the purified product was not quantified.
Figure 7. β-Carotene Peak Area for Various Dried Tea Leaf Extracts (orange), and Lycopene Peak Area for Dried Tomato Peel Extract (red).
Summary
Many natural products are thought to have tremendous health benefits including prevention or treatment of disease. The purification of natural products from plant tissues is an area of significant interest for numerous researchers. This application presents a method for isolating and purifying Lycopene and β-carotene from tomato peels and tea leaves using low pressure normal phase flash chromatography and automated fraction collection. The PLC 2020 provided hands free fraction collection with 99.5 +/-2.7% recovery of the desired product peaks. Despite the similarities between Lycopene and β-Carotene, these carotenoids were able to be separated and purified. Further method development could be used to perfect a system for the purification of these carotenoids, while modifications to this method could be employed to isolate and purify other natural products.
SiliaSep™ is a trademark of SilicycleLuna® is a registered trademark of Phenomenex
4847

52 53
Automated Separation of Crude Extracts into Fractions for Primary High Throughput Screening
This application was provided by David R. Appleton, Mark S. Butler, and Antony D. Buss; MerLion Pharmaceuticals Pte Ltd, 1 Science Park Road, The Capricorn #05-01, Singapore Science Park II, Singapore 117528
Featured Products: Gilson 215 Liquid Chromatography System Equipped with a 322 Gradient Mobile Phase Pump, 155 Dual Wavelength Detector and TRILUTION® LC Liquid Chromatography Software.
Introduction
The screening of natural products (NP) is an important component of the drug discovery process with approximately 50% of approved drugs being derived from NPs (1). These NPs come from complex biological systems which, if not removed, can produce problems that affect screening assays. This application note describes an automated prefractionation process, where crude extracts of microbial cultures are fractionated prior to primary screening. The automated prefractionation process increased assay hit rates without a reduction of hit quality (2).
Benefits• Concentrates metabolites by removing salts, sugars, lipids etc• Minor active compounds more likely to be discovered • Compounds with activity masked in the crude extract more likely to be discovered• Fractions can be selectively screened to avoid interference compounds• Crude extracts screened alongside fractions• Fractions tested at equivalent dose at >10 times crude concentration
Experimental Conditions
Materials• Microbial extracts• Methanol• Automated LC-RP C18 system
• Gilson 215 with 322 Gradient Mobile Phase Pump and 155 Dual Wavelength Detector• Mobile Phase
• A: Milli-Q H2O with 0.1% formic acid• B: Acetonitrile with 0.1% formic acid
• Waters Xterra® RP18 30x19mm column• Waters Xterra RP18 Guard column 10 mm
• Genevac HT-8 centrifugal evaporator
Method• 48 samples prepared for overnight automated fractionation• 1.4 mL methanol added to approximately 500 mg dried microbial extracts• Samples sonicated for 1 hour • Transfer extract to 96 well plate and centrifuge• 96 well plate placed onto Gilson 215 bed (Figure 1)• 1 mL (400-500 mg) sample injected onto C18 column
• Flow rate: 9 mL/min• 8 minute gradient (0-100% B)
• Fractions collected into custom racks holding Genevac evaporator racks• 16 x 100 mm tubes• Start at the tail end of the solvent front• Fractions (4) collected every 1.44 minutes (4 fractions, 12 mL total volume)
• Fractions dried using the Genevac HT-8 centrifugal evaporator (12 hour cycle)• Dried fractions reconstituted in methanol and split into 5 assay plates for screening
Figure 1. Automated LC-RP C18 system; A) Crude Extracts, B) Gilson 215 System with Custom Racks Holding Genevac Evaporator Racks, C) C18 Reverse Phase Column with Guard.
5049

54 55
Results
The majority (80%) of the crude extract mass was eluted off the column with the solvent front and therefore not collected (Figure 2). The late eluting lipophilic compounds were also not collected. The prefractionation of crude extract allowed major components to be screened separately and minor components to be separated from other interfering chemicals and concentrated to determine activity.
Figure 2. Example Chromatogram of Prefractionated Microbial Crude Extract. Four Fractions Collected Following Solvent Front. A) Major Components in Fraction 3 and 4 can be Divided into Fractions and Screened Separately. B) Minor Components in Fractions 3 and 4 can be Concentrated and Separated From (media) Components in Fraction 2.
Crude extracts and fractions were screened for biological activity such as antimicrobial % inhibition. The crude extract and fractions of sample T467 were not active at equivalent doses; however fraction 3 was active following prefractionation (Figure 3). The active compounds in fraction 3 were minor compounds (0.3% wt/wt) with weak activity (30-50 µM), which was masked or blocked in the crude extract. The crude extract of sample T174 showed no activity, while the equivalent dose of fraction 3 did (Figure 4). Compounds in the solvent front of T174 masked the effects of fraction 3 despite good activity (1 µM) and high concentration (1% wt/wt) of the compound of interest. Figure 3. Equivalent Dose LC-Bioassay Plots of a Sample Demonstrating How Minor Compounds are Concentrated by Prefractionation by Comparing A) Inactive T467 Crude Extract and B) Active T467 Fraction 3.
5251

56 57
Figure 4. Equivalent Dose LC-Bioassay Plots for T174 Crude.
Summary
An analysis of 1700 hits from 11 screens showed that 80% of the total number of hits came from fractions alone following prefractionation and less than 10% of were found in the crude extract alone (Figure 5). Most hits (84%) were only found in a single fraction, with fractions 2-4 getting reasonable distribution (Figure 6). There were over 12 times more hits found in the fractions than in the crude alone. The hit rate per extract was 5 times higher following prefractionation, with a 20% increase in compound novelty. Compound activities (IC50) following prefractionation remained similar or better than previous methods. These data show the benefits of prefractionation of crude extract prior to screening.
Figure 5. Percentage Makeup of Hits From Prefractionated Set. The Majority of Hits Came From the Fractions Only, With 84% of Hits Being Found in a Single Fraction.
Figure 6. Activity Distribution. While the Majority of Hits Came From Fractions 2-4, There is Fairly Even Distribution Across These 3 Fractions.
References
1. Newman DJ, and Cragg GM. Natural Products as Sources of New Drugs over the Last 25 Years. J. Nat. Prod. 2007; 70:461-4772. Appleton DR, Buss AD, Butler MS. A Simple Method for High-Throughput Extract Prefractionation for Biological Screening. Chimia. 2007;61:327–331
TRILUTION® is a registered trademark of Gilson, Inc.Xterra® is a registered trademark of Waters corporation
5453

58 59
Analysis of Extract from Marine Yeast with Gilson Semi Micro 2D HPLC System
The data for this application note was provided by Y Hayashi, Applied Technical Department, M&S Instruments Inc., Japan Featured Products: Semi Micro 2D HPLC: Gilson Manual Injection System Coupled to a Gilson 233XL HPLC System and TRILUTION® LC Liquid Chromatography Software.
Introduction
Marine yeast are found in a variety of natural water sources. Various marine organisms contain natural products that have bioactivity. Often these bioactive compounds are metabolites that are a natural part of the organism’s life cycle, including self-defense. Many uses of purified naturally occuring bioactive compounds are being uncovered, with many projected for therapeutic applications. This application discusses a unique automated 2D technique for anion exchange purification of marine yeast extract prior to reverse phase analysis using a Gilson manual injection system coupled to a Gilson 233XL HPLC system. Note: A Gilson GX-271 Liquid Handler could be substituted for the 233XL in future applications.
Experimental Conditions
Methods – Sample PreparationA sample of marine yeast was treated with lysis buffer (20 mM Tris-acetate (pH 7.6), 1 mM EDTA, 5 mM DTT) to disrupt the cells. The marine yeast was treated for 30 min by Covaris S2 (Acoustic solubilizer, Covaris Inc. USA) for complete cellular disruption and lysis. The supernatant was injected using the phase 1 system components.
Methods – Phase 1 PurificationAnion exchange chromatography was used in phase 1 as the primary purification step.
• Column: Sepax SAX NP1.7, 1.7 micron, non-porus, 3 x 50 mm (Sepax Technologies Inc.)• Mobile Phase :
• A: 20 mM Tris-acetate pH 7.5• B: A + 0.5 M Sodium acetate• Flowrate: 0.2 mL/min• Gradient: %B: 1 % - 99 % (1.6 min – 11.5 min)• Gilson Binary Pumping System (305 – 5 SC, 306 – 5 SC, 811D – 65 µL, 805)
• UV Detection: • 280 nm• Gilson 155 Dual Wavelength UV/VIS Detector
• Supernatant Manual Injection: • 20 µl• Rheodyne 9925i Manual Injection Valve
• Fraction Collection:• Time Based• Gilson 233XL with 3-way fraction collection valve
Note: system plumbing was optimized for minimal dead volume, with fraction delay volume strictly calculated.
Methods – Phase 2 AnalysisEach fraction collected in phase 1 was re-injected and analyzed with phase 2 system components.
• Column: Sepax GP C18, 2.2 micron, 120 Å, 3 x 50 mm (Sepax Technologies Inc.)• Mobile Phase :
• A: 0.1% TFA in H2O• B: 0.1% TFA in Acetonitrile• Flowrate: 0.5 mL/min• Gradient: %B: 2% - 75% (1.8 min – 14.3 min)• Gilson 321 Binary Pumping System – H1
• UV Detection: • 280 nm• Gilson 155 Dual Wavelength UV/VIS Detector
• Fraction Re-Injection: • 60 µl• Gilson 233XL with injection valve and 293 µL custom injection loop
Results
2D chromatography allows for a bioactive sample to be purified and multi-dimensionally analyzed with a semi-micro Gilson HPLC system. The combination of the system components and the efficiency of the columns allows for compound separation under pressure. The high performance columns used are of nonporous and small particle sizes,
5655

60 61
creating very high backpressure (~300 bar) that enables faster compound resolution using a shorter column length. Simple time-based fraction collection allows for anion exchange purification into separate collection tubes for further analysis via phase 2 reverse phase chromatography (Figure 1).
Figure 1 (Left). Marine Yeast Supernatant - Anion Exchange Purification Chromatography.Figure 2 (Right). Select Fractions from Marine Yeast Supernatant - Anion Exchange Purification Chromatography Used for Re-Injection.
Figure 3. Re-injected Fractions from Marine Yeast Supernatant Analyzed by Reverse Phase Chromatography.
Figure 4. Unpurified Marine Yeast Lysate Sample Injected onto Reverse Phase Column.
Figure 5. Selected Overlayed Re-injected Fractions Normalized Against Chromatography of Unpurified Marine Yeast Lysate Sample.
TRILUTION® is a registered trademark of Gilson, Inc.
5857

62 63
ResourcesThe Gilson Knowledge Center focuses on applications and education. There are a wide range of resources, from web courses, to workshops, to complimentary web seminars, available to assist you with enhancing and optimizing your applications.
Registration
Please contact the Gilson Knowledge Center with questions and for registration details:800-445-7661 | [email protected]
Web Seminars - FREE
Get complimentary industry-leading applications and innovative laboratory techniques for both pipettes and instruments. Attend to get tips and techniques directly from industry scientists co-hosting with Gilson scientists. Using our web format you can keep updated without travel.
Local Workshops
Learn quick tips and pipetting techniques or get answers to your TRILUTION® software questions by attending our half day, hands-on local workshops. Our workshops offer >65% hands-on training and practice. Receive complimentary certification for attending.
RESO
URC
ES
Web Training
FREE educational videos on how to use Gilson PIPETMAN® pipettes and benchtop accessories. Get the latest tips and techniques directly from Gilson. Go to our YouTube channel and check out what’s new: www.youtube.com/user/GilsonPipetman
FREE TRILUTION® podcasts and quickclips are available from Gilson. Get techniques and tips on using your Gilson systems in five minutes or less. Stop by our Instrument TechTips website to check it out: http://instgilsontechtips.podbean.com/.
Publications
Course Options Part # Duration
Local Workshops
Pipetting Fundamentals PIPETWKSHPF
3 HoursPipette Maintenance &
Calibration PIPETWKSHPM
TRILUTION® LH Software INSTWKSHPLH
TRILUTION® LC Software INSTWKSHPLC
Course Options Part # Duration
Complimentary Web Seminars
Industry-leading applications and laboratory techniques
Spring & Fall Pipette and Instrument Seminars
www.gilson.com1 hour
26
TRILUTION
LC v2.1–Vol 1
TRILUTION® LC Software v2.1 Technical Notes Handbook
HPLC Troubleshooting Guide
®
RESOU
RCES
6059
TRILUTION
LH v3.0–Vol 1
TRILUTION® LH Software v3.0 Technical Notes Handbook
Gilson Guide to SPE AutomationCondition | Load | Wash | Elute
Analyte Interferences
Conditioning Loading Sample Washing Eluting
Analyte Interferences
Conditioning Loading Sample Washing Eluting
®
Analyte Interferences
Conditioning Loading Sample Washing Eluting

Gilson, Inc. World Headquarters | PO Box 620027 | MIddleton, WI 53562-0027, USA | Tel: 800-445-7661 | Fax: 608-831-4451Gilson S.A.S. | 19, avenue des Entrepreneurs | BP 145 | F-95400 Villiers-le-bel, FRANCEwww.gilson.com | [email protected] | [email protected] | [email protected] | © 2012 Gilson, Inc. | LT319338 | Volume: 2 Issue: 1
Do you have an application that uses Gilson pipettes or instruments? We would like to hear from you!
Submit your application to us for an opportunity to be referenced in one of our future bi-annual Gilson Application Notes Handbooks.
Submit Your Application Herehttp://www.gilson.com/en/AI/Applications