application note attune nxt flow cytometer...
TRANSCRIPT

APPLICATION NOTE Attune NxT Flow Cytometer
Validated 10-color T cell panel using the Attune NxT Flow CytometerIntroductionMulticolor immunofluorescence panels are widely used in flow cytometry and are often difficult and time-consuming to develop. The Optimized Multicolor Immunofluorescence Panel (OMIP) publications were established to help the researcher by providing a thoroughly tested and validated set of antibodies and reagents that can be used together for multiparameter characterization or evaluation of a specific cell state or response [1]. Each OMIP publication is meant to help alleviate the burden of panel development and optimization by providing the technical details and experimental conditions used to optimize each panel [2]. By definition, an OMIP publication includes all of the necessary information required for the execution of the panel of interest. The OMIP publication contains an overview of the purpose of the panel, a listing of antibody clones and fluorophore combinations, information on sample type, and similarities to any existing OMIPs, as well as a representative figure showing experimental results including the gating strategy. In this application note, we take advantage of the OMIP-009 publication [3], which is optimized for characterizing the immunological response of human T cells, applying it to the 4-laser, 16-parameter configuration of the Invitrogen™ Attune™ NxT Flow Cytometer with Autosampler. Additionally, we discuss the importance of antibody titration and optimizing antibody concentration in panel testing. Furthermore, we review the importance of fluorescence minus one (FMO) controls.
Stimulation of peripheral blood mononuclear cells (PBMCs)Stimulants are used for detecting intracellular cytokines that are in low abundance within normal, healthy cells. An inflammatory response can be forced within a cell, once the cell has been primed with a stimulant (e.g., phorbol 12-myristate 13-acetate (PMA), lipopolysaccharide (LPS), staphylococcal enterotoxin B (SEB), or peptide pools).
The appropriate stimulant and stimulation condition is dependent on the cell type and cytokine of interest. Once a cell is primed with a stimulant, the cell is altered in a number of ways, including cell morphology, membrane expression of antigens, and accumulation of cytokines throughout the cell. Length of stimulation period and concentration of stimulant can affect the expression of intracellular cytokines. In this application note, we used either SEB or or human cytomegalovirus (HCMV) pp65 peptide pool, because both materials cause an inflammatory response and produce an influx of the cytokines of interest (TNFα, IL2, and IFNγ). SEB is an exotoxin that is responsible for food poisoning in humans. HCMV pp65 peptide pool is derived from HCMV, which is a virus that causes chickenpox in humans. When studying intracellular cytokines, it is necessary to block the secretion of such cytokines with protein transport inhibitors, such as brefeldin A (BFA) or monensin, which allows for higher detection levels of such cytokines.

Antibody titrationsIn any flow cytometry experiment, it is important to maximize the fluorescence signal while having low levels of background. Optimizing the separation of positive and negative signals will help to determine the optimal concentration of antibody-fluorophore conjugate needed for accurately labeling the cells of interest. In order to accomplish this, titration of all antibody conjugates used in the panel is required [4,5]. Titration allows optimization of antibody concentration that is necessary to maximize the separation between positive and negative fluorescence peaks, minimize nonspecific binding, and establish the highest labeling efficiency of an antibody.
Regularly, vendors will recommend a concentration to use based on their standard protocols. However, to obtain the best results, it is best to optimize the concentration of antibody used for specific assay conditions, including cell type and instrument used. Typically, the optimal concentration of an antibody to use in an experiment is determined by having a high stain index (SI). SI is calculated by subtracting the median fluorescence intensity (MFI) of the negative peak from the MFI of the positive peak and dividing by two times the standard deviation of the negative peak. The optimal antibody concentration will have the greatest separation between positive and negative MFI peaks. The SI also accounts for the spread of the negative population, which can decrease the separation of positive and negative populations. To demonstrate the importance of optimizing antibody concentrations for an experiment, we show results of the full staining panel with vendor-recommended antibody concentrations and with optimized antibody concentrations, and compare the results.
As an example, isolated peripheral blood mononuclear cells (PBMCs) from healthy donors were stained with varying concentrations of an Invitrogen™ anti-CD3 APC–Cy®7 conjugate. SI, MFI, and percent positive cells were calculated from singlet cells as identified through a forward height vs. forward area dual-parameter plot that was then gated on live CD3-positive cells and graphed using GraphPad Prism™ software version 6.07 (Figure 1A). The optimal concentration of antibody to use is determined by the intersection of all three dotted lines that represent all three parameters. There can be a number of optimal concentrations of antibody. For example, CD3 APC–Cy7 antibody conjugate at 4.0 µg, 2.0 µg, and 1.0 µg per test can be thought to have ideal characteristics for use in a panel because the SI, MFI, and percent positive cells are at their highest level (outlined in the blue dotted box in
Figure 1. Titration of CD3 antibody conjugate. Isolated PBMCs from healthy donors were stained with varying quantities of CD3 antibody conjugate. (A) Graph of the SI, MFI, and percent positive cells. The ideal quantities of antibody to use in this example are highlighted by the blue dotted box. (B) Composite graph produced using FlowJo™ software version 10.0.8r1 of all serial dilutions of CD3 antibody conjugate. The optimal titer is identified by the red outline, in this case 1.0 µg/test.
CD3 antibody conjugate optimizationIdeal quantities
log10 conjugate (µg)
Stain index
Mean fluorescence intensity
% positive
No
rma
lize
d %
po
siti
ve
No
rma
lize
d M
FI a
nd
SI
150
100
50
0.01 0.1 1 10
150
100
50
0
A
B Singlets
Figure 1A). However, the optimal concentration of antibody is the lowest amount of antibody needed to sufficiently detect all positive targets within a sample, obtain a high mean fluorescent signal, and have low levels of nonspecific binding. As shown in Figure 1B, the percentage of cells is increased in the negative fluorescence peak at 4.0 µg CD3 antibody conjugate, as compared to 2.0 µg and 1.0 µg CD3 antibody conjugate per test. As in all cases, the optimal concentration of antibody is not only based on SI, MFI, and percent positive cells, but it is also dependent on low levels of background.

The nine antibody conjugates used in this adaptation of OMIP-009 are listed in Table 1. The optimal quantity is listed in the table as determined through the titration procedure described to obtain the most accurate detection of each cell population (Figure 2). As in all flow cytometry experiments, a dead cell stain (Invitrogen™ LIVE/DEAD™ Fixable Aqua Dead Cell Stain) was used to help ensure accurate results. Since antibodies can nonspecifically
Table 2. Attune NxT instrument configuration.
Target FluorophoreAttune NxT detector and emission filter Laser line (excitation)
CD8 Pacific Blue VL1; 440/50 nm 405 nm
LIVE/DEAD Fixable Aqua stain
NA VL2; 512/25 nm 405 nm
TNFα FITC BL1; 530/30 nm 488 nm
CD28 PE-Cy5.5 BL3; 695/40 nm 488 nm
IL2 PE YL1; 585/16 nm 561 nm
CD4 PE-Texas Red YL2; 620/15 nm 561 nm
CD45RA PE-Cy7 YL4; 780/60 nm 561 nm
IFNγ APC RL1; 670/40 nm 637 nm
CD197 (CCR7) Alexa Fluor 700 RL2; 720/30 nm 637 nm
CD3 APC-Cy7 RL3; 780/60 nm 637 nm
Table 1. Multicolor panel showing antibody conjugates and optimal titer.
Target Clone Fluorophore VendorOptimal quantity Cat. No.
CD8 3B5 Pacific Blue™ Thermo Fisher Scientific 1.0 µg MHCD0828
LIVE/DEAD Fixable Aqua stain
NA NA Thermo Fisher Scientific 1 µL reconstituted dye per mL
L34965
TNFα MAB11 FITC Thermo Fisher Scientific 0.13 µg A18469
CD28 CD28.2 PE-Cy®5.5 BioLegend 0.75 µg 302910
IL2MQ1-17H12
PE Thermo Fisher Scientific 1.0 µg RHCIL204
CD4 S3.5 PE-Texas Red™ Thermo Fisher Scientific 0.13 µg MHCD0417
CD45RA H100 PE-Cy®7 Thermo Fisher Scientific 0.13 µg A16358
IFNγ B27 APC Thermo Fisher Scientific 1.0 µg MHCIFG05
CD197 (CCR7) 150503 Alexa Fluor™ 700 BD Biosciences 1.0 µg 561143
CD3 UCHT1 APC-Cy®7 Thermo Fisher Scientific 1.0 µg A15440
bind dead cells, elimination of dead cells helps ensure that false-positive cells will not be included in the data analysis. All data analyzed for this panel were gated off singlet and live cells.
The antigen-specific T cell panel (OMIP-009) was optimized using the Attune NxT Flow Cytometer with Autosampler with the optical configuration shown in Table 2.
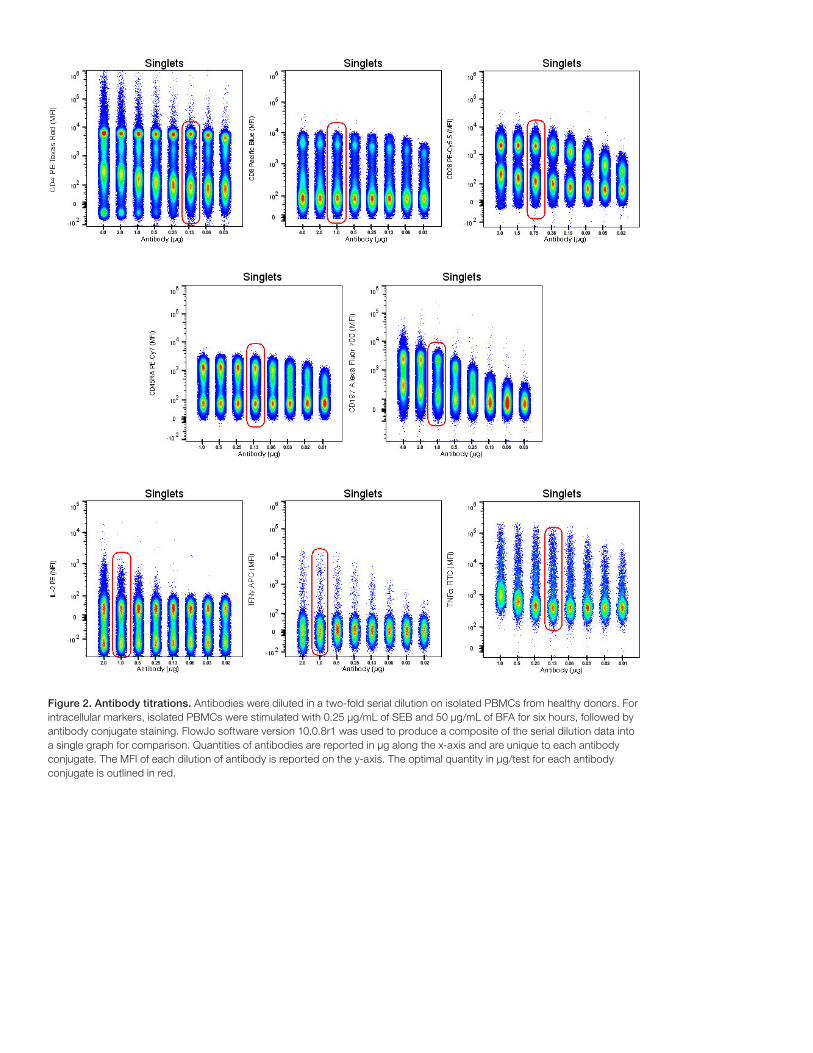
Figure 2. Antibody titrations. Antibodies were diluted in a two-fold serial dilution on isolated PBMCs from healthy donors. For intracellular markers, isolated PBMCs were stimulated with 0.25 µg/mL of SEB and 50 µg/mL of BFA for six hours, followed by antibody conjugate staining. FlowJo software version 10.0.8r1 was used to produce a composite of the serial dilution data into a single graph for comparison. Quantities of antibodies are reported in µg along the x-axis and are unique to each antibody conjugate. The MFI of each dilution of antibody is reported on the y-axis. The optimal quantity in µg/test for each antibody conjugate is outlined in red.
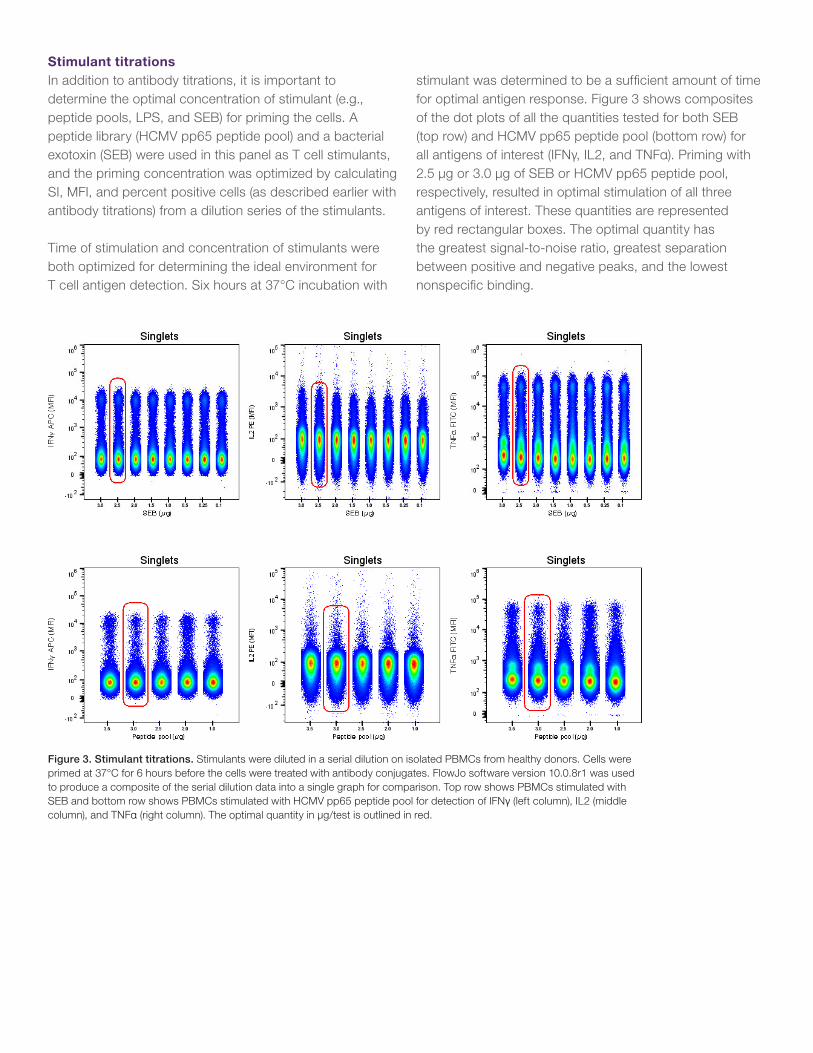
Stimulant titrationsIn addition to antibody titrations, it is important to determine the optimal concentration of stimulant (e.g., peptide pools, LPS, and SEB) for priming the cells. A peptide library (HCMV pp65 peptide pool) and a bacterial exotoxin (SEB) were used in this panel as T cell stimulants, and the priming concentration was optimized by calculating SI, MFI, and percent positive cells (as described earlier with antibody titrations) from a dilution series of the stimulants.
Time of stimulation and concentration of stimulants were both optimized for determining the ideal environment for T cell antigen detection. Six hours at 37°C incubation with
stimulant was determined to be a sufficient amount of time for optimal antigen response. Figure 3 shows composites of the dot plots of all the quantities tested for both SEB (top row) and HCMV pp65 peptide pool (bottom row) for all antigens of interest (IFNγ, IL2, and TNFα). Priming with 2.5 µg or 3.0 µg of SEB or HCMV pp65 peptide pool, respectively, resulted in optimal stimulation of all three antigens of interest. These quantities are represented by red rectangular boxes. The optimal quantity has the greatest signal-to-noise ratio, greatest separation between positive and negative peaks, and the lowest nonspecific binding.
Figure 3. Stimulant titrations. Stimulants were diluted in a serial dilution on isolated PBMCs from healthy donors. Cells were primed at 37°C for 6 hours before the cells were treated with antibody conjugates. FlowJo software version 10.0.8r1 was used to produce a composite of the serial dilution data into a single graph for comparison. Top row shows PBMCs stimulated with SEB and bottom row shows PBMCs stimulated with HCMV pp65 peptide pool for detection of IFNγ (left column), IL2 (middle column), and TNFα (right column). The optimal quantity in µg/test is outlined in red.

FMO controlsIt is crucial that fluorescence minus one (FMO) controls are used in a multicolor antibody panel [6]. In any multicolor flow cytometry experiment, it is essential that the positive and negative signals of labeled antigens are separated, including for cells with variable antigen expression. Often, B and T cells are easy to distinguish from other cell types, allowing the gating strategy to be straightforward. However, other cell types that express low amounts of antigen are often difficult to separate from the full cell population. FMO controls can be used to confidently define a boundary gate between positive and negative expression. An FMO control is a sample that contains all antibody conjugates that are being tested in a panel, minus one antibody conjugate. Fluorescence is evaluated in the detector without the fluorophore. The negative population may exhibit a spreading that represents the combined effect of all the other fluorophores in that detector, not the fluorophore being measured in that detector. The use of an FMO control allows a precise definition for the delineation of positive and negative populations based on the spread of the negative population.
An example for setting gating boundaries is shown in Figure 4. When setting gates, a starting point often uses the unstained control (left panel), which measures only the autofluorescence of the cells. The middle panel shows FMO labeling for the IFNγ target in the APC detector; the contribution of all the other fluorophores into the APC detector causes a spreading of the negative population that has a higher MFI compared to the autofluorescence of the unstained cells. To correctly identify the positive IFNγ population, a gate boundary is made based on the FMO control rather than the unstained cells. The fully stained sample (right panel) demonstrates the difference. In this instance, the expression level of IFNγ is being determined. If the positive gate was based off the unstained control (left panel), the positive cell population for IFNγ would include more cells than what is truly positive for IFNγ. The right panel shows the positive cell population when the gating strategy is based off the FMO control (middle panel).
Figure 4. FMO control gating strategy. Left panel is unstained cells, middle panel is FMO control for IFNγ, and right panel is full panel staining. FMO boundaries separate true positive signals from negative signals by accounting for the spread of the negative population as determined using the FMO control.
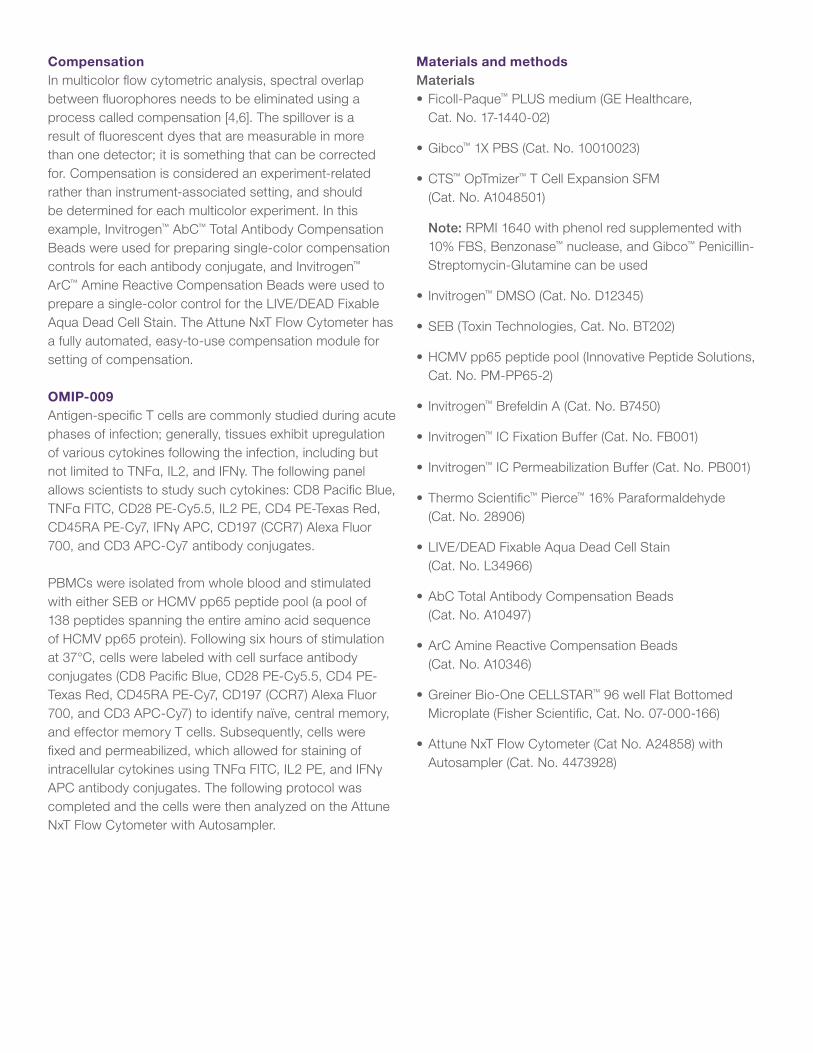
CompensationIn multicolor flow cytometric analysis, spectral overlap between fluorophores needs to be eliminated using a process called compensation [4,6]. The spillover is a result of fluorescent dyes that are measurable in more than one detector; it is something that can be corrected for. Compensation is considered an experiment-related rather than instrument-associated setting, and should be determined for each multicolor experiment. In this example, Invitrogen™ AbC™ Total Antibody Compensation Beads were used for preparing single-color compensation controls for each antibody conjugate, and Invitrogen™ ArC™ Amine Reactive Compensation Beads were used to prepare a single-color control for the LIVE/DEAD Fixable Aqua Dead Cell Stain. The Attune NxT Flow Cytometer has a fully automated, easy-to-use compensation module for setting of compensation.
OMIP-009Antigen-specific T cells are commonly studied during acute phases of infection; generally, tissues exhibit upregulation of various cytokines following the infection, including but not limited to TNFα, IL2, and IFNγ. The following panel allows scientists to study such cytokines: CD8 Pacific Blue, TNFα FITC, CD28 PE-Cy5.5, IL2 PE, CD4 PE-Texas Red, CD45RA PE-Cy7, IFNγ APC, CD197 (CCR7) Alexa Fluor 700, and CD3 APC-Cy7 antibody conjugates.
PBMCs were isolated from whole blood and stimulated with either SEB or HCMV pp65 peptide pool (a pool of 138 peptides spanning the entire amino acid sequence of HCMV pp65 protein). Following six hours of stimulation at 37°C, cells were labeled with cell surface antibody conjugates (CD8 Pacific Blue, CD28 PE-Cy5.5, CD4 PE-Texas Red, CD45RA PE-Cy7, CD197 (CCR7) Alexa Fluor 700, and CD3 APC-Cy7) to identify naïve, central memory, and effector memory T cells. Subsequently, cells were fixed and permeabilized, which allowed for staining of intracellular cytokines using TNFα FITC, IL2 PE, and IFNγ APC antibody conjugates. The following protocol was completed and the cells were then analyzed on the Attune NxT Flow Cytometer with Autosampler.
Materials and methodsMaterials• Ficoll-Paque™ PLUS medium (GE Healthcare,
Cat. No. 17-1440-02)
• Gibco™ 1X PBS (Cat. No. 10010023)
• CTS™ OpTmizer™ T Cell Expansion SFM (Cat. No. A1048501)
Note: RPMI 1640 with phenol red supplemented with 10% FBS, Benzonase™ nuclease, and Gibco™ Penicillin- Streptomycin-Glutamine can be used
• Invitrogen™ DMSO (Cat. No. D12345)
• SEB (Toxin Technologies, Cat. No. BT202)
• HCMV pp65 peptide pool (Innovative Peptide Solutions, Cat. No. PM-PP65-2)
• Invitrogen™ Brefeldin A (Cat. No. B7450)
• Invitrogen™ IC Fixation Buffer (Cat. No. FB001)
• Invitrogen™ IC Permeabilization Buffer (Cat. No. PB001)
• Thermo Scientific™ Pierce™ 16% Paraformaldehyde (Cat. No. 28906)
• LIVE/DEAD Fixable Aqua Dead Cell Stain (Cat. No. L34966)
• AbC Total Antibody Compensation Beads (Cat. No. A10497)
• ArC Amine Reactive Compensation Beads (Cat. No. A10346)
• Greiner Bio-One CELLSTAR™ 96 well Flat Bottomed Microplate (Fisher Scientific, Cat. No. 07-000-166)
• Attune NxT Flow Cytometer (Cat No. A24858) with Autosampler (Cat. No. 4473928)

Day 1: Preparation of PBMCs 1. Isolate PBMCs using Ficoll-Paque PLUS medium per
manufacturer’s instructions [7].
2. Add an appropriate amount of medium and count PBMCs to ensure an adequate number are available for the experiment.
3. Resuspend cells at a concentration of 1–2 x 10⁶ PBMC/mL in media.
4. Add 100 µL of cells in culture media to each well.
5. Culture cells in plate overnight in a 37°C incubator at 5% CO2.
Day 2: PBMC stimulation1. Optional: Refresh media prior to stimulation if needed
due to possible overnight evaporation. Wash the PBMC samples in culture medium by centrifuging the plate at 700–800 x g for 3 min at room temperature (18–26°C).Resuspend cells in 100 μL medium per well.
2. Prepare peptide stimulation mixes as listed in the table below. Volumes are calculated for a total of 12 samples with extra volume.
ComponentVolume (μL)
Final conc. per well
Stimulate with one of:
Peptide pool* (500 μg/mL)
10.4 2.0 μg/mL
SEB* (70 μg/mL)
9.3 0.25 μg/mL
Brefeldin A (40 mM or 11.2 mg/mL)
5.8 50 μg/mL
CTS OpTmizer medium
1,283.8 or 1,285
Total volume* 1,300.0
* For unstimulated controls use DMSO or PBS in place of peptide pool or SEB, respectively.
Day 3: Ten-color labeling procedureNote: Prepare the surface antibody cocktail and the intracelluar labeling cocktail on the day of staining. Spin individual antibody conjugates in a microfuge and use only the supernatant when making the cocktail mixtures. In this example, labeling was performed in a 96-well plate.
Preparation of solutions:
• Optional for step 25 (only if you do not plan on running samples the same day after staining): Prepare 1% paraformaldehyde (PFA) by diluting the 16% PFA stock with 1X PBS. Store at 4°C for no longer than 6 months.
• Prepare the predetermined amount of 1X IC Permeabilization Buffer needed by diluting the 5X IC Permeabilization Buffer 1:5 with deionized water. This preparation is good for one week at 4°C.
• Prepare the LIVE/DEAD Fixable Aqua Dead Cell Stain mix. A total volume of 100 µL/sample is needed.
– Add 50 μL of DMSO to the vial of reactive dye; mix by vortexing.
– Add 1 μL reconstituted dye per 1 mL of 1X PBS.
– Store at 4°C in the dark until ready to use.
• Prepare the antibody staining cocktail mixtures in a total volume of 50 μL/sample for the surface mix and 100 μL/sample for the intracellular mix. Store at 4°C in the dark until ready to use:
– Prepare surface antibodies with wash buffer (1% FBS, 0.02% NaN3 in PBS).
– Prepare intracellular antibodies with 1X IC Permeabilization Buffer.
Staining protocol:
1. Centrifuge the plate containing the cells from day 2, step 5 at 700–800 x g for 3 min at room temperature (18–26°C).
2. Flick supernatant into a biohazardous waste container and immediately blot the plate on a paper towel before returning to an upright position.
3. Add 200 μL of 1X PBS to each of the wells, mixing thoroughly with a multichannel pipette.
3. Pipette 100 μL of peptide pool or SEB and negative control into their respective wells on top of the 100 μL of media containing cells already in each well.
4. Thoroughly mix each by pipetting up and down a few times.
5. Incubate the plate for 6 hours in a humidified 5% CO2 incubator at 37°C.

4. Centrifuge, flick, and blot the plate.
5. Add 100 μL of the LIVE/DEAD Fixable Aqua Dead Cell Stain to each of the wells, mixing thoroughly with a multichannel pipette.
6. Incubate 20 min at room temperature, protected from light.
7. Add 50 μL of surface antibody cocktail (CD8 Pacific Blue, CD28 PE-Cy5.5, CD4 PE-Texas Red, CD45RA PE-Cy7, CD197 (CCR7) Alexa Fluor 700, and CD3 APC-Cy7 conjugates) to each of the wells, mixing thoroughly after addition.
8. Incubate for an additional 20 min at room temperature, protected from light.
9. Add 120 μL of wash buffer to each well (1% FBS, 0.02% NaN3 in PBS) and mix well, then centrifuge, flick, and blot.
10. Add 200 μL of wash buffer to each well and mix well, then centrifuge, flick, and blot.
11. Add 100 μL of IC Fixation Buffer to each well, mixing thoroughly with a multichannel pipette.
12. Incubate the plate for 20 min at 4°C, protected from light.
13. Add 120 μL of 1X IC Permeabilization Buffer to each well.
14. Centrifuge, flick, and blot the plate.
15. Add 200 μL of 1X IC Permeabilization Buffer to the wells, mixing thoroughly to resuspend the pellet.
16. Centrifuge, flick, and blot the plate.
17. Add 100 μL of the intracellular staining cocktail (TNFα FITC, IL2 PE, and IFNγ APC antibody conjugates) to each of the wells and mix throughly with a multichannel pipette.
18. Incubate for 20 min at room temperature in the dark.
19. Add 120 μL of 1X IC Permeabilization Buffer to each of the wells.
20. Centrifuge, flick, and blot the plate.
21. Add 200 μL of 1X IC Permeabilization Buffer to the plate wells, mix well.
22. Repeat centrifugation, flicking, and blotting.
23. Add 200 μL of 1X IC Permeabilization Buffer to the plate wells, mix well.
24. Repeat centrifugation, flicking, and blotting.
25. Optional: Resuspend cells in 250 μL of 1% paraformaldehyde to fix the cells; mix the pellet immediately upon reagent addition to the wells.
– Optional: Store the plate at 1–9°C for no longer than 48 hours, protected from light, until samples are acquired on a flow cytometer.
26. Prepare single-color compensation controls with the AbC Total Antibody Compensation and ArC Amine Reactive Compensation Beads.
27. Acquire samples on the Attune NxT Flow Cytometer and Autosampler. Total events collected was 500,000 cells per sample, flow rate was 200 µL/min, and acquisition volume was 170 µL with a total sample volume of 200 µL per well using two rinses and one mix per well. Using the Invitrogen™ Attune™ Autosampler for automated acquisition allows for confident walk-away, no-clogging sample loading and acquisition.

Data analysisData was analyzed using Invitrogen™ Attune™ NxT Software version 2.5. Singlet gating was used to isolate naïve, central memory, and effector memory T cells [8]. The amount of cytokines produced from the stimulation was analyzed and compared to the unstimulated cells that were either CD4+ or CD8+ cells. FMO controls were used to identify gating boundaries.
The antigen-specific T cell panel was run at vendor-recommended antibody concentrations (Figure 5) and then using optimal antibody concentrations determined after diligent titration (Figure 6) to examine any changes that are obtained when using optimized antibody titer. Determination of cells with positively stained cytokines was difficult using vendor recommended concentrations as seen in Figure 5F compared to Figure 6G. Four distinct populations can be segregated into identifying viable memory and effector T cell subpopulations when using the optimal antibody concentrations (Figure 7G).
Figure 5. Vendor-recommended antibody concentrations. Isolated PBMCs from healthy donors were stimulated with SEB. (A) Lymphocytes were identified through a scatter plot of SSC-H vs. FSC-H. (B) Viable CD3+ cells were selected. (C) A selection of CD3+ T cells were further isolated through a FSC-H vs. SSC-H scatter plot of CD3+ cells to remove excess cells. (D) The designated CD3+ T cells were further allocated into CD4+ and CD8+ T cells. (E) Each cytokine (IFNγ, IL2, or TNFα) was defined by either CD4+ or CD8+ T cells. (F) All of the cytokine-producing cells (IFNγ+, IL2+, and TNFα+ cells) were isolated into one existing gate to represent the maturation and activation response. The total cytokine response (red) was then overlaid onto its respective CD4+ or CD8+ T cell linage of CD28, CD45RA, and CD197 cells.
A B DC
E F

Figure 6. Optimal antibody concentrations. Isolated PBMCs from healthy donors were stimulated with SEB. (A) Whole cells were identified as events through a scatter plot of SSC-H vs. FSC-H. (B) Singlets were identified through a scatter plot of FSC-A vs. FSC-H. (C) Viable CD3+ cells were selected. (D) A selection of CD3+ T cells were further isolated through a FSC-H vs. SSC-H scatter plot of CD3+ cells to remove excess cells. (E) The designated CD3+ T cells were further allocated into CD4+ and CD8+ T cells. (F) Each cytokine (IFNγ, IL2, or TNFα) was defined by either CD4+ or CD8+ T cells. (G) All of the cytokine-producing cells (IFNγ+, IL2+, and TNFα+ cells) were isolated into one existing gate to represent the maturation and activation response. The total cytokine response (red) was then overlaid onto its respective CD4+ or CD8+ T cell linage of CD28, CD45RA, and CD197 cells.
A B DC E
F G
Cells can be stimulated with material (in this case SEB) that causes the cellular response necessary to detect the antigens of interest. This inflammatory profile can be seen in Figure 6, using the optimal titration of each antibody conjugate. The HCMV pp65 peptide pool is an alternative stimulation protocol that can be used to identify the intracellular cytokines TNFα, IL2, and IFNγ. Figure 7 represents what is expected when stimulated with this peptide pool (using optimal antibody concentrations).
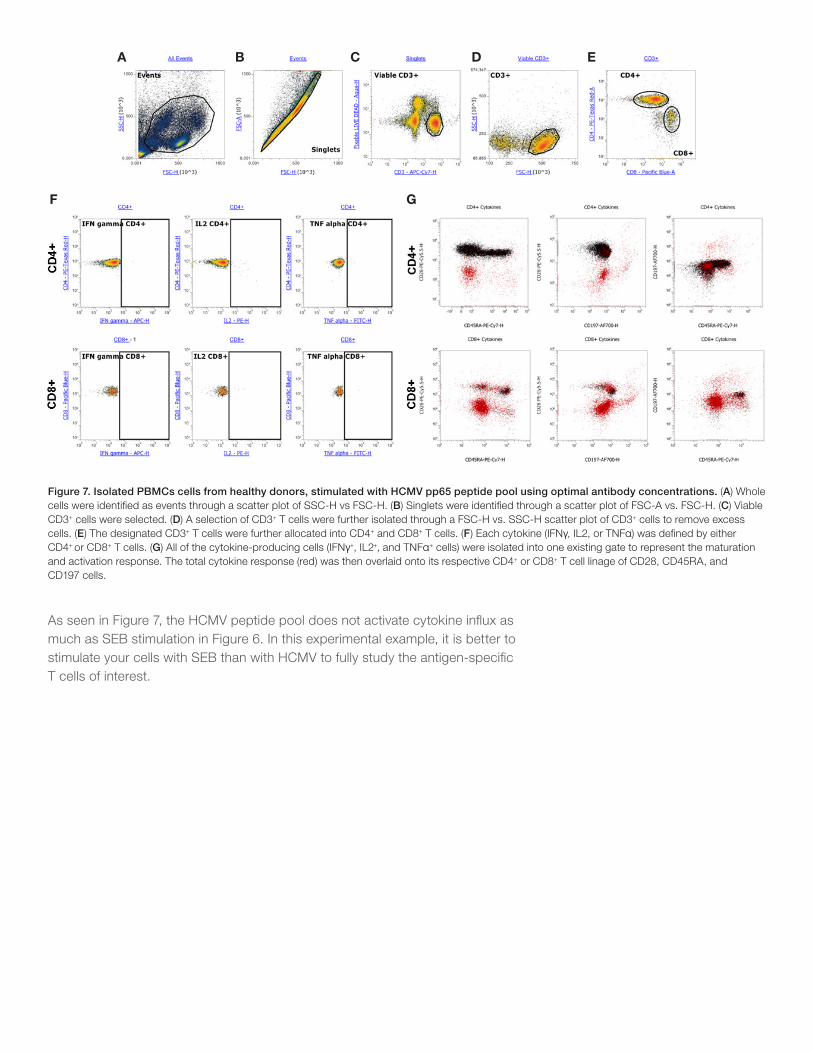
Figure 7. Isolated PBMCs cells from healthy donors, stimulated with HCMV pp65 peptide pool using optimal antibody concentrations. (A) Whole cells were identified as events through a scatter plot of SSC-H vs FSC-H. (B) Singlets were identified through a scatter plot of FSC-A vs. FSC-H. (C) Viable CD3+ cells were selected. (D) A selection of CD3+ T cells were further isolated through a FSC-H vs. SSC-H scatter plot of CD3+ cells to remove excess cells. (E) The designated CD3+ T cells were further allocated into CD4+ and CD8+ T cells. (F) Each cytokine (IFNγ, IL2, or TNFα) was defined by either CD4+ or CD8+ T cells. (G) All of the cytokine-producing cells (IFNγ+, IL2+, and TNFα+ cells) were isolated into one existing gate to represent the maturation and activation response. The total cytokine response (red) was then overlaid onto its respective CD4+ or CD8+ T cell linage of CD28, CD45RA, and CD197 cells.
As seen in Figure 7, the HCMV peptide pool does not activate cytokine influx as much as SEB stimulation in Figure 6. In this experimental example, it is better to stimulate your cells with SEB than with HCMV to fully study the antigen-specific T cells of interest.
A B DC E
F G
Find out more at thermofisher.com/flowcytometry
For Research Use Only. Not for use in diagnostic procedures. © 2017 Thermo Fisher Scientific Inc. All rights reserved. All trademarks are the property of Thermo Fisher Scientific and its subsidiaries unless otherwise specified. GraphPad Prism is a trademark of GraphPad Software, Inc. Cy is a registered trademark of GE Healthcare. Ficoll-Paque is a trademark of GE Healthcare. FlowJo is a trademark of TreeStar Inc. COL31525 0417
ConclusionsWhen optimizing a panel of antibodies for detecting a specific set of cells, such as with the OMIP-009 panel that detects specific T cell antigens, there are a few factors to consider. Most important, titration of antibodies and stimulants must be performed in order to determine optimal concentrations and obtain accurate results. Secondly, when performing flow cytometry experiments, FMO controls are essential in setting gating strategies for all antibodies individually. Finally, including a dead or live cell stain within your panel is essential to eliminate false positive cells. To exemplify each of these steps in setting up a flow cytometry experiment, the OMIP-009 panel was used throughout this application note.
The OMIP-009 panel is an antibody panel that is used to study the expression levels of TNFα, IL2, and IFNγ within T cells. There are two stimulants that can be used to increase the expression levels of TNFα, IL2, and IFNγ within T cells. The most commonly used stimulant is the HCMV pp65 peptide pool, but SEB is also used in some cases. For this instance, SEB had a considerably larger increase in antigen expression levels as compared to the HCMV pp65 peptide pool, which helps lead to a better understanding of T cell response. It is common practice to test more than one stimulant and determine what best suits the needs of the experiment and question at hand.
The results with the OMIP-009 panel in this application note were analyzed using Attune NxT Software version 2.5. Attune NxT Software has a beneficial plot overlay feature, easily creating the ability to perform comparative analysis of single-parameter and dual-parameter data between samples (Overlay Module) (Figures 5, 6, and 7). Other benefits of the version 2.5 software are Manual Well Mode (ability to specify order of acquisition when recording a plate), Wait to Record (option to delay the recording of data acquisition from plates based on time, event, or volume), and Modification of Compensation (capability to add or
remove parameters as needed after compensation is set up). FlowJo Software version 10.0.8r1 was used to obtain a composite of the serial dilution data in a single graph for different antibody concentration comparisons (Figures 2, 3, and 4), and demonstrates the full compatibility of Attune NxT Software data to be exported into third-party software for additional analysis.
Thermo Fisher Scientific offers an extensive portfolio of highly specific primary antibodies used in flow cytometry for a wide range of targets, with an assortment of different labels and support products. All antibodies referenced are used for oncology and immunology research using flow cytometry. These antibodies are useful in multicolor panels such as the one presented in this application note.
We are committed to accelerating science by providing a comprehensive suite of solutions for the analysis of cells and their function. Behind this commitment is an incredible team of scientists developing and supporting our innovative instrumentation and products such as the Attune NxT Flow Cytometer with Autosampler and Invitrogen™ eBioscience™ flow cytometry antibodies and reagents.
References1. Roederer M, Tárnok A (2010) OMIPs—Orchestrating multiplexity in polychromatic
science. Cytometry Part A 77:811–812.
2. Mahnke Y, Chattopadhyay P, Roederer M (2010) Publication of optimized multicolor immunofluorescence panels. Cytometry Part A 77:814–81.
3. Lamoreaux L, Koup R, Roederer M (2012) OMIP-009: Characterization of antigen-specific human T cells. Cytometry Part A 81:362–363.
4. Baumgarth N, Roederer M (2000) A practical approach to multicolor flow cytometry for immunophenotyping. J Immunol Methods 243:77–97.
5. Maecker HT, Frey T, Nomura LE, et al. (2004) Selecting fluorochrome conjugates for maximum sensitivity. Cytometry Part A 62:169–173.
6. Maecker HT, Trotter J (2006) Flow cytometry controls, instrument setup, and the determination of positivity. Cytometry Part A 69:1037–1042.
7. Isolation of mononuclear cells: methodology and applications. Handbook available at gelifesciences.com
8. McLaughlin BE, Baumgarth N, Bigos M, et al. (2008) Nine-color flow cytometry for accurate measurement of T cell subsets and cytokine responses. Part II: panel performance across different instrument platforms. Cytometry Part A 73:411–420.