application for grants under the - us · pdf fileapplication for grants under the charter...
TRANSCRIPT

U.S. Department of Education
Washington, D.C. 20202-5335
APPLICATION FOR GRANTS UNDER THE
CHARTER SCHOOLS PROGRAM - REPLICATION AND EXPANSION OF HIGH-QUALITY CHARTER SCHOOLS (84.282M)
CFDA # 84.282M PR/Award # U282M100002
OMB No. 1894-0006, Expiration Date: Closing Date: JUL 07, 2010
PR/Award # U282M100002
**Table of Contents**
Forms
1. Application for Federal Assistance (SF-424) e1
Achievement First CSP Grant Application Congressional Districts e5
2. Standard Budget Sheet (ED 524) e6
3. SF-424B - Assurances Non-Construction Programs e8
4. Disclosure of Lobbying Activities e10
5. ED 80-0013 Certification e11
6. 427 GEPA e12
CSP RE Grant Application GEPA Assurance e14
7. Dept of Education Supplemental Information for SF-424 e17
Narratives
1. Project Narrative - (Abstract...) e18
Achievement First CSP Grant Application Abstract e19
2. Project Narrative - (Priorities...) e20
Achievement First CSP Grant Application Priorities e21
3. Project Narrative - (Project Narrative...) e27
Achievement First CSP Grant Application Project Narrative e28
4. Project Narrative - (Section 1 - Other Attachments: Resumes/Curricu......) e88
Achievement First CSP Grant Application Resumes e89
5. Project Narrative - (Section 2 - Other Attachments: Letters of Support...) e110
Achievement First CSP Grant Application Letters of Support e111
6. Project Narrative - (Section 3 - Other Attachments: Proof of Non-Pr......) e121
Achievement First CSP Grant Application 501c3 Determination Letter e122
7. Project Narrative - (Section 4 - Other Attachments: Schools Operate......) e126
Achievement First CSP Grant Application School Operated by Applicant e127
8. Project Narrative - (Section 5 - Other Attachments: Student Academi......) e129
Achievement First CSP Grant Application Student Academic Achievement e130
9. Project Narrative - (Section 6 - Other Attachments: Supplemental Or......) e149
Achievement First CSP Grant Application Budgets e150
10. Project Narrative - (Section 7 - Other Attachments: Additional Info......) e163
Achievement First CSP Grant Application Board of Directors e164
11. Budget Narrative - (Budget Narrative...) e166
PR/Award # U282M100002

Achievement First CSP Grant Application Budget Narrative e167
This application was generated using the PDF functionality. The PDF functionality automatically numbers the pages in this application. Some pages/sections of this application may contain 2 sets of page numbers, one set created by the applicant and the other set created by e-Application's PDF functionality. Page numbers created by the e-Application PDF functionality will be preceded by the letter e (for example, e1, e2, e3, etc.).
PR/Award # U282M100002

OMB No.4040-0004 Exp.01/31/2012
Application for Federal Assistance SF-424 Version 02
* 1. Type of Submission
Preapplication
Application
Changed/Corrected Application
* 2. Type of Application:* If Revision, select appropriate letter(s):
New
Continuation * Other (Specify)
Revision
* 3. Date Received: 4. Applicant Identifier:
7/1/2010
5a. Federal Entity Identifier: * 5b. Federal Award Identifier:
N/A
State Use Only:
6. Date Received by State: 7. State Application Identifier:
8. APPLICANT INFORMATION:
* a. Legal Name: Achievement First, Inc.
* b. Employer/Taxpayer Identification Number (EIN/TIN): * c. Organizational DUNS:
651203744 159846042
d. Address:
* Street1: 403 James Street
Street2:
* City: New Haven
County: New Haven County
State: CT
Province:
* Country: USA
* Zip / Postal Code: 06513
e. Organizational Unit:
Department Name: Division Name:
f. Name and contact information of person to be contacted on matters involving this application:
Prefix: * First Name: Erica
Middle Name: B
PR/Award # U282M100002 e1

* Last Name: Schwedel
Suffix:
Title: Senior Development Associate
Organizational Affiliation:
Employee
* Telephone Number:
(203)773-3223 Fax Number: (203)773-3221
* Email: [email protected]
Application for Federal Assistance SF-424 Version 02
9. Type of Applicant 1: Select Applicant Type:
M: Nonprofit with 501C3 IRS Status (Other than Institution of Higher Education)
Type of Applicant 2: Select Applicant Type:
Type of Applicant 3: Select Applicant Type:
* Other (specify):
10. Name of Federal Agency:
U.S. Department of Education
11. Catalog of Federal Domestic Assistance Number:
84.282M
CFDA Title:
Charter Schools Program - Replication and Expansion of High-Quality Charter Schools (84.282M)
* 12. Funding Opportunity Number:
ED-Grants-052410-001
Title:
N/A
13. Competition Identification Number:
Title:
14. Areas Affected by Project (Cities, Counties, States, etc.):
The applicant operates a growing network of public charter schools in
PR/Award # U282M100002 e2

Bridgeport, Hartford and New Haven, Connecticut, and Brooklyn, New York, with plans to expand to Providence/Cranston, Rhode Island.
* 15. Descriptive Title of Applicant's Project:
Achievement First: Replicating and Expanding High-Achieving Charter Schools in Connecticut, New York and Rhode Island
Attach supporting documents as specified in agency instructions.
Attachment: Title : File :
Attachment: Title : File :
Attachment: Title : File :
Application for Federal Assistance SF-424 Version 02
16. Congressional Districts Of:* a. Applicant: CT-003; NY-010 * b. Program/Project: CT-001; CT-003; etc.
Attach an additional list of Program/Project Congressional Districts if needed.Attachment: Title : Achievement First CSP Grant Application Congressional Districts File : CSP RE Grant Application SF 424 Congressional Districts 106030.pdf
17. Proposed Project:* a. Start Date: 7/1/2010 * b. End Date: 6/30/2015
18. Estimated Funding ($):
a. Federal $
b. Applicant $
c. State $
d. Local $
e. Other $
f. Program Income
$
g. TOTAL $ 0
* 19. Is Application Subject to Review By State Under Executive Order 12372 Process?
a. This application was made available to the State under the Executive Order 12372 Process for review on .
b. Program is subject to E.O. 12372 but has not been selected by the State for review.
PR/Award # U282M100002 e3

c. Program is not covered by E.O. 12372.
* 20. Is the Applicant Delinquent On Any Federal Debt? (If "Yes", provide explanation.)
Yes No
21. *By signing this application, I certify (1) to the statements contained in the list of certifications** and (2) that the statements herein are true, complete and accurate to the best of my knowledge. I also provide the required assurances** and agree to comply with any resulting terms if I accept an award. I am aware that any false, fictitious, or fraudulent statements or claims may subject me to criminal, civil, or administrative penalties. (U.S. Code, Title 218, Section 1001)
** I AGREE
** The list of certifications and assurances, or an internet site where you may obtain this list, is contained in the announcement or agency specific instructions.
Authorized Representative:
Prefix: Ms. * First Name: Dacia
Middle Name: M
* Last Name: Toll
Suffix:
Title: Co-Chief Executive Officer and President
* Telephone Number: (203)773-3223 Fax Number: (203)773-3221
* Email: [email protected]
* Signature of Authorized Representative:
* Date Signed:
Application for Federal Assistance SF-424 Version 02
* Applicant Federal Debt Delinquency Explanation
The following field should contain an explanation if the Applicant organization is delinquent on any Federal Debt. Maximum number of characters that can be entered is 4,000. Try and avoid extra spaces and carriage returns to maximize the availability of space.
Not applicable.
PR/Award # U282M100002 e4

Achievement First: Replicating and Expanding High-Achieving Charter Schools in Connecticut,
New York and Rhode Island
Standard Form 424: #16 Congressional Districts
Applicant
• Connecticut Office: CT-003
• New York Office: NY-010
Program
• Connecticut Schools: CT-001; CT-003; CT-004
• New York Schools: NY-011; NY-012
• Rhode Island Schools: RI-002*
*AF’s expansion to Rhode Island is in the planning stages and an official location has not yet
been identified. Current plans project opening AF schools in the Providence/Cranston region.
The majority of this region is in congressional district RI-002.
Achievement First SF 424: #16 Congressional Districts Page 1PR/Award # U282M100002 e0

ED Form No. 524
U.S. DEPARTMENT OF EDUCATION
BUDGET INFORMATION
NON-CONSTRUCTION PROGRAMS
OMB Control Number: 1894-0008
Expiration Date: 02/28/2011
Name of Institution/Organization: Achievement First, Inc.
Applicants requesting funding for only one year should complete the column under "Project Year 1." Applicants requesting funding for multi-year grants should complete all applicable columns. Please read all instructions before completing form.
SECTION A - BUDGET SUMMARY
U.S. DEPARTMENT OF EDUCATION FUNDS
Budget Categories Project Year 1(a) Project Year 2 (b)
Project Year 3 (c)
Project Year 4 (d)
Project Year 5 (e)
Total (f)
1. Personnel $ 13,598 $ 95,239 $ 115,407 $ 118,869 $ 61,217 $ 404,330
2. Fringe Benefits $ 2,040 $ 14,286 $ 17,311 $ 17,830 $ 9,183 $ 60,650
3. Travel $ 21,756 $ 50,750 $ 56,685 $ 54,190 $ 58,697 $ 242,078
4. Equipment $ 113,825 $ 292,149 $ 302,531 $ 350,708 $ 385,891 $ 1,445,104
5. Supplies $ 207,712 $ 777,040 $ 1,108,560 $ 970,407 $ 1,143,967 $ 4,207,686
6. Contractual $ 26,108 $ 60,900 $ 68,022 $ 65,028 $ 70,436 $ 290,494
7. Construction $ 0 $ 0 $ 0 $ 0 $ 0 $ 0
8. Other $ 0 $ 0 $ 0 $ 0 $ 0 $ 0
9. Total Direct Costs (lines 1-8)
$ 385,039 $ 1,290,364 $ 1,668,516 $ 1,577,032 $ 1,729,391 $ 6,650,342
10. Indirect Costs* $ 0 $ 0 $ 0 $ 0 $ 0 $ 0
11. Training Stipends $ 0 $ 0 $ 0 $ 0 $ 0 $ 0
12. Total Costs (lines 9-11)
$ 385,039 $ 1,290,364 $ 1,668,516 $ 1,577,032 $ 1,729,391 $ 6,650,342
*Indirect Cost Information (To Be Completed by Your Business Office): If you are requesting reimbursement for indirect costs on line 10, please answer the following questions:
(1) Do you have an Indirect Cost Rate Agreement approved by the Federal government? Yes No (2) If yes, please provide the following information: Period Covered by the Indirect Cost Rate Agreement: From: __/__/____ To: __/__/____ (mm/dd/yyyy)
Approving Federal agency: ED Other (please specify): ______________ The Indirect Cost Rate is _______% (3) For Restricted Rate Programs (check one) -- Are you using a restricted indirect cost rate that:
Is included in your approved Indirect Cost Rate Agreement? or, Complies with 34 CFR 76.564(c)(2)? The Restricted Indirect Cost Rate is _______%
PR/Award # U282M100002 e6

U.S. DEPARTMENT OF EDUCATION
BUDGET INFORMATION
NON-CONSTRUCTION PROGRAMS
OMB Control Number: 1894-0008
Expiration Date: 02/28/2011
Name of Institution/Organization: Achievement First, Inc.
Applicants requesting funding for only one year should complete the column under "Project Year 1." Applicants requesting funding for multi-year grants should complete all applicable columns. Please read all instructions before completing form.
SECTION B - BUDGET SUMMARY
NON-FEDERAL FUNDS
Budget Categories Project Year 1(a) Project Year 2 (b)
Project Year 3 (c)
Project Year 4 (d)
Project Year 5 (e)
Total (f)
1. Personnel $ 3,399 $ 23,810 $ 28,852 $ 29,717 $ 15,304 $ 101,082
2. Fringe Benefits $ 510 $ 3,571 $ 4,328 $ 4,458 $ 2,296 $ 15,163
3. Travel $ 5,439 $ 12,687 $ 14,171 $ 13,548 $ 14,674 $ 60,519
4. Equipment $ 28,456 $ 73,037 $ 75,633 $ 87,677 $ 96,473 $ 361,276
5. Supplies $ 51,928 $ 194,260 $ 277,140 $ 242,602 $ 285,992 $ 1,051,922
6. Contractual $ 6,527 $ 15,225 $ 17,006 $ 16,257 $ 17,609 $ 72,624
7. Construction $ 0 $ 0 $ 0 $ 0 $ 0 $ 0
8. Other $ 0 $ 0 $ 0 $ 0 $ 0 $ 0
9. Total Direct Costs (lines 1-8)
$ 96,259 $ 322,590 $ 417,130 $ 394,259 $ 432,348 $ 1,662,586
10. Indirect Costs $ 0 $ 0 $ 0 $ 0 $ 0 $ 0
11. Training Stipends $ 0 $ 0 $ 0 $ 0 $ 0 $ 0
12. Total Costs (lines 9-11)
$ 96,259 $ 322,590 $ 417,130 $ 394,259 $ 432,348 $ 1,662,586
PR/Award # U282M100002 e7

ASSURANCES - NON-CONSTRUCTION PROGRAMS
Standard Form 424B (Rev.7-97) Public reporting burden for this collection of information is estimated to average 15 minutes per response, including time for reviewing instructions, searching existing data sources, gathering and maintaining the data needed, and completing and reviewing the collection of information. Send comments regarding the burden estimate or any other aspect of this collection of information, including suggestions for reducing this burden to the Office of Management and Budget, Paperwork Reduction Project (0348-0040), Washington DC 20503.
PLEASE DO NOT RETURN YOUR COMPLETED FORM TO THE OFFICE OF MANAGEMENT AND BUDGET. SEND IT TO THE
ADDRESS PROVIDED BY THE SPONSORING AGENCY.
NOTE: Certain of these assurances may not be applicable to your project or program. If you have questions, please contact the awarding agency. Further, certain Federal awarding agencies may require applicants to certify to additional assurances. If such is the case, you will be notified.
As the duly authorized representative of the applicant, I certify that the applicant:
1. Has the legal authority to apply for Federal assistance, and the institutional, managerial and financial capability (including funds sufficient to pay the non-Federal share of project cost) to ensure proper planning, management, and completion of the project described in this application.
2. Will give the awarding agency, the Comptroller General of the United States, and if appropriate, the State, through any authorized representative, access to and the right to examine all records, books, papers, or documents related to the award; and will establish a proper accounting system in accordance with generally accepted accounting standards or agency directives.
3. Will establish safeguards to prohibit employees from using their positions for a purpose that constitutes or presents the appearance of personal or organizational conflict of interest, or personal gain.
4. Will initiate and complete the work within the applicable time frame after receipt of approval of the awarding agency.
5. Will comply with the Intergovernmental Personnel Act of 1970 (42 U.S.C. ''4728-4763) relating to prescribed standards for merit systems for programs funded under one of the 19 statutes or regulations specified in Appendix A of OPM's Standards for a Merit System of Personnel Administration (5 C.F.R. 900, Subpart F).
6. Will comply with all Federal statutes relating to nondiscrimination. These include but are not limited to: (a) Title VI of the Civil Rights Act of 1964 (P.L. 88-352) which prohibits discrimination on the basis of race, color or national origin; (b) Title IX of the Education Amendments of 1972, as amended (20 U.S.C. ''1681-1683, and 1685-1686), which prohibits discrimination on the basis of sex; (c) Section 504 of the Rehabilitation Act of 1973, as amended (29 U.S.C. '794), which prohibits discrimination on the basis of handicaps; (d) the Age Discrimination Act
9. Will comply, as applicable, with the provisions of the Davis-Bacon Act (40 U.S.C. ''276a to 276a-7), the Copeland Act (40 U.S.C. '276c and 18 U.S.C. ''874) and the Contract Work Hours and Safety Standards Act (40 U.S.C. '' 327-333), regarding labor standards for federally assisted construction sub-agreements.
10. Will comply, if applicable, with flood insurance purchase requirements of Section 102(a) of the Flood Disaster Protection Act of 1973 (P.L. 93-234) which requires recipients in a special flood hazard area to participate in the program and to purchase flood insurance if the total cost of insurable construction and acquisition is $10,000 or more.
11. Will comply with environmental standards which may be prescribed pursuant to the following: (a) institution of environmental quality control measures under the National Environmental Policy Act of 1969 (P.L. 91-190) and Executive Order (EO) 11514; (b) notification of violating facilities pursuant to EO 11738; (c) protection of wetlands pursuant to EO 11990; (d) evaluation of flood hazards in floodplains in accordance with EO 11988; (e) assurance of project consistency with the approved State management program developed under the Coastal Zone Management Act of 1972 (16 U.S.C. ''1451 et seq.); (f) conformity of Federal actions to State (Clear Air) Implementation Plans under Section 176(c) of the Clear Air Act of 1955, as amended (42 U.S.C. ''7401 et seq.); (g) protection of underground sources of drinking water under the Safe Drinking Water Act of 1974, as amended, (P.L. 93-523); and (h) protection of endangered species under the Endangered Species Act of 1973, as amended, (P.L. 93-205).
12. Will comply with the Wild and Scenic Rivers Act of 1968 (16 U.S.C. ''1721 et seq.) related to protecting components or potential components of the national wild and scenic rivers system.
13. Will assist the awarding agency in assuring compliance
PR/Award # U282M100002 e8

of 1975, as amended (42 U.S.C. '' 6101-6107), which prohibits discrimination on the basis of age; (e) the Drug Abuse Office and Treatment Act of 1972 (P.L. 92-255), as amended, relating to nondiscrimination on the basis of drug abuse; (f) the Comprehensive Alcohol Abuse and Alcoholism Prevention, Treatment and Rehabilitation Act of 1970 (P.L. 91-616), as amended, relating to nondiscrimination on the basis of alcohol abuse or alcoholism; (g) '' 523 and 527 of the Public Health Service Act of 1912 (42 U.S.C. '' 290 dd-3 and 290 ee 3), as amended, relating to confidentiality of alcohol and drug abuse patient records; (h) Title VIII of the Civil Rights Act of 1968 (42 U.S.C. ' 3601 et seq.), as amended, relating to nondiscrimination in the sale, rental or financing of housing; (i) any other nondiscrimination provisions in the specific statute(s) under which application for Federal assistance is being made; and (j) the requirements of any other nondiscrimination statute(s) which may apply to the application.
7. Will comply, or has already complied, with the requirements of Titles II and III of the uniform Relocation Assistance and Real Property Acquisition Policies Act of 1970 (P.L. 91-646) which provide for fair and equitable treatment of persons displaced or whose property is acquired as a result of Federal or federally assisted programs. These requirements apply to all interests in real property acquired for project purposes regardless of Federal participation in purchases.
8. Will comply, as applicable, with the provisions of the Hatch Act (5 U.S.C. ''1501-1508 and 7324-7328) which limit the political activities of employees whose principal employment activities are funded in whole or in part with
Federal funds.
with Section 106 of the National Historic Preservation Act of 1966, as amended (16 U.S.C. '470), EO 11593 (identification and protection of historic properties), and the Archaeological and Historic Preservation Act of 1974 (16 U.S.C. ''469a-1 et seq.).
14. Will comply with P.L. 93-348 regarding the protection of human subjects involved in research, development, and related activities supported by this award of assistance.
15. Will comply with the Laboratory Animal Welfare Act of 1966 (P.L. 89-544, as amended, 7 U.S.C. ''2131 et seq.) pertaining to the care, handling, and treatment of warm blooded animals held for research, teaching, or other activities supported by this award of assistance.
16. Will comply with the Lead-Based Paint Poisoning Prevention Act (42 U.S.C. ''4801 et seq.) which prohibits the use of lead- based paint in construction or rehabilitation of residence structures.
17. Will cause to be performed the required financial and compliance audits in accordance with the Single Audit Act Amendments of 1996 and OMB Circular No. A-133, "Audits of States, Local Governments, and Non-Profit Organizations."
18. Will comply with all applicable requirements of all other Federal laws, executive orders, regulations and policies governing this program.
Signature of Authorized Certifying Representative:
Name of Authorized Certifying Representative: Dacia M. Toll
Title: Co-CEO and President
Date Submitted: 07/01/2010
PR/Award # U282M100002 e9

Approved by OMB 0348-0046 Exp.
Disclosure of Lobbying Activities Complete this form to disclose lobbying activities pursuant to 31 U.S.C. 1352 1. Type of Federal Action:
Contract
Grant
Cooperative Agreement
Loan
Loan Guarantee
Loan Insurance
2. Status of Federal Action:
Bid/Offer/Application
Initial Award
Post-Award
3. Report Type:
Initial Filing
Material Change
For Material Change only: Year: 0Quarter: 0 Date of Last Report:
4. Name and Address of Reporting Entity: Prime Subawardee
Tier, if known: 0 Name: Address: City: State: Zip Code + 4: -
Congressional District, if known:
5. If Reporting Entity in No. 4 is a Subawardee, Enter Name and Address of Prime: Name: Address: City: State: Zip Code + 4: -
Congressional District, if known:
6. Federal Department/Agency: 7. Federal Program Name/Description:
CFDA Number, if applicable:
8. Federal Action Number, if known: 9. Award Amount, if known: $0 10. a. Name of Lobbying Registrant (if individual, last name, first name, MI): Address: City: State:
Zip Code + 4: -
b. Individuals Performing Services (including address if different from No. 10a) (last name, first name, MI): Address: City: State:
Zip Code + 4: - 11. Information requested through this form is authorized by title 31 U.S.C. section 1352. This disclosure of lobbying activities is a material representation of fact upon which reliance was placed by the tier above when this transaction was made or entered into. This disclosure is required pursuant to 31 U.S.C. 1352. This information will be reported to the Congress semi-annually and will be available for public inspection. Any person who fails to file the required disclosure shall be subject to a civil penalty of not less than $10,000 and not more than $100,000 for each such
failure.
Name: Dacia M. Toll Title: Co-Chief Executive Officer and President Applicant: Achievement First, Inc.
Date: 07/01/2010
Federal Use Only:
Authorized for Local Reproduction
Standard Form LLL (Rev. 7-
97)
PR/Award # U282M100002 e10

CERTIFICATION REGARDING LOBBYING
Certification for Contracts, Grants, Loans, and Cooperative Agreements.
The undersigned certifies, to the best of his or her knowledge and belief, that:
(1) No Federal appropriated funds have been paid or will be paid, by or on behalf of the undersigned, to any person for influencing or attempting to influence an officer or employee of any agency, a Member of Congress, an officer or employee of Congress, or an employee of a Member of Congress in connection with the awarding of any Federal contract, the making of any Federal grant, the making of any Federal Loan, the entering into of any cooperative agreement, and the extension, continuation, renewal, amendment, or modification of any Federal contract, grant, loan or cooperative agreement.
(2) If any funds other than Federal appropriated funds have been paid or will be paid to any person for influencing or attempting to influence an officer or employee of any agency, a Member of Congress, an officer or employee of Congress, or an employee of a Member of Congress in connection with this Federal contract, grant, loan or cooperative agreement, the undersigned shall complete and submit Standard Form - LLL, "Disclosure of Lobbying Activities," in accordance with its instructions.
(3) The undersigned shall require that the language of this certification be included in the award documents for all subawards at all tiers (including subcontracts, subgrants and contracts under grants, loans, and cooperative agreements) and that all subrecipients shall certify and disclose accordingly. This certification is a material representation of fact upon which reliance was placed when this transaction was made or entered into. Submission of this certification is a prerequisite for making or entering into this transaction imposed by section 1352, title 31, U.S. Code. Any person who fails to file the required certification shall be subject to a civil penalty of not less than $10,000 and not more than $100,000 for each such failure.
Statement for Loan Guarantees and Loan Insurance.
The undersigned states, to the best of his or her knowledge and belief, that:
If any funds have been paid or will be paid to any person for influencing or attempting to influence an officer or employee or any agency, a Member of Congress, an officer or employee of Congress, or an employee of a Member of Congress in connection with this commitment providing for the United States to insure or guarantee a loan, the undersigned shall complete and submit Standard Form-LLL, "Disclosure of Lobbying Activities," in accordance with its instructions. Submission of this statement is a prerequisite for making or entering into this transaction imposed by section 1352, title 31, U.S. Code. Any person who fails to file the required statement shall be subject to a civil penalty of not less than $10,000 and not more than $100,000 for each such failure.
APPLICANT'S ORGANIZATION
Achievement First, Inc.
PRINTED NAME AND TITLE OF AUTHORIZED REPRESENTATIVE
Prefix: First Name: Dacia Middle Name: M
Last Name: Toll Suffix:
Title: Co-CEO and President
Signature: Date:
_______________________ 06/28/2010
ED 80-0013 03/04
PR/Award # U282M100002 e11

OMB No.1894-0005 Exp.01/31/2011
Section 427 of GEPA
NOTICE TO ALL APPLICANTS
The purpose of this enclosure is to inform you about a new provision in the Department of Education's General Education Provisions Act (GEPA) that applies to applicants for new grant awards under Department programs. This provision is Section 427 of GEPA, enacted as part of the Improving America's Schools Act
of 1994 (Public Law (P. L.) 103-382).
To Whom Does This Provision Apply?
Section 427 of GEPA affects applicants for new grant awards under this program. ALL APPLICANTS FOR NEW AWARDS MUST INCLUDE INFORMATION IN THEIR APPLICATIONS TO ADDRESS THIS NEW PROVISION IN ORDER TO RECEIVE FUNDING UNDER THIS PROGRAM. (If this program is a State-formula grant program, a State needs to provide this description only for projects or activities that it carries out with funds reserved for State-level uses. In addition, local school districts or other eligible applicants that apply to the State for funding need to provide this description in their applications to the State for funding. The State would be responsible for ensuring that the school district or other local entity has submitted a sufficient section 427 statement as described below.)
What Does This Provision Require?
Section 427 requires each applicant for funds (other than an individual person) to include in its application a description of the steps the applicant proposes to take to ensure equitable access to, and participation in, its Federally-assisted program for students, teachers, and other program beneficiaries with special needs. This provision allows applicants discretion in developing the required description. The statute highlights six types of barriers that can impede equitable access or participation: gender, race, national origin, color, disability, or age. Based on local circumstances, you should determine whether these or other barriers may prevent your students, teachers, etc. from such access or participation in, the Federally-funded project or activity. The description in your application of steps to be taken to overcome these barriers need not be lengthy; you may
provide a clear and succinct
description of how you plan to address those barriers that are applicable to your circumstances. In addition, the information may be provided in a single narrative, or, if appropriate, may be discussed in connection with related topics in the application. Section 427 is not intended to duplicate the requirements of civil rights statutes, but rather to ensure that, in designing their projects, applicants for Federal funds address equity concerns that may affect the ability of certain potential beneficiaries to fully participate in the project and to achieve to high standards. Consistent with program requirements and its approved application, an applicant may use the Federal funds
awarded to it to eliminate barriers it identifies.
What are Examples of How an Applicant Might Satisfy the Requirement of This Provision?
The following examples may help illustrate how an applicant may comply with Section 427.
(1) An applicant that proposes to carry out an adult literacy project serving, among others, adults with limited English proficiency, might describe in its application how it intends to distribute a brochure about the proposed project to such potential participants in their native language. (2) An applicant that proposes to develop instructional materials for classroom use might describe how it will make the materials available on audio tape or in braille for students who are blind. (3) An applicant that proposes to carry out a model science program for secondary students and is concerned that girls may be less likely than boys to enroll in the course, might indicate how it intends to conduct "outreach" efforts to girls, to encourage their enrollment.
We recognize that many applicants may already be implementing effective steps to ensure equity of access and participation in their grant programs, and we appreciate your cooperation in responding to the
requirements of this provision.
PR/Award # U282M100002 e12

Estimated Burden Statement for GEPA Requirements
According to the Paperwork Reduction Act of 1995, no persons are required to respond to a collection of information unless such collection displays a valid OMB control number. The valid OMB control number for this information collection is 1894-0005. The time required to complete this information collection is estimated to average 1.5 hours per response, including the time to review instructions, search existing data resources, gather the data needed, and complete and review the information collection. If you have any comments concerning the accuracy of the time estimate(s) or suggestions for improving this form, please write to: U.S. Department of Education, 400 Maryland Avenue, S.W., Washington, D.C. 20202-4537.
Applicants should use this section to address the GEPA provision.
Attachment: Title : CSP RE Grant Application GEPA Assurance File : C:\fakepath\CSP RE Grant Application GEPA Assurance 100701.pdf
PR/Award # U282M100002 e13

Achievement First GEPA Section 427 Assurance Page 1
Achievement First:
Replicating and Expanding High-Achieving Charter Schools in Connecticut, New York
and Rhode Island
Section 427 of the Department of Education’s General Education Provisions Act (GEPA)
GEPA Section 427: In accordance with the provisions of GEPA Section 427, AF has
taken many important steps to ensure equitable access to, and participation in, its program by
students, teachers and other program beneficiaries from historically disadvantaged backgrounds.
The mission of AF is to serve and close the achievement gap for socio-economically
disadvantaged minorities, and AF has purposefully chartered its schools in some of the most
underserved communities in Connecticut and Brooklyn, New York. Moreover, AF’s teacher
recruitment efforts seek to ensure that its instructional teams are as reflective as possible of the
communities and students its schools serve. AF aggressively recruits at and hires teachers from
the nation’s historically black colleges and universities, and is proactive about creating teacher
recruitment marketing materials that mirror the diversity it aims to build in its staff. AF prides
itself on being equal opportunity employers.
Within the underserved communities in which AF schools operate, AF engages in active
student recruitment to ensure that the beneficiaries of the organization’s top-quality educational
program are those students with the greatest need—primarily EDS and subgroups historically
impacted by the achievement gap. AF works to establish community partnerships with
organizations aligned with AF’s mission and work. In the past, AF has established partnerships
with organizations that serve high-need populations, including Head Start programs, churches,
PR/Award # U282M100002 e0

Achievement First GEPA Section 427 Assurance Page 2
Boys and Girls Clubs, daycare centers, public libraries and after-school programs to promote its
schools to prospective students and families. AF actively recruits students through targeted,
bilingual—English and Spanish—print and radio advertisements, brochures, mailings, and
information sessions.
All AF students are enrolled through a 100 percent blind lottery, and there are no
admission or tuition fees. In order to enter the lottery, students must reside in AF’s host districts.
Since AF strategically locates its schools in high-need districts, this enrollment restriction has
been largely effective in ensuring that AF serves historically disadvantaged students. AF students
are 99 percent African American or Hispanic and 72 percent are low-income.
Despite targeted outreach to high-need students in low-income neighborhoods, the
percentage of low-income students at some of AF’s schools has dropped below the
organization’s desired 70 percent threshold. AF’s growing reputation for outstanding academic
performance is attracting many parents from all income levels. While AF appreciates the right of
all students to a high-quality education, the organization believes that more affluent students
have other paths to a high-quality education. By targeting students without economic access to
high-quality educational opportunities, AF has the greatest impact.
In response to changing demographics, AF revised its student admission policy in New
York, through the approval of the school boards of directors and the state chartering authority, to
grant admissions preference for “students at-risk of academic failure.” Students at-risk of
academic failure are defined as students who: (1) qualify for the federal free or reduced price
lunch program; (2) meet requirements for the supplemental nutrition assistance program; or (3)
meet requirements for the temporary assistance for needy families program. These at-risk
PR/Award # U282M100002 e1

Achievement First GEPA Section 427 Assurance Page 3
students are offered admission or placed on the waiting list at an AF school before all other
applicants. If there are more at-risk student applicants than seats available, a random lottery
determines which students are offered admission and which are placed on the waiting list. After
all at-risk student applicants have been offered admission or placed on the waiting list, all other
applicants are entered into an enrollment lottery.
While an explicit lottery preference for “at risk students” is not legal in Connecticut, AF
has taken several measures in Connecticut to attract high-needs students. In Bridgeport, rather
than serve the entire City, AF established a more limited “catchment area,” which restricts
student recruitment and enrollment to the city’s East Side, East End and West Side/End
neighborhoods. All three neighborhoods reflect AF’s target, high-need population. The East
Side, East End and West Side/End have high concentrations of African American and Hispanic
residents—91, 91 and 75 percent, respectively. In addition, these neighborhoods represent a high
concentration of low-income families. For example, in Bridgeport’s East Side neighborhood, 40
percent of households do not have access to an automobile, and in the West Side/End
neighborhood, the unemployment rate is 14 percent and 27 percent of residents live below the
poverty level. By restricting student enrollment to these three neighborhoods, AF improves its
ability to serve Bridgeport’s highest need students.
PR/Award # U282M100002 e2

OMB No.1894-0007 Exp.05/31/2011
SUPPLEMENTAL INFORMATION REQUIRED FOR
DEPARTMENT OF EDUCATION GRANTS
1. Project Director:
Prefix: * First Name: Middle Name: * Last Name: Suffix:Dacia M Toll
Address:
* Street1: 403 James Street
Street2:
* City: New Haven
County: New Haven County
* State: CT* Zip / Postal Code: 06513 * Country: USA
* Phone Number (give area code)
Fax Number (give area code)
(203)773-3223 (203)773-3221
Email Address:
2. Applicant Experience
Novice Applicant Yes No Not applicable
3. Human Subjects Research
Are any research activities involving human subjects planned at any time during the proposed project period?
Yes No
Are ALL the research activities proposed designated to be exempt from the regulations?
Yes Provide Exemption(s) #:
No Provide Assurance #, if available:
Please attach an explanation Narrative:
Attachment: Title : File :
PR/Award # U282M100002 e17

Project Narrative
Abstract
Attachment 1: Title: Achievement First CSP Grant Application Abstract Pages: 1 Uploaded File: AF CSP RE Grant Application Abstract 100630.pdf
PR/Award # U282M100002 e18
Achievement First Abstract Page 1
Achievement First: Replicating and Expanding High-Achieving Charter Schools in
Connecticut, New York and Rhode Island
Abstract Narrative
Contact Information: Achievement First (AF) is located at 403 James Street, New Haven,
Connecticut 06513. The contact person for this project, Erica Schwedel, senior development
associate, can be reached at 203-773-3223 ext 17254 or at [email protected].
Project Goals: AF is a charter management organization operating 17 schools serving
4,500 students in Connecticut and New York. The goals of project are (1) to provide 5,500
additional students with the achievement gap-closing education they need to graduate from
college, and (2) to prove that the achievement gap can be closed at district scale.
Expect Outcomes: AF’s project outcomes are: (1) serve 10,000 students in 31 schools; (2)
close the achievement gap for EDS and racial/ethnic subgroups; (3) demonstrate 90 percent or
higher high school graduation, college acceptance and college matriculation rates; (4) maintain
student attendance rate of 96 percent and student retention rate of 95 percent; and (5) operate
within a sustainable budget.
Project Contributions: AF’s impact extends beyond its students through partnerships with
reform-oriented organizations and districts to inform district- and state-wide reform efforts.
Project Compliance: AF has already successfully grown a network of 17 schools serving
more than 4,500 students enrolled by blind lottery from its host districts. At per pupil costs equal
to or less than its host districts, AF has raised achievement levels of all students, including EDS
and historically disadvantaged subgroups, to meet or exceed state performance standards.
PR/Award # U282M100002 e0

Project Narrative
Priorities
Attachment 1: Title: Achievement First CSP Grant Application Priorities Pages: 6 Uploaded File: CSP RE Grant Application Priorities 100701.pdf
PR/Award # U282M100002 e20

Achievement First Project Narrative—Priorities Page 1
Achievement First:
Replicating and Expanding High-Achieving Charter Schools in Connecticut, New York,
and Rhode Island
Priorities
Table of Contents
I. ABSOLUTE PRIORITY 2
II. COMPETITIVE PRIORITIES 3
III. INVITATIONAL PRIORITY 5
PR/Award # U282M100002 e0
Achievement First Project Narrative—Priorities Page 2
I. ABSOLUTE PRIORITY
a. Absolute priority
The absolute priority states: “The applicant must have experience operating or managing more
than one high-quality charter school. For purposes of this priority, a high-quality charter school
is a school that shows evidence of strong academic results, as described in Selection Criteria (a),
and has no significant issues in the areas of student safety, financial management, or statutory or
regulatory compliance.”
Evidence of qualification:
• Achievement First (AF) is a nationally recognized charter school management
organization operating nine charters, with 17 separate schools which collectively serve
more than 4,500 students in Connecticut and New York. See Project Narrative—Section
4—Other Attachments: Schools Operated by Applicant for a description of the 17 schools
operated by AF.
• AF students significantly outperform students in their host districts at all grade levels and
are competitive state-wide, as well as with Connecticut’s and New York’s economically
and educationally privileged populations. See page 5 of the Project Narrative, Project
Narrative—Project Narrative—Section II Selection Criteria (A)—Student Academic
Achievement, and Project Narrative—Section 5—Other Attachments: Student Academic
Achievement, for evidence of strong academic results.
• AF confirms that it has not experienced any significant issues in the areas of student
safety, financial management, or statutory or regulatory compliance. The only
compliance issue that AF is working with its authorizers to resolve, which is not renewal-
PR/Award # U282M100002 e1

Achievement First Project Narrative—Priorities Page 3
threatening, involves teacher certification and delays in getting its teachers the
appropriate paperwork. AF’s authorizers have noted the progress made in this area and
have renewed AF’s charters despite this challenge. See page 49 of the Project Narrative,
Project Narrative—Project Narrative—Section V Selection Criteria (D)—Management
Plan, for confirmation of no significant issues.
II. COMPETITIVE PRIORITIES
a. Competitive Preference Priority 1—Low-Income Demographic
The first competitive preference priority states: “To meet this competitive preference priority, the
applicant must demonstrate that at least 60 percent of all students in the charter schools it
operates or manages are individuals from low-income families.”
Evidence of qualification:
• Seventy-two percent of AF’s student body is classified as low-income based on eligibility
for free or reduced-price lunch according to the National School Lunch Program. See
page 16 of the Project Narrative, Project Narrative—Project Narrative—Section II
Selection Criteria (A)—Student Academic Achievement, and Project Narrative—Section
5—Other Attachments: Student Academic Achievement for evidence of low-income
student body.
b. Competitive Preference Priority 2—School Improvement
The second competitive preference priority states: “To meet this competitive preference priority,
the applicant must demonstrate that its proposed replication or expansion of one or more high-
quality charter schools is in partnership with, and designed to assist, one or more LEAs in
PR/Award # U282M100002 e2

Achievement First Project Narrative—Priorities Page 4
implementing academic or structural interventions to serve students attending schools that have
been identified for improvement, corrective action, closure, or restructuring under section 1116
of the ESEA, and as described in the notice of final requirements for the School Improvement
Grants, published in the Federal Register on December 10, 2009 (74 FR 65618).”
Evidence of qualification:
• AF has entered into partnerships with, and designed to assist, Providence and Cranston,
Rhode Island; New York City, New York; and New Haven, Connecticut. See page 53 of
the Project Narrative, Project Narrative—Project Narrative—Section V Selection Criteria
(D)—Management Plan, and Project Narrative—Section 2—Other Attachments: Letters
of Support for evidence of partnership with local educational agencies.
c. Competitive Preference Priority 3—Matching
The third competitive preference priority states: “To meet this competitive preference priority,
the applicant must commit to provide matching funds in an amount equal to or greater than 25
percent of the grant award to support its proposed project under this program. In order to secure
matching funds and meet this competitive preference priority, the applicant may enter into a
partnership or otherwise collaborate with other entities, including philanthropic organizations.”
Evidence of qualification:
• AF has the financial support of New Profit, a national venture capital fund, The Peter and
Carmen Lucia Buck Foundation and individual philanthropist Jon Sackler. See page 46 of
the Project Narrative, Project Narrative—Project Narrative—Section V Selection Criteria
PR/Award # U282M100002 e3

Achievement First Project Narrative—Priorities Page 5
(D)—Management Plan, and Project Narrative—Section 2—Other Attachments: Letters
of Support for evidence of matching funds.
III. INVITATIONAL PRIORITY
d. Invitational priority
The invitational priority states: “The Secretary is particularly interested in applicants that
demonstrate through participant, achievement, and outcome data for students with disabilities
and English learners—
(1) Prior success in improving educational achievement and outcomes for students with
disabilities and English learners; and
(2) That the model they propose to replicate or expand serves students with disabilities and
English learners at rates comparable to the rates of students with disabilities and English learners
in the LEAs in which their schools operate.”
Evidence of qualification:
• AF has success improving the educational achievement and outcomes for students with
disabilities and English learners. See page 18 of the Project Narrative, Project
Narrative—Project Narrative—Section II Selection Criteria (A)—Student Academic
Achievement, and Project Narrative—Section 5—Other Attachments: Student Academic
Achievement for evidence of participation, achievement and outcomes for students with
disabilities and English learners.
• AF has a program in place to serve students with disabilities and English learners. See
page 25 of the Project Narrative, Project Narrative—Project Narrative—Section III
PR/Award # U282M100002 e4

Achievement First Project Narrative—Priorities Page 6
Selection Criteria (B)—Contribution in assisting EDS, for evidence of program to serve
these subgroups.
PR/Award # U282M100002 e5

Project Narrative
Project Narrative
Attachment 1: Title: Achievement First CSP Grant Application Project Narrative Pages: 60 Uploaded File: AF CSP RE Grant Application Project Narrative 100701.pdf
PR/Award # U282M100002 e27

Achievement First:
Replicating and Expanding High-Achieving Charter Schools in Connecticut, New York
and Rhode Island
Project Narrative
Table of Contents
I. EXECUTIVE SUMMARY 2
II. SELECTION CRITERIA (A) – STUDENT ACADEMIC ACHIEVEMENT 5
III. SELECTION CRITERIA (B) – CONTRIBUTION IN ASSISTING EDS 5
IV. SELECTION CRITERIA (C) – PROJECT DESIGN 29
V. SELECTION CRITERIA (D) – MANAGEMENT PLAN 38
VI. APPLICATION REQUIREMENTS 59
PR/Award # U282M100002 e0

Achievement First Project Narrative Page 2
I. EXECUTIVE SUMMARY
Achievement First (AF) is a nationally recognized, non-profit charter school management
organization operating nine charters, with 17 separate schools which collectively serve more than
4,500 students in Connecticut and New York. AF was established in 2003 to replicate the
success of Amistad Academy middle school, the organization’s first high-performing school in
New Haven, Connecticut, founded in 1999. Since 2003, AF has systematized the knowledge and
best practices developed at Amistad Academy and adapted and improved them to open
additional schools in New Haven, Connecticut, and in Bridgeport and Hartford, Connecticut, and
Brooklyn, New York. With the support of this grant, AF will be able to nearly double its network
to operate 31 schools serving more than 10,000 students by 2015.
The mission of AF is to deliver on the promise of equal educational opportunity for all of
America’s children and to close the country’s vexing achievement gaps. AF fulfills its mission
through three core strategies:
1. To provide all AF students, the strong majority of whom are educationally disadvantaged
students (EDS), with achievement gap-closing academic skills and the strength of
character they need to graduate from top colleges, to succeed in a competitive world and
to serve as the next generation of leaders for their communities.
2. To grow its network of schools into the equivalent of a high-performing, urban public
school “district,” serving as a powerful proof point that the achievement gap can be
closed at district scale.i
3. To partner with other like-minded, reform-oriented organizations and school districts to
inspire and inform broader district- and state-wide reform efforts.
PR/Award # U282M100002 e1
Achievement First Project Narrative Page 3
Over the past 11 years, AF has consistently proved that the achievement gap can be
closed between EDS and their non-disadvantaged peers. Two recent external studies have
independently validated AF’s dramatic success in raising student academic achievement.
1. Yale University Professor Justine Hastingsii conducted an evaluation of AF in New
Haven, Connecticut that exploited the random admission of students to AF schools
through the lottery admission process and an instrumental variables analysis to explicitly
test for AF’s causal impact on student achievement. The study found that attending an
AF school for just one year increased students’ reading and writing achievement scores
significantly and substantially in reading and writing (.71 and .30 student level standard
deviations, respectively) relative to attending other New Haven Public Schools.
2. Mathematica Policy Researchiii conducted a rigorous quasi-experimental analysis of the
impact on student achievement of five middle schools operated by AF and by Uncommon
Schools—a sister charter network in New York City. The study used sophisticated
propensity score matching to compare performance over time of charter students entering
these AF and Uncommon middle schools to non-charter students who had comparable
baseline student achievement and demographic characteristics. This analysis found
significant and substantially meaningful impacts on student achievement within two years
of charter school enrollment in math achievement, and in both math and reading within
three years. The study estimated that the third-year effect sizes translate to an estimated
0.9 years of accelerated growth in student math learning, and 0.7 years of accelerated
growth in reading, relative to attending other New York City schools.
AF is pursuing an aggressive growth plan to serve 12,000 students in 34 schools by 2018.
The chart below depicts this growth.
PR/Award # U282M100002 e2

Achievement First Project Narrative Page 4
AF’s new schools will continue to be located in New Haven, Bridgeport and Hartford,
Connecticut, and Brooklyn, New York, with additional expansion to Rhode Island. Rhode Island
is a new geography for AF, but one with a similarly underserved student population and reform-
oriented State education leadership. The location and timing of new schools will be driven by
two main factors: (a) provisions by each state for equitable public funding and facilities to
support charter schools and (b) school leaders with the experience and capabilities to run high-
performing charter schools.
The sustainable scaling of the AF network while maintaining educational quality is made
possible through management systems and supports provided by AF’s central office, known as
“Network Support.” Network Support provides a range of services to the schools, including:
finance and budgeting, staff recruitment, curriculum development, technology support, human
resources, special education support, teacher professional development, operations support,
facilities, marketing, fundraising, and, most importantly, school leadership selection, training,
-
2,000
4,000
6,000
8,000
10,000
12,000
14,000
-5
10 15 20 25 30 35 40
Stud
ents
Scho
ols
Year ending
Achievement First Growth
Schools Students
PR/Award # U282M100002 e3

Achievement First Project Narrative Page 5
ongoing coaching and evaluation. By centralizing and coordinating these services, AF Network
Support is able to deliver them at both a higher level of quality and lower cost than a single
school would on its own. In addition, AF Network Support frees principals and teachers to focus
on the most important things: teaching, learning and student achievement.
II. SELECTION CRITERIA (A)—STUDENT ACADEMIC ACHIEVEMENT
See Project Narrative—Section 5—Other Attachments: Student Academic Achievement for
complete documentation of AF’s student academic achievement and attainment as a network, by
school and by subgroup, and as compared to host districts and states.
i. Student academic achievement and attainment
AF’s most important organizational value is an unwavering focus on completely closing
the achievement gap for its students, and impact on student achievement is the chief factor in all
organizational decisions. There are some critics of high-performing charter schools who say that
the results are based, at least in part, on selection bias or demographic differences. AF has
participated in two rigorous, quasi-experimental research studies, discussed in the Executive
Summary, that establish that, in fact, it is attendance at an AF school that is having a substantial,
casual affect on student performance. The chart below demonstrates the dramatic increase in
academic performance across all subjects achieved by students at AF’s original school, Amistad
Academy in New Haven, Connecticut, as they progressed from fourth grade (2004-05) to eighth
grade (2008-09), the most recent year for which data is available. The average percentage of
Amistad Academy students proficient in all subjects on the Connecticut Mastery Test grew 22
percent from 2004 to 2009, while New Haven Public Schools students grew only 8 percent over
the same period of time.
PR/Award # U282M100002 e4

Achievement First Project Narrative Page 6
[*Amistad Academy students are enrolled via blind lottery from New Haven Public Schools’
student body. New Haven Public Schools did not release the test scores of the 2004 incoming
fifth graders to AF, therefore the above graph uses the test scores of the 2008 incoming fifth
graders to AF as a proxy. Connecticut changed its state testing schedule from fall in the 2004-05
school year to spring in the 2005-06 school year.]
In addition to the dramatic increase in achievement levels at the original AF school,
Amistad Academy, all of AF’s schools have demonstrated significant increases in student
academic achievement. Below are highlights of some recently received student performance
accolades for schools across the AF network:
• In 2009, AF Bridgeport Academy Middle School in Bridgeport, Connecticut,
achieved student performance gains across all subjects of 21 percent between the
2007-08 and 2008-09 school years—the largest annual performance gains of any
middle school in the entire state of Connecticut.
0102030405060708090
100
4th Grade (2004)* 5th Grade (2006) 6th Grade (2007) 7th Grade (2008) 8th Grade (2009)
Connecticut Mastery TestPercentage of Students At or Above Proficiency Over Time in Math,
Reading and Writing
New Haven Public Schools Amistad Academy Connecticut
PR/Award # U282M100002 e5

Achievement First Project Narrative Page 7
• In 2009, AF Hartford Academy Middle School in Hartford, Connecticut, achieved
annual student performance gains of 13 percent—the greatest annual performance
gains of any school in Hartford.
• In 2009, Elm City College Preparatory Elementary School in New Haven,
Connecticut, demonstrated the highest African American student performance of any
elementary school in Connecticut. In fact, Elm City College Preparatory Elementary
had the unfortunate distinction of being the only elementary school in Connecticut
where African American students outperformed state-wide averages.
• All AF New York schools have consistently received straight “A” grades on the New
York City Department of Education Annual Progress Report.
AF has a demonstrated track record of raising the achievement levels of its students—99
percent of whom are African American or Hispanic and 72 percent of whom are classified as
low-income—to be competitive with state-wide proficiency averages, as well as those of
Connecticut’s and New York’s economically and educationally privileged populations. This
Project Narrative utilizes state test data to demonstrate AF’s achievement gap-closing results for:
all students, EDS students and subgroups impacted by the achievement gap. Due to data and
space limitations, the Narrative focuses on proficiency scores on the most recently available state
test from spring 2009. However, the 2009 AF student proficiency data discussed in the
subsequent Narrative sections should be considered within the context of the Amistad Academy
student achievement trajectory, which demonstrates a correlation between the number of years in
an AF school and progress toward achievement gap-closing academic results.
To ensure that AF is delivering an achievement gap-closing education for all students,
frequent, systematic monitoring of student progress is an organizational pillar. All AF students
PR/Award # U282M100002 e6

Achievement First Project Narrative Page 8
are regularly assessed through internal diagnostic tests and interim assessments, which gauge
academic progress in core content areas and provide teachers with the information they need to
adjust lesson plans, target instruction and design interventions for struggling students. While
these assessments allow for crucial internal monitoring of student learning throughout the
academic year, AF schools are primarily accountable for meeting state academic standards. All
AF students take the appropriate state assessments each academic year. State assessment data is
used to measure the progress of AF students against state-wide and host district students. AF
students are assessed through the following state tests:
• The Connecticut Mastery Test is administered in early spring to Connecticut students in
grades three through eight. The test assesses all students in math, reading and writing,
and students in grades five and eight in science, as well.
• The Connecticut Academic Performance Test is administered in early spring to
Connecticut students in grade 10. The test assesses students in math, reading, writing and
science.
• The New York State Test is administered in early spring to New York students in grades
three through eight. The test assesses all students in math and English Language Arts,
and students in grades four and eight in science and history, as well.
a. Student academic achievement and attainment for all students
1. Academic achievement
AF student performance vs. Host district performance: Students at all AF schools are
enrolled by blind lottery from the host districts in which AF schools reside. AF’s host districts—
New Haven, Bridgeport and Hartford, Connecticut, and Districts 13, 16, 17, 19, 23 and 32 in
PR/Award # U282M100002 e7

Achievement First Project Narrative Page 9
Brooklyn, New York—serve a population similar to AF, with more than 85 percent of students
in these districts identifying as African American or Hispanic and more than 70 percent
qualifying as low-income. Despite having demographically similar student bodies, AF students
significantly outperform students in their host districts at all grade levels.
On the 2009 Connecticut state tests, students in AF’s capstone grades—fourth, eighth
and 10th—outperformed New Haven Public Schools students in corresponding grades by double-
digit margins in all subjects. In an average of math, reading, writing and science (eighth grade
only), AF fourth graders outperformed New Haven Public Schools fourth graders by 27
percentage points, AF eighth graders surpassed New Haven Public Schools eighth graders by 25
percentage points and AF 10th graders outperformed New Haven Public Schools 10th graders by
36 percentage points.
In Bridgeport and Hartford, where AF opened schools more recently and has not yet
grown to scale, AF students outperformed district students by smaller margins and are on track to
continue making strong gains. In Bridgeport, AF’s oldest students—sixth graders who had been
with AF for less than two years—outperformed Bridgeport Public Schools sixth graders by an
average of 19 percentage points in math, reading and writing, and, as a cohort, demonstrated the
greatest annual performance gains of any middle school in Connecticut. In Hartford, AF’s
inaugural class of fifth graders, who had been with AF for less than one year, outperformed
Hartford Public Schools fifth graders by an average of 8 percentage points in math, reading,
writing and science, and demonstrated the greatest annual performance gains of any school in the
host district.
PR/Award # U282M100002 e8

Achievement First Project Narrative Page 10
On the 2009 New York State Test, AF’s oldest elementary and middle school students in
each of its host districts outperformed district students across all subjects. At AF’s first
Brooklyn, New York elementary schools—AF East New York Elementary in District 19 and AF
Crown Heights Elementary in District 17—AF fourth graders surpassed host district students by
double digit margins. AF East New York Elementary fourth graders outperformed District 19
fourth graders by 18 percentage points in math and 23 percentage points in English Language
Arts. Similarly, AF Crown Heights Elementary fourth graders surpassed District 17 fourth
graders by 18 percentage points in math, demonstrating 100 percent proficiency, and by 32
percentage points in English Language Arts. At AF’s first Brooklyn, New York middle school—
AF Crown Heights Middle in District17—AF eighth graders outperformed District 17 eighth
graders by 30 percentage points in math and 30 percentage points in English Language Arts.
AF student performance vs. State student performance: After four years at an AF school,
it is expected that student achievement on state tests will meet or exceed state-wide proficiency
averages, making AF students competitive with students from all subgroups state-wide. The
majority of Connecticut’s student population is economically and educationally advantaged, with
only 31 percent of students identifying as African American or Hispanic and 30 percent low-
income. This is the opposite of the AF network, where 99 percent of students are African
American or Hispanic and 72 percent are low-income.
In Connecticut, where 95 to 100 percent of students in the famously privileged towns of
Madison and Westport achieve proficiency on the Connecticut state tests, students in AF’s
capstone grades—fourth, eighth and 10th—are competitive with these students. On the 2009
Connecticut state tests, proficiency rates for AF’s fourth, eighth and 10th graders ranged from 66
percent (eighth-grade science) to 100 percent (10th-grade writing). In an average of all subjects,
PR/Award # U282M100002 e9

Achievement First Project Narrative Page 11
AF fourth graders outperformed Connecticut fourth graders by six percentage points, AF eighth
graders achieved on par with state-wide eighth graders, and AF 10th graders surpassed
Connecticut 10th graders by eight percentage points.
In stark contrast, fourth, eighth and 10th-grade students in AF’s host district of New
Haven, Connecticut, trailed state-wide students by significant margins in all subjects. On the
2009 Connecticut state tests, proficiency rates for New Haven Public Schools fourth, eighth and
10th graders ranged from a low of 43 percent (10th-grade science) to a high of only 68 percent
(10th-grade writing). In an average of all subjects, New Haven Public Schools students trailed
Connecticut students by 27 percentage points in fourth grade, 24 percentage points in eighth
grade and 27 percentage points in 10th grade.
On the 2009 New York State Test, students in AF’s capstone grades—fourth and
eighth—outperformed New York state averages in math and English Language Arts. AF fourth
graders outperformed New York fourth graders by 12 and 16 percentage points in math and
English Language Arts, respectively. At least 90 percent of AF fourth graders demonstrated
proficiency in both subjects. Similarly, AF’s eighth graders surpassed New York eighth graders
by 10 and 8 percentage points in math and English Language Arts, respectively.
2. Student attendance and retention
AF knows that high student attendance and retention are critical prerequisites to raising
student achievement. The following chart summarizes AF’s student attendance and retention for
the 2008-09 school year.
2008-09 AF AF CT CT Improvement of AF NY NY Improvement of
PR/Award # U282M100002 e10
Achievement First Project Narrative Page 12
AF over CT AF over NY
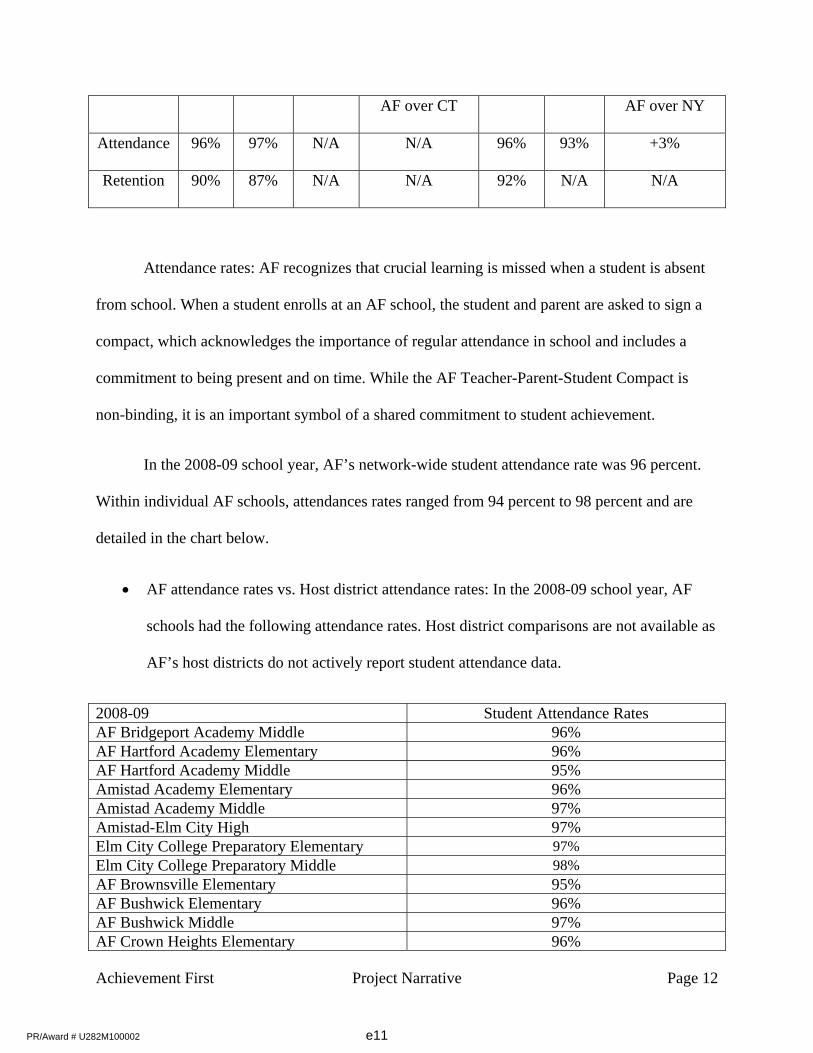
Attendance 96% 97% N/A N/A 96% 93% +3%
Retention 90% 87% N/A N/A 92% N/A N/A
Attendance rates: AF recognizes that crucial learning is missed when a student is absent
from school. When a student enrolls at an AF school, the student and parent are asked to sign a
compact, which acknowledges the importance of regular attendance in school and includes a
commitment to being present and on time. While the AF Teacher-Parent-Student Compact is
non-binding, it is an important symbol of a shared commitment to student achievement.
In the 2008-09 school year, AF’s network-wide student attendance rate was 96 percent.
Within individual AF schools, attendances rates ranged from 94 percent to 98 percent and are
detailed in the chart below.
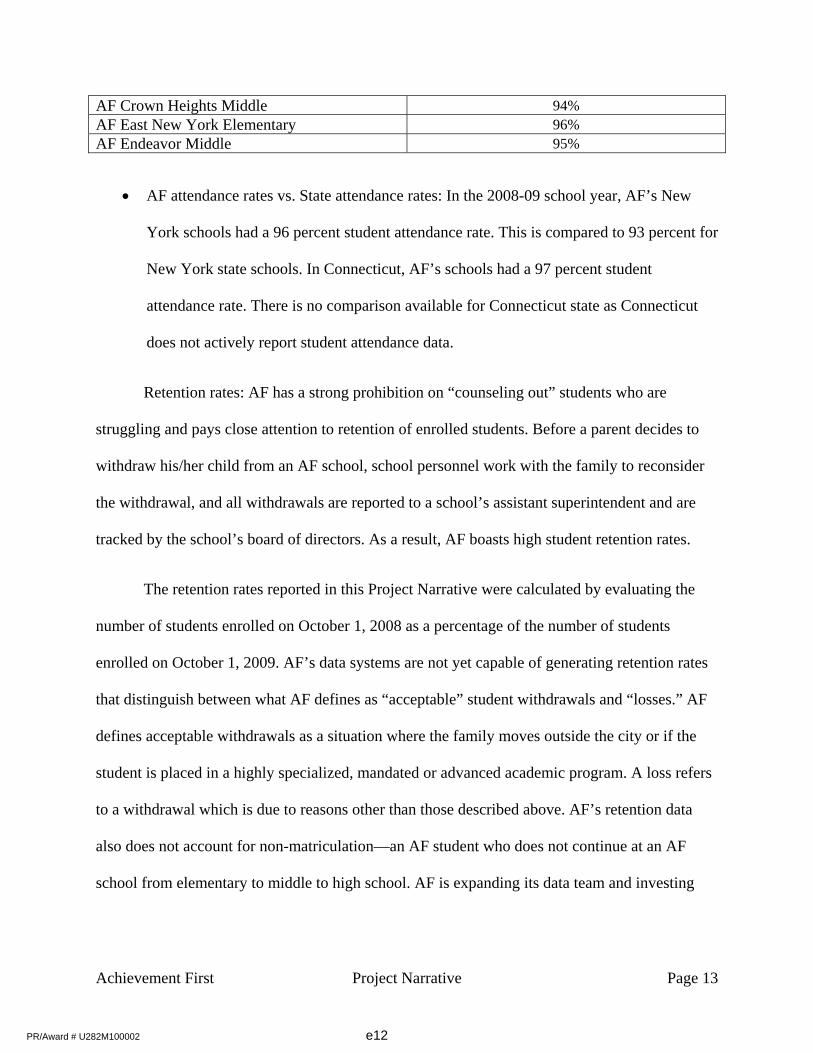
• AF attendance rates vs. Host district attendance rates: In the 2008-09 school year, AF
schools had the following attendance rates. Host district comparisons are not available as
AF’s host districts do not actively report student attendance data.
2008-09 Student Attendance Rates AF Bridgeport Academy Middle 96% AF Hartford Academy Elementary 96% AF Hartford Academy Middle 95% Amistad Academy Elementary 96% Amistad Academy Middle 97% Amistad-Elm City High 97% Elm City College Preparatory Elementary 97% Elm City College Preparatory Middle 98% AF Brownsville Elementary 95% AF Bushwick Elementary 96% AF Bushwick Middle 97% AF Crown Heights Elementary 96%
PR/Award # U282M100002 e11
Achievement First Project Narrative Page 13
AF Crown Heights Middle 94% AF East New York Elementary 96% AF Endeavor Middle 95%
• AF attendance rates vs. State attendance rates: In the 2008-09 school year, AF’s New
York schools had a 96 percent student attendance rate. This is compared to 93 percent for
New York state schools. In Connecticut, AF’s schools had a 97 percent student
attendance rate. There is no comparison available for Connecticut state as Connecticut
does not actively report student attendance data.
Retention rates: AF has a strong prohibition on “counseling out” students who are
struggling and pays close attention to retention of enrolled students. Before a parent decides to
withdraw his/her child from an AF school, school personnel work with the family to reconsider
the withdrawal, and all withdrawals are reported to a school’s assistant superintendent and are
tracked by the school’s board of directors. As a result, AF boasts high student retention rates.
The retention rates reported in this Project Narrative were calculated by evaluating the
number of students enrolled on October 1, 2008 as a percentage of the number of students
enrolled on October 1, 2009. AF’s data systems are not yet capable of generating retention rates
that distinguish between what AF defines as “acceptable” student withdrawals and “losses.” AF
defines acceptable withdrawals as a situation where the family moves outside the city or if the
student is placed in a highly specialized, mandated or advanced academic program. A loss refers
to a withdrawal which is due to reasons other than those described above. AF’s retention data
also does not account for non-matriculation—an AF student who does not continue at an AF
school from elementary to middle to high school. AF is expanding its data team and investing
PR/Award # U282M100002 e12

Achievement First Project Narrative Page 14
more in data systems and practices to ensure that, in the future, the organization can generate
data that provides a more thorough and accurate picture of the network.
• AF retention rates network-wide: In 2008-09, AF’s network-wide student retention rate
was 90 percent, including both acceptable withdrawals and losses. As AF improves its
data systems, it aims for annual student retention rates of at least 95 percent, excluding
acceptable withdrawals.
• AF retention rates by school: The retention rates of AF schools in the 2008-09 school
year are detailed in the following chart.
2008-09 Student Retention Rates Achievement First Bridgeport Academy Middle
83%
Achievement First Hartford Academy Elementary
92%
Achievement First Hartford Academy Middle 84% Amistad Academy Middle 92% Amistad Academy Elementary 75% Amistad-Elm City High 86% Elm City College Preparatory Elementary 97% Elm City College Preparatory Middle 84% Achievement First Brownsville Elementary 94% Achievement First Bushwick Elementary 95% Achievement First Bushwick Middle 86% Achievement First Crown Heights Elementary 96% Achievement First Crown Heights Middle 92% Achievement First East New York Elementary 94% Achievement First Endeavor Middle 83%
3. High school graduation and college acceptance rates
The primary goal of AF’s achievement gap-closing educational program is to prepare
students for success in college and life. As a result, AF has set high standards for high school
graduation and college acceptance and matriculation. AF expects:
PR/Award # U282M100002 e13
Achievement First Project Narrative Page 15
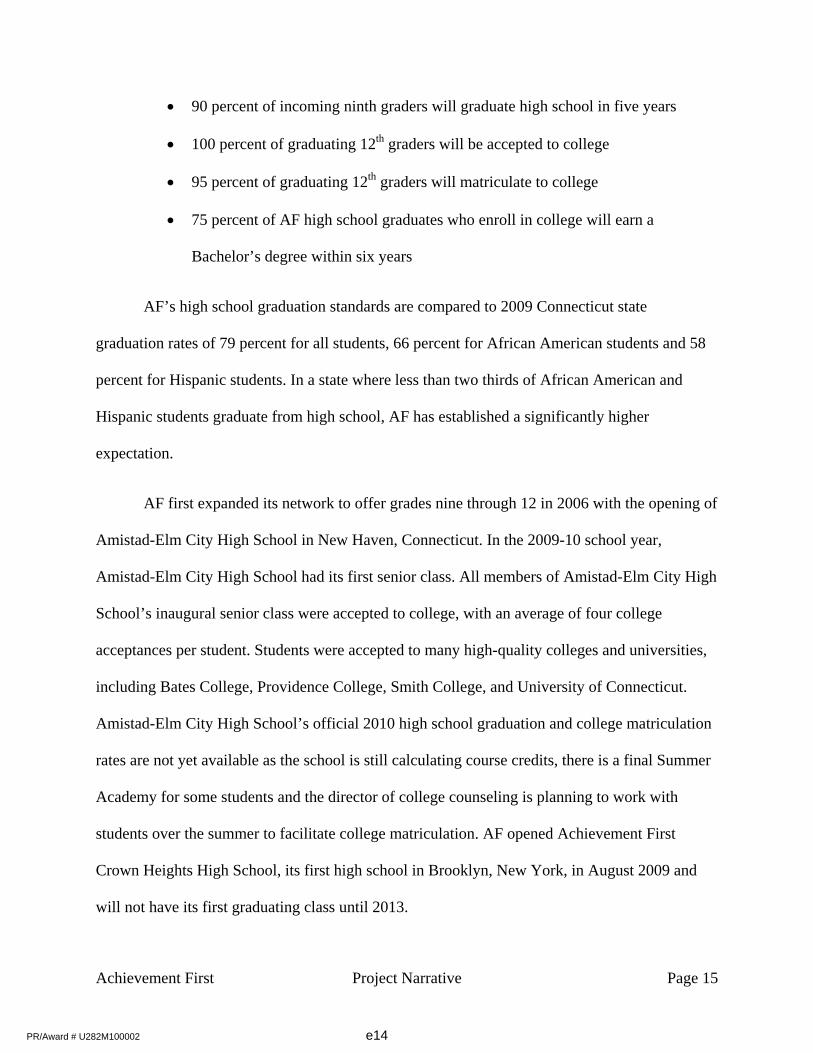
• 90 percent of incoming ninth graders will graduate high school in five years
• 100 percent of graduating 12th graders will be accepted to college
• 95 percent of graduating 12th graders will matriculate to college
• 75 percent of AF high school graduates who enroll in college will earn a
Bachelor’s degree within six years
AF’s high school graduation standards are compared to 2009 Connecticut state
graduation rates of 79 percent for all students, 66 percent for African American students and 58
percent for Hispanic students. In a state where less than two thirds of African American and
Hispanic students graduate from high school, AF has established a significantly higher
expectation.
AF first expanded its network to offer grades nine through 12 in 2006 with the opening of
Amistad-Elm City High School in New Haven, Connecticut. In the 2009-10 school year,
Amistad-Elm City High School had its first senior class. All members of Amistad-Elm City High
School’s inaugural senior class were accepted to college, with an average of four college
acceptances per student. Students were accepted to many high-quality colleges and universities,
including Bates College, Providence College, Smith College, and University of Connecticut.
Amistad-Elm City High School’s official 2010 high school graduation and college matriculation
rates are not yet available as the school is still calculating course credits, there is a final Summer
Academy for some students and the director of college counseling is planning to work with
students over the summer to facilitate college matriculation. AF opened Achievement First
Crown Heights High School, its first high school in Brooklyn, New York, in August 2009 and
will not have its first graduating class until 2013.
PR/Award # U282M100002 e14

Achievement First Project Narrative Page 16
b. Student academic achievement and attainment for EDS
AF serves three subgroups of EDS: (1) Low-income students identified by eligibility for
free or reduced-price lunch according to the National School Lunch Program; (2) English
language learners; and (3) Students with disabilities or special education students. Across the AF
network, 72 percent of students are classified as low-income, 0.4 percent are English language
learners and 8 percent qualify for special education. In addition, AF’s student population reflects
three subgroups historically impacted by the achievement gap. These subgroups are: (1) African
American students; (2) Hispanic students; and (3) Low-income students. Across the AF network,
82 percent of students are African American, 17 percent are Hispanic and 72 percent are low-
income.
1. Academic achievement
AF free and reduced-price lunch students vs. State free and reduced-price lunch students:
Seventy-two percent of AF’s student body is classified as low-income based on eligibility for
free or reduced-price lunch according to the National School Lunch Program. According to the
most recent study by the National Assessment of Educational Progress, Connecticut has the
largest achievement gap in the country between low-income students and their non-poor peers,
with low-income students achieving more than three grade levels behind their non-poor peers by
eighth grade.
On the 2009 Connecticut state tests, AF’s low-income students come very close to
closing Connecticut’s troubling and persistent achievement gap. In capstone grades—fourth,
eighth and 10th—AF’s low-income students outperformed Connecticut’s low-income students by
double-digit margins in all subjects on state tests. In an average of all subjects, AF’s low-income
PR/Award # U282M100002 e15
Achievement First Project Narrative Page 17
students outperformed Connecticut’s low-income students by 23 percentage points in fourth
grade, by 22 percentage points in eighth grade and by 32 percentage points in 10th grade.
When compared to Connecticut’s non-poor students, AF’s low-income students trailed
Connecticut’s non-poor students by four percentage points in fourth grade and by nine
percentage points in eighth grade. This demonstrates a significant narrowing of the achievement
gap between AF’s poor and Connecticut’s non-poor students—although AF remains focused on
closing this gap altogether. By comparison, in AF’s host district of New Haven, Connecticut,
low-income students trailed Connecticut’s non-poor students by 31 percentage points in fourth
grade and by 37 percentage points in eighth grade. By 10th grade, the achievement gap between
New Haven Public Schools low-income students and Connecticut’s non-poor students grew to 42
percentage points. On the other hand, AF’s low-income 10th graders closed the achievement gap,
surpassing Connecticut’s non-poor 10th graders by one percentage point across math, reading,
writing and science—thereby providing a powerful proof point that the achievement gap based
on economic status can be closed.
While Connecticut is 50 out of 50 states in terms of the economic achievement gap, New
York is not much better. Thirty-seventh out of 50 states, New York’s low-income eighth graders
achieve, on average, more than two grade levels behind their non-poor peers. Once again, AF’s
low-income students do not conform to the state’s achievement gap. On the 2009 New York
State Test, AF’s low-income fourth graders outperformed the state’s low-income fourth graders
by 16 percentage points in math and 26 percentage points in English Language Arts. Similarly,
AF’s low-income eighth graders outperformed New York’s low-income eighth graders by 21
percentage points in math and 16 percentage points in English Language Arts.
PR/Award # U282M100002 e16

Achievement First Project Narrative Page 18
When compared to New York’s non-poor students, AF’s low-income students
demonstrated that the economic achievement gap can be closed. On the 2009 New York State
Test, AF’s low-income fourth graders outperformed New York’s non-poor fourth graders by five
percentage points across math and English Language Arts. Meanwhile, AF’s low-income eighth
graders trailed New York’s non-poor eighth graders by only four percentage points across math
and English Language Arts. AF expects that, similar to its Connecticut 10th graders, its New
York eighth graders are on track to soundly close the achievement gap in the next couple of
years.
AF special education students vs. State special education students: Eight percent of AF
students are classified as special education students, which is just slightly below the Connecticut
state average of 11 percent and the New York City Public Schools average of 13 percent. AF
believes this differential in special education enrollment is not the result of enrollment practices
or attrition of special education students, but rather that AF identifies fewer students as needing
special education supports in the first place and that identified AF special education students are
exited from special education at a higher rate than in the traditional public schools—their
achievement increases to the point where they no longer qualify for special education.
AF does not report data for student subgroups of less than 10 students, and, therefore, of
its capstone grades in Connecticut and New York—fourth, eighth and 10th—AF will only report
special education student achievement data for its New York fourth graders, which includes 15
students. In all other capstone grades in Connecticut and New York, AF’s special education
student population fell below the organization’s 10 student threshold for accurate and meaningful
data reporting.
PR/Award # U282M100002 e17

Achievement First Project Narrative Page 19
On the 2009 New York State Test, AF’s special education fourth graders achieved 100
percent proficiency in math and 73 percent proficiency in English Language Arts, outperforming
New York’s special education students by 39 and 36 percentage points, respectively.
AF English language learners vs. State English language learners: AF’s English language
learner student population is very small, comprising only 0.4 percent of the organization’s
students. Much of the discrepancy in AF’s ELL population is due to the fact that its schools are
located in overwhelmingly African American communities. However, AF also feels that it has
not fully penetrated the non-English speaking communities in its host districts. The organization
is strategizing ways to better reach and serve this population. In particular, AF’s student
recruitment efforts in recent years have purposefully targeted non-English speaking populations
through utilizing bilingual materials and bilingual recruiters to go out into communities and
speak with families.
AF does not report data for student subgroups of less than 10 students. In its capstone
grades in Connecticut and New York—fourth, eighth and 10th—AF’s English language learner
student population fell below the organization’s 10 student threshold for accurate and meaningful
data reporting.
2. Student attendance and retention
As stated above, AF knows that high student attendance and retention are critical
prerequisites to raising student achievement. AF schools are expected to maintain an annual
student attendance rate of 96 percent and an annual student retention rate of 95 percent for all
students, including subgroups of low-income students, special education students and English
language learners. AF is unable to generate student attendance rates by subgroup, but there is no
PR/Award # U282M100002 e18

Achievement First Project Narrative Page 20
reason to believe that attendance rates for these subgroups is significantly lower or higher than
the network’s 96 percent attendance rate for the 2008-09 school year. AF’s retention rates for
low-income and special education students in 2008-09 were on par with the AF network’s
retention rate of 90 percent at 91 percent and 90 percent, respectively. State and host district
student attendance and retention rates for specific subgroups are not actively reported and,
therefore, are unavailable for comparison.
3. High school graduation and college acceptance rates
AF’s Amistad-Elm City High School had its first senior class in 2009-10. Given that this
inaugural senior class was a small class of 27 students, sufficient data does not exist to
meaningfully report on low-income students, special education students or English language
learners as subgroups. Lower grades at Amistad-Elm City High School are larger—comprised of
80 to 90 students per grade—and will allow AF to track subgroup high school graduation and
college acceptance rates in a meaningful way in the future.
ii. Achievement gap
a. Academic achievement for African American and Hispanic students
1. Academic achievement for African American students
AF African American students vs. State African American students: AF’s student
population is 82 percent African American, which is significantly above state averages in
Connecticut (14 percent) and New York (19 percent), and above or on par with host district
averages (ranging from 25 percent to 86 percent). On the 2009 Connecticut state tests, African
American students in AF’s capstone grades—fourth, eighth and 10th—significantly
PR/Award # U282M100002 e19
Achievement First Project Narrative Page 21
outperformed Connecticut’s African American students. Across all subjects, AF’s African
American students outperformed Connecticut’s African American students by 23 percentage
points in fourth grade, by 24 percentage points in eighth grade and by 32 percentage points in
10th grade.
On the 2009 New York State Test, African American students in AF’s capstone grades—
fourth and eighth—outperformed New York’s African American students in all subjects. AF’s
African American fourth graders outperformed New York’s African American fourth graders by
21 percentage points in math and 27 percentage points in English Language Arts. Similarly, AF’s
African American eighth graders outperformed New York’s African American eighth graders by
28 percentage points in math and 25 percentage points in English Language Arts.
AF African American students vs. State Caucasian and Asian students: When compared
to Connecticut’s Caucasian and Asian students, AF’s African American students significantly
narrowed the achievement gap and almost closed it. AF’s African American students trailed
Connecticut’s Caucasian and Asian students by four percentage points in fourth grade, by seven
percentage points in eighth grade and by three percentage points in 10th grade. By comparison,
New Haven Public Schools African American students trailed Connecticut’s Caucasian and
Asian students by 34 percentage points in fourth grade, 36 percentage points in eighth grade and
45 percentage points in 10th grade.
On the 2009 New York State Test, African American students in AF’s capstone grades—
fourth and eighth—closed the achievement gap, outperforming New York’s Caucasian and Asian
students in fourth and eighth grades across all subjects. In an average of math and English
Language Arts, AF’s African American fourth graders outperformed New York’s Caucasian and
PR/Award # U282M100002 e20
Achievement First Project Narrative Page 22
Asian fourth graders by six percentage points, and AF’s African American eighth graders scored
on par with New York’s Caucasian and Asian eighth graders. The achievement of AF’s African
American students—a historically educationally disadvantaged subgroup—compared to New
York’s Caucasian and Asian students—a historically educationally advanced subgroup—
demonstrates clearly that the achievement gap can be closed.
2. Academic achievement for Hispanic students
AF Hispanic students vs. State Hispanic students: AF’s student population is 17 percent
Hispanic, which is on par with Connecticut (17 percent) and New York (21 percent) state
averages, and is within the range of AF’s host districts (ranging from 11 percent to 71 percent).
On the 2009 Connecticut state tests, Hispanic students in AF’s capstone grades—fourth, eighth
and 10th—significantly outperformed Connecticut’s Hispanic students. Across all subjects, AF’s
Hispanic students outperformed Connecticut’s Hispanic students by 31 percentage points in
fourth grade, by 13 percentage points in eighth grade and by 32 percentage points in 10th grade.
AF does not report data for student subgroups of less than 10 students. In AF’s capstone
grades in New York—fourth and eighth—the Hispanic student population fell below the
organization’s 10 student threshold for accurate and meaningful data reporting.
AF Hispanic students vs. State Caucasian and Asian students: Compared to Connecticut’s
Caucasian and Asian students, AF’s Hispanic fourth and 10th graders closed the achievement
gap. Across all subjects, AF’s Hispanic students outperformed Connecticut’s Caucasian and
Asian fourth graders by two percentage points, and AF’s Hispanic 10th graders achieved on par
with Connecticut’s Caucasian and Asian 10th graders. Unfortunately, AF’s Hispanic eighth
graders trailed Connecticut’s Caucasian and Asian eighth graders by 20 percentage points across
PR/Award # U282M100002 e21

Achievement First Project Narrative Page 23
all subjects. Given the achievement gap-closing results of their AF peers in fourth and 10th
grades, the size of this gap is outside the norm for AF students in capstone grades. AF takes
underperformance very seriously and will implement the necessary instructional plans and
interventions needed to close the achievement for this cohort.
AF does not report data for student subgroups of less than 10 students. In AF’s capstone
grades in New York—fourth and eighth—the Hispanic student population fell below the
organization’s 10 student threshold for accurate and meaningful data reporting.
iii. Student academic achievement for low-income and minority students
a. Academic achievement for low-income and minority students
1. Academic achievement for low-income students
See page 16 of this Project Narrative for a complete description of AF’s low-income
student academic achievement.
2. Academic achievement for African American students
See page 20 of this Project Narrative for a complete description of AF’s African
American student academic achievement.
3. Academic achievement for Hispanic students
See page 22 of this Project Narrative for a complete description of AF’s Hispanic student
achievement.
III. SELECTION CRITERIA (B)—CONTRIBUTION IN ASSISTING EDS
PR/Award # U282M100002 e22

Achievement First Project Narrative Page 24
(Also fulfills Application Requirement (d)). AF schools specifically target EDS,
including low-income students and educationally underserved racial and ethnic subgroups. AF
recognizes that EDS face unique challenges in their home lives and communities, but believes
that with a great education—high expectations and high levels of support—EDS can achieve at
the same high levels as more privileged students.
AF’s educational program is not based on any one single solution to achieve
breakthrough student achievement. Rather, AF’s approach consists of a set of basic principles
that, when combined and executed well, have demonstrated an ability to enable all students to
succeed at the highest levels. Several critical elements of AF’s core program are: more time on
task, regular use of interim assessments and integration of performance data in planning,
recruitment and development of talented teachers and leaders, intensive interventions for
struggling students, and a disciplined and joyful school culture. AF has shown that when
executed well, these elements generate consistent results for all students and can be replicated
across multiple schools and systematized for the benefit of a network—or district—of schools.
i. Project elements designed to assist EDS in meeting or exceeding State academic
content standards
AF strongly contributes to assisting EDS through its comprehensive educational program
and high standards for student academic achievement. As a result, AF’s EDS demonstrate
high levels of academic achievement on state assessments, as detailed above in Selection
Criteria A. AF plans to provide all students, particularly EDS, with similar contributions
and support in future schools.
a. School-wide project elements designed to assist EDS
PR/Award # U282M100002 e23

Achievement First Project Narrative Page 25
AF’s school program contains specific elements designed to assist EDS students in
achieving success:
1. Consistent, proven, standards-based curriculum: AF consistently implements proven
curricula based on state content standards throughout its schools to ensure that all
students, particularly EDS, master the essential knowledge and skills and so that progress
in one grade can be seamlessly built on in the next.
2. Interim assessments and strategic use of performance data: Interim, standards-based
assessments are administered to all students every six weeks in the core subject areas to
evaluate individual student mastery of essential content. Teachers and principals review
the interim assessment data together and create data-driven instructional plans that target
whole class, small group and one-on-one instruction to address any gaps in student
learning.
3. More time on task: The AF school day is nearly one and a half hours longer than the
traditional public school day, allowing students to have two reading classes and an
extended math class every day. Tutoring is available during and after school, an average
of one to two hours of homework is assigned per night, and an intensive independent
reading program is prioritized so that students read regularly both at school and at home.
b. Project elements targeting specific subgroups
Project elements targeting support to special education students (also fulfills Application
Requirement (k)): AF has and will continue to comply with all provisions of federal and state
law relating to the Individuals with Disabilities Education Act and works with its host districts to
ensure that all qualified students have access to a Free Appropriate Public Education, are
PR/Award # U282M100002 e24

Achievement First Project Narrative Page 26
accurately evaluated, are provided with an Individualized Education Plan, receive appropriate
education in an open learning environment, are included in the development of and decisions
regarding their Individualized Education Plan, and have access to procedures and mechanisms to
resolve disputes or disagreements related to the school or host district’s provision of a Free
Appropriate Public Education.
All AF schools employ a certified special education coordinator, who is responsible for
providing information to and securing information from the district’s Committee on Special
Education, and oversees the implementation of special education programming and support at
the school level. The responsibility for evaluating children suspected of being disabled, creating
Individualized Education Plans, reevaluating or revising existing plans, and conducting due
process hearings are all the responsibilities of the district’s Committee on Special Education.
Once a determination has been made, AF’s special education coordinator works closely with
school staff, special education instructors and related service providers to ensure that students
with disabilities are served in accordance with the stipulations of their Individualized Education
Plans and in compliance with all federal and state laws and regulations. AF complies with all
data reporting requirements of the Act, as well as mandates regarding the confidentiality of
student records. AF assures that qualified students are not excluded from curricular and
extracurricular activities based on abilities or disabilities. In particular, AF assures that national
origin minority students are not assigned to classes for disabled students solely based on their
lack of English language skills.
AF supplements the Individualized Education Plans with an internal tiering system which
is used to customize the educational program of each applicable student. AF has implemented an
“inclusion” approach for special education students, which is designed to teach students of
PR/Award # U282M100002 e25

Achievement First Project Narrative Page 27
different abilities and needs largely in heterogeneous classroom settings as opposed to separate
teaching groups. In the inclusion approach, special education students receive the same
instruction as their non-special education peers, and are supplemented with additional instruction
as required through targeted interventions, including before-school, after-school and Saturday
tutoring and small group instruction during the school day. AF’s interventions are proven
programs led by trained teachers and staff that are designed to remedy specific student
challenges, including in the areas of phonics, fluency, comprehension, behavior, grammar,
writing and math.
AF takes a pro-active approach to identifying special education students through the
organization’s data-driven practices of monitoring student achievement and progress, and
through input from teachers. If a special education recommendation is necessary, AF follows the
appropriate protocols to identify students as in need of special education accommodations in
conjunction with the host district.
Currently AF’s special education program at each school consists of a teacher, who is
certified in special education, and one to two additional staff as needed. Special education-
focused teachers receive targeted professional development on best practices for working with
students with special education needs and some schools have access to additional state funding to
support special education student instruction. In the 2010-11 school year, AF will enhance its
special education program by further promoting best practices across the network, providing
increased professional development for special education-focused teachers through increased
observations and feedback, and formalizing AF’s guidance on effective intervention practices.
PR/Award # U282M100002 e26

Achievement First Project Narrative Page 28
Project elements targeting English language learners: AF engages the inclusion approach
to target and support English language learners. Similar to AF’s approach to special education
students, regular classroom instruction for English language learners is supplemented by
interventions as required. In addition, AF places differential emphasis on vocabulary instruction,
explicit phonics instruction and whole language immersion for teaching English language
learners.
ii. Project elements to assist EDS in meeting or exceeding State student academic
achievement standards
AF has specific support measures in place to foster academic achievement for EDS:
1. Unwavering focus on breakthrough student achievement: Closing the achievement gap is
at the center of every decision made by AF’s executive team, school leaders and teachers,
and progress toward meeting ambitious goals for student achievement serves as the
organization’s most important benchmark for success and the basis on which every
instructional employee is evaluated.
2. Focus on talent development: AF firmly believes that the most important determinant of
student achievement is teacher effectiveness. AF goes to great lengths to recruit, develop,
recognize and retain a team of talented teachers. All new AF teachers participate in three
weeks of professional development. AF schools release early on Fridays to provide two
additional hours of staff meeting and learning time. Every AF teacher has an instructional
coach who conducts observations at least once every two weeks and has a biweekly
coach meeting to provide individual coaching and support.
PR/Award # U282M100002 e27

Achievement First Project Narrative Page 29
3. Parents as partners: At AF schools, parents, students and teachers all sign a compact that
outlines their shared commitment to hard work and consistent support of one another.
While this compact is not legally binding, it is an important symbolic commitment and
plays an integral role in strengthening the relationship between parents and the school.
iii. Project elements to assist EDS in graduating college- and career-ready
The message at AF schools is that all students are going to college, including the
dominant EDS population. Beginning in kindergarten, all AF students are continuously exposed
to college, and grades are identified not by their year of high school graduation but rather by the
year that they are expected to graduate from college. All AF classrooms are named after
universities, students make at least annual field trips to college campuses, regularly hear speakers
talk about college, write research papers on colleges, and, most important, master a college-
preparatory curriculum. In addition, all AF high school students take at least two Advanced
Placement courses, and in 2009-10, AF’s Amistad-Elm City High School in New Haven,
Connecticut, partnered with the University of Connecticut to provide students with access to
select University of Connecticut courses beyond the already rigorous Advanced Placement
offerings.
IV. SELECTION CRITERIA (C) – PROJECT DESIGN
i. Goals, objectives and outcomes for the project
AF is a results-oriented organization, and places strong emphasis on the importance of clearly
identified goals, objectives and outcomes. The goals of this project are closely correlated to the
first two core strategies of the organization: (1) delivering an achievement gap-closing education
to all students and (2) growing to the scale of a traditional urban public school district.
PR/Award # U282M100002 e28

Achievement First Project Narrative Page 30
Furthermore, the goals, objectives and outcomes of this project will allow AF to share its
processes and strategies with local educational agencies to improve educational achievement
outcomes for all students in its host districts. The objectives and outcomes are aligned to measure
and track AF’s progress towards achieving the project’s goals.
a. Goals, objectives and outcomes for the project
1. Goals
AF’s five-year replication and expansion project has two goals:
1. To provide 5,500 additional students, primarily EDS, in Connecticut, New York and Rhode
Island with an achievement gap-closing education and the strength of character they need to
graduate from top colleges, to succeed in a competitive world and to serve as the next generation
of leaders for their communities.
2. To grow AF’s network of schools into the equivalent of a high-performing, urban public
school “district,” proving that the achievement gap can be closed at district scale.
2. Objectives
The project’s five objectives are clearly defined to describe the specific accomplishments AF
will achieve through implementation of the project. The replication and expansion objectives are:
Objective 1: Grow to operate 31 schools serving at least 10,000 students by 2015
Objective 2: Provide an achievement gap-closing academic education to enrolled students
Objective 3: Provide support to students so that they complete high school and college
Objective 4: Foster an educational environment that is very attractive to students and teachers
PR/Award # U282M100002 e29
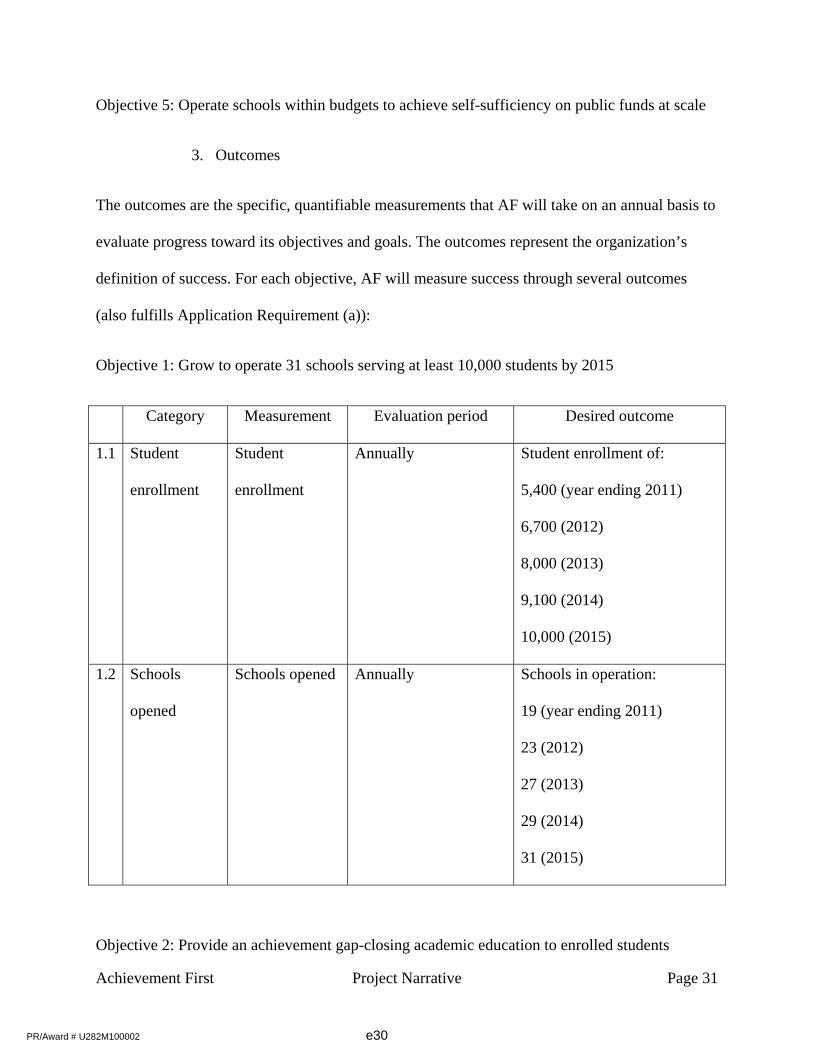
Achievement First Project Narrative Page 31
Objective 5: Operate schools within budgets to achieve self-sufficiency on public funds at scale
3. Outcomes
The outcomes are the specific, quantifiable measurements that AF will take on an annual basis to
evaluate progress toward its objectives and goals. The outcomes represent the organization’s
definition of success. For each objective, AF will measure success through several outcomes
(also fulfills Application Requirement (a)):
Objective 1: Grow to operate 31 schools serving at least 10,000 students by 2015
Category Measurement Evaluation period Desired outcome
1.1 Student
enrollment
Student
enrollment
Annually Student enrollment of:
5,400 (year ending 2011)
6,700 (2012)
8,000 (2013)
9,100 (2014)
10,000 (2015)
1.2 Schools
opened
Schools opened Annually Schools in operation:
19 (year ending 2011)
23 (2012)
27 (2013)
29 (2014)
31 (2015)
Objective 2: Provide an achievement gap-closing academic education to enrolled students
PR/Award # U282M100002 e30

Achievement First Project Narrative Page 32
Category Measurement Evaluation period Desired outcome
2.1 Student
achievement
State test scores Annually By final year of testing at an
AF school (4th, 8th, and 10th
grade), student test scores
exceed host district averages
by 20 percentage points
2.2 Student
achievement
State test scores Annually By final year of testing at an
AF school (4th, 8th and 10th
grade) , student test scores
meet or exceed State averages
2.3 Student
achievement
State test scores Annually By final year of testing at an
AF school (4th, 8th, and 10th
grade), African-American,
Hispanic and low-income
subgroup achievement gaps
are closed relative to state
averages for Caucasian/Asian
and full-price lunch groups
Objective 3: Provide support to students so that they complete high school and college
Category Measurement Evaluation period Desired outcome
3.1 High school High school Annually High school graduation rate of
PR/Award # U282M100002 e31

Achievement First Project Narrative Page 33
graduation graduation rate 90 percent in five years
3.2 College
acceptance
College
acceptance rate
Annually College acceptance rate of 100
percent to a two- or four-year
college
3.3 College
matriculation
College
matriculation
rate
Annually College matriculation rate of
95 percent to a two- or four-
year college
3.4 College
completion
College
completion rate
Annually (beginning in
2014)
College persistence rate of 75
percent at a two- or four-year
college
Objective 4: Foster an educational environment that is very attractive to students and teachers
Category Measurement Evaluation period Desired outcome
4.1 Student
attendance
Student
attendance rate
Annually Student attendance rate meets
or exceeds 96 percent
4.2 Student
retention
Student
retention rate
Annually Student retention rate meets or
exceeds 95 percent
4.3 Teacher offer
acceptance
Teacher offer
acceptance rate
Annually Teacher offer acceptance rate
meets or exceeds 80 percent
4.4 Teacher and
principal
retention
Teacher and
principal
retention
Annually Retention of teachers and
principals given an offer to
return meets or exceeds 85
PR/Award # U282M100002 e32
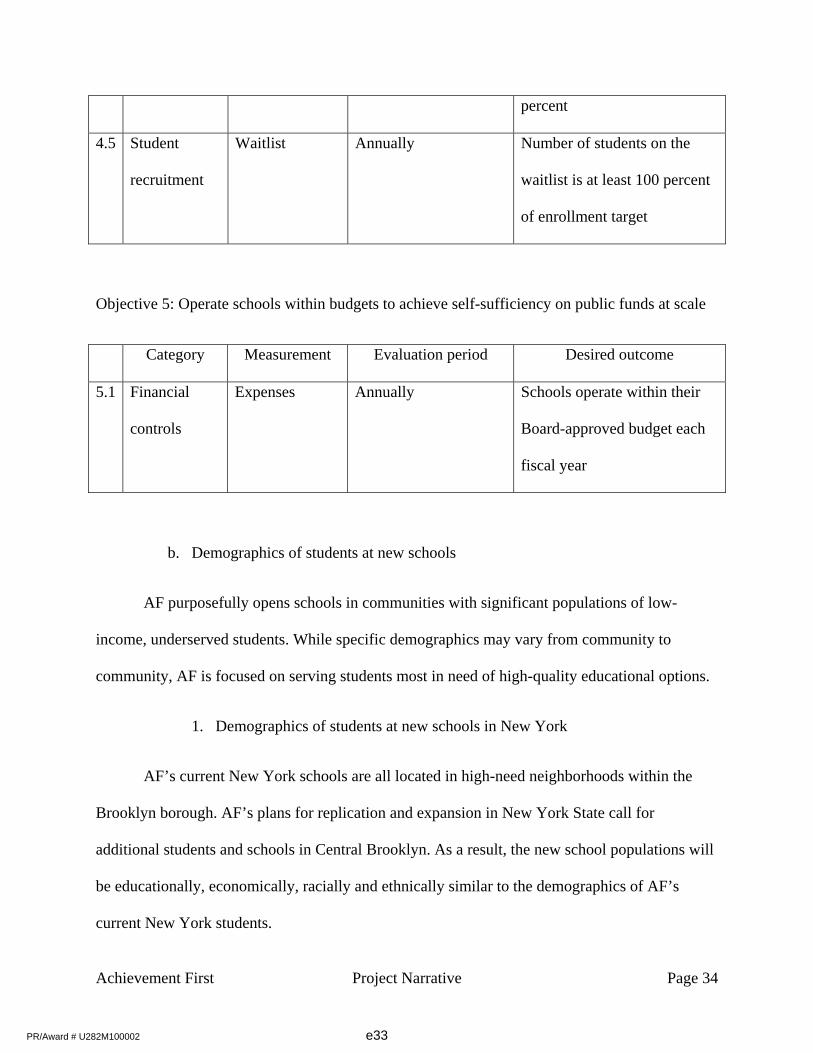
Achievement First Project Narrative Page 34
percent
4.5 Student
recruitment
Waitlist Annually Number of students on the
waitlist is at least 100 percent
of enrollment target
Objective 5: Operate schools within budgets to achieve self-sufficiency on public funds at scale
Category Measurement Evaluation period Desired outcome
5.1 Financial
controls
Expenses Annually Schools operate within their
Board-approved budget each
fiscal year
b. Demographics of students at new schools
AF purposefully opens schools in communities with significant populations of low-
income, underserved students. While specific demographics may vary from community to
community, AF is focused on serving students most in need of high-quality educational options.
1. Demographics of students at new schools in New York
AF’s current New York schools are all located in high-need neighborhoods within the
Brooklyn borough. AF’s plans for replication and expansion in New York State call for
additional students and schools in Central Brooklyn. As a result, the new school populations will
be educationally, economically, racially and ethnically similar to the demographics of AF’s
current New York students.
PR/Award # U282M100002 e33

Achievement First Project Narrative Page 35
2. Demographics of students at new schools in Rhode Island
AF’s growth plan includes expanding to a new geography: Rhode Island. AF plans to
open five new schools drawing students from the cities of Providence and Cranston, Rhode
Island. According to state academic and demographic data, the student populations in the
Providence/Cranston region of Rhode Island are similar to the student populations AF already
serves in Connecticut and New York.
Providence and Cranston have a significant achievement gap between African American
and Hispanic students and Caucasian students. In Providence, African American and Hispanic
fourth-grade students achieved 17 to 23 percent below Caucasian students in reading and math
proficiency on the state test—the New England Common Assessments Program. In Cranston, a
similar pattern emerges, with a 16 to 24 percentage point difference between achievement of
African American and Hispanic fourth graders and Caucasian fourth graders in reading and
math. Given AF’s experience with educationally disadvantaged students, the organization is
prepared to overcome the challenges of students at its new schools in Rhode Island.
Income levels are another metric that AF used to target Providence/Cranston for
replication of its schools. Eighty-five percent of students in Providence are economically
disadvantaged, and AF is targeting neighborhoods in Cranston with similar concentrations of
low-income students. Low-income students in Providence and Cranston significantly lag their
more affluent peers in student academic performance. On the New England Common
Assessment Program, low-income fourth graders in Providence scored 12 to 20 percentage
points behind their non-poor peers. In Cranston, on the same test, low-income fourth graders
scored 20 to 23 percentage points behind their non-poor peers. Both Providence and Cranston’s
PR/Award # U282M100002 e34

Achievement First Project Narrative Page 36
income-based performance disparity is similar to that faced by AF students in Connecticut and
New York.
The Providence student population is approximately 62 percent Hispanic and 22 percent
African American. AF is targeting neighborhoods in Cranston with similar demographics and is
confident that given its experience working with these subgroups in Connecticut and New York,
organizational best practices and knowledge can be applied faithfully and successfully in Rhode
Island.
ii. Implementation and evaluation plans
AF will evaluate the project’s success annually based on the organization’s results
compared to the outcome measurements identified above. Given AF’s focus on academic
achievement, state testing results will carry significant weight in this evaluation.
AF actively pursues opportunities to share its activities and strategies with other charter
management organizations and interested federal, state and local educational agencies. As
described on page 55 of this Project Narrative, AF has partnered with New Haven Public Schools
and is developing a program to train future school leaders for New Haven Public Schools. In
addition, AF developed and continues to maintain three types of tools to inform its replication
activities and strategies.
1. Five-year budget projection: The five-year budget projection contains detailed growth
projections and assumptions for the AF network, schools, students, staff and facilities.
As the schools are opened and expanded, the executive team—composed of the Co-
Chief Executive Officers, the Chief Financial Officer, the Chief Operating Officer
PR/Award # U282M100002 e35

Achievement First Project Narrative Page 37
and the Chief Information Officer—evaluates progress against the budget projections
and takes action to resolve any deviations from the projections.
2. “First Class Plans”: First Class Plans are annual strategic plans developed by each
team at Network Support in the beginning of the fiscal year. In the First Class Plans,
each team’s detailed goals are established, owners are assigned and quantifiable
targets are set to measure progress throughout the year. The executive team reviews
the First Class Plans quarterly, and if project activities are not meeting their targets or
those targets are not sufficient to meet goals, then tactics are reevaluated and
adjustments are made to the plan to meet the goals. It is through this continual
improvement process that AF refines and codifies the best practices for school and
network growth.
3. “Readiness Plan”: In the five months that precede opening a new AF school, the
start-up activities are identified and tracked by the school operations team in the
Readiness Plan, which contains 30 key categories of activities to complete before
opening a new school or an existing school for a new year. The plan includes all areas
of school start-up: facilities, student food and transportation services, supplies and
procurement, technology and office equipment, daily student schedules, testing plans,
new hire logistics, student and parent communication plans, budgeting, school safety,
and compliance. The Readiness Plan documents include a high-level calendar of
monthly meetings and activities, a week-by-week project plan, and a worksheet with
tasks, key constituents and descriptions of the final products. Each spring, the
operations team conducts a school readiness planning session in which the lessons
learned from previous years are shared and best practices are developed and
PR/Award # U282M100002 e36

Achievement First Project Narrative Page 38
disseminated. Through this process, the Readiness Plan is tested and improved each
year, and a common set of documents are developed for each new and existing
school. If activities and strategies are implemented and are determined to be
ineffective or insufficient, those activities and strategies are adjusted or replaced for
the next school year.
V. SELECTION CRITERIA (D) – MANAGEMENT PLAN
i. Management Plan
The executive team at AF oversees the implementation and evaluation of the
organization’s growth plans and determines the most effective way to allocate limited resources
across AF’s existing schools and the network’s growth plans. The executive team managed AF’s
growth from one to 17 schools and will continue to lead the implementation of the project and
monitor the project’s results. See Project Narrative—Section 4—Other Attachments: Schools
Operated by Applicant for a complete list of schools currently operated by AF, and Budget
Narrative for AF’s expansion and replication plans by school.
a. Project timing and budget
The replication and expansion project will begin once the award is made and funding is
disbursed in the fall of 2010. Project activities will be implemented throughout the five-year
period using a phased approach. Per AF’s business plan, two to four new schools will open in
August each year. AF schools that are not yet at full scale will add an additional grade level at
the start of each school year until the school reaches its full complement of grade levels.
PR/Award # U282M100002 e37

Achievement First Project Narrative Page 39
See Project Narrative—Section 6—Other Attachments: Supplemental Organizational
Budgets and Financial Information and Budget Narrative for a detailed description of the project
budget. AF’s expansion and replication project budget is $8.3 million over the five-year period,
$6.6 million of which would be funded through this award and $1.7 million funded through
matching contributions. The project budget was developed based on the individual budgets for
each school and Network Support. Each school’s budget is funded primarily by per pupil
operating funds provided by each state and is supplemented by additional federal funding
sources and private philanthropy, particularly in Connecticut where state charter school per pupil
funding is approximately 75 percent of the funding spent by the host districts on their public
schools. Each AF school’s primary expense is personnel—teachers, deans, principal and
operations staff—supplemented by costs for program materials, food service, facilities and
operational expenses. Each school incurs significant program start-up costs in the first few years
of operation, as identified in the budget included in this application.
Network Support has a separate budget from the schools, which is primarily funded by a
10 percent management fee charged to each school for support functions such as: curriculum
development, teacher and school leader recruiting, leadership development, staff professional
development, data analysis, special education support, facilities acquisition and management,
finance and budgeting, technology, human capital, operations, facilities, marketing, fundraising,
and external relations. Network Support expenses are primarily personnel and supplemented by
program materials. For the purposes of this application, new teacher professional development is
included in the project budget.
b. Project responsibilities
PR/Award # U282M100002 e38

Achievement First Project Narrative Page 40
1. Project-wide responsibilities
For the duration of the five-year project, the primary responsibility for replicating and
expanding the AF network resides with AF’s executive team. The executive team manages the
five-year timeline and the plan for opening new schools.
2. School replication responsibilities
Responsibility for opening each new school is owned by the executive team and executed
through a joint effort coordinated among several teams within AF Network Support and the
independent board of directors for the school.
School Board: The school’s board of directors is an assembly of community activists,
business leaders, educators, financial and legal experts, government officials, philanthropists,
and parent and teacher representatives. The board makes key decisions regarding the opening of
a new school, such as: hiring the principal, approving purchase or lease of facilities and
approving key school policies. The principal, once approved by the school board of directors, is
involved in all subsequent planning, including facility development, teacher and staff
recruitment, and program development.
Executive team: AF’s executive team is critically involved in opening a new school at
least one year before the school is set to open. The executive team supports assembly of a new
school board, advises the board on the location and facilities for the school, and is empowered by
the board to set the timeline of activities that are required for the school to open. The executive
team oversees other AF Network Support teams as they complete the necessary activities to open
the school.
PR/Award # U282M100002 e39

Achievement First Project Narrative Page 41
Leadership development team: The leadership development team oversees support and
development of teachers and deans that wish to become future school leaders. AF will not open a
new school until a talented leader has been chosen as principal, and approved by the board. As a
result, the leadership development team plays a crucial role in AF’s replication by developing a
strong pipeline of principal candidates prior to the decision to open a new school. The leadership
development team also manages the coaching program and cohort-based learning programs, such
as the Leadership Fellows Program and Principal-In-Residence Program, discussed on page 50
of this Project Narrative.
Operations team: The operations team plays a lead role in managing the on-site activities
required to open a new school. The Network Support operations team recruits and recommends a
Director of School Operations, who is hired by the principal to procure all the necessary supplies
and materials, arrange for student food and transportation services, support student recruitment
and enrollment efforts, and manage the school budget.
External relations team: The external relations team is responsible for two priorities as
AF prepares to open a new school. First, if the school is under new charter, the team supports
assembly of the independent school board of directors by reaching out to the community, hosting
visits to existing AF schools and sharing with visitors AF’s mission, program and results. The
external relations team also supports the school board of directors by writing the school’s charter
application and charter by-laws and managing the school’s relationship with its authorizer.
Second, the external relations team runs the student recruitment activities for the schools. See
page 50 of this Project Narrative for further details on the student recruitment process.
PR/Award # U282M100002 e40

Achievement First Project Narrative Page 42
Facilities team: The facilities team is involved early in the process of opening a new
school. The facilities team reviews potential school sites and manages the acquisition or leasing
process, including working with lawyers and contractors. Once a site has been purchased or
leased, the facilities team manages maintenance, procurement of furniture and other start-up
facility materials.
Recruiting team: The recruiting team is responsible for hiring necessary instructional
staff when a new school opens and as existing schools grow to scale. For the first four years of a
school’s operation, this translates to approximately 10 new teachers every year. The recruitment
process begins the fall before a school is scheduled to open with marketing campaigns targeted at
current and potential teachers. In the spring, the recruiting team shifts its focus to screening,
interviewing and making offers to teacher candidates.
Other teams: The data team, finance team, human capital team, marketing team,
organizational development team, teaching and learning team, special services team, and school
support team all play supporting roles, as necessary, in preparing a new school to open.
3. School expansion responsibilities
Once an AF school has opened, the expansion responsibilities fall primarily with the
school’s principal and Director of School Operations, with ongoing support and oversight from
AF Network Support, especially the Assistant Superintendent who is assigned to coach and
support the principal. The principal is responsible for managing the increased student enrollment
needs as a school adds grade levels and hires additional teachers and school support staff. The
Director of School Operations, who reports directly to the principal and collaborates with the
Regional Director of Operations, is responsible for overseeing the logistical requirements of
PR/Award # U282M100002 e41

Achievement First Project Narrative Page 43
adding a new grade level at a school, including preparing additional facility space, overseeing
student enrollment, managing the updated budget, and procuring additional furniture, equipment
and classroom supplies.
c. Timelines and Milestones
AF plans to replicate and expand its network over a five-year project timeline. As stated
above, each year two to four new schools will open. AF has set annual milestones for the number
of schools it plans to operate and the total number of students it plans to serve. See page 31 of
this Project Narrative for the annual targets.
ii. Business plan
AF’s business plan is designed to support realization of the organization’s three core
strategies: serving students by operating high-performing charter schools, growing its network of
schools to district-size, and inspiring and informing reforms within the broader education
community. The current business plan calls for growing AF’s network to 34 separate schools
serving approximately 12,000 students by 2017. The majority of this growth will occur in New
York and Rhode Island because those local educational agencies are providing AF with the
operational and facilities support it needs. AF will continue to grow to nine schools in
Connecticut and increase enrollment until each of those schools is at a full grade-level
complement of students. AF will not grow beyond nine schools in Connecticut until the state
solves the current gap in funding between charter schools and traditional public schools.
AF will continue to pursue its growth plan after the funding period, with the same staff
and tools in use during the grant timeline. The functional teams will grow as responsibilities
PR/Award # U282M100002 e42

Achievement First Project Narrative Page 44
increase with the growth of the network, although AF will enjoy significant economies of scale
in most functions, thereby reducing its per student network support costs
Team Responsibilities
Facilities - Manage growing portfolio of properties
- Pursue appropriate sites for new AF schools based on input
from the School Board and principal
Finance - Maintain the five-year financial plan and work closely with the
schools to develop and manage their budgets
Teaching and Learning - Pro-actively improve on the curriculum and revise the scope
and sequence and interim assessments to improve student
academic achievement
- Assist in the capture of best practices across the AF network,
including lessons, units, video, and other tools and exemplars
- Invest in the development of school-site instructional leaders
- Provide professional development to teaching staff, including
new teacher training
External Relations - Assist schools in managing board relations
- Raise funds to supplement philanthropy gaps
- Recruit students for new schools and new grade-levels
Human Capital - Manage new staff on-boarding process and human resources
activities
Information Technologies - Ensure that secure, reliable technology is available at all schools
PR/Award # U282M100002 e43

Achievement First Project Narrative Page 45
and Network Support offices
Leadership Development - Identify and invest in promising teachers and deans to become
future leaders of AF schools
Operations - Recruit and support on-site Directors of School Operations
Recruit - Externally recruit talented teachers for all AF schools
School Support - Promote great teaching, school culture and student achievement at the
schools
- Provide intensive principal coaching, support, and evaluation
Special Services - Develop programs for students with disabilities and English
language learners
Data - Improve on AF’s data practices and systems to ensure both data
integrity and the robust use of data of all sorts to continuously
inform and improve core practices
Marketing - Design and produce inspiring materials for public relations,
student recruitment and teacher recruitment
iii. Multi-year financial and operating model
a. Financial and operational model
1. Financial model
AF’s financial model has been built and refined over several years to create an accurate,
detailed picture of AF’s current and future financial health. The financial model contains detailed
projections of the costs to operate each existing and new school, plus the operations of Network
PR/Award # U282M100002 e44

Achievement First Project Narrative Page 46
Support. Key assumptions have been made about the cost of providing instructional materials,
recruitment, facilities, curriculum development, external relations, staff professional
development, operations, marketing and information technologies to the schools.
The funding received through this grant program will be used in conjunction with
matching funds for start-up needs at each of the new or expanding schools, including: furniture
and fixtures, staff computers, student computers, other information technology equipment,
textbooks, instructional supplies, music supplies, orchestra supplies, classroom supplies, signage
and professional development (also fulfills Application Requirement (i)). AF has identified all
other sources of federal funding, including Charter Schools Program funding through New York
and Connecticut state, and ensured that funding received through this program will not overlap
with other funding received. AF has also submitted two applications in partnership with other
organizations for the federal Investing in Innovation funds. These grant applications are designed
to support one-time investments in specific projects to further strengthen AF’s capacity to grow,
increase levels of student achievement, and share effective practice with other charter
organizations and public education systems. If AF wins multiple competitive grant awards, the
organization will ensure that it conforms will all federal award statutes and does not receive
funding twice for any activities or materials.
Included in this application, AF has letters of support from New Profit, a national venture
capital fund, The Peter and Carmen Lucia Buck Foundation, and individual philanthropist Jon
Sackler. Though the generosity of these philanthropists, AF has secured matching funds in the
amount of $2 million. See Project Narrative—Section 2—Other Attachments: Letters of Support
for letters of support from New Profit, The Peter and Carmen Lucia Buck Foundation, and Jon
Sackler.
PR/Award # U282M100002 e45

Achievement First Project Narrative Page 47
Plan to provide for continued operation of schools after funding (also fulfills Application
Requirement (f)): AF has a strong network of supporters who contribute expertise, time and
financial support to its schools. In the past, AF has received support from the Gates Foundation,
the Broad Foundation, the Buck Foundation, the Robertson Foundation, the Robin Hood
Foundation, the Walton Family Foundation, NewSchools Venture Fund, the Charter School
Growth Fund, and many other large and small supporters. AF will continue to build its
relationships with foundations and individuals that have the capacity and interest to support its
schools. Through the grant lifecycle, AF will expand its network and procure the additional
funding needed when the grant expires.
At full scale, AF and the schools will run solely on public dollars, with the exception of
the schools in New Haven, Connecticut, which will continue to require modest philanthropic
support because of public funding gaps in that geography. AF, per the management contracts it
enters into with the schools, is committed to and responsible for raising any philanthropic
support to bridge any funding gaps at the school level. AF has a 13-year track record of
successfully bridging gaps at all of its schools.
Controls to ensure school receive allocated funding (also fulfills Application
Requirement (c)): AF maintains a detailed Fiscal Control Structure for Network Support and the
schools. The policies and procedures ensure efficient use of resources and safeguard assets
against unauthorized use or misstatement of account balances. Given the fiduciary relationship
shared between AF and the schools, it is common to have intercompany transfers when one
entity incurs costs or receives payments on behalf of the other. As the applicant, AF would
receive the Charter Schools Program funding allocated for the schools and would transfer this
funding to the school through an intercompany transfer executed on a semi-monthly basis. The
PR/Award # U282M100002 e46
Achievement First Project Narrative Page 48
policies and procedures regarding intercompany transfers would be enforced and reviewed by the
independent auditors to ensure that the schools received all allocated funding.
2. Operating model
AF has a proven history of successfully operating and managing a network of 17 high-
quality elementary, middle and high schools. The key elements of the operating model are:
network structure, relationship between schools and network, relationship between schools and
authorizing public chartering agency, school leadership planning, student recruitment and
parental and community involvement, and partnering with local educational agencies.
Network structure: AF’s model calls for one or more clusters of five schools: two
elementary schools (kindergarten through grade four), feeding two middle schools (grades five
through eight), feeding one high school (grades nine through 12) in each of its host districts.
Schools initially open with either kindergarten and first grade classes or a fifth grade. From this
starting point, each school grows with its students, adding one grade per year until it offers a full
grade complement. AF opens high schools when an AF middle school is prepared to graduate an
eighth-grade class. These students become the founding ninth graders at an AF high school.
Relationship between schools and network (also fulfills Application Requirement (b)):
AF schools currently enter into a voluntary fiduciary relationship and management contract with
AF Network Support for central office activities such as: finance and budgeting, recruitment,
curriculum, technology, human resources, operations, facilities, marketing, fundraising, and
external relations. As new schools are added to the network, they will establish and maintain a
similar relationship with AF Network Support. In exchange for services provided, schools pay
Network Support an annual service fee of 10 percent on the revenues received by the school.
PR/Award # U282M100002 e47

Achievement First Project Narrative Page 49
Relationship between schools and authorized public chartering agencies (also fulfills
Application Requirement (e)): The chartering entity for AF’s New York schools is the State
University of New York Charter Schools Institute and for AF’s Connecticut schools the
chartering entity is State Board of Education. As the chartering entities, the Charter Schools
Institute and State Board of Education have played and will play a critical role in the
development and evaluation of AF’s charter applications. Prior to authorizing an AF charter, the
relevant entity conducts a thorough evaluation of the proposed educational program, as well as
an assessment of the school’s governance and management structure. In addition, a site visit is
conducted to ensure compliance of operations and facilities. The relevant entity works with the
school’s board of directors to ensure that the board and the school leadership understand and are
prepared to meet the accountability requirements of the chartering authority. After issuing AF a
charter, the relevant entity continues to figure prominently in the development and
implementation of the school, providing technical assistance and oversight in the areas of
accountability, governance, financial operations and regulatory compliance. AF confirms that it
has not experienced any significant issues in the areas of student safety, financial management,
or statutory or regulatory compliance (also fulfills Application Requirement (l)). The only
compliance issue that AF is working with its authorizers to resolve, which is not renewal-
threatening, involves teacher certification and delays in getting its teachers the appropriate
paperwork. The authorizers have noted AF’s progress in this area and agreed to renew all its
charters despite this challenge. In addition, AF does not need waivers of Federal, State or local
provisions or rules above those that are already provided to its schools. (Also fulfills Application
Requirement (h)).
PR/Award # U282M100002 e48

Achievement First Project Narrative Page 50
School leadership planning: AF’s replication and expansion plan includes operating new
schools under leadership hired externally or cultivated from the organization’s existing cohort of
deans, grade-level chairs or great teachers who have demonstrated success managing additional
responsibilities. AF runs two leadership development programs to develop leadership skills in
teachers, grade-level chairs, deans and external hires interested in becoming future leaders at AF
schools.
The Leadership Fellows Program is a one-year professional learning program designed
for teachers and grade-level chairs who have a demonstrated interest in developing and
exercising their school leadership skills. In the program, fellows deepen their problem-solving
skills, build on their communication skills, improve their personal efficiency, explore career
pathways and develop a cohort support network. This program creates a critical pipeline of
talented, prepared leaders to take on additional leadership skills at their schools.
The Principal-In-Residence Program is a one-year program for deans and external leaders
who have been selected to become principals at new AF schools. During the Principal-In-
Residence Program, participants visit successful charter schools, immerse themselves in the AF
model, and practice and get feedback on all of the leadership skills necessary to prepare for the
roles and responsibilities of a founding principal. This program is crucial to preparing AF’s
future principals for the new school year and ensuring that they have the skills and tools
necessary to be successful.
Student recruitment and parental and community involvement (also fulfills Application
Requirements (g) and (j)): Within the underserved communities in which AF schools operate, AF
engages in active student recruitment to ensure that the beneficiaries of the organization’s top-
PR/Award # U282M100002 e49

Achievement First Project Narrative Page 51
quality educational program are those students with the greatest need—primarily EDS and
subgroups historically impacted by the achievement gap. AF works to establish community
partnerships with organizations aligned with AF’s mission and work. In the past, AF has
established partnerships with organizations that serve high-need populations, including Head
Start programs, churches, Boys and Girls Clubs, daycare centers, public libraries and after-school
programs to promote its schools to prospective students and families. AF actively recruits
students through targeted, bilingual—English and Spanish—print and radio advertisements,
brochures, mailings, and information sessions.
All AF students are enrolled through a 100 percent blind lottery, and there are no
admission or tuition fees. In order to enter the lottery, students must reside in AF’s host districts.
Since AF strategically locates its schools in high-need districts, this enrollment restriction has
been largely effective in ensuring that AF serves historically disadvantaged students. AF students
are 99 percent African American or Hispanic and 72 percent are low-income.
Despite targeted outreach to high-need students in low-income neighborhoods, the
percentage of low-income students at some of AF’s schools has dropped below the
organization’s desired 70 percent threshold. AF’s growing reputation for outstanding academic
performance is attracting many parents from all income levels. While AF appreciates the right of
all students to a high-quality education, the organization believes that more affluent students
have other paths to a high-quality education. By targeting students without economic access to
high-quality educational opportunities, AF has the greatest impact.
In response to changing demographics, AF revised its student admission policy in New
York, through the approval of the school boards of directors and the state chartering authority, to
PR/Award # U282M100002 e50

Achievement First Project Narrative Page 52
grant admissions preference for “students at-risk of academic failure.” Students at-risk of
academic failure are defined as students who: (1) qualify for the federal free or reduced price
lunch program; (2) meet requirements for the supplemental nutrition assistance program; or (3)
meet requirements for the temporary assistance for needy families program. These at-risk
students are offered admission or placed on the waiting list at an AF school before all other
applicants. If there are more at-risk student applicants than seats available, a random lottery
determines which students are offered admission and which are placed on the waiting list. After
all at-risk student applicants have been offered admission or placed on the waiting list, all other
applicants are entered into an enrollment lottery.
While an explicit lottery preference for “at risk students” is not legal in Connecticut, AF
has taken several measures in Connecticut to attract high-needs students. In Bridgeport, rather
than serve the entire City, AF established a more limited “catchment area,” which restricts
student recruitment and enrollment to the city’s East Side, East End and West Side/End
neighborhoods. All three neighborhoods reflect AF’s target, high-need population. The East
Side, East End and West Side/End have high concentrations of African American and Hispanic
residents—91, 91 and 75 percent, respectively. In addition, these neighborhoods represent a high
concentration of low-income families. For example, in Bridgeport’s East Side neighborhood, 40
percent of households do not have access to an automobile, and in the West Side/End
neighborhood, the unemployment rate is 14 percent and 27 percent of residents live below the
poverty level. By restricting student enrollment to these three neighborhoods, AF improves its
ability to serve Bridgeport’s highest need students.
AF considers parents to be partners in the organization’s mission to bring about
breakthrough student achievement. At AF schools, parents, students and teachers all sign a
PR/Award # U282M100002 e51

Achievement First Project Narrative Page 53
compact that outlines their shared commitment to hard work and consistent support of one
another. While this compact is not legally binding, it is an important symbolic commitment and
plays an integral role in strengthening the relationship between parents and the school.
The community plays an important role in the development of a new charter school.
Diversity is a key strength of the school board of directors, with community members, activists,
teachers and parents all playing a role on the board. The board is then involved in key decisions
including the planning, program design, selection of the school leader, and approval of the
school budget.
GEPA Section 427: In accordance with the provisions of GEPA Section 427, AF has
taken many important steps to ensure equitable access to, and participation in, its program by
students, teachers and other program beneficiaries from historically disadvantaged backgrounds.
The mission of AF is to serve and close the achievement gap for socio-economically
disadvantaged minorities, and AF has purposefully chartered its schools in some of the most
underserved communities in Connecticut and Brooklyn, New York. Moreover, AF’s teacher
recruitment efforts seek to ensure that its instructional teams are as reflective as possible of the
communities and students its schools serve. AF aggressively recruits at and hires teachers from
the nation’s historically black colleges and universities, and is proactive about creating teacher
recruitment marketing materials that mirror the diversity it aims to build in its staff. AF prides
itself on being equal opportunity employers.
Partnership with Providence and Cranston, Rhode Island: In Rhode Island, the Rhode
Island Department of Education, strongly encouraged and supported the Rhode Island Mayoral
Academies, pursued a partnership with AF to open a cluster of five schools in the
PR/Award # U282M100002 e52

Achievement First Project Narrative Page 54
Providence/Cranston region. The Rhode Island Mayoral Academies were created by state law to
enable charters to serve students from multiple local educational agencies, providing increased
options for students trapped in failing schools. The law increases the ease of bringing charter
management organizations like AF to the state. The Mayoral Academies and AF worked together
to identify the Providence/Cranston region as the location of AF’s schools where, within two
miles of each other, there are three Providence schools targeted for “turnaround” and two of
Cranston’s poorest and lowest performing schools. Within this two mile square section of the
Providence/Cranston border, over 2,500 students are in need of better public school options. By
locating AF near these struggling schools, AF provides a critical choice for students attending
these low-performing schools.
In this joint partnership, the Mayoral Academies have committed to providing AF with
the facilities, legal advice, outreach support, relationships and the mayoral support to facilitate
AF’s expansion into the state. AF has committed to providing the operations and financial
oversight, principal and teacher training, and program development required to prepare the
schools for opening. See Project Narrative—Section 2—Other Attachments: Letters of Support
for a letter of support from the Rhode Island Mayoral Academies.
Partnership with New York City, New York: The Chancellor of the New York City
Department of Education has long been a strong supporter of AF, and invited AF several years
ago to open schools in Brooklyn as a part of his overall plan to create a system of great schools
in New York City. In the Chancellor’s words, “I knew about the work Achievement First was
doing up in New Haven, and it was really path-breaking work. So, I wanted that model to be
available as part of our school reform effort in New York City.”iv Over the last few years, the
Chancellor has been closing significantly underperforming schools while simultaneously
PR/Award # U282M100002 e53

Achievement First Project Narrative Page 55
increasing the number of high-performing charter schools, with particular focus on opening
schools in those same lowest-performing districts and often in the same school buildings. It is in
large part through the Chancellor’s unwavering support of AF that the organization’s growth
plan includes operating 20 schools in Central Brooklyn. See Project Narrative—Section 2—
Other Attachments: Letters of Support for a letter of support from the New York City
Department of Education.
Partnership with New Haven: AF is partnering with New Haven Public Schools to
develop an Aspiring Leaders Program, a groundbreaking new partnership through which AF will
coach and train a select group of future principals each year, readying them for leadership in the
district. The program will prepare outstanding new leaders for some of New Haven’s highest
need schools to become principals or upwardly mobile assistant principals. This partnership is
specifically targeted at helping New Haven turnaround its lowest performing schools through
providing high-quality school leaders able to lead dramatic change in schools. This partnership
represent an extraordinary effort by a district and a charter management organization to work
together to increase student achievement broadly—specifically by training leaders for New
Haven Public Schools in a combined residency split between the two organizations and drawing
heavily on AF’s leadership coursework. See Project Narrative—Section 2—Other Attachments:
Letters of Support for a letter of support from New Haven Public Schools.
iv. Plan for closing underperforming charters
AF holds each of its schools to high student performance and cultural expectations. In the
event that a school is not meeting AF’s high standards of quality, the first course of action is to
invest additional talent, curriculum and professional development resources to improve its
PR/Award # U282M100002 e54

Achievement First Project Narrative Page 56
performance. Specifically, AF would consider: replacing the principal, replacing teachers,
changing aspects of the curricula and increasing the time invested by senior AF leaders. AF
encountered this situation at Elm City College Preparatory Elementary School with students
underperforming according to AF’s high standards and expectations. To address this
disappointment, AF replaced the principal, instituted a new reading program and strengthened
the tutoring/supplemental services program which subsequently raised student scores. Given
AF’s success with improving underperformance, intensive time, leadership changes and
instructional changes would be the organization’s primary approach. In the unlikely and
unfortunate event that intensive time and focus on a school did not improve its results, or if
required by the authorized public chartering agency, AF would close an underperforming school.
v. Key personnel
Executive team: AF Network Support has a highly qualified executive team with diverse,
relevant experiences, exceptional talent and deep experience in the primary functional areas. AF
Network Support’s executive team provides numerous school support services focused on
maintaining quality now and as the network scales. In the event that an AF school is not meeting
academic, culture or other organizational standards, the executive team has the power and
expertise to intervene and take corrective action. For the complete resumes of AF’s executive
team, vice presidents and assistant superintendents, see Project Narrative—Section 1—Other
Attachments: Resumes/Curriculum Vitae.
1. Dacia Toll, Co-Chief Executive Officer and President
Key responsibilities for the project:
- Leads AF’s external relations and talent development efforts
PR/Award # U282M100002 e55

Achievement First Project Narrative Page 57
- Manages AF’s relationships with states and host districts, including facilitating AF’s
growth within existing and in new geographies
Qualifications:
- As co-Chief Executive Officer oversaw growth of AF from one to 17 schools
- Founding director of Amistad Academy
- University of North Carolina graduate, Morehead Scholarship
- Rhodes scholar and Yale Law School graduate
2. Doug McCurry, Co-Chief Executive Officer and Superintendent
Key responsibilities for the project:
- Leads AF’s academic and school culture initiatives and supports existing and new
school leaders in implementing and maintaining a rigorous curriculum, a strong
school culture, and a professional and collaborative adult culture
Qualifications:
- As co-Chief Executive Officer oversaw growth of AF from one to 17 schools
- Founding associate director of Amistad Academy
- University of North Carolina graduate, Morehead Scholarship
3. Max Polaner, Chief Financial Officer and Chief of Staff
Key responsibilities for the project:
- Manages financials relating to start-up, scale and sustainability for all AF schools and
for AF Network Support
PR/Award # U282M100002 e56

Achievement First Project Narrative Page 58
- Leads AF’s organizational development, including monitoring AF’s performance
against organizational priorities
Qualifications:
- Previously Chief Financial Officer of 200-person analytic consulting firm
- Former math, social studies and music teacher
- Harvard Business School graduate
4. Maia Heyck-Merlin, Chief Operations Officer
Key responsibilities for the project:
- Oversees recruitment, development and evaluation of existing and new AF school
leaders, teachers and operational team members, as well as school-based operations
Qualifications:
- Teach for America teacher, executive director and managing director
- Tufts University graduate
5. Harris Ferrell, Chief Information Officer
Key responsibilities for the project:
- Develops, implements and oversees information practices, processes and systems
across AF to ensure that the organization efficiently and effectively communicates,
documents, shares, analyzes, reports, plans and reviews all facets of organizational
performance now and as AF grows to scale
Qualifications:
PR/Award # U282M100002 e57

Achievement First Project Narrative Page 59
- Senior executive in several educational ventures
- Yale and Harvard Business School graduate
VI. APPLICATION REQUIREMENTS
a. Project objectives
See page 31 of this Project Narrative.
b. Past and future school relationship between schools and network
See page 48 of this Project Narrative.
c. Controls to ensure schools receive allocated funding
See page 47 of this Project Narrative.
d. Educational program
See page 24 of this Project Narrative.
e. Relationship between schools and authorized public chartering agency
See page 49 of this Project Narrative.
f. Funding plan after grant has expired
See page 47 of this Project Narrative.
g. Community and parental involvement
See page 50 of this Project Narrative.
h. Federal or State waiver requests if necessary
PR/Award # U282M100002 e58

Achievement First Project Narrative Page 60
See page 49 of this Project Narrative.
i. Grant uses in coordination with other Federal grants and matching funds
See page 46 of this Project Narrative.
j. Plan to recruit educationally disadvantaged students
See page 50 of this Project Narrative.
k. Compliance with Individuals with Disabilities Education Act
See page 25 of this Project Narrative.
l. Issues of student safety, financial management and statutory or regulatory
compliance
See page 49 of this Project Narrative.
i According to the National Center for Education Statistics, by the 2014-15 school year, AF will
be larger than 95 percent of all public school districts in the country in 2009.
ii Hastings, Neilson, and Zimmerman, "Magnet and Charter School Achievement: Evidence from
New Haven Public School Lotteries". Unpublished Manuscript, Yale University. 2010
iii Teh, McCullough, and Gill, “Analysis Impact Estimates for Five Schools Affiliated with
Achievement First and Uncommon Schools”. Mathematica Policy Research. 2010
iv Interview with Achievement First, June 2007
PR/Award # U282M100002 e59

Project Narrative
Section 1 - Other Attachments: Resumes/Curriculum Vitae
Attachment 1: Title: Achievement First CSP Grant Application Resumes Pages: 21 Uploaded File: Achievement First CSP Grant Application Resumes 100630.pdf
PR/Award # U282M100002 e88

Achievement First:
Replicating and Expanding High-Achieving Charter Schools in Connecticut, New York
and Rhode Island
Resumes
Name Title Page reference
Dacia M. Toll Co-Chief Executive Officer and President 2
Doug McCurry Co-Chief Executive Officer and Superintendent 4
Max Polaner Chief Financial Officer and Chief of Staff 6
Maia Heyck-Merlin Chief Operations Officer 7
Harris Ferrell Chief Information Officer 9
Jon Schwartz Vice President of School Operations 11
Michael Thomas Vice President of External Relations (CT) 12
Lesley Esters Redwine Vice President of External Relations (NY) 15
Marc Michaelson Assistant Superintendent 16
Elana Karopkin Assistant Superintendent 18
Chi Tschang Assistant Superintendent 21
PR/Award # U282M100002 e0

403 James Street New Haven, CT 06513
(203) 773-3223 [email protected]
Dacia M. Toll
Experience 1999-current New Haven, CT
Founder and Director, Amistad Academy
� Co-chair of Planning Committee that authored charter application and oversaw project implementation.
� Has served for five years as the school’s CEO, leading the school’s administrative team, overseeing daily operations, evaluating staff, supporting curriculum, assessment, discipline, and parent involvement activities and personnel.
1997-1999 (volunteer position while in law school) New Haven, CT
Executive Director, New Haven Cares
� Managed the daily operations and long-term goals of this anti-poverty non-profit organization, including the administration of a redeemable voucher program.
� Responsibilities included managing paid, volunteer, and work study staff, fundraising, community outreach, and developing working partnerships with social service providers, civic groups, and merchants.
� Oversaw the three-fold expansion of the voucher program.
Summer 1998 Washington, DC
Policy Analyst, U.S. Department of Education
Office of the Deputy Secretary
� Analyzed the progress of national standards-based education reform and formulated strategic proposals to improve the actual impact of standards on classroom practice; several proposals were incorporated in the Reauthorization of the Elementary and Secondary Education Act (ESEA).
Summer 1997, 1997-1998 (part-time) New York, NY
Business Associate, McKinsey & Company
� Helped to analyze and revamp the sales, marketing, and customer service operations of a large healthcare company. Led the specific analysis of sales force organization, custom orders, and inventory management.
� Helped develop and further the concept of “Breakthrough” districts in New York City public schools. Led the analysis and recommendations around removal of ineffective principals and served as an assistant trainer during three-day strategic planning session for all District 19 principals.
Summer 1996 Atlanta, GA
Assistant to the Program Director, The Atlanta Project
� Analyzed the lessons learned from the first five years of operation of The Atlanta Project, a comprehensive urban renewal program launched by former President Carter and his corporate partners. Developed a strategic plan for Phase II in consultation with the staff and Governing Board.
Achievement First Leadership Team Resumes Page 2PR/Award # U282M100002 e1

Education 1996-1999 New Haven, CT
Yale Law School
� J.D., June 1999
� Student Director and Student Supervisor, Community Legal Services Clinic
� Worked with New York City Schools’ counsel in drafting guidelines for expanded authority of NYC Chancellor under the 1996 Governance Bill. Investigated legal and political remedies for improving failing schools for the National Urban League
1997-1999 New Haven, CT
Yale Teacher Preparation
� Connecticut Teacher Certification, History/Social Studies (7-12)
1994-1996 Oxford, England
Oxford University
� M.A., 1st Class, Philosophy, Politics, and Economics (PPE), June 1996
� Rhodes Scholarship; Graduate Student President; Oxford Women’s Lacrosse Team
1990-1994 Chapel Hill, NC
University of North Carolina at Chapel Hill
� B.A. with highest honors and highest distinction, Economics and Political Science, May 1994
� Student Body Vice-President; Managing Editor, The Daily Tar Heel; Truman Scholarship for Public Service; Morehead Scholarship
Board
Memberships
New Haven Public Education Fund
WKBJ Partnership Foundation Trustee
Achievement First Leadership Team Resumes Page 3PR/Award # U282M100002 e2

403 James Street New Haven, CT 06513
(203) 773-3223 [email protected]
Douglas S. McCurry
Experience 2003-Present New Haven, CT
Superintendent and Co-CEO, Achievement First
� Founded school reform non-profit based on the Amistad Academy model
� Partnered with the Grow Network in New York to put Amistad curriculum and interim assessment system on a technology platform
� Designed strategic plan for teacher recruitment and hired director of recruitment
� Led development of math cumulative review materials, reading novel units, and a reading comprehension sequence that teaches the core components of comprehension in a step-by-step fashion
� Designed K-4 program based on extensive curricular research and site visits of high-performing schools
� Founded Elm City College Preparatory School, a K-8 charter school opening in the fall of 2004
1999-2003 New Haven, CT
Associate Director, Amistad Academy
� Served as Connecticut certified principal for a high-performing charter school
� Led all school efforts around the school’s academic program, including curriculum development, teacher recruitment, and observation and evaluation
� Led development of a comprehensive interim assessment system in which all students are tested every six weeks to determine areas of strength and weakness
� Taught math, reading, and writing classes to 5th and 7
th graders; 93
percent of 7th grade math students showed mastery (then the highest
category) on the Connecticut Mastery test; 5th grade writing and math
students showed gains of over 30 percentiles on state and national tests
1995-1997 Charlotte, NC
History and English Teacher, Providence Day School
� Redesigned curricula for the following courses: U.S. Government, Economics, International Relations, Writing Workshop
� Coached Varsity tennis, Junior Varsity basketball
� Selected by students as one of two faculty representatives on the schools Honor Council
� Led school’s Model United Nations program; twice took Model UN team to the Hague to compete in the world’s largest Model UN program
1994-1995 Charlotte, NC and Atlanta, GA
Freelance Writer
� Wrote monthly column for the Charlotte Observer on issues such as urban sprawl, school desegregation, the homogenization of American culture, and the social value of teachers
Achievement First Leadership Team Resumes Page 4PR/Award # U282M100002 e3

� Wrote profiles of local athletes for the sports section of the Atlanta
Journal-Constitution
1994-1995 Atlanta, GA
Consultant, Andersen Consulting
� Provided business and technology consulting for Fortune 500 clients
� Coordinated proposal for a multi-million dollar bid, including a demonstration of off-site “on-screen” call center for technology solutions
Education 1998-1999 New York, NY
Teachers College, Columbia University
� M.A., October 1999
� Degree focused on charter schools within the Private School Leadership Program
� Klingenstein Private School Leadership Scholarship, John Dewey Scholar
1990-1994 Chapel Hill, NC
University of North Carolina
� B.A., May 1994, History and Journalism
� Morehead Scholarship, National Merit Scholarship, Phi Beta Kappa
� Honors Thesis on the changing perceptions of race among students in Chapel Hill
Achievement First Leadership Team Resumes Page 5PR/Award # U282M100002 e4

•
•
•
•
•
Achievement First Leadership Team Resumes Page 6PR/Award # U282M100002 e5

MAIA HEYCK-MERLIN Phone: 917.805.1060 10 First Street Email: [email protected] Brooklyn, NY 11231 ______________________________________________________________________________________________________
1
RELEVANT EXPERIENCE Teach For America Managing Director, Shared Operational Services, Teacher Preparation Team Aug. 2005 - present Teach For America is a nonprofit organization that recruits, selects, trains, and supports outstanding recent college graduates to achieve significant academic student gains in under-resourced schools.
• Responsible for the central operations of multi-site teacher training institutes supporting over 2,900 beginning teachers
• Lead a team of eight direct reports responsible for human assets, finance, technology, procurement, data collection/analysis, operational execution, document production/delivery, while serving as a Teacher Preparation Team leader
• Oversee 16 million dollar operating budget, as well as led first time budgeting process, including creation of new cost-savings initiatives, better forecasting methods, and additional tracking tools
• Create and implement new data tracking systems to monitor ongoing progress and refine existing practices, resulting in real-time data to impact teacher effectiveness and communicate across the organization
• Oversee all procurement and streamline request for proposal (RFP) process for existing local and national vendor contracts, resulting in cost savings in multiple areas
• Manage institute staff recruitment and selection operations, technology, and communications for more than 700 applications per year, with 95% of applicants reporting the efficiency and ease of website was good to excellent and 90% reporting good to excellent accuracy and timeliness of responses
• Design and implement all corps member and institute staff policies to reduce risk and liability and ensure consistent application and legal compliance, including the re-design of dismissal procedures
• Oversee all corps member communications from matriculation through institute, including managing the move of materials from hard copy mailings to entirely web-based methods, resulting in cost-savings of $25,000 and increased quality
• Manage all curriculum editing, production, and distribution to 2,900 incoming corps members, resulting in increased accuracy of delivery and cost-savings of $70,000 dollars
Institute Director, Houston Feb. 2003 - Aug. 2005
• Responsible for executing an 800-person teacher training institute with a staff of 120--15 direct reports
• Led team to a 17% increase in corps member perception of preparedness; 87% of staff members self-reported a positive work experience (highest of all three institutes)
• Designed and executed institute staff selection process of more than 300 applicants per year
• Managed two million dollar operating budget, including one million dollar university contract, and secured first multi-year contract in institute history
• Cultivated strategic partnership with Houston Independent School District, including contract negotiation and 11 school relationships
• Built staff cultivation systems to recruit and select high-performing staff members--led to practices used across all three institutes
• Supported full-time team of three to plan and execute efficient logistics at the university host site and school sites, resulting in highest logistics and operational results in institute history
• Planned and executed five summer staff training conferences with a focus on giving effective feedback to new teachers--90% of staff members report feeling prepared for their roles, 84% of corps members agreed feedback was effective
Executive Director, South Louisiana June 2002 - Feb. 2003
• Asked to take over Institute Director position to fill organizational need
• Built and managed board of local leaders, including support of influential business organizations
• Developed a $650,000 local base of financial support, including grants from corporations, foundations, and individuals
• Oversaw programmatic efforts to create professional development options resulting in dramatic increase in program satisfaction
• Increased local awareness of Teach For America's efforts through effective public relations and formation of two additional district partnerships
Achievement First Leadership Team Resumes Page 7PR/Award # U282M100002 e6

MAIA HEYCK-MERLIN Phone: 917.805.1060 10 First Street Email: [email protected] Brooklyn, NY 11231 ______________________________________________________________________________________________________
2
Children’s Charter School Baton Rouge, LA Fifth Grade Instructor Aug. 2001-June 2002 Children’s Charter School is a teacher-run, high-performing charter school serving under-resourced communities in Baton Rouge.
• Chairperson of Discipline Committee that instituted school-wide positive reinforcement plan on campus
• Co-chair of Technology Team that trained staff members on various software incorporation with instruction
• Founder and advisor of Student Leadership Team; participant in weekly study groups The New Teacher Project Baton Rouge, LA Content Seminar Designer Sept. 2001 - Jan. 2002 TNTP is a nonprofit organization that partners with educational entities to increase the number of people who become public school educators.
• Designed innovative content seminars for Practitioner Teacher Program based on nationwide best practices
• Connected curriculum and instructional strategies in a year-long training module series for first year teachers
• Crafted lesson plans for first year teachers that incorporated research-based teaching strategies Teach Baton Rouge Baton Rouge, LA Director of Summer Training Institute Summer 2001 Teach Baton Rouge is a district-run program that recruits, selects, trains, and supports mid-career professionals working in under-resourced schools.
• Planned and oversaw implementation of curriculum for six week intensive summer training for first year teachers
• 87% of participants surveyed felt they were prepared for their first year teaching responsibilities
• Planned staff training for faculty and managed six direct reports--100% of participants were satisfied with faculty
• Managed daily operations, including all written communication and school relationships Delmont Elementary School Baton Rouge, LA Fourth Grade Teacher/Teach For America Corps Member Aug. 1999 - May 2001 Delmont Elementary School is a regular public school in East Baton Rouge Parish and ranks as one of the lowest-performing schools in the district.
• Selected as Teacher of the Year by faculty and staff; instructed MS Office Productivity courses for educators
• Grade level chairperson; co-creator of Saturday school program and curriculum
• 90% student passage rate on English Language Arts portion of Louisiana Educational Assessment
• Member of Technology Team; Curriculum & Instruction Committee; School Improvement Team
EDUCATION Louisiana State University Baton Rouge, LA Enrolled in M.A. in Educational Technology, GPA 4.0 1999 - 2001 Tufts University Medford, MA B.A. in Child Development, GPA, 3.54, Dean’s List, Cum Laude 1995 - 1999
• President of Leonard Carmichael Society, Tufts’ largest student body organization, with over 800 student volunteers
• Presidential Award for Citizenship and Public Service; Wendell Phillips Scholarship Award Finalist; Ex-College Board Member
AWARDS & LEADERSHIP Fulbright Memorial Fund Teacher Program Tokyo, Japan Fellowship October 2000 David . England Teacher-Researcher Award Baton Rouge, LA Grant Recipient 2000 - 01 school year National Writing Project Baton Rouge, LA Participant June 2000
• Peer-selected, Editor-in-chief of anthology, Kaleidoscope
• Teacher-consultant for district-wide writing instruction
Achievement First Leadership Team Resumes Page 8PR/Award # U282M100002 e7

R. HARRIS FERRELL 9301 71st Avenue
Forest Hills, NY 11375 [email protected]
(917) 532-2970
career summary Senior executive in educational ventures with both strategic and operational roles. Demonstrated experience launching and growing new enterprises and in technology product management.
experience
2007 – present 2009 – present
2007 – 2009
ACHIEVEMENT FIRST, INC BROOKLYN, NY Chief Information Officer Oversee the information practices, processes, and systems at AF Central and its network of schools to ensure that Achievement First has the data and information practices supported by the proper enterprise systems to efficiently and effectively communicate, document, share, analyze, report, plan, and review all facets of its best practices and organizational performance. President, AF Athena Launched new division to develop, manage, and sell proprietary technology for formative assessment, data analysis, and instructional planning. Managed development from the prototype of the technology into full production implementation across all
Achievement First schools and grade levels in less than four months Raised over $5.5M in new philanthropic funding to support Achievement First and its Athena initiative Negotiated three-party agreement to fund and outsource the development and commercialization of the
next generation of the Athena technology for the K-12 education market
2005 – 2007 ADVANCEPATH ACADEMICS, INC SAN FRANCISCO, CA / WILLIAMSBURG, VA Co-Founder & Senior Vice President, Program Design & Implementation
Founding team member of private, for-profit venture that partners with school districts to deploy and operate academies that recover, educate, and graduate out-of-school adolescents and students at high risk of not earning their high school diploma.
Secured initial district partnerships and grew organization from concept through implementation of first five academies with expansion into three states, growing revenues from zero to over $4M in annual contract value.
Led academy development from instructional design to fully operational academic program including curriculum development, staff hiring and training, IT management, facilities build-out, student recruitment, district integration, and ongoing support and oversight.
Negotiated and managed relationship with over 15 business partners, vendors, and suppliers. Managed overall performance of academies demonstrating measurable academic improvement of 80-150%
in student performance and graduation rates.
2003 – 2005 NEWSCHOOLS VENTURE FUND SAN FRANCISCO, CA Associate Partner Oversaw a portfolio of ventures and activities related to school-system performance as part of venture philanthropy team that invests in entrepreneurial organizations (for-profit and nonprofit) working to transform public education. Co-led Performance Accelerator Fund designed to invest in entrepreneurial ventures that provide tools and
services to help school districts become performance-driven organizations. Specific market focus on human capital development and data and assessment tools.
Directed research initiative to define, track, and evaluate the adoption of performance-driven practices in leading urban school systems. Produced May 2005 report, “Anatomy of School System Improvement.”
2001 – 2003
SCHOOLNET, INC. NEW YORK, NY Director of Product Management Led product development and marketing for company that delivers data analysis and curriculum management software to public school districts to support data-driven decision making in education. Managed team to design suite of web-based data management and performance applications. Products
named finalists two years in a row for the Codie Awards by the Software and Information Industry Association. Improved product development process to streamline client feedback and market requirements into reliable and timely development cycles.
Doubled sales and expanded client installations into six new states over 18-month period.
Achievement First Leadership Team Resumes Page 9PR/Award # U282M100002 e8
R. Harris Ferrell – resume page 2
2000
Spearheaded research and development of applications to enable districts to report and intelligently analyze Adequate Yearly Progress as mandated in the No Child Left Behind Act (patent-pending).
Summer Associate Developed The Doyle Report, a website and e-mail newsletter for education policy and technology.
Directed the information architecture, design, and programming of website.
1997 – 1999 MITCHELL MADISON GROUP NEW YORK, NY Business Analyst Consulted to Fortune 500 companies and New York arts organizations for global management consulting firm. Specialized in demand management and supplier control, strategic restructuring, and marketing initiatives. Reduced annual real-time market-data expense by $8M (15% of prior level) for a leading investment bank.
Built and populated relational database to match actual data usage against needs profile of traders. Evaluated restructuring effort for New York City arts organization. Analyzed competitive landscape,
assessed organization’s services, and investigated funding sources to recommend programmatic changes. Founded High School Mentoring program between firm and local public high school. Program doubled to
over 60 participants by second year.
1995 – 1997 TEACH FOR AMERICA HOUSTON, TX Corps Member and Sixth Grade Bilingual Teacher Taught 50 sixth graders in disciplines of math, science, and social studies as part of the national teacher corps that annually selects top college graduates to teach in low-income public schools. Awarded Outstanding and Dedicated Teacher for Lantrip Elementary School. First sixth grade class at
school to exceed district averages on state-mandated standardized test – a 75% improvement over previous year.
Appointed by principal to chair Incentive Committee. Developed, proposed, and executed campus-based incentive plan to reward motivated and outstanding staff at Lantrip.
Elected to Shared Decision-Making Committee by faculty to oversee school budget, assess campus improvement proposals, and establish school policy.
Completed graduate course work, while working full-time, to earn bilingual elementary teaching certificate.
education
1999 – 2001 HARVARD BUSINESS SCHOOL BOSTON, MA Master in Business Administration. Awarded First Year Honors (top 15% of class). Education Representative – officer elected by classmates to serve as liaison between faculty and students. Member of HBS Soccer Club – Boston-area graduate school champions.
1991 – 1995 YALE UNIVERSITY NEW HAVEN, CT
Bachelors of Arts degree in Economics. Thesis topic: Economic Analysis of Private, For-Profit Firms that Manage Public Schools. Studied at the Instituto de Estudios Europeos in Madrid, Spain for spring semester junior year. English Director of U.S. Grant Foundation, a teaching program serving New Haven youths. Musical director and stage improvisator in the Purple Crayon of Yale, an improvisational comedy troupe.
personal Fluent in Spanish. Climbed Mt. Kilimanjaro in Africa. Cycled throughout Pacific Northwest. Enjoy cycling,
soccer, and basketball. Play blues and rock piano.
Achievement First Leadership Team Resumes Page 10PR/Award # U282M100002 e9

Jon Schwartz 1110 Ashbury St. [email protected] San Francisco, CA 94117 415-710-3197
Education Yale School of Management New Haven, Connecticut Master of Business Administration (MBA), 2006.
• Concentration in strategy with a focus on nonprofit management. • Distinction grade (top 10% of class) in competitive strategy and managing organizational politics. • Selected as Yale MBA student interviewer by the admissions committee.
Princeton University Princeton, New Jersey Bachelor of Arts in History, Certificate in American Studies, 1999. (GPA: 3.7)
• Three-time national champion and 1999 Gordon G. Sykes award winner for “outstanding team contribution, leadership, and sportsmanship” as coxswain for the Princeton lightweight crew.
Broad Residency in Urban Education • Graduate of the Broad Residency in Urban Education, a national and highly selective (6% admissions rate)
two-year management development program that recruits and trains emerging executives for senior management positions in public education.
Experience
2006-Present Envision Schools San Francisco, California Vice President, Operations & Finance • Lead 16 person team of school site & central office staff responsible for all aspects of school operations &
finance including compliance, enrollment, food services, risk management, budgeting and accounting at Envision Schools (ES), a $15MM nonprofit that develops charter schools located throughout the Bay Area.
• Member of the ES Senior Management Team; work closely with CEO and Board of Directors to define the organization’s overall strategic direction, execute key initiatives and problem solve institutional issues.
• Lead organization’s performance management related initiatives; responsible for designing and implementing monthly, quarterly and annual key performance indicators (KPIs) dashboard.
• Spearheaded ES‘ replication efforts by developing a licensing and fee-for-service model; created and documented standard operating procedures for key aspects of organization’s ongoing operations.
Summer 2005 New Profit Inc. Boston, Massachusetts Summer Consultant, Portfolio Management
• Performed portfolio growth analysis for New Profit, a $15MM venture philanthropy fund affiliated with the Monitor Group; solidified the fund’s value proposition by quantitatively demonstrating impact to investors.
• Authored memorandum analyzing the business plan and portfolio fit of a potential grantee; drove due diligence process by interviewing prominent industry experts; recommendation led to successful funding.
• Authored benchmarking study of leading national non-profits with independent 501c3 affiliate structures; data provided insights critical to informing Monitor’s growth strategy work with a current grantee.
2003-2004 California Charter Schools Association San Francisco, California Director, Services & Products • Repositioned value proposition for vendor memberships resulting in a 650% gain to category sales;
structured deal with third-party vendor to build an e-procurement system for charter schools statewide. • Developed model to generate over $500K annually in revenue-sharing fees for the Association and save
members up to $50MM; performed broad industry analysis to determine optimal deal structure. • Orchestrated strategic alliance with Office Max granting them exclusive access to a $12MM market;
achieved 30% school participation rate in one quarter and reduced member office-supplies costs by 60%. • Collaborated with sponsorship team to double vendor participation and increased exhibitor fees by 100% at
2004 statewide charter schools conference by enhancing customer orientation.
1999-2003 Gap Inc. San Francisco, California Head of Office, Senior Merchandiser
• Managed $85MM in annual volume; promoted on average every 12 months versus company standard of 24 months; fast-tracked to post-MBA position, and consistently ranked in top 10% in annual reviews.
• Led team of 12 people in identifying key fashion trends, analyzing sales to maximize profits, building market specific strategies, preparing seasonal financial plans, and assorting clothing lines.
• Awarded “Do the Right Thing” President’s awards in 2003 and 2001 for driving double-digit sales growth, upholding key company values, and in recognition of community service efforts.
Skills and Interests • Accomplished marathoner, cyclist, triathlete, and fundraiser in cause-related endurance events.
• Bow tie aficionado; featured in national bow tie catalog Beau Ties Limited of Vermont. Achievement First Leadership Team Resumes Page 11
PR/Award # U282M100002 e10

MICHAEL A. THOMAS
1158 West River Street
Milford, Connecticut 06461
(203) 874-4453 (Home) (617) 939-6496 (Cell) [email protected]
PROFILE
Career Overview: Background features a unique combination of leadership positions, academic preparation, military
experience, technological aptitude and entrepreneurial private sector success. Fourteen years of military service, highlighted
by over-seas combat leadership, high level intelligence coordination and policy work. Founded, developed and sold a highly
successful start-up consulting firm which produced best-in-breed homeland security software. Counter-terrorism trainer for
NYPD, US Special Forces and other military and civilian departments and agencies. Yale Law School graduate, with a
passion for international law. Top Secret/SCI clearance with Counter Intelligence Polygraph.
Key Strengths: More than a decade of immersion in counter-terrorism, and related geopolitical and security issues. Strong
understanding of the legal, operational and technological aspects of intelligence and intelligence operations. Strategic
thinker, with a vision of marshalling private sector ingenuity and public sector resources into a seamless, integrated
intelligence strategy.
RELATED EXPERIENCE
Present ACHIEVEMENT FIRST
Vice President, External Relations
First person to hold Vice President, External Relations position after two and one half year search.
♦ Develop and oversee multi-million dollar fundraising effort for Connecticut operations and capital
requirements.
♦ Create an effective and enduring advocacy program at the local, state and federal level to promote
Achievement First equities and positively impact broader education reform agenda.
♦ Develop strategic plans and goals around external relations and lead staff to achieve those goals.
♦ Lead a team of highly talented and motivated professionals across a vast array of mission areas and
geographies.
Present UNITED STATES NAVY RESERVE
♦ Executive Officer of a USNR Unit in Brooklyn, NY
♦ Lead a team of specialized intelligence personnel in support of US Government Homeland Security and
Counter-terrorism efforts
♦ Man, train and equip unit members for deployment in support of Overseas Contingency Operations and
other national security objectives
2008-2009 UNITED STATES NAVY
Director, Navy Reserve HUMINT Program, Chief of Naval Operations, OPNAV N2XR
Hand selected to create a full spectrum, US Navy Reserve Human Intelligence (HUMINT) capability.
♦ Create draft and staff policies, programs, and plans for the manning, training, equipping, deployment and
retention of Navy Reserve HUMINT personnel.
♦ Facilitate interaction and coordination between Active and Reserve Navy components, Naval Criminal
Investigative Service, Naval Special Warfare Command, Defense Intelligence Agency and other Intelligence
Community agencies requiring Navy Reserve support.
♦ Works with officials at Congress, USD(I), Chief of Naval Operations, Director of Naval Intelligence and
other senior intelligence community officials to promulgate USNR HUMINT policy and provide oversight
ensuring compliance with all applicable laws, rules and regulations.
2006-2008 UNITED STATES NAVY
Executive Officer/Senior Intelligence Officer, Provincial Reconstruction Team – Farah, Afghanistan
Deployed in support of Operation Enduring Freedom VIII.
♦ Led and coordinated myriad daily activities of the senior staff of the Provincial Reconstruction Team (PRT),
Farah, Afghanistan. Managed interactions between staff and senior Afghan leadership.
♦ The purposes of these activities included extending the reach of the Afghan government into all areas of their
country, establishing the rule of law, enhancing security, strengthening communications, building roads and
improving healthcare.
Achievement First Leadership Team Resumes Page 12
PR/Award # U282M100002 e11
Michael A. Thomas/Page Two
♦ Directed approximately 250 individuals including active Army and Navy personnel, Reserve Navy, the
Arizona National Guard and a component from the Air Force. Oversaw $6 million in construction projects.
♦ Guest Lecturer at Counter Insurgency Operations Academy, Kabul, Afghanistan.
2003-2005 HARBINGER TECHNOLOGIES GROUP, INC. – Boston, Massachusetts
Founding Partner/Chief Financial Officer – Established, developed and funded this international consulting and
technology firm, formed as the United States government developed a focus on homeland security. Researched
the market. Developed concept and business plan. Recruited partners and investors. Employed rapid application
development to create best-in-class technologies.
♦ Secured initial client relationship with New York Police Department. Organized, produced and delivered a
state-of-the-art counter-terrorism training program. Expanded client relationships to include other major
police departments and U.S. Special Forces in Florida. Prepared and presented advanced training
seminars.
♦ Drove the development of Foxhound software, which utilized phonetics to generate all possible variants of
Arabic names and commonly used watch list terms. This provided agencies with the ability to quickly
process huge amounts of data and identify potential terrorist suspects, solving two of the most challenging
information al issues in the fight against global terrorism.
♦ Among the first twenty companies to be accepted by the Chesapeake Innovation Center (CIC). First
incubator company to have a successful funding event and to graduate from CIC.
♦ Built a staff and consultant workforce of 24 people in three states. Packaged the business and negotiated a
multi-million dollar sale to ICX, Inc., a global interactive investment fund.
2002 PATRIOT VENTURE PARTNERS – Boston, Massachusetts
Consultant – Assisted in the development of a prospectus for a technology-oriented homeland security venture
capital fund. Four month project.
1995-2002 UNITED STATES NAVY
Intelligence Officer – After completing Officer Candidate School in Pensacola, assigned to Intelligence School.
Completed a series of high level assignments in multiple locations around the world.
♦ Worked on threat analysis, targeting and rules of engagement in Kosovo.
♦ Attached to the Theodore Roosevelt Battle Group. Located, targeted, validated and prosecuted Serbian
targets. Assigned as Mobile Targeteer.
♦ As Strike Intelligence Analysis Cell Leader, conducted briefings for admirals and other high level military
officials. Participated in video conferences and events involving Wesley Clark, the Supreme Allied
Commander.
♦ Redeployed to Iraq, supporting missions in Iraqi Southern No Fly Zone. Member of first battle group since
World War II to see active combat in two theaters of operation.
♦ Led a highly sensitive Department of Defense worldwide human intelligence (HUMINT) collection activity in
support of Operation Enduring Freedom.
♦ Managed the coordination of controlled activities between the Department of Defense (DOD), Central
Intelligence Agency (CIA), Federal Bureau of Investigation (FBI) and other intelligence and defense
agencies for a specific activity. The only junior Department of Defense officer to be running a global human
intelligence program, which was the only worldwide intelligence program in which Department of Defense
had the lead over the Central Intelligence Agency.
♦ Provided expert and timely analysis of crisis situations to senior US military and civilian decision makers as
an Intelligence Briefer for the Defense Intelligence Network in Washington, DC. This is the most highly
classified news network in the world, broadcasting from the Pentagon. Presented real time reporting and
analysis of worldwide events – what is known, what is not known, and a synthesis.
Awards
Bronze Star Medal. Defense Meritorious Service Medal.
Joint Service Commendation Medal. Navy Achievement Medal
____________________________________________________________________________________________________
Achievement First Leadership Team Resumes Page 13PR/Award # U282M100002 e12

Michael A. Thomas/Page Three
OTHER PROFESSIONAL EXPERIENCE
2005-2006 AGORA LIVING, INC. – Somerville, Massachusetts
Founder/Chief Executive Officer – Conceived, created, funded and developed this development group to
implement new visions for urban living space based on sustainability concepts.
2003-2004 CLARK FOR PRESIDENT – Little Rock, Arkansas/Columbia, South Carolina
Assistant to General Clark, Arkansas
Director for Veteran Affairs, South Carolina
Recruited among the first paid staffers by General Clark, due to performance and reputation from military career.
2002-2003 MORGAN STANLEY – Boston, Massachusetts
Financial Advisor – Built and serviced a book of high net worth clients, working out of the downtown Boston
office of this highly regarded investment bank.
1990-1991 THE WALT DISNEY STUDIOS – Burbank, California
Business Planner – Performed assigned short-term and strategic financial analyses for this globally respected
entertainment corporation. Prepared projects for short-term film financing.
____________________________________________________________________________________________________
EDUCATION
YALE LAW SCHOOL – New Haven, Connecticut
Juris Doctor, 1995
Legal studies included two semesters at Northwestern University Law School.
Affiliation Member, Yale International Law Journal
WESLEYAN UNIVERSITY – Middletown, Connecticut
Bachelor of Arts, College of Social Studies Major, 1990
Achievement First Leadership Team Resumes Page 14PR/Award # U282M100002 e13

Achievement First Leadership Team Resumes Page 15PR/Award # U282M100002 e14

MARC MICHAELSON 850 Quinnipiac Avenue, #13
New Haven, CT 06513 Cell: (203) 668-4838
E-mail: [email protected]
PROFESSIONAL EXPERIENCE
Assistant Superintendent, Achievement First, New Haven, CT, Jan 2010 – present. • Oversee and support the operations of Achievement First’s 4 Connecticut middle schools and ensure that
all schools achieve dramatic student performance gains.
• Support, coach, train, and supervise principals through observations and feedback, analyzing data, joint problem-solving, and leveraging network resources.
Founder and Principal, Elm City College Preparatory School, New Haven, CT, July 2004 – Dec 2009. � Founded Achievement First’s first public charter school, replicating high performance program of
Amistad Academy. � Directed all school operations including hiring and training of faculty, developing and evaluating
academic programs, and managing operations and budgets. Encore! Program Director / MicroSociety Director / Teacher, Amistad Academy, New Haven, CT, Aug. 2000 – June 2004. � Directed afternoon enrichment program offering 250 students opportunities to develop skills in
sports, academics, visual arts, and performance arts. � Created and managed school-wide MicroSociety program providing students real-life
experiences running their own government, bank, businesses, court and newspaper. � Taught 5th – 8th grade Reading and History classes. Fellow, Institute of Current World Affairs, Addis Ababa, Ethiopia, Apr. 1997 – June 2000 � Researched and wrote articles on peace and conflict, nation-building, political and economic
development, and cultural issues in the Horn of Africa. � Trained relief and development workers to integrate conflict awareness tools into project cycle.
Program Manager and Consultant, Save the Children, The Gambia and Burkina Faso, West Africa. May 1994 – Feb. 1997 � Managed education, natural resource management, economic development and health/family
planning programs sponsored by grants from USAID, UN, and World Bank. � Recruited, trained and supervised more than 40 program and administrative staff. Conservation Engineer, Peace Corps, The Gambia, West Africa, Jan. 1990 - Jun. 1992 Soil and Water Management Unit, Department of Agriculture, Government of The Gambia � Trained 16 counterparts and 4 Volunteers in basic surveying and construction techniques. � Supervised construction of 30 water control structures with the participation of more than 1300
people from 21 villages. � Established cultural exchange between Gambian and American schools.
Achievement First Leadership Team Resumes Page 16PR/Award # U282M100002 e15

EDUCATION National Louis University, M.Ed. in Leadership and Administration, Chicago, IL. 2007 University of Notre Dame, M.A. International Peace Studies, Notre Dame, IN. Aug. 1993 Recipient of John Gilligan Fellowship. Tufts University, B.A. Political Science, cum laude, Medford, MA. May 1989 Certificate in Peace and Justice Studies. London School of Economics and Political Science, London, England. Oct. 1987 - Jun. 1988 Social Policy and Administration Department.
PUBLICATIONS ICWA Letters, Institute of Current World Affairs: Hanover, New Hampshire
“A Final Trip Around the Horn,” June 2000. “Notes on Sudan,” May 2000. “Puntland: Linchpin in Somalia’s Quest for Peace,” March 2000. “Pastoral Days,” February 2000. “Refugees and Ironies,” January 2000. “Afar-Issa Conflict Management,” January 2000. “Front-Line Dispatches,” December 1999. “Deportees: A Year Later,” November 1999. “Ethnic Federalism in Ethiopia: Part 2—Somali Region,” October 1999. “Ethnic Federalism in Ethiopia: Part 1—Transforming a Political Landscape,” September 1999. “Border Economics: ‘Contraband’ Trade in Ethiopia’s Somali Region,” August 1999. “Value-Added Recycling,” June 1999. “Condoms, Konso, and Colobus Monkeys,” May 1999. “Glimpses of a Fellow’s Life,” March 1999. “Peace Fails, War Resumes—Why?,” February 1999. “Assab: Surviving Trying Times in Port,” January 1999. “Recognizing Somaliland,” January 1999. “An Excursion to Asmara (via Djibouti, of course),” December 1998. “The Eritrean-Ethiopian Border Conflict: Part 2—Explanations,” November 1998. “The Eritrean-Ethiopian Border Conflict: Part 1—Events,” October 1998. “Deportations: Personalized Escalation of the Ethiopian-Eritrean Border Conflict,” September 1998. “The Last Year with Mom,” June 1998. “Religious Threads: An Airport, A Mini-Bus and Epiphany,” February 1998.
Other Articles
“Wangari Maathai and Kenya's Green Belt Movement: Exploring the Evolution and Potentialities of Consensus Movement Mobilization,” Social Problems, Vol. 41: No. 4, November 1994.
“International NGOs: Prospects for Conflict Resolution Accompaniments to Relief and Development Assistance,” unpublished, February 1994.
“Conflict Management Strategies for International Development Disputes,” unpublished, February 1994.
“Somalia: The Painful Road to Reconciliation,” Africa Today, 2nd Quarter, 1993. “In The End, Africa Will Shape Its Own Future,” New York Times, February 28, 1989.
Achievement First Leadership Team Resumes Page 17PR/Award # U282M100002 e16

616 East 19th Street • Brooklyn, NY 11230 • 917.744.3054 • [email protected]
OVERVIEW I have dedicated my career to creating classrooms and schools of excellence for traditionally underserved students. In my work to close the achievement gap, I have collaborated successfully with teachers, principals, district leaders, and families. I have on-the-ground experience working in and building successful schools. I also have extensive experience galvanizing support from community based organizations, foundations, and the private sector for the benefit of students in public school and charter school districts. PROFESSIONAL EXPERIENCE
2008 Assistant Superintendent, Achievement First (CMO) to present Provide direct support and supervision to schools of excellence in Brooklyn, NY and New Haven, CT
• School Support: Serve as the direct manager for all NYC middle schools and the CMO’s flagship high school in New Haven by giving instructional and operational guidance and the direct coaching of principals and deans. Schools under my purview have demonstrated exceptional gains (all schools received As on Chancellor’s progress report).
• New School Development: Work hand-in-hand with Principals-in-Residence to support the development of strong systems and structures for two new NYC schools opening September 2009.
• Systemic Leadership and Management Development: Create systems for school review process and improvement plans, develop network-wide models for documents, systems, and structures.
• High School Model Development: Coordinate AF’s first ever 9 – 12 curriculum and interim assessment development to promote data-driven instruction; create all network policies around graduation and promotion requirements, high school staffing, programming, and budget.
2004-08 Founding Principal, Urban Assembly School for Law and Justice (www.sljhs.org)
Spearheaded development of unscreened, Title I School featured in Clara Hemphill’s “NYC Best Public High Schools” • School Successes:
o “A” on School Progress Report and “Well Developed with Outstanding Features” on NYC’s School Quality Review o 100% of Seniors Applied to College o 100% of Seniors Accepted to College o 100% of Seniors Passed ELA and Math Regents o 93% Graduation Rate (compared to ~50% citywide average) o Substantially exceeded citywide averages on School Environment Survey based on responses by students, parents,
and teachers. o SLJ Featured in Publications including New York Times (June 2005 and June 2008), American Lawyer, and
Brooklyn Eagle. o Developed teachers who subsequently won prestigious prizes including three NYC Outstanding Teachers, two
$50,000 Math for America Fellows, New York Times New and Outstanding Featured Teacher, National Endowment for the Humanities and Teacher Fund Grant Recipients.
• School Features: o Academic Rigor Allocated appropriate budgetary and programmatic resources and created protocols and systems to
support collaboration and communication leading to high expectations and outcomes for all students. 100% of students accepted to college including Amherst, the University of Chicago, Georgetown, Barnard, Bates, Hamilton, Skidmore, Union, and dozens more. Graduates received several million dollars in aid and scholarship money.
o Supportive Relationships Developed Advisory system used as a model for other schools to promote strong relationships between the school and the home, ongoing academic support and counseling for students; facilitated the creation of exceptional Advisory curriculum.
o Integrated Partnerships Initiated and maintained relationships with community based organizations, non-profits, corporate partners, and governmental agencies to enhance the instruction in academic courses and Advisory; Partnerships include Red Hook Community Justice Center, Cravath, Swaine & Moore, LLP, Brooklyn Law School, and more than 50 others including the Vera Institute of Justice and the Junior Statesmen of America.
• School Support: o Created 501c3 to provide essential support and enrichment services for students and families to operate in tandem
with the school (Adams Street Foundation). o Developed programs to ensure 100% college matriculation for all students (early-college awareness, support
through the college process, retention support through college). o Raised over $2 million over four years to support school to ensure that Department of Education funding could be
protected for instruction. 2003-04 Regional Instructional Specialist, Region 8
Supported high school principals, assistant principals and coaches in developing strong balanced literacy instruction across the curriculum in their schools. • Led monthly professional development sessions for Assistant Principals, weekly sessions for coaches and provided ongoing
support for individual schools. • Assisted school administrators and coaches in decisions regarding the utilization of resources (i.e.: programming, personnel)
to promote effective literacy instruction in all content areas. • Facilitated the successful establishment of lab sites in schools to serve as models of effective literacy instruction for all
teachers in the building.
ELANA KAROPKIN
Achievement First Leadership Team Resumes Page 18PR/Award # U282M100002 e17

616 East 19th Street • Brooklyn, NY 11230 • 917.744.3054 • [email protected] 2002-03 Assistant Principal, New Century High School 9
th Grade Academy, Van Arsdale High School
Implemented the transformation of the ninth grade based on high expectations and youth development principles through collaboration with the school’s current administration, the superintendency and a community-based organization. • Supervised and supported 28 teachers in English, Math, Science and Social Studies through formal and informal
observations, team and modeled teaching, development of buddy and mentor teacher program, guided intervisitations and the creation of a library of resources.
• Led and coordinated weekly professional development opportunities for all 9th grade teachers in pedagogy and youth
development, as well as after-school professional development sessions for new teachers in areas such as creating unit plans, backward design, project-based learning and positive discipline.
• Coordinated partnership with St. Nick’s (CBO) to provide targeted support services for all 9th
graders including home visits, one-on-one conferencing, attendance outreach and Academic Intervention Services.
1999-02 English Coordinator and English Teacher, Cobble Hill High School of American Studies
Coordinator and Supervisor of the English Department • Provided instructional leadership by formally and informally observing lessons, modeling effective unit and lesson planning
and weekly meetings to facilitate creation and implementation of department short and long-term objectives. • Led school-wide workshops and coordinated teacher-led staff development days to promote the integration of technology,
literacy skills, and Regents preparatory material into curriculum. • Member of School Leadership Team: made budgetary, curricular, and hiring decisions with faculty, parents, and students. • 94% departmental passing rate on the English Regents exam, 97% passing rate in my class.
1997-8 English Teacher, Thomas Jefferson High School
Developed curriculum tailored to multiple learning styles for students in challenging educational environment. � Developed Law and Literature unit including such components as: coaching of Mock Trial team, coordinating cooperative
relationships with judges and attorneys; arranging tours to local police stations and courts, such as the Red Hook Community Justice Center.
� Prepared incoming 9th
graders for the rigor of high school by teaching study skills, research skills, and literary analysis. � Faculty advisor to Aspira, the school’s multi-cultural newsletter.
FELLOWSHIPS, HONORS & PUBLICATIONS 2009 Harvard School of Education: Programs in Professional Education
Featured speaker for the Charter Schools Institute on “Defining and Supporting Instructional Excellence” 2007 Cornerstone Award
Recipient of $10,000 through the Jewish Funds for Justice Grant awarded to four young activists from across the country.
2005 Annenberg Institute for School Reform: Voices in Urban Education – Spring 2005 Published Article: “It Takes a City to Build a School: A Community Partnership in Brooklyn”
2001-02 Jonathan Levin Fellowship
Full tuition scholarship to New York University awarded to no more than five leading urban teachers yearly.
2001 National Endowment for the Humanities Summer Seminar at Amherst College Selected for competitive summer fellowship to study Punishment, Politics and Culture with Dr. Austin Sarat.
2001 Street Law Supreme Court Summer Institute Selected to participate in conference on the Supreme Court for educators around the country.
2001 Gilder Lehrman Summer Institute at Gettysburg College Selected for competitive program to study the life and times of Abraham Lincoln with Dr. Gabor Borrit.
2000 Gilder Lehrman Summer Institute at Cambridge University, England Selected for competitive program to study the American Revolution from a British Perspective.
EDUCATION New York University MA in English Education, 2002 – 4.0 GPA.
Additional graduate coursework at Touro College, Brooklyn College, College of Mt. Saint Vincent and St. Rose College.
Bryn Mawr College Graduated cum laude BA in English, 1997.
ELANA KAROPKIN
Achievement First Leadership Team Resumes Page 19PR/Award # U282M100002 e18

ELANA KAROPKIN 616 East 19th Street • Brooklyn, NY 11230 • 917.744.3054 • [email protected]
REFERENCES
Joel Klein, Chancellor, NYC Department of Education 52 Chambers Street / New York, NY 10007 / (212) 374-0200 Doug McCurry, Founder and Co-CEO, Achievement First 1137 Herkimer Street / Brooklyn, NY 11233 / (203) 589-7396 Jeff Sudmyer, Principal, Amistad Academy High School 49 Prince Street / New Haven, CT 06510 / (203) 848-5682 Jeffrey Smith, Managing Partner, Cravath, Swaine & Moore, LLP, Advisory Board Co-Chair 825 8
th Avenue / New York, NY 10019 / (212) 474-1000
Emary Aronson, Managing Director, Robin Hood Foundation 826 Broadway, 9th Floor / New York, NY 10003 / (212) 227-6601 Suzette Dyer, Teacher and Grade Team Leader, Urban Assembly School for Law and Justice 283 Adams Street / Brooklyn, NY 11201 / (917) 755-3819 Susan Knight, Director of College, Urban Assembly School for Law and Justice 283 Adams Street / Brooklyn, NY 11201 / (917) 583-6838 Alberta Marshall, Founding Parent & PTA President, Urban Assembly School for Law and Justice 50 Navy Street / Brooklyn, NY 11201 / (718) 625-7574
Charles Walker, Founding Student, Urban Assembly School for Law and Justice 50 Navy Street / Brooklyn, NY 11201 / (718) 858-1160
Achievement First Leadership Team Resumes Page 20PR/Award # U282M100002 e19

Chi Tschang
2124 West Alluvial Avenue, Fresno, CA 93711 (559) 307-8989 [email protected] education 1994-1998 YALE COLLEGE NEW HAVEN, CT Bachelor of Arts degree in History, May 1998
Cumulative GPA: 3.7. Graduated cum laude with distinction in the major. Distinctions: President’s Public Service Fellowship (1996), John Schroeder Award (1997), Dwight Waterman Prize (1997), New Haven Community Foundation’s Elm/Ivy Award (1998), and Fenmore R. Seton Award (1998) Interests: Co-coordinator and board member at Dwight Hall, Center for Public Service at Yale; Founder, Cityscape program; Research Assistant for Professors Cynthia Farrar and Douglas Rae, Political Science Department
experience 2003-2009 KIPP ACADEMY FRESNO FRESNO, CA
Founder and Principal. Based on the nationally acclaimed KIPP model, KIPP Academy Fresno (KAF) is a college-preparatory public school in central-west Fresno aimed at preparing 300 underserved 5th through 8th graders for success in top high schools and colleges. In 2007-2008, 77 percent of KAF students were low-income minorities.
In 2008, KAF’s statewide Academic Performance Index (API) score of 850 ranked 7th overall out of the 119 public middle schools in Fresno, Madera, Merced and Mariposa counties.
School-wide Accomplishments
In 2008, KAF was named a California Title I Distinguished School, one of only two middle schools in Fresno County (out of 60 total middle schools).
In 2008, KAF’s graduating class of 8th graders had improved by 8 grade levels in math (64 national percentiles) and by 7 grade levels (54 national percentiles) in reading over four years.
In 2008, 100% of KAF’s graduating 8th graders matriculated to college-preparatory high school programs and secured over $450,000 in high school scholarships.
On a 2008-2009 1st quarter parent survey (with an 85 percent return rate), 98 percent of respondents stated they were “satisfied” or “highly satisfied” with the overall quality of education at KAF.
Hired, trained, managed and led a staff of 20 teachers; over four years, the school’s annual staff attrition rate was among the lowest in the KIPP network (19 percent at KAF vs. 40 percent at KIPP nationwide)
Primary Responsibilities
Supervised an operating budget of $2.8M+, including annual clean audits and over $1.2M in fundraising over four years.
In first year of teaching math, 6th grade cohort tested at the 95th percentile on the SAT-10, ranking 2nd overall in the KIPP network nationwide (2006). On the STAR state tests, this cohort ranked 1st out of the 160 elementary schools in Fresno County.
In first year of teaching ELA, 7th grade cohort tested at the 77th percentile on the SAT-10 (2008). On the STAR state tests, this cohort ranked 7th out of 119 middle schools in Fresno, Madera, Merced and Mariposa counties.
Spearheaded a bi-weekly KIPP to College Saturday School program that taught SAT vocabulary, composition skills and problem-solving strategies.
As a Fisher Fellow, participated in the KIPP School Leadership Program, a year-long apprenticeship that supports aspiring school founders in efforts to create and lead KIPP public schools in high-need communities.
1999-2003 ACADEMY OF THE PACIFIC RIM CHARTER SCHOOL BOSTON, MA
Chair, History Department. The Academy of the Pacific Rim (APR) is a grade 6-12 public charter school committed to combining the best educational practices and ideas from the West and Far East. APR students are 54% African-American, 25% Caucasian, 14% Latino, and 5% Asian; 51% qualify for free or reduced meals. Managed department of five teachers. Taught courses in Ancient History (grade 6), U.S. History (grade 8),
World History (grade 10) and SAT prep (grade 11). 8th grade MCAS history average ranked 10th out of 450+ Massachusetts public middle schools (2002). Profiled (“The Lottery Winner”) in Po Bronson’s #1 New York Times best-seller What Should I Do With My
Life? The True Story of People Who Answered the Ultimate Question (Random House, 2003) and on the Oprah Winfrey show (January 27, 2003).
1998-1999 CITY YEAR PROVIDENCE, RI
Corps member. Served with Americorps citizen service organization, tutoring and mentoring 4th graders at the William D’Abate Memorial School in south Providence. Recipient of the 2007 Comcast National Leadership Award for leadership as a social entrepreneur and outstanding achievement as a City Year alumnus.
personal Accomplished trombonist (4 years in the Yale Symphony Orchestra). Former cook for Armany’s Italian restaurant in Boston. Conversant in Mandarin Chinese and Spanish. Enjoy salsa dancing, reading and following Duke basketball.
Achievement First Leadership Team Resumes Page 21PR/Award # U282M100002 e20
Project Narrative
Section 2 - Other Attachments: Letters of Support
Attachment 1: Title: Achievement First CSP Grant Application Letters of Support Pages: 10 Uploaded File: CSP RE Grant Application Letters of Support 100701.pdf
PR/Award # U282M100002 e110

Achievement First:
Replicating and Expanding High-Achieving Charter Schools in Connecticut, New York
and Rhode Island
Letters of Support
Author Title Organization Support Category Page
reference
Michael Magee CEO Rhode Island
Mayoral
Academies
Partnership with
Providence and
Cranston, Rhode Island
2
Joel I. Klein Chancellor New York City
Department of
Education
Partnership with New
York City, New York
3
Garth Harries Assistant
Superintendant,
Portfolio and
Management
New Haven Public
Schools
Partnership with New
Haven, Connecticut
4
Vanessa Kirsch President and
Founder
New Profit Matching funds 6
Jonathan D. Sackler Matching funds 7
D. Ben Benoit Executive
Director
The Peter and
Carmen Lucia Buck
Foundation
Matching funds 9
Achievement First Section 2 Page 1PR/Award # U282M100002 e0

160 WESTMINSTER ST. SUITE 202 PROVIDENCE, RI 02903 401-244-7496
June 27, 2010 The Honorable Arne Duncan, Secretary Department of Education 400 Maryland Avenue, SW Washington, D.C. 20202-0008 Dear Secretary Duncan, I am writing in strong support of Achievement First’s application for Charter School Program Grant 84.282M. Achievement First’s track record of success closing the achievement gap for historically underserved students in Connecticut and New York is the reason we have worked to create a local and state environment conducive to the replication of Achievement First schools in Rhode Island. The State of Rhode Island is moving rapidly on a number of fronts to dramatically improve outcomes for all students, and our reform strategy moving forward puts significant emphasis on turning around the unacceptable number of chronically failing schools in Rhode Island. The success of our reform plan depends heavily on identifying and partnering with high-quality school management organizations that have the capacity and track record to take on the challenging work of dramatically improving student outcomes. Achievement First has a strong record of student achievement gains and a proven ability to grow and replicate without sacrificing quality. As a result, Achievement First is one of the organizations we want partnering with us and this partnership is an integral part of our efforts to increase the high-quality educational opportunities available to Rhode Island’s neediest students. In replicating Achievement First schools in Rhode Island, we hope to not only achieve academic breakthroughs for the students directly served, but to systematize and disseminate lessons learned in order to inspire improved student achievement in traditional public schools state-wide and to increase the number of viable education reform partners in Rhode Island. All Rhode Island students can learn and achieve at high levels, and Achievement First will help us deliver on this promise. Education reform is a critical social and civil issue, and Achievement First is an important part of Rhode Island’s increased investment in education. On behalf of Rhode Island Mayoral Academies, I am pleased to endorse Achievement First’s application for a federal grant award to support its planned growth and expansion. Sincerely,
Michael Magee, Ph.D. CEO
Achievement First Section 2 Page 2PR/Award # U282M100002 e1

Achievement First Section 2 Page 3PR/Award # U282M100002 e2

Achievement First Section 2 Page 4PR/Award # U282M100002 e3

Achievement First Section 2 Page 5PR/Award # U282M100002 e4

Achievement First Section 2 Page 6PR/Award # U282M100002 e5

Achievement First Section 2 Page 7PR/Award # U282M100002 e6

Achievement First Section 2 Page 8PR/Award # U282M100002 e7
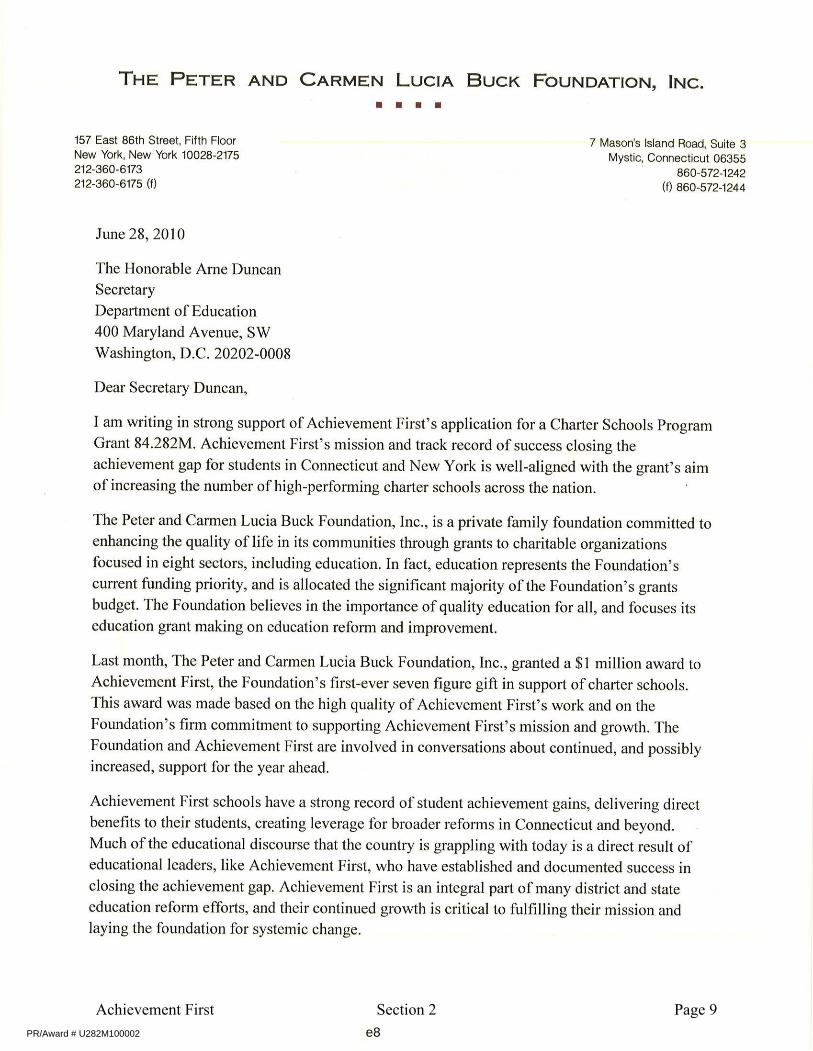
Achievement First Section 2 Page 9PR/Award # U282M100002 e8

Achievement First Section 2 Page 10PR/Award # U282M100002 e9

Project Narrative
Section 3 - Other Attachments: Proof of Non-Profit Status, or not for-profit status
Attachment 1: Title: Achievement First CSP Grant Application 501c3 Determination Letter Pages: 4 Uploaded File: AF CSP Grant 501c3 Determination Letter.pdf
PR/Award # U282M100002 e121

Achievement First 501c3 Determination Letter Page 1PR/Award # U282M100002 e0

Achievement First 501c3 Determination Letter Page 2PR/Award # U282M100002 e1

Achievement First 501c3 Determination Letter Page 3PR/Award # U282M100002 e2

Achievement First 501c3 Determination Letter Page 4PR/Award # U282M100002 e3

Project Narrative
Section 4 - Other Attachments: Schools Operated by Applicant
Attachment 1: Title: Achievement First CSP Grant Application School Operated by Applicant Pages: 2 Uploaded File: CSP RE Grant Application Schools Attachment 100630.pdf
PR/Award # U282M100002 e126

Achievement First Section 4 Page 1
Achievement First:
Replicating and Expanding High-Achieving Charter Schools in Connecticut, New York
and Rhode Island
Section 4—Other Attachments: Schools Operated by Applicant
AF Connecticut Schools
School
Name Charter
Charter
Authorizer
School
Address
School
Location
Grades
Served
Year
Opened
Amistad
Academy
Middle
Amistad
Academy
Connecticut
State Board
of
Education
407 James
Street
New
Haven,
Connecticut
5-8 1999
Elm City
College
Preparatory
Elementary
Elm City
College
Preparatory
Connecticut
State Board
of
Education
240
Greene
Street
New
Haven,
Connecticut
K-4 2004
Elm City
College
Preparatory
Middle
Elm City
College
Preparatory
Connecticut
State Board
of
Education
794
Dixwell
Avenue
New
Haven,
Connecticut
5-8 2004
Amistad-
Elm City
High
Amistad
Academy/Elm
City College
Preparatory
(joint charter)
Connecticut
State Board
of
Education
49 Prince
Street
New
Haven,
Connecticut
9-12 2006
Amistad
Academy
Elementary
Amistad
Academy
Connecticut
State Board
of
Education
540 Ella T.
Grasso
Boulevard
New
Haven,
Connecticut
K-3
(growing
to K-4)
2006
AF
Bridgeport
Academy
Middle
AF
Bridgeport
Academy
Connecticut
State Board
of
Education
529 Noble
Avenue
Bridgeport,
Connecticut
5-7
(growing
to 5-8)
2007
AF Harford
Academy
Elementary
AF Hartford
Academy
Connecticut
State Board
of
Education
395 Lyme
Street
Hartford,
Connecticut
K-2
(growing
to K-4)
2008
AF
Hartford
Academy
Middle
AF Hartford
Academy
Connecticut
State Board
of
Education
395 Lyme
Street
Hartford,
Connecticut
5-6
(growing
to 5-8)
2008
PR/Award # U282M100002 e0

Achievement First Section 4 Page 2
AF New York Schools
School
Name Charter
Charter
Authorizer
School
Address
School
Location
Grades
Served
Year
Opened
AF Crown
Heights
Elementary
AF Crown
Heights
SUNY
Charter
Schools
Institute
790 East
New York
Avenue
Brooklyn,
New York K-4 2005
AF Crown
Heights
Middle
AF Crown
Heights
SUNY
Charter
Schools
Institute
790 East
New York
Avenue
Brooklyn,
New York 5-8 2005
AF East
New York
Elementary
AF East New
York
SUNY
Charter
Schools
Institute
557
Pennsylvania
Avenue
Brooklyn,
New York K-4 2005
AF
Bushwick
Elementary
AF Bushwick
SUNY
Charter
Schools
Institute
125 Covert
Street
Brooklyn,
New York K-4 2006
AF
Endeavor
Middle
AF Endeavor
SUNY
Charter
Schools
Institute
510 Waverly
Avenue
Brooklyn,
New York
5-7
(growing
to 5-8)
2006
AF
Bushwick
Middle
AF Bushwick
SUNY
Charter
Schools
Institute
1300 Greene
Avenue
Brooklyn,
New York
5-7
(growing
to 5-8)
2007
AF
Brownsville
Elementary
AF
Brownsville
SUNY
Charter
Schools
Institute
2021 Bergen
Street
Brooklyn,
New York
K-2
(growing
to K-4)
2008
AF Crown
Heights
High
AF Crown
Heights
SUNY
Charter
Schools
Institute
1137
Herkimer
Street
Brooklyn,
New York
9
(growing
to 9-12)
2009
AF East
New York
Middle
AF East New
York
SUNY
Charter
Schools
Institute
158
Richmond
Street
Brooklyn,
New York
5
(growing
to 5-8)
2009
PR/Award # U282M100002 e1

Project Narrative
Section 5 - Other Attachments: Student Academic Achievement
Attachment 1: Title: Achievement First CSP Grant Application Student Academic Achievement Pages: 19 Uploaded File: CSP RE Grant Application Student Achievement Data Attachment 100630.pdf
PR/Award # U282M100002 e129

Achievement First Section 5—Student Academic Achievement Page 1
Achievement First:
Replicating and Expanding High-Achieving Charter Schools in Connecticut, New York
and Rhode Island
Section 5—Other Attachments: Student Academic Achievement
Category 1: Student Academic Achievement—All Students
1.a AF students v. Host district students
Table 1.a.1
2009 Connecticut Mastery Test Fourth-Grade Students Percent of Students At or Above Proficiency
Math Reading Writing Average of All
Subjects AF New Haven 90% 85% 87% 87%
New Haven Public Schools
66% 48% 67% 60%
Difference +24% +37% +20% +27% Table 1.a.2
2009 Connecticut Mastery Test Eighth-Grade Students Percent of Students At or Above Proficiency
Math Reading Writing Science Average of All Subjects
AF New Haven
97% 74% 91% 66% 82%
New Haven Public
Schools 65% 59% 61% 45% 58%
Difference +32% +15% +30% +21% +24% Table 1.a.3
2009 Connecticut Academic Performance Test 10th-Grade Students Percent of Students At or Above Proficiency
Math Reading Writing Science Average of All Subjects
AF New 75% 91% 100% 91% 89%
PR/Award # U282M100002 e0
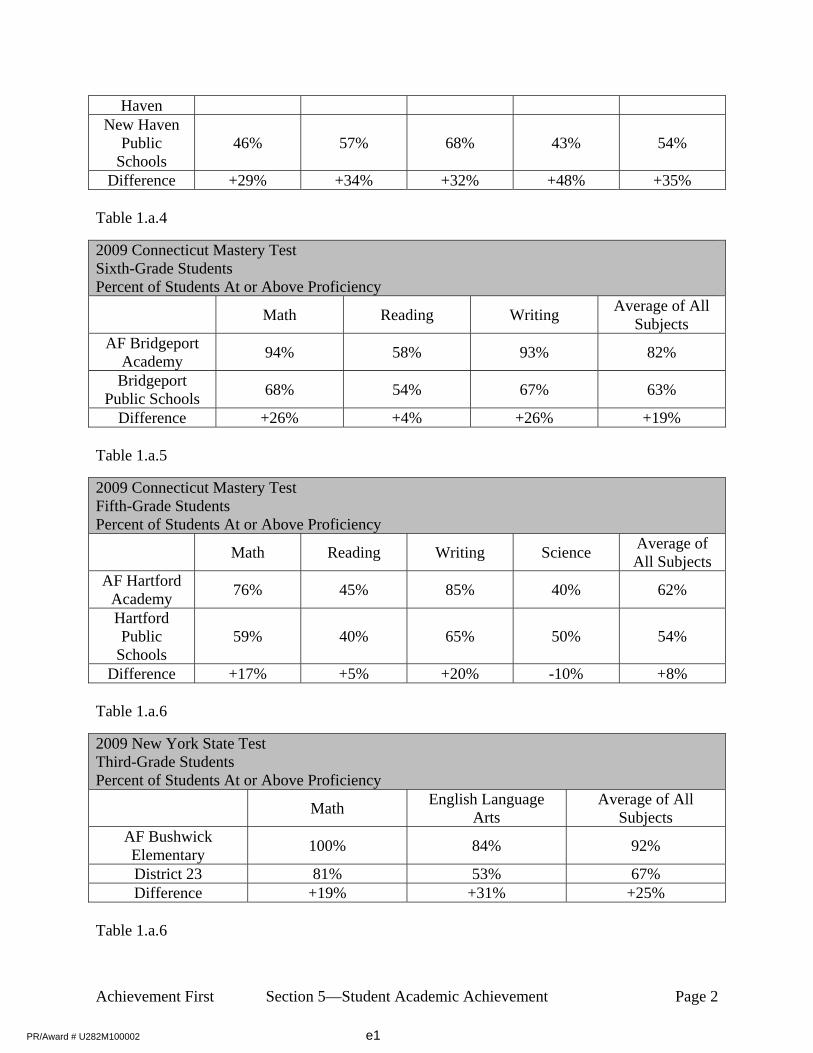
Achievement First Section 5—Student Academic Achievement Page 2
Haven New Haven
Public Schools
46% 57% 68% 43% 54%
Difference +29% +34% +32% +48% +35% Table 1.a.4
2009 Connecticut Mastery Test Sixth-Grade Students Percent of Students At or Above Proficiency
Math Reading Writing Average of All
Subjects AF Bridgeport
Academy 94% 58% 93% 82%
Bridgeport Public Schools
68% 54% 67% 63%
Difference +26% +4% +26% +19% Table 1.a.5
2009 Connecticut Mastery Test Fifth-Grade Students Percent of Students At or Above Proficiency
Math Reading Writing Science Average of All Subjects
AF Hartford Academy
76% 45% 85% 40% 62%
Hartford Public
Schools 59% 40% 65% 50% 54%
Difference +17% +5% +20% -10% +8% Table 1.a.6
2009 New York State Test Third-Grade Students Percent of Students At or Above Proficiency
Math English Language
Arts Average of All
Subjects AF Bushwick Elementary
100% 84% 92%
District 23 81% 53% 67% Difference +19% +31% +25%
Table 1.a.6
PR/Award # U282M100002 e1

Achievement First Section 5—Student Academic Achievement Page 3
2009 New York State Test Sixth-Grade Students Percent of Students At or Above Proficiency
Math English Language
Arts Average of All
Subjects AF Bushwick Middle 94% 68% 81%
District 32 75% 70% 73% Difference +19% -2% +8%
Table 1.a.7
2009 New York State Test Fourth-Grade Students Percent of Students At or Above Proficiency
Math English Language
Arts Average of All
Subjects AF Crown Heights
Elementary 100% 98% 99%
District 17 82% 66% 74% Difference +18% +32% +25%
Table 1.a.8
2009 New York State Test Eighth-Grade Students Percent of Students At or Above Proficiency
Math English Language
Arts Average of All
Subjects AF Crown Heights
Middle 90% 77% 84%
District 17 60% 47% 54% Difference +30% +30% +30%
Table 1.a.9
2009 New York State Test Fourth-Grade Students Percent of Students At or Above Proficiency
Math English Language
Arts Average of All
Subjects AF East New York
Elementary 97% 88% 93%
District 19 79% 65% 72% Difference +18% +23% +21%
Table 1.a.10
PR/Award # U282M100002 e2

Achievement First Section 5—Student Academic Achievement Page 4
2009 New York State Test Seventh-Grade Students Percent of Students At or Above Proficiency
Math English Language
Arts Average of All
Subjects AF Endeavor Middle 97% 70% 84%
District 13/16 74% 65% 70% Difference +23% +5% +14%
1.b AF students vs. State students
Table 1.b.1
2009 Connecticut Mastery Test Fourth-Grade Students Percent of Students At or Above Proficiency
Math Reading Writing Average of All
Subjects AF Connecticut 90% 85% 87% 87%
Connecticut State
85% 74% 85% 81%
Difference +5% +11% +2% +6% Table 1.b.2
2009 Connecticut Mastery Test Eighth-Grade Students Percent of Students At or Above Proficiency
Math Reading Writing Science Average of All Subjects
AF Connecticut
97% 74% 91% 66% 82%
Connecticut State
85% 81% 84% 77% 82%
Difference +12% -7% +7% -11% 0% Table 1.b.3
2009 Connecticut Academic Performance Test 10th-Grade Students Percent of Students At or Above Proficiency
Math Reading Writing Science Average of All Subjects
AF Connecticut
75% 91% 100% 91% 89%
Connecticut 78% 82% 87% 78% 81%
PR/Award # U282M100002 e3

Achievement First Section 5—Student Academic Achievement Page 5
State Difference -3% +9% +13% +13% +8%
Table 1.b.4
2009 New York State Test Fourth-Grade Students Percent of Students At or Above Proficiency
Math English Language
Arts Average of All
Subjects AF New York 99% 93% 96%
New York State 87% 77% 82% Difference +12% +16% +14%
Table 1.b.5
2009 New York State Test Eighth-Grade Students Percent of Students At or Above Proficiency
Math English Language
Arts Average of All
Subjects AF New York 90% 77% 84%
New York State 80% 69% 75% Difference +10% +8% +9%
1.c AF cohort over time vs. Host district cohort over time vs. State cohort over time
Table 1.c.1
Connecticut Mastery Test Cohort Over Time Percent of Students At or Above Proficiency
Amistad Academy New Haven Public
Schools Connecticut State
Fourth Grade (2004) Math 90 64 79 Reading 44 35 67 Writing 71 63 81 Average of All Subjects
68 54 76
Fifth Grade (2006) Math 61 60 81 Reading 68 42 73 Writing 92 71 85 Average of All Subjects
73 57 80
PR/Award # U282M100002 e4

Achievement First Section 5—Student Academic Achievement Page 6
Sixth Grade (2007) Math 93 62 83 Reading 68 49 76 Writing 88 66 84 Average of All Subjects
83 59 81
Seventh Grade (2008) Math 96 63 83 Reading 88 56 80 Writing 99 55 80 Average of All Subjects
94 58 81
Eighth Grade (2009) Math 97 65 85 Reading 85 59 81 Writing 89 61 84 Average of All Subjects
90 62 83
Category 2: Student Academic Achievement—Low-income Students
2.a AF low-income students vs. State low-income students
Table 2.a.1
2009 Connecticut Mastery Test Fourth-Grade Students Percent of Students At or Above Proficiency
Math Reading Writing Average of All
Subjects AF Connecticut (Low-income
Students) 89% 83% 85% 86%
Connecticut State (Low-
income Students) 67% 50% 71% 63%
Difference +22% +33% +14% +23% Table 2.a.2
2009 Connecticut Mastery Test Eighth-Grade Students Percent of Students At or Above Proficiency
Math Reading Writing Science Average of All Subjects
AF 97% 71% 92% 67% 82%
PR/Award # U282M100002 e5

Achievement First Section 5—Student Academic Achievement Page 7
Connecticut (Low-income
students) Connecticut State (Low-
income students)
65% 58% 67% 50% 60%
Difference +32% +13% +25% +17% +22% Table 2.a.3
2009 Connecticut Academic Performance Test 10th-Grade Students Percent of Students At or Above Proficiency
Math Reading Writing Science Average of All Subjects
AF Connecticut
(Low-income students)
75% 92% 100% 92% 90%
Connecticut State (Low-
income students)
52% 60% 69% 50% 58%
Difference +23% +32% +31% +42% +32% Table 2.a.4
2009 New York State Test Fourth-Grade Students Percent of Students At or Above Proficiency
Math English Language
Arts Average of All
Subjects AF New York (Low-
income students) 98% 93% 96%
New York State (Low-income
students) 82% 67% 75%
Difference +16% +26% +21% Table 2.a.5
2009 New York State Test Eighth-Grade Students Percent of Students At or Above Proficiency
Math English Language
Arts Average of All
Subjects
PR/Award # U282M100002 e6

Achievement First Section 5—Student Academic Achievement Page 8
AF New York (Low-income students)
91% 71% 81%
New York State (Low-income
students) 70% 55% 63%
Difference +21% +16% +18%
2.b AF low-income students vs. State non-poor students
Table 2.b.1
2009 Connecticut Mastery Test Fourth-Grade Students Percent of Students At or Above Proficiency
Math Reading Writing Average of All
Subjects AF Connecticut (Low-income
students) 89% 83% 85% 86%
Connecticut State (Non-poor
students) 93% 86% 92% 90%
Difference -4% -3% -7% -4% Table 2.b.2
2009 Connecticut Mastery Test Eighth-Grade Students Percent of Students At or Above Proficiency
Math Reading Writing Science Average of All Subjects
AF Connecticut
(Low-income students)
97% 71% 92% 67% 82%
Connecticut State (Non-
poor students) 93% 90% 91% 88% 91%
Difference +4% -19% +1% -21% -9% Table 2.b.3
2009 Connecticut Academic Performance Test 10th-Grade Students Percent of Students At or Above Proficiency
Math Reading Writing Science Average of
PR/Award # U282M100002 e7

Achievement First Section 5—Student Academic Achievement Page 9
All Subjects AF
Connecticut (Low-income
students)
75% 92% 100% 92% 90%
Connecticut State (Non-
poor students) 87% 89% 92% 88% 89%
Difference -12% +3% +8% +4% +1% Table 2.b.4
2009 New York State Test Fourth-Grade Students Percent of Students At or Above Proficiency
Math English Language
Arts Average of All
Subjects AF New York (Low-
income students) 98% 93% 96%
New York State (Non-poor students)
93% 88% 91%
Difference +5% +5% +5% Table 2.b.5
2009 New York State Test Eighth-Grade Students Percent of Students At or Above Proficiency
Math English Language
Arts Average of All
Subjects AF New York (Low-
income students) 91% 71% 81%
New York State (Non-poor students)
89% 81% 85%
Difference +2% -10% -4%
Category 3: Student Academic Achievement—Special Education Students*
3.a AF special education students vs. State special education students
Table 3.a.1
2009 New York State Test Fourth-Grade Students Percent of Students At or Above Proficiency
Math English Language Average of All
PR/Award # U282M100002 e8

Achievement First Section 5—Student Academic Achievement Page 10
Arts Subjects AF New York
(Special education students)
100% 73% 87%
New York State (Special education
students) 61% 37% 49%
Difference +39% +36% +38% *AF does not report data for subgroups of less than 10 students. Of AF’s capstone grades—fourth, eighth and 10th—AF New York fourth graders were the only cohort that met the 10 student threshold for special education.
Category 4: Student Academic Achievement—English Language Learners
AF does not report data for subgroups of less than 10 students. Of AF’s capstone grades—fourth, eighth and 10th—there were no cohorts that met the 10 student threshold for English language learners.
Category 5: Student Academic Achievement—African American and Hispanic Students
5.a AF African American students vs. State African American students
Table 5.a.1
2009 Connecticut Mastery Test Fourth-Grade Students Percent of Students At or Above Proficiency
Math Reading Writing Average of All
Subjects AF Connecticut
(African American students)
89% 83% 85% 86%
Connecticut State (African
American students)
65% 53% 72% 63%
Difference +24% +30% +13% +23% Table 5.a.2
2009 Connecticut Mastery Test Eighth-Grade Students Percent of Students At or Above Proficiency
Math Reading Writing Science Average of
PR/Award # U282M100002 e9

Achievement First Section 5—Student Academic Achievement Page 11
All Subjects AF
Connecticut (African
American students)
96% 78% 93% 70% 84%
Connecticut State (African
American students)
64% 60% 69% 48% 60%
Difference +32% +18% +24% +22% +24% Table 5.a.3
2009 Connecticut Academic Performance Test 10th-Grade Students Percent of Students At or Above Proficiency
Math Reading Writing Science Average of All Subjects
AF Connecticut
(African American students)
74% 84% 100% 95% 88%
Connecticut State (African
American students)
46% 60% 71% 48% 56%
Difference +28% +24% +29% +47% +32% Table 5.a.4
2009 New York State Test Fourth-Grade Students Percent of Students At or Above Proficiency
Math English Language
Arts Average of All
Subjects AF New York
(African American students)
99% 92% 96%
New York State (African American
students) 78% 65% 72%
Difference +21% +27% +24% Table 5.a.5
PR/Award # U282M100002 e10

Achievement First Section 5—Student Academic Achievement Page 12
2009 New York State Test Eighth-Grade Students Percent of Students At or Above Proficiency
Math English Language
Arts Average of All
Subjects AF New York
(African American students)
91% 77% 84%
New York State (African American
students) 63% 52% 58%
Difference +28% +25% +26%
5.b AF African American students vs. State Caucasian and Asian students
Table 5.b.1
2009 Connecticut Mastery Test Fourth-Grade Students Percent of Students At or Above Proficiency
Math Reading Writing Average of All
Subjects AF Connecticut
(African American students)
89% 83% 85% 86%
Connecticut State (Caucasian
and Asian students)
93% 85% 91% 90%
Difference -4% -2% -6% -4% Table 5.b.2
2009 Connecticut Mastery Test Eighth-Grade Students Percent of Students At or Above Proficiency
Math Reading Writing Science Average of All Subjects
AF Connecticut
(African American students)
96% 78% 93% 70% 84%
Connecticut State
93% 90% 91% 88% 91%
PR/Award # U282M100002 e11

Achievement First Section 5—Student Academic Achievement Page 13
(Caucasian and Asian students)
Difference +3% -12% +2% -18% -7% Table 5.b.3
2009 Connecticut Academic Performance Test 10th-Grade Students Percent of Students At or Above Proficiency
Math Reading Writing Science Average of All Subjects
AF Connecticut
(African American students)
74% 84% 100% 95% 88%
Connecticut State
(Caucasian and Asian students)
89% 90% 93% 90% 91%
Difference -15% -6% +7% +5% -3% Table 5.b.4
2009 New York State Test Fourth-Grade Students Percent of Students At or Above Proficiency
Math English Language
Arts Average of All
Subjects AF New York
(African American students)
99% 92% 96%
New York State (Caucasian and Asian
students) 93% 86% 90%
Difference +6% +6% +6% Table 5.b.5
2009 New York State Test Eighth-Grade Students Percent of Students At or Above Proficiency
Math English Language
Arts Average of All
Subjects AF New York 91% 77% 84%
PR/Award # U282M100002 e12

Achievement First Section 5—Student Academic Achievement Page 14
(African American students)
New York State (Caucasian and Asian
students) 89% 79% 84%
Difference +2% -2% 0%
5.c AF Hispanic students vs. State Hispanic students**
Table 5.c.1
2009 Connecticut Mastery Test Fourth-Grade Students Percent of Students At or Above Proficiency
Math Reading Writing Average of All
Subjects AF Connecticut
(Hispanic students)
92% 92% 92% 92%
Connecticut State (Hispanic
students) 67% 47% 70% 61%
Difference +25% +45% +22% +31% Table 5.c.2
2009 Connecticut Mastery Test Eighth-Grade Students Percent of Students At or Above Proficiency
Math Reading Writing Science Average of All Subjects
AF Connecticut (Hispanic students)
100% 53% 85% 45% 71%
Connecticut State
(Hispanic students)
63% 55% 65% 48% 58%
Difference +37% -2% +20% -3% +13% Table 5.c.3
2009 Connecticut Academic Performance Test 10th-Grade Students Percent of Students At or Above Proficiency
PR/Award # U282M100002 e13
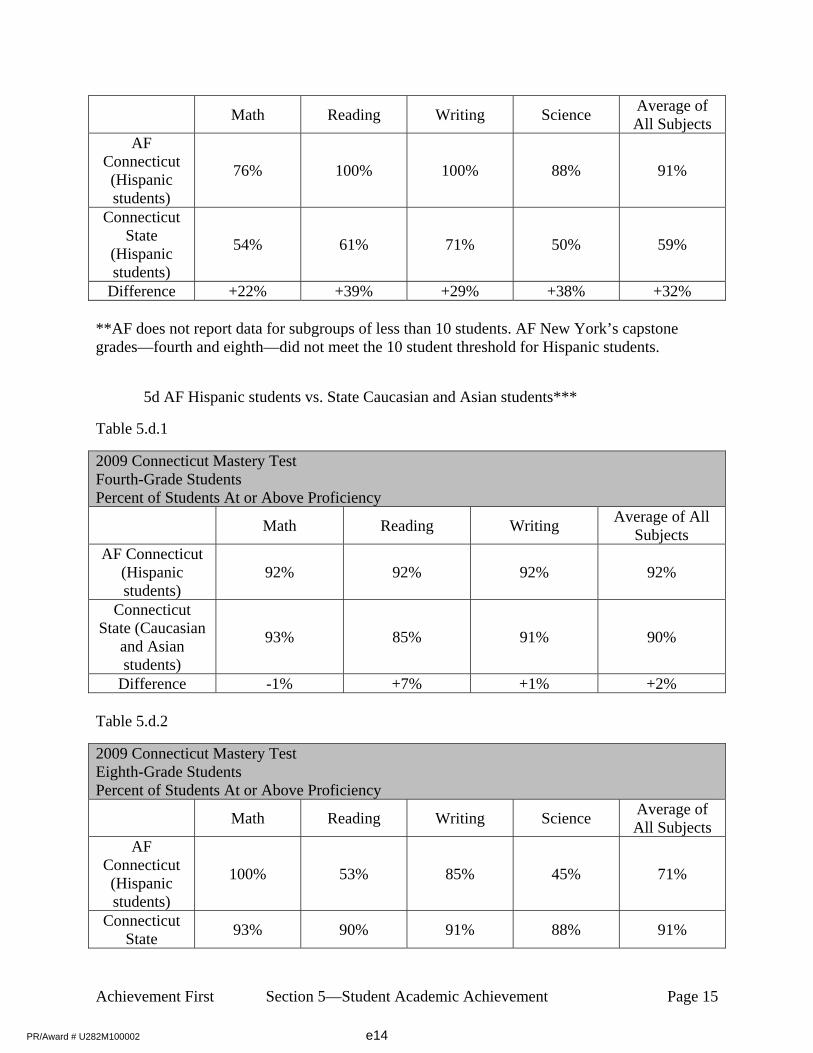
Achievement First Section 5—Student Academic Achievement Page 15
Math Reading Writing Science Average of All Subjects
AF Connecticut (Hispanic students)
76% 100% 100% 88% 91%
Connecticut State
(Hispanic students)
54% 61% 71% 50% 59%
Difference +22% +39% +29% +38% +32% **AF does not report data for subgroups of less than 10 students. AF New York’s capstone grades—fourth and eighth—did not meet the 10 student threshold for Hispanic students.
5d AF Hispanic students vs. State Caucasian and Asian students***
Table 5.d.1
2009 Connecticut Mastery Test Fourth-Grade Students Percent of Students At or Above Proficiency
Math Reading Writing Average of All
Subjects AF Connecticut
(Hispanic students)
92% 92% 92% 92%
Connecticut State (Caucasian
and Asian students)
93% 85% 91% 90%
Difference -1% +7% +1% +2% Table 5.d.2
2009 Connecticut Mastery Test Eighth-Grade Students Percent of Students At or Above Proficiency
Math Reading Writing Science Average of All Subjects
AF Connecticut (Hispanic students)
100% 53% 85% 45% 71%
Connecticut State
93% 90% 91% 88% 91%
PR/Award # U282M100002 e14

Achievement First Section 5—Student Academic Achievement Page 16
(Caucasian and Asian students)
Difference +7% -37% -6% -43% -20% Table 5.d.3
2009 Connecticut Academic Performance Test 10th-Grade Students Percent of Students At or Above Proficiency
Math Reading Writing Science Average of All Subjects
AF Connecticut (Hispanic students)
76% 100% 100% 88% 91%
Connecticut State
(Caucasian and Asian students)
89% 90% 93% 90% 91%
Difference -13% +10% +7% -2% 0% ***AF does not report data for subgroups of less than 10 students. AF New York’s capstone grades—fourth and eighth—did not meet the 10 student threshold for Hispanic students.
Section 6: Student Attendance
6.a. AF student attendance vs. state student attendance Table 6.a.1
2008-09 Student Attendance
AF
Network AF
ConnecticutConnecticut
State
Improvement of AF over Connecticut
AF New York
New York State
Improvement of AF over New York
Attendance 96% 97% N/A N/A 96% 93% +3%
6.b AF student attendance by school
Table 6.b.1
2008-09 Student Attendance School Attendance
AF Bridgeport Academy Middle 96% AF Hartford Academy Elementary 96%
PR/Award # U282M100002 e15

Achievement First Section 5—Student Academic Achievement Page 17
AF Hartford Academy Middle 95% Amistad Academy Elementary 96%
Amistad Academy Middle 97% Amistad-Elm City High 97%
Elm City College Preparatory Elementary 97% Elm City College Preparatory Middle 98%
AF Brownsville Elementary 95% AF Bushwick Elementary 96%
AF Bushwick Middle 97% AF Crown Heights Elementary 96%
AF Crown Heights Middle 94% AF East New York Elementary 96%
AF Endeavor Middle 95%
Category 7: Student Retention
7.a. AF student retention vs. state student retention
Table 7.a.1
2008-09 Student Retention
AF
Network AF
Connecticut Connecticut
State
Improvement of AF over Connecticut
AF New York
New York State
Improvement of AF over New York
Retention 90% 87% N/A N/A 92% N/A N/A
7.b AF student retention by school
Table 7.b.1
2008-09 Student Retention School Retention
AF Bridgeport Academy Middle 83% AF Hartford Academy Elementary 92%
AF Hartford Academy Middle 84% Amistad Academy Elementary 92%
Amistad Academy Middle 75% Amistad-Elm City High 86%
Elm City College Preparatory Elementary 97% Elm City College Preparatory Middle 84%
AF Brownsville Elementary 94% AF Bushwick Elementary 95%
AF Bushwick Middle 86% AF Crown Heights Elementary 96%
AF Crown Heights Middle 92%
PR/Award # U282M100002 e16
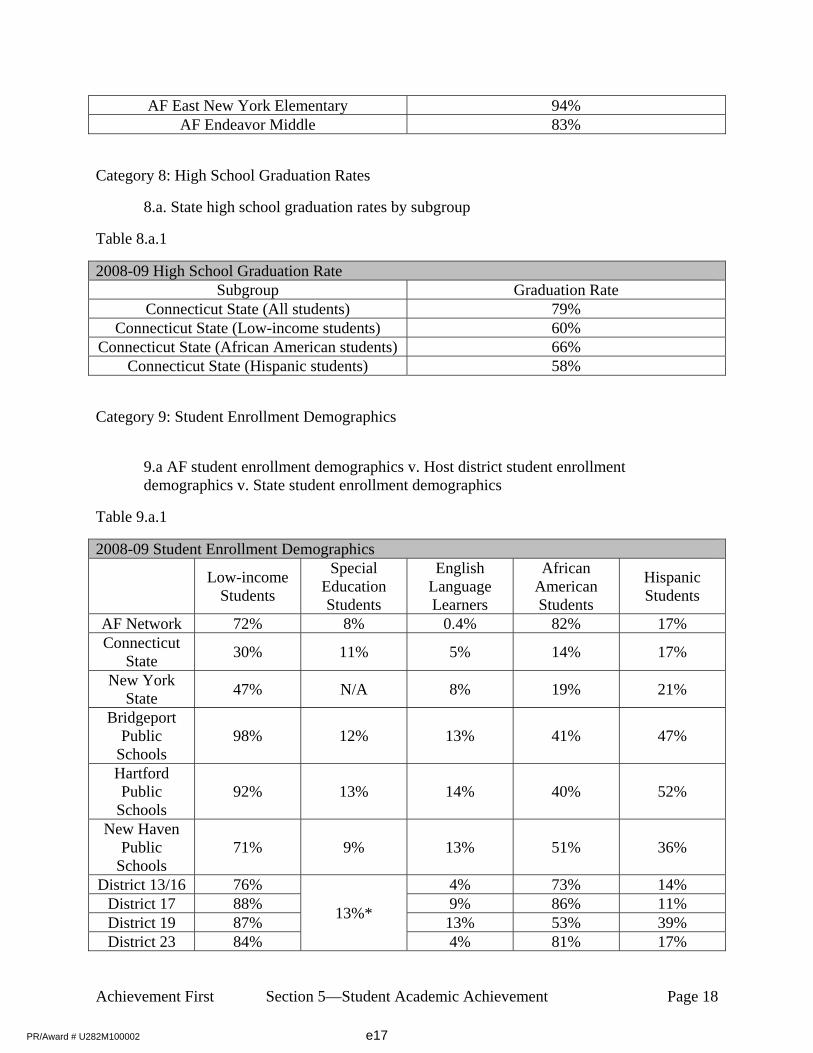
Achievement First Section 5—Student Academic Achievement Page 18
AF East New York Elementary 94% AF Endeavor Middle 83%
Category 8: High School Graduation Rates
8.a. State high school graduation rates by subgroup
Table 8.a.1
2008-09 High School Graduation Rate Subgroup Graduation Rate
Connecticut State (All students) 79% Connecticut State (Low-income students) 60%
Connecticut State (African American students) 66% Connecticut State (Hispanic students) 58%
Category 9: Student Enrollment Demographics
9.a AF student enrollment demographics v. Host district student enrollment demographics v. State student enrollment demographics
Table 9.a.1
2008-09 Student Enrollment Demographics
Low-income
Students
Special Education Students
English Language Learners
African American Students
Hispanic Students
AF Network 72% 8% 0.4% 82% 17% Connecticut
State 30% 11% 5% 14% 17%
New York State
47% N/A 8% 19% 21%
Bridgeport Public
Schools 98% 12% 13% 41% 47%
Hartford Public
Schools 92% 13% 14% 40% 52%
New Haven Public
Schools 71% 9% 13% 51% 36%
District 13/16 76%
13%*
4% 73% 14% District 17 88% 9% 86% 11% District 19 87% 13% 53% 39% District 23 84% 4% 81% 17%
PR/Award # U282M100002 e17

Achievement First Section 5—Student Academic Achievement Page 19
District 32 90% 18% 25% 71% *Special education enrollment data is not available for individual districts within New York City. Special education enrollment for New York City Public Schools in 2008-09 is used as a proxy.
PR/Award # U282M100002 e18

Project Narrative
Section 6 - Other Attachments: Supplemental Organizational Budgets and Financial Information
Attachment 1: Title: Achievement First CSP Grant Application Budgets Pages: 13 Uploaded File: CSP RE Grant Application Section 6 Budgets 100701.pdf
PR/Award # U282M100002 e149

Achievement First CSP Application
July 2010
Inputs
Budget Category Item Description Unit
Cost per unit project
year 1
Equipment Staff computers
Computers and software for new staff
seats New staff seats $1,200
Equipment Student computers
Computer labs for newly created
grades
3rd grade at elementary, 6th and
7th grade at middle, 10th and
11th grade at high schools
$20,000 for elementary,
$35,000 for middle and
high school
Equipment Other IT equipment
Peripheral equipment (printers,
scanners, projectors, smart boards) New staff seats $1,000
Supplies Furniture and Fixtures Furniture for use for new student seats New student seats $250
Supplies Curricula (textbooks)
Curricular materials (textbooks) for
new student seats New student seats
$500 for elementary,
$600 for middle and high
schools
Supplies Instructional supplies
Instructional supplies (paper, pencils,
non-electronic equipment) New student seats $180
Supplies Classroom libraries
Books for individual reading, kept in
classrooms New student seats $200
Budget Category Item
Description Unit Cost per unit project
year 1
School based expenses
Oversight/management expenses
Page 1 of 13
Budget Category Item year 1
Personnel
Professional development
staff salaries
Staff providing professional
development support to staff
New staff added each year of
growth plan
$85,000
Fringe benefits
Professional development
staff benefits
Taxes and benefits for professional
development staff
15% of salaries of new
professional development staff
added $12,750
Travel
Travel and lodging
expenses for new staff
training
Lodging and transportation expenses
for new staff training
Cost per new teacher attending
new staff training $500
Contractual
Contractual costs related
to new staff training
Costs related to logistics of new staff
training (facility rental, catering)
Cost per new teacher attending
new staff training $1,000
General assumptions
Inflation factor Annual rate: 3%
Project Year 1 Project Year 2 Project Year 3 Project Year 4 Project Year 5
1.000 1.030 1.061 1.093 1.126
Page 1 of 13Achievement First Section 6PR/Award # U282M100002 e0

Achievement First CSP Application
July 2010
School information
School Location
Year
launched
Expansion/
Replication
1 AF East New York Middle School Brooklyn, NY 2009-2010 Expansion
2 AF Crown Heights High School Brooklyn, NY 2009-2010 Expansion
3 AF Endeavor High School Brooklyn, NY 2010-2011 Replication
4 AF Bridgeport Elementary School Bridgeport, CT 2010-2011 Replication
5 AF Endeavor Elementary School Brooklyn, NY 2011-2012 Replication
6 AF Bushwick HS Brooklyn, NY 2011-2012 Replication
7 AF Aspire Elementary School Brooklyn, NY 2011-2012 Replication
8 AF Rhode Island Elementary School #1 Providence/Cranston, RI 2011-2012 Replication
9 AF Apollo Middle School Brooklyn, NY 2012-2013 Replication
10 AF Brownsville Middle School Brooklyn, NY 2012-2013 Replication
11 AF NY #8 Elementary School Brooklyn, NY 2012-2013 Replication
12 AF Rhode Island Elementary School #2 Providence/Cranston, RI 2012-2013 Replication
13 AF Aspire Middle School Brooklyn, NY 2013-2014 Replication
14 AF Rhode Island Middle School #1 Providence/Cranston, RI 2013-2014 Replication
15 AF NY #8 Middle School Brooklyn, NY 2014-2015 Replication
16 AF Rhode Island Middle School #2 Providence/Cranston, RI 2014-2015 Replication
Overview of Expansion/Replication Schools: Grades Served
Achievement First Expansion/Replication Schools: 2010-2015
School Project Year 1
Project
Year 2
Project
Year 3
Project
Year 4
Project
Year 5
1 AF East New York Middle School 5-6 5-7 5-8 5-8 5-8
2 AF Crown Heights High School 9-10 9-11 9-12 9-12 9-12
3 AF Endeavor High School 9 9-10 9-11 9-12 9-12
4 AF Bridgeport Elementary School K K-1 K-2 K-3 K-4
5 AF Endeavor Elementary School K-1 K-2 K-3 K-4
6 AF Bushwick HS 9 9-10 9-11 9-12
7 AF Aspire Elementary School K-1 K-2 K-3 K-4
8 AF Rhode Island Elementary School #1 K-1 K-2 K-3 K-4
9 AF Apollo Middle School 5 5-6 5-7
10 AF Brownsville Middle School 5 5-6 5-7
11 AF NY #8 Elementary School K-1 K-2 K-3
12 AF Rhode Island Elementary School #2 K-1 K-2 K-3
13 AF Aspire Middle School 5 5-6
14 AF Rhode Island Middle School #1 5 5-6
15 AF NY #8 Middle School 5
16 AF Rhode Island Middle School #2 5
School Project Year 1
Project
Year 2
Project
Year 3
Project
Year 4
Project
Year 5
1 AF East New York Middle School 171 249 321 321 321
2 AF Crown Heights High School 80 120 160 165 195
3 AF Endeavor High School 30 75 120 165 195
Overview of Expansion/Replication Schools: Grades Served
Overview of Expansion/Replication Schools: Enrollment
Page 2 of 13Achievement First Section 6PR/Award # U282M100002 e1

Achievement First CSP Application
July 2010
School information
4 AF Bridgeport Elementary School 85 176 262 342 416
5 AF Endeavor Elementary School 0 176 262 342 416
6 AF Bushwick HS 0 35 125 183 239
7 AF Aspire Elementary School 0 176 262 342 416
8 AF Rhode Island Elementary School #1 0 176 262 342 416
9 AF Apollo Middle School 0 0 88 171 249
10 AF Brownsville Middle School 0 0 88 171 249
11 AF NY #8 Elementary School 0 0 176 262 342
12 AF Rhode Island Elementary School #2 0 0 176 262 342
13 AF Aspire Middle School 0 0 0 88 171
14 AF Rhode Island Middle School #1 0 0 0 88 171
15 AF NY #8 Middle School 0 0 0 0 88
16 AF Rhode Island Middle School #2 0 0 0 0 88
Total 366 1,183 2,302 3,244 4,314
School Project Year 1
Project
Year 2
Project
Year 3
Project
Year 4
Project
Year 5
1 AF East New York Middle School 15 22 25 25 25
2 AF Crown Heights High School 8 14 17 17 17
3 AF Endeavor High School 3 9 14 17 17
4 AF Bridgeport Elementary School 8 16 21 28 33
5 AF Endeavor Elementary School 0 14 20 27 33
Overview of Expansion/Replication Schools: Teachers
5 AF Endeavor Elementary School 0 14 20 27 33
6 AF Bushwick HS 0 4 9 14 17
7 AF Aspire Elementary School 0 16 22 29 34
8 AF Rhode Island Elementary School #1 0 16 22 29 34
9 AF Apollo Middle School 0 0 7 15 22
10 AF Brownsville Middle School 0 0 7 15 22
11 AF NY #8 Elementary School 0 0 16 22 29
12 AF Rhode Island Elementary School #2 0 0 16 22 29
13 AF Aspire Middle School 0 0 0 7 15
14 AF Rhode Island Middle School #1 0 0 0 7 15
15 AF NY #8 Middle School 0 0 0 0 7
16 AF Rhode Island Middle School #2 0 0 0 0 7
Total 34 111 195 272 354
Page 3 of 13Achievement First Section 6PR/Award # U282M100002 e2

Achievement First CSP Application
July 2010
Enrollment and staffing information
Achievement First -- Overview of Expansion/Replication Schools
All schools
Project
Year 1
Project
Year 2
Project
Year 3
Project
Year 4
Project
Year 5
Additional students -- total 366 1,183 2,302 3,244 4,314
Additional students -- each year 238 817 1,119 943 1,070
Additional teachers -- total 34 111 195 272 354
Additional teachers -- each year 34 77 84 78 82
School
Project
Year 1
Project
Year 2
Project
Year 3
Project
Year 4
Project
Year 5
1. Achievement First East New York Middle School
Additional students -- total 171 249 321 321 321
Additional students -- each year 83 78 72 0 0
Additional teachers -- total 15 22 25 25 25
Additional teachers -- each year 15 7 3 0 0
School
Project
Year 1
Project
Year 2
Project
Year 3
Project
Year 4
Project
Year 5
2. Achievement First Crown Heights High School
Additional students -- total 80 120 160 165 195
Additional students -- each year 40 40 40 5 30Additional students -- each year 40 40 40 5 30
Additional teachers -- total 8 14 17 17 17
Additional teachers -- each year 8 6 3 0 0
School
Project
Year 1
Project
Year 2
Project
Year 3
Project
Year 4
Project
Year 5
3. Achievement First Endeavor High School
Additional students -- total 30 75 120 165 195
Additional students -- each year 30 45 45 45 30
Additional teachers -- total 3 9 14 17 17
Additional teachers -- each year 3 6 5 3 0
School
Project
Year 1
Project
Year 2
Project
Year 3
Project
Year 4
Project
Year 5
4. Achievement First Bridgeport Elementary School
Additional students -- total 85 176 262 342 416
Additional students -- each year 85 91 86 80 74
Additional teachers -- total 8 16 21 28 33
Additional teachers -- each year 8 8 5 7 5
School
Project
Year 1
Project
Year 2
Project
Year 3
Project
Year 4
Project
Year 5
5. Achievement First Endeavor Elementary School
Additional students -- total 0 176 262 342 416
Additional students -- each year 0 176 86 80 74
Additional teachers -- total 0 14 20 27 33
Additional teachers -- each year 0 14 6 7 6
Page 4 of 13Achievement First Section 6PR/Award # U282M100002 e3

Achievement First CSP Application
July 2010
Enrollment and staffing information
School
Project
Year 1
Project
Year 2
Project
Year 3
Project
Year 4
Project
Year 5
6. Achievement First Bushwick HS
Additional students -- total 0 35 125 183 239
Additional students -- each year 0 35 90 59 56
Additional teachers -- total 0 4 9 14 17
Additional teachers -- each year 0 4 5 5 3
School
Project
Year 1
Project
Year 2
Project
Year 3
Project
Year 4
Project
Year 5
7. Achievement First Aspire Elementary School
Additional students -- total 0 176 262 342 416
Additional students -- each year 0 176 86 80 74
Additional teachers -- total 0 16 22 29 34
Additional teachers -- each year 0 16 6 7 5
School
Project
Year 1
Project
Year 2
Project
Year 3
Project
Year 4
Project
Year 5
8. Achievement First Rhode Island Elementary School #1
Additional students -- total 0 176 262 342 416
Additional students -- each year 0 176 86 80 74
Additional teachers -- total 0 16 22 29 34
Additional students -- each year 0 176 86 80 74
Additional teachers -- total 0 16 22 29 34
Additional teachers -- each year 0 16 6 7 5
School
Project
Year 1
Project
Year 2
Project
Year 3
Project
Year 4
Project
Year 5
9. Achievement First Apollo Middle School
Additional students -- total 0 0 88 171 249
Additional students -- each year 0 0 88 83 78
Additional teachers -- total 0 0 7 15 22
Additional teachers -- each year 0 0 7 9 7
School
Project
Year 1
Project
Year 2
Project
Year 3
Project
Year 4
Project
Year 5
10. Achievement First Brownsville Middle School
Additional students -- total 0 0 88 171 249
Additional students -- each year 0 0 88 83 78
Additional teachers -- total 0 0 7 15 22
Additional teachers -- each year 0 0 7 9 7
School
Project
Year 1
Project
Year 2
Project
Year 3
Project
Year 4
Project
Year 5
11. Achievement First NY #8 Elementary School
Additional students -- total 0 0 176 262 342
Additional students -- each year 0 0 176 86 80
Additional teachers -- total 0 0 16 22 29
Additional teachers -- each year 0 0 16 6 7
Page 5 of 13Achievement First Section 6PR/Award # U282M100002 e4

Achievement First CSP Application
July 2010
Enrollment and staffing information
School
Project
Year 1
Project
Year 2
Project
Year 3
Project
Year 4
Project
Year 5
12. Achievement First Rhode Island Elementary School #2
Additional students -- total 0 0 176 262 342
Additional students -- each year 0 0 176 86 80
Additional teachers -- total 0 0 16 22 29
Additional teachers -- each year 0 0 16 6 7
School
Project
Year 1
Project
Year 2
Project
Year 3
Project
Year 4
Project
Year 5
13. Achievement First Aspire Middle School
Additional students -- total 0 0 0 88 171
Additional students -- each year 0 0 0 88 83
Additional teachers -- total 0 0 0 7 15
Additional teachers -- each year 0 0 0 7 9
School
Project
Year 1
Project
Year 2
Project
Year 3
Project
Year 4
Project
Year 5
14. Achievement First Rhode Island Middle School #1
Additional students -- total 0 0 0 88 171
Additional students -- each year 0 0 0 88 83
Additional teachers -- total 0 0 0 7 15
Additional students -- each year 0 0 0 88 83
Additional teachers -- total 0 0 0 7 15
Additional teachers -- each year 0 0 0 7 9
School
Project
Year 1
Project
Year 2
Project
Year 3
Project
Year 4
Project
Year 5
15. Achievement First NY #8 Middle School
Additional students -- total 0 0 0 0 88
Additional students -- each year 0 0 0 0 88
Additional teachers -- total 0 0 0 0 7
Additional teachers -- each year 0 0 0 0 7
School
Project
Year 1
Project
Year 2
Project
Year 3
Project
Year 4
Project
Year 5
16. Achievement First Rhode Island Middle School #2
Additional students -- total 0 0 0 0 88
Additional students -- each year 0 0 0 0 88
Additional teachers -- total 0 0 0 0 7
Additional teachers -- each year 0 0 0 0 7
Page 6 of 13Achievement First Section 6PR/Award # U282M100002 e5
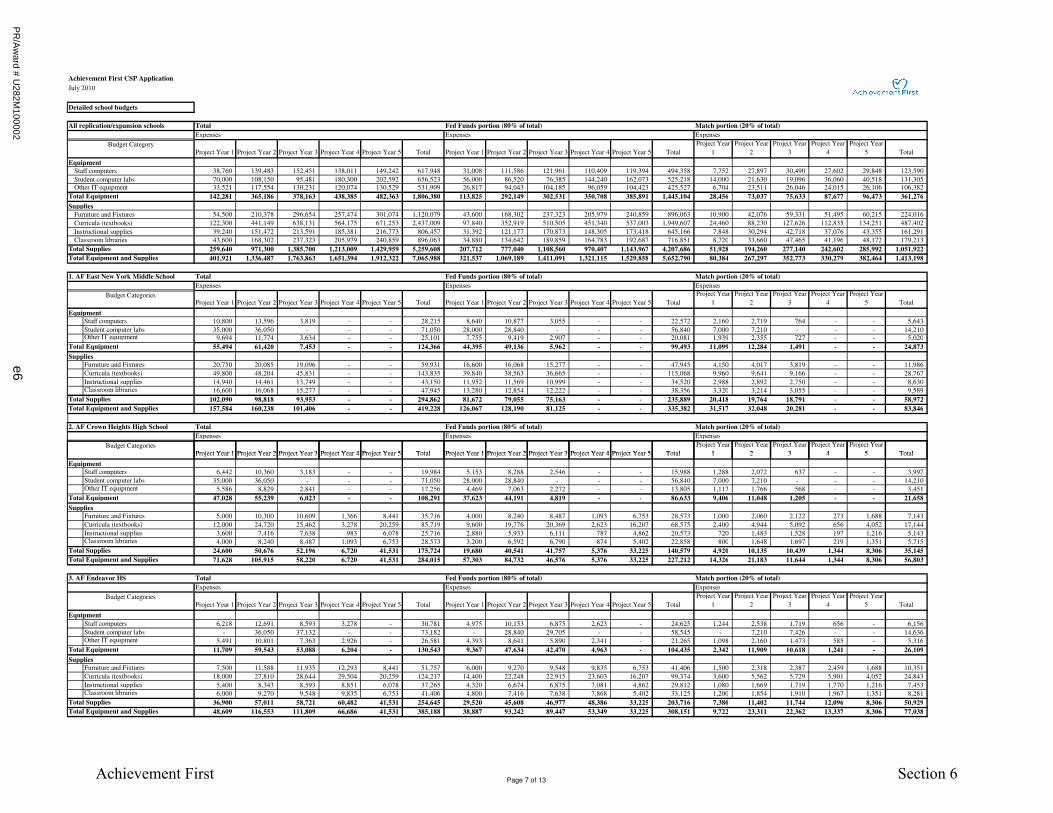
Achievement First CSP Application
July 2010
Detailed school budgets
All replication/expansion schools Total Fed Funds portion (80% of total) Match portion (20% of total)
Expenses Expenses Expenses
Project Year 1 Project Year 2 Project Year 3 Project Year 4 Project Year 5 Total Project Year 1 Project Year 2 Project Year 3 Project Year 4 Project Year 5 Total
Project Year
1
Project Year
2
Project Year
3
Project Year
4
Project Year
5 Total
Equipment
38,760 139,483 152,451 138,011 149,242 617,948 31,008 111,586 121,961 110,409 119,394 494,358 7,752 27,897 30,490 27,602 29,848 123,590
70,000 108,150 95,481 180,300 202,592 656,523 56,000 86,520 76,385 144,240 162,073 525,218 14,000 21,630 19,096 36,060 40,518 131,305 33,521 117,554 130,231 120,074 130,529 531,909 26,817 94,043 104,185 96,059 104,423 425,527 6,704 23,511 26,046 24,015 26,106 106,382
142,281 365,186 378,163 438,385 482,363 1,806,380 113,825 292,149 302,531 350,708 385,891 1,445,104 28,456 73,037 75,633 87,677 96,473 361,276
Supplies
54,500 210,378 296,654 257,474 301,074 1,120,079 43,600 168,302 237,323 205,979 240,859 896,063 10,900 42,076 59,331 51,495 60,215 224,016
122,300 441,149 638,131 564,175 671,253 2,437,009 97,840 352,919 510,505 451,340 537,003 1,949,607 24,460 88,230 127,626 112,835 134,251 487,402
39,240 151,472 213,591 185,381 216,773 806,457 31,392 121,177 170,873 148,305 173,418 645,166 7,848 30,294 42,718 37,076 43,355 161,291
43,600 168,302 237,323 205,979 240,859 896,063 34,880 134,642 189,859 164,783 192,687 716,851 8,720 33,660 47,465 41,196 48,172 179,213
259,640 971,300 1,385,700 1,213,009 1,429,959 5,259,608 207,712 777,040 1,108,560 970,407 1,143,967 4,207,686 51,928 194,260 277,140 242,602 285,992 1,051,922
401,921 1,336,487 1,763,863 1,651,394 1,912,322 7,065,988 321,537 1,069,189 1,411,091 1,321,115 1,529,858 5,652,790 80,384 267,297 352,773 330,279 382,464 1,413,198
1. AF East New York Middle School Total Fed Funds portion (80% of total) Match portion (20% of total)
Expenses Expenses Expenses
Project Year 1 Project Year 2 Project Year 3 Project Year 4 Project Year 5 Total Project Year 1 Project Year 2 Project Year 3 Project Year 4 Project Year 5 Total
Project Year
1
Project Year
2
Project Year
3
Project Year
4
Project Year
5 Total
Equipment
Staff computers 10,800 13,596 3,819 - - 28,215 8,640 10,877 3,055 - - 22,572 2,160 2,719 764 - - 5,643
Student computer labs 35,000 36,050 - - - 71,050 28,000 28,840 - - - 56,840 7,000 7,210 - - - 14,210 Other IT equipment 9,694 11,774 3,634 - - 25,101 7,755 9,419 2,907 - - 20,081 1,939 2,355 727 - - 5,020
55,494 61,420 7,453 - - 124,366 44,395 49,136 5,962 - - 99,493 11,099 12,284 1,491 - - 24,873
Supplies
Furniture and Fixtures 20,750 20,085 19,096 - - 59,931 16,600 16,068 15,277 - - 47,945 4,150 4,017 3,819 - - 11,986
Curricula (textbooks) 49,800 48,204 45,831 - - 143,835 39,840 38,563 36,665 - - 115,068 9,960 9,641 9,166 - - 28,767
Instructional supplies 14,940 14,461 13,749 - - 43,150 11,952 11,569 10,999 - - 34,520 2,988 2,892 2,750 - - 8,630 Classroom libraries 16,600 16,068 15,277 - - 47,945 13,280 12,854 12,222 - - 38,356 3,320 3,214 3,055 - - 9,589
102,090 98,818 93,953 - - 294,862 81,672 79,055 75,163 - - 235,889 20,418 19,764 18,791 - - 58,972
157,584 160,238 101,406 - - 419,228 126,067 128,190 81,125 - - 335,382 31,517 32,048 20,281 - - 83,846
2. AF Crown Heights High School Total Fed Funds portion (80% of total) Match portion (20% of total)
Expenses Expenses Expenses
Project Year 1 Project Year 2 Project Year 3 Project Year 4 Project Year 5 Total Project Year 1 Project Year 2 Project Year 3 Project Year 4 Project Year 5 Total
Project Year
1
Project Year
2
Project Year
3
Project Year
4
Project Year
5 Total
Budget Category
Total Supplies
Budget Categories
Total Supplies
Furniture and Fixtures
Total Equipment
Total Equipment
Total Equipment and Supplies
Classroom libraries
Staff computers
Student computer labsOther IT equipment
Curricula (textbooks)
Instructional supplies
Total Equipment and Supplies
Budget CategoriesProject Year 1 Project Year 2 Project Year 3 Project Year 4 Project Year 5 Total Project Year 1 Project Year 2 Project Year 3 Project Year 4 Project Year 5 Total 1 2 3 4 5 Total
Equipment
Staff computers 6,442 10,360 3,183 - - 19,984 5,153 8,288 2,546 - - 15,988 1,288 2,072 637 - - 3,997
Student computer labs 35,000 36,050 - - - 71,050 28,000 28,840 - - - 56,840 7,000 7,210 - - - 14,210 Other IT equipment 5,586 8,829 2,841 - - 17,256 4,469 7,063 2,272 - - 13,805 1,117 1,766 568 - - 3,451
47,028 55,239 6,023 - - 108,291 37,623 44,191 4,819 - - 86,633 9,406 11,048 1,205 - - 21,658
Supplies
Furniture and Fixtures 5,000 10,300 10,609 1,366 8,441 35,716 4,000 8,240 8,487 1,093 6,753 28,573 1,000 2,060 2,122 273 1,688 7,143
Curricula (textbooks) 12,000 24,720 25,462 3,278 20,259 85,719 9,600 19,776 20,369 2,623 16,207 68,575 2,400 4,944 5,092 656 4,052 17,144
Instructional supplies 3,600 7,416 7,638 983 6,078 25,716 2,880 5,933 6,111 787 4,862 20,573 720 1,483 1,528 197 1,216 5,143 Classroom libraries 4,000 8,240 8,487 1,093 6,753 28,573 3,200 6,592 6,790 874 5,402 22,858 800 1,648 1,697 219 1,351 5,715
24,600 50,676 52,196 6,720 41,531 175,724 19,680 40,541 41,757 5,376 33,225 140,579 4,920 10,135 10,439 1,344 8,306 35,145
71,628 105,915 58,220 6,720 41,531 284,015 57,303 84,732 46,576 5,376 33,225 227,212 14,326 21,183 11,644 1,344 8,306 56,803
3. AF Endeavor HS Total Fed Funds portion (80% of total) Match portion (20% of total)
Expenses Expenses Expenses
Project Year 1 Project Year 2 Project Year 3 Project Year 4 Project Year 5 Total Project Year 1 Project Year 2 Project Year 3 Project Year 4 Project Year 5 Total
Project Year
1
Project Year
2
Project Year
3
Project Year
4
Project Year
5 Total
Equipment
Staff computers 6,218 12,691 8,593 3,278 - 30,781 4,975 10,153 6,875 2,623 - 24,625 1,244 2,538 1,719 656 - 6,156
Student computer labs - 36,050 37,132 - - 73,182 - 28,840 29,705 - - 58,545 - 7,210 7,426 - - 14,636 Other IT equipment 5,491 10,801 7,363 2,926 - 26,581 4,393 8,641 5,890 2,341 - 21,265 1,098 2,160 1,473 585 - 5,316
11,709 59,543 53,088 6,204 - 130,543 9,367 47,634 42,470 4,963 - 104,435 2,342 11,909 10,618 1,241 - 26,109
Supplies
Furniture and Fixtures 7,500 11,588 11,935 12,293 8,441 51,757 6,000 9,270 9,548 9,835 6,753 41,406 1,500 2,318 2,387 2,459 1,688 10,351
Curricula (textbooks) 18,000 27,810 28,644 29,504 20,259 124,217 14,400 22,248 22,915 23,603 16,207 99,374 3,600 5,562 5,729 5,901 4,052 24,843
Instructional supplies 5,400 8,343 8,593 8,851 6,078 37,265 4,320 6,674 6,875 7,081 4,862 29,812 1,080 1,669 1,719 1,770 1,216 7,453 Classroom libraries 6,000 9,270 9,548 9,835 6,753 41,406 4,800 7,416 7,638 7,868 5,402 33,125 1,200 1,854 1,910 1,967 1,351 8,281
36,900 57,011 58,721 60,482 41,531 254,645 29,520 45,608 46,977 48,386 33,225 203,716 7,380 11,402 11,744 12,096 8,306 50,929
48,609 116,553 111,809 66,686 41,531 385,188 38,887 93,242 89,447 53,349 33,225 308,151 9,722 23,311 22,362 13,337 8,306 77,038
Budget Categories
Total Supplies
Total Supplies
Total Equipment and Supplies
Total Equipment and Supplies
Total Equipment
Total Equipment
Page 7 of 13Achievement First Section 6
PR
/Aw
ard # U282M
100002e6
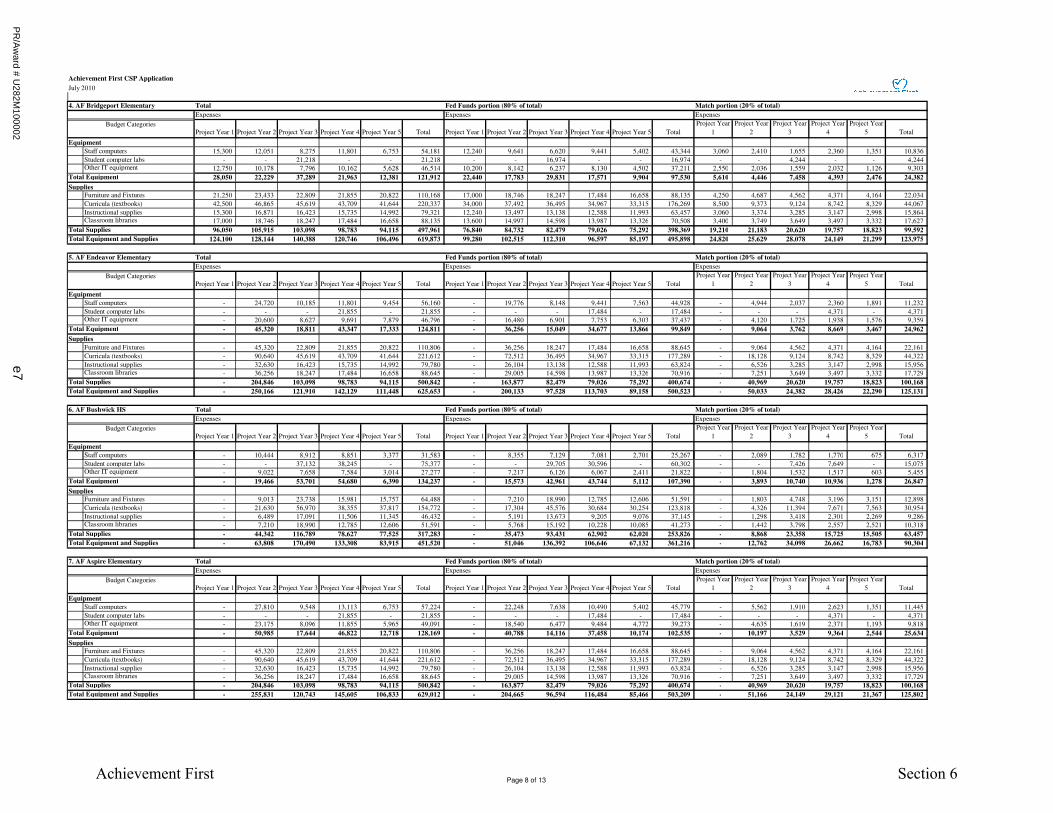
Achievement First CSP Application
July 2010
4. AF Bridgeport Elementary Total Fed Funds portion (80% of total) Match portion (20% of total)
Expenses Expenses Expenses
Project Year 1 Project Year 2 Project Year 3 Project Year 4 Project Year 5 Total Project Year 1 Project Year 2 Project Year 3 Project Year 4 Project Year 5 Total
Project Year
1
Project Year
2
Project Year
3
Project Year
4
Project Year
5 Total
Equipment
Staff computers 15,300 12,051 8,275 11,801 6,753 54,181 12,240 9,641 6,620 9,441 5,402 43,344 3,060 2,410 1,655 2,360 1,351 10,836
Student computer labs - - 21,218 - - 21,218 - - 16,974 - - 16,974 - - 4,244 - - 4,244 Other IT equipment 12,750 10,178 7,796 10,162 5,628 46,514 10,200 8,142 6,237 8,130 4,502 37,211 2,550 2,036 1,559 2,032 1,126 9,303
28,050 22,229 37,289 21,963 12,381 121,912 22,440 17,783 29,831 17,571 9,904 97,530 5,610 4,446 7,458 4,393 2,476 24,382
Supplies
Furniture and Fixtures 21,250 23,433 22,809 21,855 20,822 110,168 17,000 18,746 18,247 17,484 16,658 88,135 4,250 4,687 4,562 4,371 4,164 22,034
Curricula (textbooks) 42,500 46,865 45,619 43,709 41,644 220,337 34,000 37,492 36,495 34,967 33,315 176,269 8,500 9,373 9,124 8,742 8,329 44,067
Instructional supplies 15,300 16,871 16,423 15,735 14,992 79,321 12,240 13,497 13,138 12,588 11,993 63,457 3,060 3,374 3,285 3,147 2,998 15,864 Classroom libraries 17,000 18,746 18,247 17,484 16,658 88,135 13,600 14,997 14,598 13,987 13,326 70,508 3,400 3,749 3,649 3,497 3,332 17,627
96,050 105,915 103,098 98,783 94,115 497,961 76,840 84,732 82,479 79,026 75,292 398,369 19,210 21,183 20,620 19,757 18,823 99,592
124,100 128,144 140,388 120,746 106,496 619,873 99,280 102,515 112,310 96,597 85,197 495,898 24,820 25,629 28,078 24,149 21,299 123,975
5. AF Endeavor Elementary Total Fed Funds portion (80% of total) Match portion (20% of total)
Expenses Expenses Expenses
Project Year 1 Project Year 2 Project Year 3 Project Year 4 Project Year 5 Total Project Year 1 Project Year 2 Project Year 3 Project Year 4 Project Year 5 Total
Project Year
1
Project Year
2
Project Year
3
Project Year
4
Project Year
5 Total
Equipment
Staff computers - 24,720 10,185 11,801 9,454 56,160 - 19,776 8,148 9,441 7,563 44,928 - 4,944 2,037 2,360 1,891 11,232
Student computer labs - - - 21,855 - 21,855 - - - 17,484 - 17,484 - - - 4,371 - 4,371 Other IT equipment - 20,600 8,627 9,691 7,879 46,796 - 16,480 6,901 7,753 6,303 37,437 - 4,120 1,725 1,938 1,576 9,359
- 45,320 18,811 43,347 17,333 124,811 - 36,256 15,049 34,677 13,866 99,849 - 9,064 3,762 8,669 3,467 24,962
Supplies
Furniture and Fixtures - 45,320 22,809 21,855 20,822 110,806 - 36,256 18,247 17,484 16,658 88,645 - 9,064 4,562 4,371 4,164 22,161
Curricula (textbooks) - 90,640 45,619 43,709 41,644 221,612 - 72,512 36,495 34,967 33,315 177,289 - 18,128 9,124 8,742 8,329 44,322
Instructional supplies - 32,630 16,423 15,735 14,992 79,780 - 26,104 13,138 12,588 11,993 63,824 - 6,526 3,285 3,147 2,998 15,956 Classroom libraries - 36,256 18,247 17,484 16,658 88,645 - 29,005 14,598 13,987 13,326 70,916 - 7,251 3,649 3,497 3,332 17,729
- 204,846 103,098 98,783 94,115 500,842 - 163,877 82,479 79,026 75,292 400,674 - 40,969 20,620 19,757 18,823 100,168
- 250,166 121,910 142,129 111,448 625,653 - 200,133 97,528 113,703 89,158 500,523 - 50,033 24,382 28,426 22,290 125,131
6. AF Bushwick HS Total Fed Funds portion (80% of total) Match portion (20% of total)
Expenses Expenses Expenses
Project Year 1 Project Year 2 Project Year 3 Project Year 4 Project Year 5 Total Project Year 1 Project Year 2 Project Year 3 Project Year 4 Project Year 5 Total
Project Year
1
Project Year
2
Project Year
3
Project Year
4
Project Year
5 Total
Equipment
Staff computers - 10,444 8,912 8,851 3,377 31,583 - 8,355 7,129 7,081 2,701 25,267 - 2,089 1,782 1,770 675 6,317
Total Supplies
Budget Categories
Total Equipment
Budget Categories
Total Equipment and Supplies
Total Equipment and Supplies
Budget Categories
Total Equipment
Total Supplies
Staff computers - 10,444 8,912 8,851 3,377 31,583 - 8,355 7,129 7,081 2,701 25,267 - 2,089 1,782 1,770 675 6,317
Student computer labs - - 37,132 38,245 - 75,377 - - 29,705 30,596 - 60,302 - - 7,426 7,649 - 15,075 Other IT equipment - 9,022 7,658 7,584 3,014 27,277 - 7,217 6,126 6,067 2,411 21,822 - 1,804 1,532 1,517 603 5,455
- 19,466 53,701 54,680 6,390 134,237 - 15,573 42,961 43,744 5,112 107,390 - 3,893 10,740 10,936 1,278 26,847
Supplies
Furniture and Fixtures - 9,013 23,738 15,981 15,757 64,488 - 7,210 18,990 12,785 12,606 51,591 - 1,803 4,748 3,196 3,151 12,898
Curricula (textbooks) - 21,630 56,970 38,355 37,817 154,772 - 17,304 45,576 30,684 30,254 123,818 - 4,326 11,394 7,671 7,563 30,954
Instructional supplies - 6,489 17,091 11,506 11,345 46,432 - 5,191 13,673 9,205 9,076 37,145 - 1,298 3,418 2,301 2,269 9,286 Classroom libraries - 7,210 18,990 12,785 12,606 51,591 - 5,768 15,192 10,228 10,085 41,273 - 1,442 3,798 2,557 2,521 10,318
- 44,342 116,789 78,627 77,525 317,283 - 35,473 93,431 62,902 62,020 253,826 - 8,868 23,358 15,725 15,505 63,457
- 63,808 170,490 133,308 83,915 451,520 - 51,046 136,392 106,646 67,132 361,216 - 12,762 34,098 26,662 16,783 90,304
7. AF Aspire Elementary Total Fed Funds portion (80% of total) Match portion (20% of total)
Expenses Expenses Expenses
Project Year 1 Project Year 2 Project Year 3 Project Year 4 Project Year 5 Total Project Year 1 Project Year 2 Project Year 3 Project Year 4 Project Year 5 Total
Project Year
1
Project Year
2
Project Year
3
Project Year
4
Project Year
5 Total
Equipment
Staff computers - 27,810 9,548 13,113 6,753 57,224 - 22,248 7,638 10,490 5,402 45,779 - 5,562 1,910 2,623 1,351 11,445
Student computer labs - - - 21,855 - 21,855 - - - 17,484 - 17,484 - - - 4,371 - 4,371 Other IT equipment - 23,175 8,096 11,855 5,965 49,091 - 18,540 6,477 9,484 4,772 39,273 - 4,635 1,619 2,371 1,193 9,818
- 50,985 17,644 46,822 12,718 128,169 - 40,788 14,116 37,458 10,174 102,535 - 10,197 3,529 9,364 2,544 25,634
Supplies
Furniture and Fixtures - 45,320 22,809 21,855 20,822 110,806 - 36,256 18,247 17,484 16,658 88,645 - 9,064 4,562 4,371 4,164 22,161
Curricula (textbooks) - 90,640 45,619 43,709 41,644 221,612 - 72,512 36,495 34,967 33,315 177,289 - 18,128 9,124 8,742 8,329 44,322
Instructional supplies - 32,630 16,423 15,735 14,992 79,780 - 26,104 13,138 12,588 11,993 63,824 - 6,526 3,285 3,147 2,998 15,956 Classroom libraries - 36,256 18,247 17,484 16,658 88,645 - 29,005 14,598 13,987 13,326 70,916 - 7,251 3,649 3,497 3,332 17,729
- 204,846 103,098 98,783 94,115 500,842 - 163,877 82,479 79,026 75,292 400,674 - 40,969 20,620 19,757 18,823 100,168
- 255,831 120,743 145,605 106,833 629,012 - 204,665 96,594 116,484 85,466 503,209 - 51,166 24,149 29,121 21,367 125,802
Total Supplies
Total Equipment and Supplies
Total Equipment and Supplies
Budget Categories
Total Supplies
Total Equipment
Total Equipment
Page 8 of 13Achievement First Section 6
PR
/Aw
ard # U282M
100002e7

Achievement First CSP Application
July 2010
8. AF Rhode Island Elementary 1 Total Fed Funds portion (80% of total) Match portion (20% of total)
Expenses Expenses Expenses
Project Year 1 Project Year 2 Project Year 3 Project Year 4 Project Year 5 Total Project Year 1 Project Year 2 Project Year 3 Project Year 4 Project Year 5 Total
Project Year
1
Project Year
2
Project Year
3
Project Year
4
Project Year
5 Total
Equipment
Staff computers - 27,810 9,548 13,113 6,753 57,224 - 22,248 7,638 10,490 5,402 45,779 - 5,562 1,910 2,623 1,351 11,445
Student computer labs - - - 21,855 - 21,855 - - - 17,484 - 17,484 - - - 4,371 - 4,371 Other IT equipment - 23,175 8,096 11,855 5,965 49,091 - 18,540 6,477 9,484 4,772 39,273 - 4,635 1,619 2,371 1,193 9,818
- 50,985 17,644 46,822 12,718 128,169 - 40,788 14,116 37,458 10,174 102,535 - 10,197 3,529 9,364 2,544 25,634
Supplies
Furniture and Fixtures - 45,320 22,809 21,855 20,822 110,806 - 36,256 18,247 17,484 16,658 88,645 - 9,064 4,562 4,371 4,164 22,161
Curricula (textbooks) - 90,640 45,619 43,709 41,644 221,612 - 72,512 36,495 34,967 33,315 177,289 - 18,128 9,124 8,742 8,329 44,322
Instructional supplies - 32,630 16,423 15,735 14,992 79,780 - 26,104 13,138 12,588 11,993 63,824 - 6,526 3,285 3,147 2,998 15,956 Classroom libraries - 36,256 18,247 17,484 16,658 88,645 - 29,005 14,598 13,987 13,326 70,916 - 7,251 3,649 3,497 3,332 17,729
- 204,846 103,098 98,783 94,115 500,842 - 163,877 82,479 79,026 75,292 400,674 - 40,969 20,620 19,757 18,823 100,168
- 255,831 120,743 145,605 106,833 629,012 - 204,665 96,594 116,484 85,466 503,209 - 51,166 24,149 29,121 21,367 125,802
9. AF Apollo Middle Total Fed Funds portion (80% of total) Match portion (20% of total)
Expenses Expenses Expenses
Project Year 1 Project Year 2 Project Year 3 Project Year 4 Project Year 5 Total Project Year 1 Project Year 2 Project Year 3 Project Year 4 Project Year 5 Total
Project Year
1
Project Year
2
Project Year
3
Project Year
4
Project Year
5 Total
Equipment
Staff computers - - 16,550 11,146 15,532 43,228 - - 13,240 8,917 12,426 34,582 - - 3,310 2,229 3,106 8,646
Student computer labs - - - 38,245 39,393 77,638 - - - 30,596 31,514 62,111 - - - 7,649 7,879 15,528 Other IT equipment - - 14,190 10,046 13,428 37,664 - - 11,352 8,037 10,742 30,131 - - 2,838 2,009 2,686 7,533
- - 30,740 59,438 68,353 158,530 - - 24,592 47,550 54,682 126,824 - - 6,148 11,888 13,671 31,706
Supplies
Furniture and Fixtures - - 23,340 22,674 21,947 67,961 - - 18,672 18,139 17,558 54,369 - - 4,668 4,535 4,389 13,592
Curricula (textbooks) - - 56,016 54,418 52,674 163,107 - - 44,812 43,534 42,139 130,486 - - 11,203 10,884 10,535 32,621
Instructional supplies - - 16,805 16,325 15,802 48,932 - - 13,444 13,060 12,642 39,146 - - 3,361 3,265 3,160 9,786 Classroom libraries - - 18,672 18,139 17,558 54,369 - - 14,937 14,511 14,046 43,495 - - 3,734 3,628 3,512 10,874
- - 114,832 111,556 107,981 334,370 - - 91,865 89,245 86,385 267,496 - - 22,966 22,311 21,596 66,874
- - 145,572 170,994 176,334 492,900 - - 116,457 136,795 141,067 394,320 - - 29,114 34,199 35,267 98,580
10. AF Brownsville Middle Total Fed Funds portion (80% of total) Match portion (20% of total)
Expenses Expenses Expenses
Project Year 1 Project Year 2 Project Year 3 Project Year 4 Project Year 5 Total Project Year 1 Project Year 2 Project Year 3 Project Year 4 Project Year 5 Total
Project Year
1
Project Year
2
Project Year
3
Project Year
4
Project Year
5 Total
Equipment
Staff computers - - 16,550 11,146 15,532 43,228 - - 13,240 8,917 12,426 34,582 - - 3,310 2,229 3,106 8,646
Student computer labs - - - 38,245 39,393 77,638 - - - 30,596 31,514 62,111 - - - 7,649 7,879 15,528
Budget Categories
Budget Categories
Total Supplies
Total Equipment and Supplies
Budget Categories
Total Supplies
Total Equipment and Supplies
Total Equipment
Total Equipment
Student computer labs - - - 38,245 39,393 77,638 - - - 30,596 31,514 62,111 - - - 7,649 7,879 15,528 Other IT equipment - - 14,190 10,046 13,428 37,664 - - 11,352 8,037 10,742 30,131 - - 2,838 2,009 2,686 7,533
- - 30,740 59,438 68,353 158,530 - - 24,592 47,550 54,682 126,824 - - 6,148 11,888 13,671 31,706
Supplies
Furniture and Fixtures - - 23,340 22,674 21,947 67,961 - - 18,672 18,139 17,558 54,369 - - 4,668 4,535 4,389 13,592
Curricula (textbooks) - - 56,016 54,418 52,674 163,107 - - 44,812 43,534 42,139 130,486 - - 11,203 10,884 10,535 32,621
Instructional supplies - - 16,805 16,325 15,802 48,932 - - 13,444 13,060 12,642 39,146 - - 3,361 3,265 3,160 9,786 Classroom libraries - - 18,672 18,139 17,558 54,369 - - 14,937 14,511 14,046 43,495 - - 3,734 3,628 3,512 10,874
- - 114,832 111,556 107,981 334,370 - - 91,865 89,245 86,385 267,496 - - 22,966 22,311 21,596 66,874
- - 145,572 170,994 176,334 492,900 - - 116,457 136,795 141,067 394,320 - - 29,114 34,199 35,267 98,580
11. NY Elem #8 Total Fed Funds portion (80% of total) Match portion (20% of total)
Expenses Expenses Expenses
Project Year 1 Project Year 2 Project Year 3 Project Year 4 Project Year 5 Total Project Year 1 Project Year 2 Project Year 3 Project Year 4 Project Year 5 Total
Project Year
1
Project Year
2
Project Year
3
Project Year
4
Project Year
5 Total
Equipment
Staff computers - - 28,644 9,835 13,506 51,985 - - 22,915 7,868 10,805 41,588 - - 5,729 1,967 2,701 10,397
Student computer labs - - - - 22,510 22,510 - - - - 18,008 18,008 - - - - 4,502 4,502 Other IT equipment - - 23,870 8,339 12,210 44,420 - - 19,096 6,671 9,768 35,536 - - 4,774 1,668 2,442 8,884
- - 52,515 18,174 48,227 118,915 - - 42,012 14,539 38,581 95,132 - - 10,503 3,635 9,645 23,783
Supplies
Furniture and Fixtures - - 46,680 23,494 22,510 92,683 - - 37,344 18,795 18,008 74,147 - - 9,336 4,699 4,502 18,537
Curricula (textbooks) - - 93,359 46,987 45,020 185,367 - - 74,687 37,590 36,016 148,293 - - 18,672 9,397 9,004 37,073
Instructional supplies - - 33,609 16,915 16,207 66,732 - - 26,887 13,532 12,966 53,386 - - 6,722 3,383 3,241 13,346 Classroom libraries - - 37,344 18,795 18,008 74,147 - - 29,875 15,036 14,407 59,317 - - 7,469 3,759 3,602 14,829
- - 210,992 106,191 101,746 418,929 - - 168,793 84,953 81,397 335,143 - - 42,198 21,238 20,349 83,786
- - 263,506 124,365 149,973 537,844 - - 210,805 99,492 119,978 430,275 - - 52,701 24,873 29,995 107,569 Total Equipment and Supplies
Budget Categories
Total Supplies
Total Equipment and Supplies
Total Equipment
Total Equipment
Total Supplies
Page 9 of 13Achievement First Section 6
PR
/Aw
ard # U282M
100002e8

Achievement First CSP Application
July 2010
12. AF Rhode Island Elementary 2 Total Fed Funds portion (80% of total) Match portion (20% of total)
Expenses Expenses Expenses
Project Year 1 Project Year 2 Project Year 3 Project Year 4 Project Year 5 Total Project Year 1 Project Year 2 Project Year 3 Project Year 4 Project Year 5 Total
Project Year
1
Project Year
2
Project Year
3
Project Year
4
Project Year
5 Total
Equipment
Staff computers - - 28,644 9,835 13,506 51,985 - - 22,915 7,868 10,805 41,588 - - 5,729 1,967 2,701 10,397
Student computer labs - - - - 22,510 22,510 - - - - 18,008 18,008 - - - - 4,502 4,502 Other IT equipment - - 23,870 8,339 12,210 44,420 - - 19,096 6,671 9,768 35,536 - - 4,774 1,668 2,442 8,884
- - 52,515 18,174 48,227 118,915 - - 42,012 14,539 38,581 95,132 - - 10,503 3,635 9,645 23,783
Supplies
Furniture and Fixtures - - 46,680 23,494 22,510 92,683 - - 37,344 18,795 18,008 74,147 - - 9,336 4,699 4,502 18,537
Curricula (textbooks) - - 93,359 46,987 45,020 185,367 - - 74,687 37,590 36,016 148,293 - - 18,672 9,397 9,004 37,073
Instructional supplies - - 33,609 16,915 16,207 66,732 - - 26,887 13,532 12,966 53,386 - - 6,722 3,383 3,241 13,346 Classroom libraries - - 37,344 18,795 18,008 74,147 - - 29,875 15,036 14,407 59,317 - - 7,469 3,759 3,602 14,829
- - 210,992 106,191 101,746 418,929 - - 168,793 84,953 81,397 335,143 - - 42,198 21,238 20,349 83,786
- - 263,506 124,365 149,973 537,844 - - 210,805 99,492 119,978 430,275 - - 52,701 24,873 29,995 107,569
13. AF Aspire Middle Total Fed Funds portion (80% of total) Match portion (20% of total)
Expenses Expenses Expenses
Project Year 1 Project Year 2 Project Year 3 Project Year 4 Project Year 5 Total Project Year 1 Project Year 2 Project Year 3 Project Year 4 Project Year 5 Total
Project Year
1
Project Year
2
Project Year
3
Project Year
4
Project Year
5 Total
Equipment
Staff computers - - - 17,047 11,480 28,527 - - - 13,637 9,184 22,821 - - - 3,409 2,296 5,705
Student computer labs - - - - 39,393 39,393 - - - - 31,514 31,514 - - - - 7,879 7,879 Other IT equipment - - - 14,615 10,348 24,963 - - - 11,692 8,278 19,971 - - - 2,923 2,070 4,993
- - - 31,662 61,221 92,883 - - - 25,330 48,977 74,306 - - - 6,332 12,244 18,577
Supplies
Furniture and Fixtures - - - 24,040 23,354 47,394 - - - 19,232 18,683 37,915 - - - 4,808 4,671 9,479
Curricula (textbooks) - - - 57,696 56,050 113,746 - - - 46,157 44,840 90,997 - - - 11,539 11,210 22,749
Instructional supplies - - - 17,309 16,815 34,124 - - - 13,847 13,452 27,299 - - - 3,462 3,363 6,825 Classroom libraries - - - 19,232 18,683 37,915 - - - 15,386 14,947 30,332 - - - 3,846 3,737 7,583
- - - 118,277 114,903 233,180 - - - 94,621 91,923 186,544 - - - 23,655 22,981 46,636
- - - 149,939 176,124 326,063 - - - 119,951 140,899 260,850 - - - 29,988 35,225 65,213
14. AF Rhode Island MS #1 Total Fed Funds portion (80% of total) Match portion (20% of total)
Expenses Expenses Expenses
Project Year 1 Project Year 2 Project Year 3 Project Year 4 Project Year 5 Total Project Year 1 Project Year 2 Project Year 3 Project Year 4 Project Year 5 Total
Project Year
1
Project Year
2
Project Year
3
Project Year
4
Project Year
5 Total
Equipment
Staff computers - - - 17,047 11,480 28,527 - - - 13,637 9,184 22,821 - - - 3,409 2,296 5,705
Student computer labs - - - - 39,393 39,393 - - - - 31,514 31,514 - - - - 7,879 7,879
Total Equipment and Supplies
Total Equipment and Supplies
Budget Categories
Total Supplies
Total Equipment
Total Equipment
Budget Categories
Total Supplies
Budget Categories
Student computer labs - - - - 39,393 39,393 - - - - 31,514 31,514 - - - - 7,879 7,879 Other IT equipment - - - 14,615 10,348 24,963 - - - 11,692 8,278 19,971 - - - 2,923 2,070 4,993
- - - 31,662 61,221 92,883 - - - 25,330 48,977 74,306 - - - 6,332 12,244 18,577
Supplies
Furniture and Fixtures - - - 24,040 23,354 47,394 - - - 19,232 18,683 37,915 - - - 4,808 4,671 9,479
Curricula (textbooks) - - - 57,696 56,050 113,746 - - - 46,157 44,840 90,997 - - - 11,539 11,210 22,749
Instructional supplies - - - 17,309 16,815 34,124 - - - 13,847 13,452 27,299 - - - 3,462 3,363 6,825 Classroom libraries - - - 19,232 18,683 37,915 - - - 15,386 14,947 30,332 - - - 3,846 3,737 7,583
- - - 118,277 114,903 233,180 - - - 94,621 91,923 186,544 - - - 23,655 22,981 46,636
- - - 149,939 176,124 326,063 - - - 119,951 140,899 260,850 - - - 29,988 35,225 65,213
15. NY Middle #8 Total Fed Funds portion (80% of total) Match portion (20% of total)
Expenses Expenses Expenses
Project Year 1 Project Year 2 Project Year 3 Project Year 4 Project Year 5 Total Project Year 1 Project Year 2 Project Year 3 Project Year 4 Project Year 5 Total
Project Year
1
Project Year
2
Project Year
3
Project Year
4
Project Year
5 Total
Equipment
Staff computers - - - - 17,558 17,558 - - - - 14,046 14,046 - - - - 3,512 3,512
Student computer labs - - - - - - - - - - - - - - - - - - Other IT equipment - - - - 15,054 15,054 - - - - 12,043 12,043 - - - - 3,011 3,011
- - - - 32,612 32,612 - - - - 26,089 26,089 - - - - 6,522 6,522
Supplies
Furniture and Fixtures - - - - 24,761 24,761 - - - - 19,809 19,809 - - - - 4,952 4,952
Curricula (textbooks) - - - - 59,427 59,427 - - - - 47,541 47,541 - - - - 11,885 11,885
Instructional supplies - - - - 17,828 17,828 - - - - 14,262 14,262 - - - - 3,566 3,566 Classroom libraries - - - - 19,809 19,809 - - - - 15,847 15,847 - - - - 3,962 3,962
- - - - 121,825 121,825 - - - - 97,460 97,460 - - - - 24,365 24,365
- - - - 154,437 154,437 - - - - 123,550 123,550 - - - - 30,887 30,887
Total Supplies
Budget Categories
Total Supplies
Total Equipment
Total Equipment
Total Equipment and Supplies
Total Equipment and Supplies
Page 10 of 13Achievement First Section 6
PR
/Aw
ard # U282M
100002e9

Achievement First CSP Application
July 2010
16. AF Rhode Island MS #2 Total Fed Funds portion (80% of total) Match portion (20% of total)
Expenses Expenses Expenses
Project Year 1 Project Year 2 Project Year 3 Project Year 4 Project Year 5 Total Project Year 1 Project Year 2 Project Year 3 Project Year 4 Project Year 5 Total
Project Year
1
Project Year
2
Project Year
3
Project Year
4
Project Year
5 Total
Equipment
Staff computers - - - - 17,558 17,558 - - - - 14,046 14,046 - - - - 3,512 3,512
Student computer labs - - - - - - - - - - - - - - - - - - Other IT equipment - - - - 15,054 15,054 - - - - 12,043 12,043 - - - - 3,011 3,011
- - - - 32,612 32,612 - - - - 26,089 26,089 - - - - 6,522 6,522
Supplies
Furniture and Fixtures - - - - 24,761 24,761 - - - - 19,809 19,809 - - - - 4,952 4,952
Curricula (textbooks) - - - - 59,427 59,427 - - - - 47,541 47,541 - - - - 11,885 11,885
Instructional supplies - - - - 17,828 17,828 - - - - 14,262 14,262 - - - - 3,566 3,566 Classroom libraries - - - - 19,809 19,809 - - - - 15,847 15,847 - - - - 3,962 3,962
- - - - 121,825 121,825 - - - - 97,460 97,460 - - - - 24,365 24,365
- - - - 154,437 154,437 - - - - 123,550 123,550 - - - - 30,887 30,887
Total Supplies
Total Equipment
Total Equipment and Supplies
Budget Categories
Page 11 of 13Achievement First Section 6
PR
/Aw
ard # U282M
100002e10

Achievement First CSP Application
July 2010
Detailed Network Support Budget
Budget Categories
Project Year
1
Project Year
2
Project Year
3
Project Year
4
Project Year
5 Total
Personnel 21,250 148,835 180,353 185,764 95,668 631,870
Fringe Benefits 3,188 22,325 27,053 27,865 14,350 94,780
Travel 34,000 79,310 88,585 84,686 91,729 378,310 Contractual 40,800 95,172 106,302 101,624 110,075 453,973
Total 99,238 345,642 402,293 399,938 311,822 1,558,933
Budget Categories
Project Year
1
Project Year
2
Project Year
3
Project Year
4
Project Year
5 Total
Personnel 16,997 119,048 144,258 148,586 76,522 505,412
Fringe Benefits 2,550 17,857 21,639 22,288 11,478 75,812
Travel 27,195 63,437 70,856 67,738 73,371 302,598 Contractual 32,635 76,125 85,028 81,285 88,045 363,118
Total 79,377 276,468 321,781 319,897 249,416 1,246,939
Budget Categories
Project Year
1
Project Year
2
Project Year
3
Project Year
4
Project Year
5 Total
Total Network Support Expansion/Replication Costs
Portion of Network Support Expansion/Replication Costs Included in Project (15% of Total Project)
Fed Funds portion (80% of amount included)
Page 12 of 13
Budget Categories 1 2 3 4 5 Total
Personnel 13,598 95,239 115,407 118,869 61,217 404,329
Fringe Benefits 2,040 14,286 17,311 17,830 9,183 60,649
Travel 21,756 50,750 56,685 54,190 58,697 242,078 Contractual 26,108 60,900 68,022 65,028 70,436 290,494
Total 63,501 221,174 257,425 255,918 199,533 997,551
Budget Categories
Project Year
1
Project Year
2
Project Year
3
Project Year
4
Project Year
5 Total
Personnel 3,399 23,810 28,852 29,717 15,304 101,082
Fringe Benefits 510 3,571 4,328 4,458 2,296 15,162
Travel 5,439 12,687 14,171 13,548 14,674 60,520 Contractual 6,527 15,225 17,006 16,257 17,609 72,624
Total 15,875 55,294 64,356 63,979 49,883 249,388
Budget Categories
Project Year
1
Project Year
2
Project Year
3
Project Year
4
Project Year
5 Total
Personnel 4,253 29,787 36,095 37,177 19,146 126,458
Fringe Benefits 638 4,468 5,414 5,577 2,872 18,969
Travel 6,805 15,873 17,729 16,949 18,358 75,712 Contractual 8,165 19,047 21,275 20,338 22,030 90,855
Total 19,861 69,174 80,512 80,041 62,406 311,994
Match portion (20% of amount included)
Portion from other sources
Page 12 of 13Achievement First Section 6PR/Award # U282M100002 e11

Achievement First CSP Application
July 2010
Detailed Network Support Budget
Project Year
1
Project Year
2
Project Year
3
Project Year
4
Project Year
5 Total
16,997 119,048 144,258 148,586 76,522 505,412
2,550 17,857 21,639 22,288 11,478 75,812
27,195 63,437 70,856 67,738 73,371 302,598
142,281 365,186 378,163 438,385 482,363 1,806,380
259,640 971,300 1,385,700 1,213,009 1,429,959 5,259,608 32,635 76,125 85,028 81,285 88,045 363,118
481,298 1,612,954 2,085,644 1,971,291 2,161,738 8,312,927
Project Year
1
Project Year
2
Project Year
3
Project Year
4
Project Year
5 Total
13,598 95,239 115,407 118,869 61,217 404,329
2,040 14,286 17,311 17,830 9,183 60,649
21,756 50,750 56,685 54,190 58,697 242,078
113,825 292,149 302,531 350,708 385,891 1,445,104
207,712 777,040 1,108,560 970,407 1,143,967 4,207,686 26,108 60,900 68,022 65,028 70,436 290,494
385,038 1,290,364 1,668,515 1,577,033 1,729,391 6,650,341
Personnel
Fringe Benefits
Travel
Total Costs
Supplies
Contractual
Budget Categories
Total Project Costs
Federal Funds Portion of Project Costs (80% of total)
Equipment
Equipment
Budget Categories
Personnel
Fringe Benefits
Travel
Supplies
Contractual
Total Costs
Page 13 of 13
385,038 1,290,364 1,668,515 1,577,033 1,729,391 6,650,341
Project Year
1
Project Year
2
Project Year
3
Project Year
4
Project Year
5 Total
3,399 23,810 28,852 29,717 15,304 101,082
510 3,571 4,328 4,458 2,296 15,162
5,439 12,687 14,171 13,548 14,674 60,520
28,456 73,037 75,633 87,677 96,473 361,276
51,928 194,260 277,140 242,602 285,992 1,051,922 6,527 15,225 17,006 16,257 17,609 72,624
96,260 322,591 417,129 394,258 432,348 1,662,585
Travel
Total Costs
Supplies
Contractual
Equipment
Fringe Benefits
Total Costs
Budget Categories
Personnel
Match portion (20% of total, 25% of federal portion)
Page 13 of 13Achievement First Section 6PR/Award # U282M100002 e12
Project Narrative
Section 7 - Other Attachments: Additional Information
Attachment 1: Title: Achievement First CSP Grant Application Board of Directors Pages: 2 Uploaded File: CSP RE Grant Application Board of Directors 100701.pdf
PR/Award # U282M100002 e163

Achievement First Board of Directors Page 1
Achievement First: Replicating and Expanding High-Achieving Charter Schools in Connecticut,
New York and Rhode Island
Section 7—Other Attachments: AF Board of Directors
Officers
William R. Berkley, Chair
Chairman and CEO, W.R. Berkley Corporation
Steve Anbinder, Treasurer
Vice Chairman of the Board of Directors, First Marblehead
Directors
Andrew Boas
General Partner, Carl Marks Management Company, LP
Doug Borchard
Managing Partner & Chief Operating Officer, New Profit, Inc.
Barry Fingerhut
Director, Fingerhut Management Corporation
Carlton L. Highsmith
CEO, Specialized Packaging Group
James Peyser
Partner, New Schools Venture Fund
PR/Award # U282M100002 e0

Achievement First Board of Directors Page 2
Stefan Pryor
Deputy Mayor for Commerce and Economic Development, City of Newark
Jon D. Sackler
President, Bouncer Foundation
Jennifer Smith Turner
CEO, Girl Scouts of Connecticut
PR/Award # U282M100002 e1

Budget Narrative
Budget Narrative
Attachment 1: Title: Achievement First CSP Grant Application Budget Narrative Pages: 19 Uploaded File: CSP RE Grant Application Budget Narrative 100701.pdf
PR/Award # U282M100002 e166

Achievement First:
Replicating and Expanding High-Achieving Charter Schools in Connecticut, New York
and Rhode Island
Budget Narrative
Table of Contents
I. OVERVIEW OF TYPES OF EXPENSES BEING SUBMITTED 2
II. OVERVIEW OF SCHOOLS IDENTIFIED FOR EXPANSION AND REPLICATION 6
III. SCHOOL-BASED COSTS PER PROJECT YEAR 8
IV. NETWORK SUPPORT COSTS PER PROJECT YEAR 17
V. TOTAL PROJECT COSTS AND ALLOCATION TO FEDERAL FUNDS AND
MATCH 18
PR/Award # U282M100002 e0

Achievement First Budget Narrative Page 2
I. OVERVIEW OF TYPES OF EXPENSES BEING SUBMITTED
Achievement First (AF) finds that the most significant areas of cost specifically related to
the expansion and replication of its schools fall into two areas:
• School-based costs: The purchase of initial equipment and supplies for new seats created
for students and new positions created for staff.
• Network Support costs: Professional development and new teacher training for new
positions created for staff.
Network Support is AF’s central office, which provides a range of services to the schools,
including: finance and budgeting, staff recruitment, curriculum development, technology
support, human resources, special education support, teacher professional development,
operations support, facilities, marketing, fundraising, and school leadership selection, training,
ongoing coaching and evaluation.
1. School-Based Costs: Equipment and Supplies for New Student and Staff Seats
Significant expenditures are allocated for the new equipment and supplies needed to
deliver AF’s educational program for new student seats and staff positions created through the
expansion and replication of schools. These costs are unique to expansion and replication. Once
a school is fully operational, only a fraction of the cost for equipment and supplies is needed, as
most of these items can be used for many years before being replaced. In addition, when
equipment and supplies are replaced, they do not all need to be replaced for all students and staff
simultaneously.
PR/Award # U282M100002 e1

Achievement First Budget Narrative Page 3
AF distinguishes between equipment and supplies:
• Equipment has a multi-year life and costs exceeding $1,000 per unit, which reflects the
capitalization level established by AF for financial statement purposes.
• Supplies have a short lifespan and costs of less than $1,000 per unit.
The primary costs related to equipment and supplies needed to add new student seats and
staff positions are as follows:
Budget
Category Item Description Unit
Cost per unit
project year 1
Equipment
Staff
computers
Computers and software for
new staff seats New staff seats $1,200
Equipment
Student
computers
Computer labs for newly
created grades
3rd grade at elementary,
6th and 7th grade at
middle, 10th and 11th
grade at high schools
$20,000 for
elementary,
$35,000 for middle
and high school
Equipment
Other IT
equipment
Peripheral equipment (printers,
scanners, projectors, smart
boards) New staff seats $1,000
Supplies
Furniture and
Fixtures
Furniture for use for new
student seats New student seats $250
Supplies
Curricula
(textbooks)
Curricular materials
(textbooks) for new student
seats New student seats
$500 for
elementary, $600
for middle and high
schools
Supplies
Instructional
supplies
Instructional supplies (paper,
pencils, non-electronic
equipment) New student seats $180
Supplies
Classroom
libraries
Books for individual reading,
kept in classrooms New student seats $200
School based expenses
PR/Award # U282M100002 e2

Achievement First Budget Narrative Page 4
2. Network Support Costs: Professional Development Staff and Training for New
Teacher Positions
One of AF Network Support’s most significant costs related to the expansion and
replication of schools is the provision of professional development to teachers filling newly
created teaching positions. AF creates and implements the majority of its staff professional
development “in house,” meaning that it is delivered by AF’s own professional development
staff. As a result, AF covers the costs associated with delivering the training, including: lodging
and food for the new teachers, facility space, equipment and supplies, and the ancillary costs of
the training. AF conducts New Staff Training for two weeks each August and supplements with
ongoing professional development throughout the school year. The costs of providing New Staff
Training and ongoing professional development fall into the following categories, with the noted
cost per unit:
Budget
Category Item
Description Unit Cost per unit
project year 1
Personnel
Professional
development
staff salaries
Staff providing professional
development support to staff
New staff added each year
of growth plan
$85,000
Fringe
benefits
Professional
development
staff benefits
Taxes and benefits for
professional development staff
15% of salaries of new
professional development
staff added $12,750
Travel
Travel and
lodging
expenses for
new staff
training
Lodging and transportation
expenses for new staff training
Cost per new teacher
attending new staff training $500
Contractu
al
Contractual
costs related
to new staff
training
Costs related to logistics of
new staff training (facility
rental, catering)
Cost per new teacher
attending new staff training $1,000
Oversight/management expenses
PR/Award # U282M100002 e3

Achievement First Budget Narrative Page 5
3. Other Assumptions/Comments
AF is not submitting any expenses in the following categories:
• Equipment
• Construction
• Other
• Indirect costs
• Training stipends
The other major assumption regarding the expenses outlined in the grant budget is a 3
percent annual inflation rate applied each year after year one. This generates the following
inflation factor, which has been applied to the costs in each project year:
Inflation factor
Project Year
1
Project Year
2
Project Year
3
Project Year
4
Project Year
5
Annual rate 3% 1.000 1.030 1.061 1.093 1.126
PR/Award # U282M100002 e4

Achievement First Budget Narrative Page 6
II. OVERVIEW OF SCHOOLS IDENTIFIED FOR EXPANSION AND
REPLICATION
AF currently operates 17 schools. During the grant period, two of AF’s existing schools
will undergo expansion and AF will add an additional 14 schools. The chart below lists school
names, locations, and dates of opening, and identifies whether a school is expanding or
replicating:
The grades served by each expansion/replication school drive enrollment and staff totals,
as well as equipment and supplies costs. The grades served annually by each school are as
follows:
School Location
Year
launched
Expansion/
Replication
1 AF East New York Middle School Brooklyn, NY 2009-2010 Expansion
2 AF Crown Heights High School Brooklyn, NY 2009-2010 Expansion
3 AF Endeavor High School Brooklyn, NY 2010-2011 Replication
4 AF Bridgeport Elementary School Bridgeport, CT 2010-2011 Replication
5 AF Endeavor Elementary School Brooklyn, NY 2011-2012 Replication
6 AF Bushwick HS Brooklyn, NY 2011-2012 Replication
7 AF Aspire Elementary School Brooklyn, NY 2011-2012 Replication
8 AF Rhode Island Elementary School #1 Providence/Cranston, RI 2011-2012 Replication
9 AF Apollo Middle School Brooklyn, NY 2012-2013 Replication
10 AF Brownsville Middle School Brooklyn, NY 2012-2013 Replication
11 AF NY #8 Elementary School Brooklyn, NY 2012-2013 Replication
12 AF Rhode Island Elementary School #2 Providence/Cranston, RI 2012-2013 Replication
13 AF Aspire Middle School Brooklyn, NY 2013-2014 Replication
14 AF Rhode Island Middle School #1 Providence/Cranston, RI 2013-2014 Replication
15 AF NY #8 Middle School Brooklyn, NY 2014-2015 Replication
16 AF Rhode Island Middle School #2 Providence/Cranston, RI 2014-2015 Replication
Achievement First Expansion/Replication Schools: 2010-2015
PR/Award # U282M100002 e5

Achievement First Budget Narrative Page 7
The projected student enrollment at each school by project year is as follows:
School
Project
Year 1
Project
Year 2
Project
Year 3
Project
Year 4
Project
Year 5
1 AF East New York Middle School 5-6 5-7 5-8 5-8 5-8
2 AF Crown Heights High School 9-10 9-11 9-12 9-12 9-12
3 AF Endeavor High School 9 9-10 9-11 9-12 9-12
4 AF Bridgeport Elementary School K K-1 K-2 K-3 K-4
5 AF Endeavor Elementary School K-1 K-2 K-3 K-4
6 AF Bushwick HS 9 9-10 9-11 9-12
7 AF Aspire Elementary School K-1 K-2 K-3 K-4
8 AF Rhode Island Elementary School #1 K-1 K-2 K-3 K-4
9 AF Apollo Middle School 5 5-6 5-7
10 AF Brownsville Middle School 5 5-6 5-7
11 AF NY #8 Elementary School K-1 K-2 K-3
12 AF Rhode Island Elementary School #2 K-1 K-2 K-3
13 AF Aspire Middle School 5 5-6
14 AF Rhode Island Middle School #1 5 5-6
15 AF NY #8 Middle School 5
16 AF Rhode Island Middle School #2 5
Overview of Expansion/Replication Schools: Grades Served
School
Project
Year 1
Project
Year 2
Project
Year 3
Project
Year 4
Project
Year 5
1 AF East New York Middle School 171 249 321 321 321
2 AF Crown Heights High School 80 120 160 165 195
3 AF Endeavor High School 30 75 120 165 195
4 AF Bridgeport Elementary School 85 176 262 342 416
5 AF Endeavor Elementary School 0 176 262 342 416
6 AF Bushwick HS 0 35 125 183 239
7 AF Aspire Elementary School 0 176 262 342 416
8 AF Rhode Island Elementary School #1 0 176 262 342 416
9 AF Apollo Middle School 0 0 88 171 249
10 AF Brownsville Middle School 0 0 88 171 249
11 AF NY #8 Elementary School 0 0 176 262 342
12 AF Rhode Island Elementary School #2 0 0 176 262 342
13 AF Aspire Middle School 0 0 0 88 171
14 AF Rhode Island Middle School #1 0 0 0 88 171
15 AF NY #8 Middle School 0 0 0 0 88
16 AF Rhode Island Middle School #2 0 0 0 0 88
Total 366 1,183 2,302 3,244 4,314
Overview of Expansion/Replication Schools: Enrollment
PR/Award # U282M100002 e6

Achievement First Budget Narrative Page 8
The projected growth in teaching staff at each school by project year is as follows:
In summary, the following chart shows cumulative student enrollment and staffing totals,
as well as new student enrollment and staffing for all schools:
III. SCHOOL-BASED COSTS PER PROJECT YEAR
School
Project
Year 1
Project
Year 2
Project
Year 3
Project
Year 4
Project
Year 5
1 AF East New York Middle School 15 22 25 25 25
2 AF Crown Heights High School 8 14 17 17 17
3 AF Endeavor High School 3 9 14 17 17
4 AF Bridgeport Elementary School 8 16 21 28 33
5 AF Endeavor Elementary School 0 14 20 27 33
6 AF Bushwick HS 0 4 9 14 17
7 AF Aspire Elementary School 0 16 22 29 34
8 AF Rhode Island Elementary School #1 0 16 22 29 34
9 AF Apollo Middle School 0 0 7 15 22
10 AF Brownsville Middle School 0 0 7 15 22
11 AF NY #8 Elementary School 0 0 16 22 29
12 AF Rhode Island Elementary School #2 0 0 16 22 29
13 AF Aspire Middle School 0 0 0 7 15
14 AF Rhode Island Middle School #1 0 0 0 7 15
15 AF NY #8 Middle School 0 0 0 0 7
16 AF Rhode Island Middle School #2 0 0 0 0 7
Total 34 111 195 272 354
Overview of Expansion/Replication Schools: Teachers
All schools
Project
Year 1
Project
Year 2
Project
Year 3
Project
Year 4
Project
Year 5
All new schools
Additional students -- total 366 1,183 2,302 3,244 4,314
Additional students -- each year 238 817 1,119 943 1,070
Additional teachers -- total 34 111 195 272 354
Additional teachers -- each year 34 77 84 78 82
PR/Award # U282M100002 e7
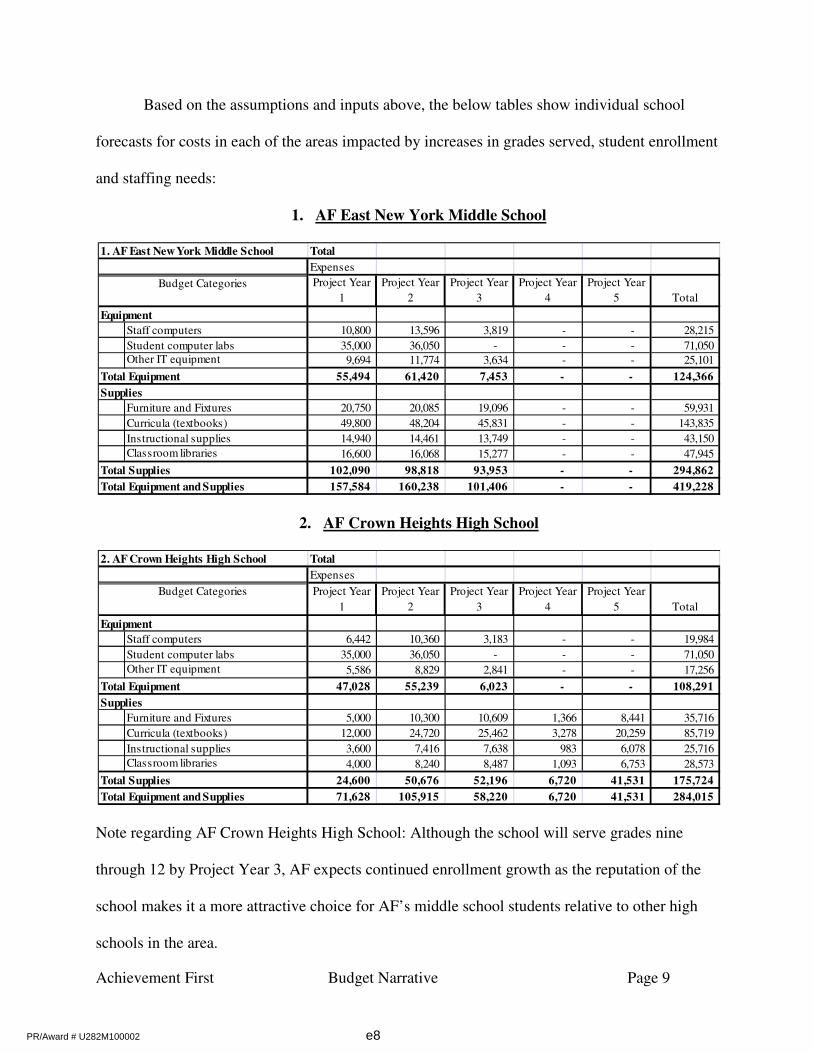
Achievement First Budget Narrative Page 9
Based on the assumptions and inputs above, the below tables show individual school
forecasts for costs in each of the areas impacted by increases in grades served, student enrollment
and staffing needs:
1. AF East New York Middle School
2. AF Crown Heights High School
Note regarding AF Crown Heights High School: Although the school will serve grades nine
through 12 by Project Year 3, AF expects continued enrollment growth as the reputation of the
school makes it a more attractive choice for AF’s middle school students relative to other high
schools in the area.
1. AF East New York Middle School Total
Expenses
Project Year
1
Project Year
2
Project Year
3
Project Year
4
Project Year
5 Total
Equipment
Staff computers 10,800 13,596 3,819 - - 28,215
Student computer labs 35,000 36,050 - - - 71,050 Other IT equipment 9,694 11,774 3,634 - - 25,101
55,494 61,420 7,453 - - 124,366
Supplies
Furniture and Fixtures 20,750 20,085 19,096 - - 59,931
Curricula (textbooks) 49,800 48,204 45,831 - - 143,835
Instructional supplies 14,940 14,461 13,749 - - 43,150
Classroom libraries 16,600 16,068 15,277 - - 47,945
102,090 98,818 93,953 - - 294,862
157,584 160,238 101,406 - - 419,228 Total Equipment and Supplies
Total Equipment
Budget Categories
Total Supplies
2. AF Crown Heights High School Total
Expenses
Project Year
1
Project Year
2
Project Year
3
Project Year
4
Project Year
5 Total
Equipment
Staff computers 6,442 10,360 3,183 - - 19,984
Student computer labs 35,000 36,050 - - - 71,050
Other IT equipment 5,586 8,829 2,841 - - 17,256
47,028 55,239 6,023 - - 108,291
Supplies
Furniture and Fixtures 5,000 10,300 10,609 1,366 8,441 35,716
Curricula (textbooks) 12,000 24,720 25,462 3,278 20,259 85,719
Instructional supplies 3,600 7,416 7,638 983 6,078 25,716
Classroom libraries 4,000 8,240 8,487 1,093 6,753 28,573
24,600 50,676 52,196 6,720 41,531 175,724
71,628 105,915 58,220 6,720 41,531 284,015 Total Equipment and Supplies
Budget Categories
Total Equipment
Total Supplies
PR/Award # U282M100002 e8

Achievement First Budget Narrative Page 10
3. AF Endeavor High School
4. AF Bridgeport Elementary School
Note regarding AF Bridgeport Elementary School: Unlike most of AF’s elementary schools, AF
Bridgeport Elementary is opening with only a kindergarten, as opposed to a kindergarten and
first grade.
5. AF Endeavor Elementary School
3. AF Endeavor HS Total
Expenses
Project Year
1
Project Year
2
Project Year
3
Project Year
4
Project Year
5 Total
Equipment
Staff computers 6,218 12,691 8,593 3,278 - 30,781
Student computer labs - 36,050 37,132 - - 73,182
Other IT equipment 5,491 10,801 7,363 2,926 - 26,581
11,709 59,543 53,088 6,204 - 130,543
Supplies
Furniture and Fixtures 7,500 11,588 11,935 12,293 8,441 51,757
Curricula (textbooks) 18,000 27,810 28,644 29,504 20,259 124,217
Instructional supplies 5,400 8,343 8,593 8,851 6,078 37,265
Classroom libraries 6,000 9,270 9,548 9,835 6,753 41,406
36,900 57,011 58,721 60,482 41,531 254,645
48,609 116,553 111,809 66,686 41,531 385,188 Total Equipment and Supplies
Total Equipment
Budget Categories
Total Supplies
4. AF Bridgeport Elementary Total
Expenses
Project Year
1
Project Year
2
Project Year
3
Project Year
4
Project Year
5 Total
Equipment
Staff computers 15,300 12,051 8,275 11,801 6,753 54,181
Student computer labs - - 21,218 - - 21,218
Other IT equipment 12,750 10,178 7,796 10,162 5,628 46,514
28,050 22,229 37,289 21,963 12,381 121,912
Supplies
Furniture and Fixtures 21,250 23,433 22,809 21,855 20,822 110,168
Curricula (textbooks) 42,500 46,865 45,619 43,709 41,644 220,337
Instructional supplies 15,300 16,871 16,423 15,735 14,992 79,321
Classroom libraries 17,000 18,746 18,247 17,484 16,658 88,135
96,050 105,915 103,098 98,783 94,115 497,961
124,100 128,144 140,388 120,746 106,496 619,873 Total Equipment and Supplies
Budget Categories
Total Equipment
Total Supplies
PR/Award # U282M100002 e9

Achievement First Budget Narrative Page 11
6. AF Bushwick High School
7. AF Aspire Elementary School
5. AF Endeavor Elementary Total
Expenses
Project Year
1
Project Year
2
Project Year
3
Project Year
4
Project Year
5 Total
Equipment
Staff computers - 24,720 10,185 11,801 9,454 56,160
Student computer labs - - - 21,855 - 21,855
Other IT equipment - 20,600 8,627 9,691 7,879 46,796
- 45,320 18,811 43,347 17,333 124,811
Supplies
Furniture and Fixtures - 45,320 22,809 21,855 20,822 110,806
Curricula (textbooks) - 90,640 45,619 43,709 41,644 221,612
Instructional supplies - 32,630 16,423 15,735 14,992 79,780
Classroom libraries - 36,256 18,247 17,484 16,658 88,645
- 204,846 103,098 98,783 94,115 500,842
- 250,166 121,910 142,129 111,448 625,653 Total Equipment and Supplies
Total Supplies
Budget Categories
Total Equipment
6. AF Bushwick HS Total
Expenses
Project Year
1
Project Year
2
Project Year
3
Project Year
4
Project Year
5 Total
Equipment
Staff computers - 10,444 8,912 8,851 3,377 31,583
Student computer labs - - 37,132 38,245 - 75,377
Other IT equipment - 9,022 7,658 7,584 3,014 27,277
- 19,466 53,701 54,680 6,390 134,237
Supplies
Furniture and Fixtures - 9,013 23,738 15,981 15,757 64,488
Curricula (textbooks) - 21,630 56,970 38,355 37,817 154,772
Instructional supplies - 6,489 17,091 11,506 11,345 46,432
Classroom libraries - 7,210 18,990 12,785 12,606 51,591
- 44,342 116,789 78,627 77,525 317,283
- 63,808 170,490 133,308 83,915 451,520
Total Equipment
Total Supplies
Total Equipment and Supplies
Budget Categories
PR/Award # U282M100002 e10

Achievement First Budget Narrative Page 12
8. AF Rhode Island Elementary School #1
Note regarding AF Rhode Island Elementary School #1: The specific location of the school
within the Providence/Cranston region has not yet been determined, and therefore, the school
does not yet have an official name.
9. AF Apollo Middle School
7. AF Aspire Elementary Total
Expenses
Project Year
1
Project Year
2
Project Year
3
Project Year
4
Project Year
5 Total
Equipment
Staff computers - 27,810 9,548 13,113 6,753 57,224
Student computer labs - - - 21,855 - 21,855
Other IT equipment - 23,175 8,096 11,855 5,965 49,091
- 50,985 17,644 46,822 12,718 128,169
Supplies
Furniture and Fixtures - 45,320 22,809 21,855 20,822 110,806
Curricula (textbooks) - 90,640 45,619 43,709 41,644 221,612
Instructional supplies - 32,630 16,423 15,735 14,992 79,780
Classroom libraries - 36,256 18,247 17,484 16,658 88,645
- 204,846 103,098 98,783 94,115 500,842
- 255,831 120,743 145,605 106,833 629,012
Total Equipment
Total Equipment and Supplies
Budget Categories
Total Supplies
8. AF Rhode Island Elementary 1 Total
Expenses
Project Year
1
Project Year
2
Project Year
3
Project Year
4
Project Year
5 Total
Equipment
Staff computers - 27,810 9,548 13,113 6,753 57,224
Student computer labs - - - 21,855 - 21,855
Other IT equipment - 23,175 8,096 11,855 5,965 49,091
- 50,985 17,644 46,822 12,718 128,169
Supplies
Furniture and Fixtures - 45,320 22,809 21,855 20,822 110,806
Curricula (textbooks) - 90,640 45,619 43,709 41,644 221,612
Instructional supplies - 32,630 16,423 15,735 14,992 79,780
Classroom libraries - 36,256 18,247 17,484 16,658 88,645
- 204,846 103,098 98,783 94,115 500,842
- 255,831 120,743 145,605 106,833 629,012
Total Equipment
Total Supplies
Total Equipment and Supplies
Budget Categories
PR/Award # U282M100002 e11

Achievement First Budget Narrative Page 13
10. AF Brownsville Middle School
11. AF New York Elementary School #8
9. AF Apollo Middle Total
Expenses
Project Year
1
Project Year
2
Project Year
3
Project Year
4
Project Year
5 Total
Equipment
Staff computers - - 16,550 11,146 15,532 43,228
Student computer labs - - - 38,245 39,393 77,638
Other IT equipment - - 14,190 10,046 13,428 37,664
- - 30,740 59,438 68,353 158,530
Supplies
Furniture and Fixtures - - 23,340 22,674 21,947 67,961
Curricula (textbooks) - - 56,016 54,418 52,674 163,107
Instructional supplies - - 16,805 16,325 15,802 48,932
Classroom libraries - - 18,672 18,139 17,558 54,369
- - 114,832 111,556 107,981 334,370
- - 145,572 170,994 176,334 492,900
Total Equipment
Total Supplies
Total Equipment and Supplies
Budget Categories
10. AF Brownsville Middle Total
Expenses
Project Year
1
Project Year
2
Project Year
3
Project Year
4
Project Year
5 Total
Equipment
Staff computers - - 16,550 11,146 15,532 43,228
Student computer labs - - - 38,245 39,393 77,638
Other IT equipment - - 14,190 10,046 13,428 37,664
- - 30,740 59,438 68,353 158,530
Supplies
Furniture and Fixtures - - 23,340 22,674 21,947 67,961
Curricula (textbooks) - - 56,016 54,418 52,674 163,107
Instructional supplies - - 16,805 16,325 15,802 48,932
Classroom libraries - - 18,672 18,139 17,558 54,369
- - 114,832 111,556 107,981 334,370
- - 145,572 170,994 176,334 492,900
Total Equipment
Total Supplies
Total Equipment and Supplies
Budget Categories
PR/Award # U282M100002 e12

Achievement First Budget Narrative Page 14
Note regarding AF New York Elementary School #8: The specific location of the school in
Central Brooklyn has not yet been determined, and therefore, the school does not yet have an
official name.
12. AF Rhode Island Elementary School #2
Note regarding AF Rhode Island Elementary School #2: The specific location of the school in
the Providence/Cranston region has not yet been determined, and therefore, the school does not
yet have an official name.
11. NY Elem #8 Total
Expenses
Project Year
1
Project Year
2
Project Year
3
Project Year
4
Project Year
5 Total
Equipment
Staff computers - - 28,644 9,835 13,506 51,985
Student computer labs - - - - 22,510 22,510
Other IT equipment - - 23,870 8,339 12,210 44,420
- - 52,515 18,174 48,227 118,915
Supplies
Furniture and Fixtures - - 46,680 23,494 22,510 92,683
Curricula (textbooks) - - 93,359 46,987 45,020 185,367
Instructional supplies - - 33,609 16,915 16,207 66,732
Classroom libraries - - 37,344 18,795 18,008 74,147
- - 210,992 106,191 101,746 418,929
- - 263,506 124,365 149,973 537,844
Total Equipment
Total Supplies
Total Equipment and Supplies
Budget Categories
12. AF Rhode Island Elementary 2 Total
Expenses
Project Year
1
Project Year
2
Project Year
3
Project Year
4
Project Year
5 Total
Equipment
Staff computers - - 28,644 9,835 13,506 51,985
Student computer labs - - - - 22,510 22,510
Other IT equipment - - 23,870 8,339 12,210 44,420
- - 52,515 18,174 48,227 118,915
Supplies
Furniture and Fixtures - - 46,680 23,494 22,510 92,683
Curricula (textbooks) - - 93,359 46,987 45,020 185,367
Instructional supplies - - 33,609 16,915 16,207 66,732
Classroom libraries - - 37,344 18,795 18,008 74,147
- - 210,992 106,191 101,746 418,929
- - 263,506 124,365 149,973 537,844
Total Supplies
Total Equipment
Total Equipment and Supplies
Budget Categories
PR/Award # U282M100002 e13

Achievement First Budget Narrative Page 15
13. AF Aspire Middle School
14. AF Rhode Island Middle School #1
Note regarding AF Rhode Island Middle School #1: The specific location of the school in the
Providence/Cranston region has not yet been determined, and therefore, the school does not yet
have an official name.
15. AF New York Middle School #8
13. AF Aspire Middle Total
Expenses
Project Year
1
Project Year
2
Project Year
3
Project Year
4
Project Year
5 Total
Equipment
Staff computers - - - 17,047 11,480 28,527
Student computer labs - - - - 39,393 39,393
Other IT equipment - - - 14,615 10,348 24,963
- - - 31,662 61,221 92,883
Supplies
Furniture and Fixtures - - - 24,040 23,354 47,394
Curricula (textbooks) - - - 57,696 56,050 113,746
Instructional supplies - - - 17,309 16,815 34,124
Classroom libraries - - - 19,232 18,683 37,915
- - - 118,277 114,903 233,180
- - - 149,939 176,124 326,063
Budget Categories
Total Supplies
Total Equipment
Total Equipment and Supplies
14. AF Rhode Island MS #1 Total
Expenses
Project Year
1
Project Year
2
Project Year
3
Project Year
4
Project Year
5 Total
Equipment
Staff computers - - - 17,047 11,480 28,527
Student computer labs - - - - 39,393 39,393
Other IT equipment - - - 14,615 10,348 24,963
- - - 31,662 61,221 92,883
Supplies
Furniture and Fixtures - - - 24,040 23,354 47,394
Curricula (textbooks) - - - 57,696 56,050 113,746
Instructional supplies - - - 17,309 16,815 34,124
Classroom libraries - - - 19,232 18,683 37,915
- - - 118,277 114,903 233,180
- - - 149,939 176,124 326,063
Budget Categories
Total Equipment
Total Equipment and Supplies
Total Supplies
PR/Award # U282M100002 e14

Achievement First Budget Narrative Page 16
Note regarding AF New York Middle School #8: The specific location of the school in Central
Brooklyn has not yet been determined, and therefore, the school does not yet have an official
name.
16. AF Rhode Island Middle School #2
Note regarding AF Rhode Island Middle School #2: The specific location of the school in the
Providence/Cranston region has not yet been determined, and therefore, the school does not yet
have an official name.
17. Total School-Based Costs
The total school-based costs for the entire grant are shown in the following table:
15. NY Middle #8 Total
Expenses
Project Year
1
Project Year
2
Project Year
3
Project Year
4
Project Year
5 Total
Equipment
Staff computers - - - - 17,558 17,558
Student computer labs - - - - - -
Other IT equipment - - - - 15,054 15,054
- - - - 32,612 32,612
Supplies
Furniture and Fixtures - - - - 24,761 24,761
Curricula (textbooks) - - - - 59,427 59,427
Instructional supplies - - - - 17,828 17,828
Classroom libraries - - - - 19,809 19,809
- - - - 121,825 121,825
- - - - 154,437 154,437
Budget Categories
Total Supplies
Total Equipment
Total Equipment and Supplies
16. AF Rhode Island MS #2 Total
Expenses
Project Year
1
Project Year
2
Project Year
3
Project Year
4
Project Year
5 Total
Equipment
Staff computers - - - - 17,558 17,558
Student computer labs - - - - - -
Other IT equipment - - - - 15,054 15,054
- - - - 32,612 32,612
Supplies
Furniture and Fixtures - - - - 24,761 24,761
Curricula (textbooks) - - - - 59,427 59,427
Instructional supplies - - - - 17,828 17,828
Classroom libraries - - - - 19,809 19,809
- - - - 121,825 121,825
- - - - 154,437 154,437 Total Equipment and Supplies
Budget Categories
Total Supplies
Total Equipment
PR/Award # U282M100002 e15

Achievement First Budget Narrative Page 17
IV. NETWORK SUPPORT COSTS PER PROJECT YEAR
AF will be adding staff to its professional development team throughout the term of the
project to support new schools and new teachers as they are added. In particular, professional
development for new teachers is provided through New Staff Training, which is take places
during two weeks each August. The costs associated with supporting the new teacher seats
created by this project will be driven by the number new staff added each year and the costs
associated with New Staff Training. The unit costs and number of units for each cost category
are listed below:
All replication/expansion schools Total
Expenses
Project Year
1
Project Year
2
Project Year
3
Project Year
4
Project Year
5 Total
Equipment
38,760 139,483 152,451 138,011 149,242 617,948
70,000 108,150 95,481 180,300 202,592 656,523
33,521 117,554 130,231 120,074 130,529 531,909
142,281 365,186 378,163 438,385 482,363 1,806,380
Supplies
54,500 210,378 296,654 257,474 301,074 1,120,079
122,300 441,149 638,131 564,175 671,253 2,437,009
39,240 151,472 213,591 185,381 216,773 806,457
43,600 168,302 237,323 205,979 240,859 896,063
259,640 971,300 1,385,700 1,213,009 1,429,959 5,259,608
401,921 1,336,487 1,763,863 1,651,394 1,912,322 7,065,988
Total Equipment
Total Equipment and Supplies
Classroom libraries
Staff computers
Student computer labs
Other IT equipment
Curricula (textbooks)
Instructional supplies
Budget Category
Total Supplies
Furniture and Fixtures
Budget
Categories Unit
Cost per unit
project year 1
Annual
inflation
factor
Project
Year 1
Project
Year 2
Project
Year 3
Project
Year 4
Project
Year 5
Personnel
New professional development staff added each
year of growth plan: salary cost $85,000 3% 0.25 1.70 2.00 2.00 1.00
Fringe
Benefits
New professional development staff added each
year of growth plan: fringe benefit cost (15% of
base salary) $12,750 3% 0.25 1.70 2.00 2.00 1.00
Travel
Number of new teachers: lodging and
transportation cost to attend new staff training $1,000 3% 34 77 84 78 82
Contractual
Number of new teachers: logistics costs
(facility, materials, catering) of new staff training $1,200 3% 34 77 84 78 82
PR/Award # U282M100002 e16

Achievement First Budget Narrative Page 18
The total cost associated with new staff and New Staff Training are as follows:
Since only 15 percent of the costs related to Network Support services can be submitted
as part of this grant, AF has included only the following costs in the grant budget:
V. TOTAL PROJECT COSTS AND ALLOCATION TO FEDERAL FUNDS AND
MATCH
Combining the school-based and Network Support expenses gives the following total
costs related to AF’s expansion/replication program:
Budget Categories
Project Year
1
Project Year
2
Project Year
3
Project Year
4
Project Year
5 Total
Personnel 21,250 148,835 180,353 185,764 95,668 631,870
Fringe Benefits 3,188 22,325 27,053 27,865 14,350 94,780
Travel 34,000 79,310 88,585 84,686 91,729 378,310
Contractual 40,800 95,172 106,302 101,624 110,075 453,973
Total 99,238 345,642 402,293 399,938 311,822 1,558,933
Total Network Support Expansion/Replication Costs
Budget Categories
Project Year
1
Project Year
2
Project Year
3
Project Year
4
Project Year
5 Total
Personnel 16,997 119,048 144,258 148,586 76,522 505,412
Fringe Benefits 2,550 17,857 21,639 22,288 11,478 75,812
Travel 27,195 63,437 70,856 67,738 73,371 302,598
Contractual 32,635 76,125 85,028 81,285 88,045 363,118
Total 79,377 276,468 321,781 319,897 249,416 1,246,939
Portion of Network Support Expansion/Replication Costs Included in Project (15% of Total Project)
Project Year
1
Project Year
2
Project Year
3
Project Year
4
Project Year
5 Total
16,997 119,048 144,258 148,586 76,522 505,412
2,550 17,857 21,639 22,288 11,478 75,812
27,195 63,437 70,856 67,738 73,371 302,598
142,281 365,186 378,163 438,385 482,363 1,806,380
259,640 971,300 1,385,700 1,213,009 1,429,959 5,259,608
32,635 76,125 85,028 81,285 88,045 363,118
481,298 1,612,954 2,085,644 1,971,291 2,161,738 8,312,927
Total Project Costs
Equipment
Budget Categories
Personnel
Fringe Benefits
Travel
Supplies
Contractual
Total Costs
PR/Award # U282M100002 e17

Achievement First Budget Narrative Page 19
Following the guidance that it is appropriate and beneficial to match federal dollars with
philanthropic gifts to fund the program, and given AF’s history of private fundraising success,
AF requests 80 percent of its total costs be met with federal funds and expects to raise the
remaining 20 percent, which comprises 25 percent of the federal funds requested, through a
philanthropic match. AF commits to raising the following amounts through private philanthropy:
The balance is the amount for which AF requests federal funding:
Project Year
1
Project Year
2
Project Year
3
Project Year
4
Project Year
5 Total
3,399 23,810 28,852 29,717 15,304 101,082
510 3,571 4,328 4,458 2,296 15,162
5,439 12,687 14,171 13,548 14,674 60,520
28,456 73,037 75,633 87,677 96,473 361,276
51,928 194,260 277,140 242,602 285,992 1,051,922
6,527 15,225 17,006 16,257 17,609 72,624
96,260 322,591 417,129 394,258 432,348 1,662,585
Match portion (20% of total, 25% of federal portion)
Fringe Benefits
Budget Categories
Personnel
Travel
Total Costs
Supplies
Contractual
Equipment
Project Year
1
Project Year
2
Project Year
3
Project Year
4
Project Year
5 Total
13,598 95,239 115,407 118,869 61,217 404,329
2,040 14,286 17,311 17,830 9,183 60,649
21,756 50,750 56,685 54,190 58,697 242,078
113,825 292,149 302,531 350,708 385,891 1,445,104
207,712 777,040 1,108,560 970,407 1,143,967 4,207,686
26,108 60,900 68,022 65,028 70,436 290,494
385,038 1,290,364 1,668,515 1,577,033 1,729,391 6,650,341
Budget Categories
Federal Funds Portion of Project Costs (80% of total)
Equipment
Personnel
Fringe Benefits
Travel
Total Costs
Supplies
Contractual
PR/Award # U282M100002 e18