application article application of s-utd-ch model into...
TRANSCRIPT
Hindawi Publishing CorporationInternational Journal of Antennas and PropagationVolume 2013, Article ID 285304, 5 pageshttp://dx.doi.org/10.1155/2013/285304
Application ArticleApplication of S-UTD-CH Model into MultipleDiffraction Scenarios
Mehmet Baris Tabakcioglu1 and Ahmet Cansiz2
1 Electricity and Energy Department, Bayburt University, Bayburt 69000, Turkey2 Electrical Engineering Department, Istanbul Technical University, Istanbul 34469, Turkey
Correspondence should be addressed to Mehmet Baris Tabakcioglu; [email protected]
Received 3 April 2013; Accepted 20 May 2013
Academic Editor: Stefano Selleri
Copyright © 2013 M. B. Tabakcioglu and A. Cansiz. This is an open access article distributed under the Creative CommonsAttribution License, which permits unrestricted use, distribution, and reproduction in any medium, provided the original work isproperly cited.
Propagation prediction models based on ray tracing in coverage estimation for digital broadcasting systems are compared.Geometrical Theory of Diffraction (GTD), Slope Uniform Theory of Diffraction (S-UTD), and Slope UTD with Convex Hull (S-UTD-CH) models are compared for computation time and propagation path loss. S-UTD-CH model is optimum model withrespect to computation time and relative path loss.
1. Introduction
It is vital to calculate relative path loss of electromagneticwave reaching to the receiver inmultiple diffraction scenariosfor more reliable radio broadcasting. A lot of electromagneticwave propagation models based on ray tracing techniquehave been developed for a long time. Base station location isvital for efficiency of field strength on receiver and compu-tational time. For reaching for all users, predicting the cov-erage field accurately and quickly is most significant. Radiopropagationmodels run for calculating electromagnetic wavestrength in radio planning tools predicting coverage and fieldstrength on the receiver. In radio planning tools, GeometricalTheory of Diffraction (GTD), based on ray tracing technique,model is used due to less computation time [1]. In urbanregions there are multiple diffractions, and due to that theheight, of buildings are close to each other, buildings are inthe transition region of the previous one. In that case GTDmodel fails to calculate the electric field strength at thereceiver accurately. This model can be used in rural areasnot having multiple diffractions with less computation time.To remove the continuity problem on the transition region,Slope UniformTheory of Diffraction (S-UTD) model is pro-posed.This model based on adding of derivative of incomingfields [2, 3]. S-UTDmodel gives inaccurate prediction resultsand require great computation time in scenarios having
diffraction larger than 10. According to accuracy of predictedfield and computation time, Slope UTD with Convex Hullmodel is optimum model [4, 5]. In this study, GTD, S-UTD,and S-UTD-CH propagation models being used in broad-casting are compared with respect to accuracy and compu-tation time. Moreover effects of transmitter height to relativepath loss are discussed.
2. GTD Based Models
GTD based models have been used for a long time in ter-restrial broadcasting. GTD model gives inaccurate results onpredicting field strength in application of multiple diffrac-tions. GTD model can be used in prediction in two cases.The first one is single diffraction case. The other one is thatbuildings are not in the transition zone of the previous build-ings in multiple diffractions. Otherwise, GTD model failsto predict the field strength at the receiver. To remove thefailure of GTD model in the transition zone, derivatives ofthe incoming fields are taken and added to total field. S-UTDmodel has large computation time and loses the accuracy dueto more than 10 diffractions. To remove the failure of S-UTDmodel, S-UTD-CH model is proposed. In fact the proposedmodel is not new. It is only combination of two previouslyproposed models. This model is combination of Convex Hull[6] and S-UTD model. In this model firstly the obstacles nothaving contribution to total field are excluded according to

2 International Journal of Antennas and Propagation
Table 1: Comparison results of highly elevated receiver height (25m).
GTD (s) S-UTD (s) S-UTD-CH (s) GTD versus S-UTD (dB) S-UTD-CH versus S-UTD (dB) Elected0,562 83,585 0,047 0,071 0,05 60,749 154,722 0 0,017 0,002 70,499 114,302 0 0,54 0,054 70,905 145,471 0 0 0,074 81,108 209,135 0,015 0,175 0,02 71,294 215,375 0,047 0,208 0,131 60,639 170,79 0 0,173 0,038 71,17 197,138 0 0,238 0,239 81,544 296,761 0 0,034 0,015 70,89 148,7 0 0,014 0,446 90,874 141,353 0 0,001 0,473 90,609 86,814 0,047 0,014 0,027 60,78 180,571 0 0,603 0,143 80,889 129,871 0 0,025 1,63 91,357 189,447 0 0,01 0,541 90,499 85,426 0 0,03 0,006 71,388 215,001 0,015 0,019 0,564 70,499 75,957 0 0,044 0,134 71,279 236,498 0 0 0,049 80,421 75,442 0,032 0,135 0,041 60,898 157,618 0,010 0,118 0,234 7,4000,347 60,877 0,018 0,173 0,379 1,046
Fresnel zone concept, and then Convex Hull is constructedvia remaining obstacles [7]. Next, ray tracing algorithmruns for determining all ray paths ending at the receiver.Finally, S-UTD model runs for all ray paths [8]. In thismodel, because the obstacles having so little contributionsare excluded from scenario, accuracy of predicted field is notcompromised.Moreover, thanks to less obstacle computationtime reduced. Remarkably, even if only one obstacle isexcluded, computation time reduces to one-fifth [9]. Vogler’smodel [10] is numerical model and gives ultimate accuracyin field prediction to real scenarios. S-UTD-CH model iscomparedwith thismodel in real geometry and gives accurateresults [4].
3. Comparison of GTD Based Models
In the case of multiple diffraction scenarios including lessthan 11 diffractions, S-UTD model is reference model withhigher accuracy. To compare the model the scenario given inFigure 1 is used. In this scenario, transmitting antenna heightis selected as 25, 20, 15, 10, and 5m, respectively. Operationalfrequency, assigned to 2100MHz. Average height of building10m and buildings’ heights are randomly distributed between10± 4m. Distance between the buildings is 20m, and distan-ces between the buildings are randomly distributed between20 ± 5m. Finally receiving antenna height is 1,5m.
For given scenario, are made 20 simulations, for GTD, S-UTD, and S-UTD-CHmodels, respectively. Firstly, transmit-ter antenna height is selected 25m (highly elevated) and sim-ulation results are given in Table 1.
As can be seen from Table 1, leftmost three columns givecomputation times for GTD, S-UTD, and S-UTD-CH mod-els. Next column gives the contribution of S-UTD model toGTD model. This contribution is caused by adding deriva-tives of the incoming fields. Next column gives the difference
Tx
Rx
1.5 m
25 m
10 m
20 m
d
Figure 1: Scenario of comparison of GTD based models.
between S-UTD and S-UTD-CHmodels. The rightmost col-umn shows the elected building number. These buildings areelected because there is almost no contribution to total field atthe receiver. 20 simulations aremade for eachmodel. Last tworows illustrate the mean and standard deviation. Moreover itis illustrated in Table 1 that S-UTD model requires the mostcomputation time. As diffraction number increases, compu-tation time increases. Because of excluding not effective buil-ding, computation time of S-UTD-CH model is very lower.In spite of that S-UTD and S-UTD-CH models give almostthe same results (0,234 dB), computation time of S-UTD-CHmodel is 0,010 s whereas computation time of S-UTD modelis 157,618 s.The contribution of S-UTDmodel to GTDmodelis 0,118 dB resulting from adding of derivatives of incomingfields. Furthermore averagely 7,4 buildings are excluded fromthe scenario caused by not having contribution.
Secondly, transmitting antenna height is selected as 20m(elevated) with all the same parameters, and results are givenin Table 2.
20 simulations are made for each model. Last two rowsillustrate the mean and standard deviation. Moreover it isillustrated in Table 2 that S-UTD model again has the most

International Journal of Antennas and Propagation 3
Table 2: Comparison results of elevated receiver height (20m).
GTD (s) S-UTD (s) S-UTD-CH (s) GTD versus S-UTD (dB) S-UTD-CH versus S-UTD (dB) Elected1,357 262,051 0 0,038 0,585 91,358 213,581 0,015 0,001 0,029 70,577 156,048 0,016 0,061 0,33 71,872 346,228 0 0,003 0,424 70,982 177,561 0 0,022 0,821 90,499 143,942 0,016 0,097 0,185 70,78 172,506 0 0,059 0,011 70,983 184,596 0 0,002 0,22 81,529 259,507 0 0,129 1,355 90,826 199,728 0,016 0,072 0,07 71,217 212,598 0,234 0,066 0,037 50,531 118,982 0 0,043 0,056 70,702 122,336 0,046 0,863 0,173 62,356 391,578 0,015 0,034 0,182 70,577 97,938 0,046 0,033 0,181 60,452 68,531 0 1,848 0,278 70,484 80,777 0,047 0,125 0,14 60,437 79,576 0,016 0,109 0,036 71,077 266,933 0,016 1,03 0,044 70,78 199,182 0,046 5,376 0,014 60,969 187,709 0,026 0,501 0,259 7,0500,518 86,713 0,052 1,239 0,332 1,050
computation time. Because of ignoring not effective building,computation time of S-UTD-CHmodel is very lower. In spiteof that S-UTD and S-UTD-CH models give almost the sameresults (0,259 dB), computation time of S-UTD-CH modelis 0,026 s whereas computation time of S-UTD model is187,709 s. The contribution of S-UTD model to GTD modelis 0,501 dB resulting from adding of derivatives of incomingfields. Furthermore averagely 7,05 buildings are excludedfrom the scenario caused by not having contribution.
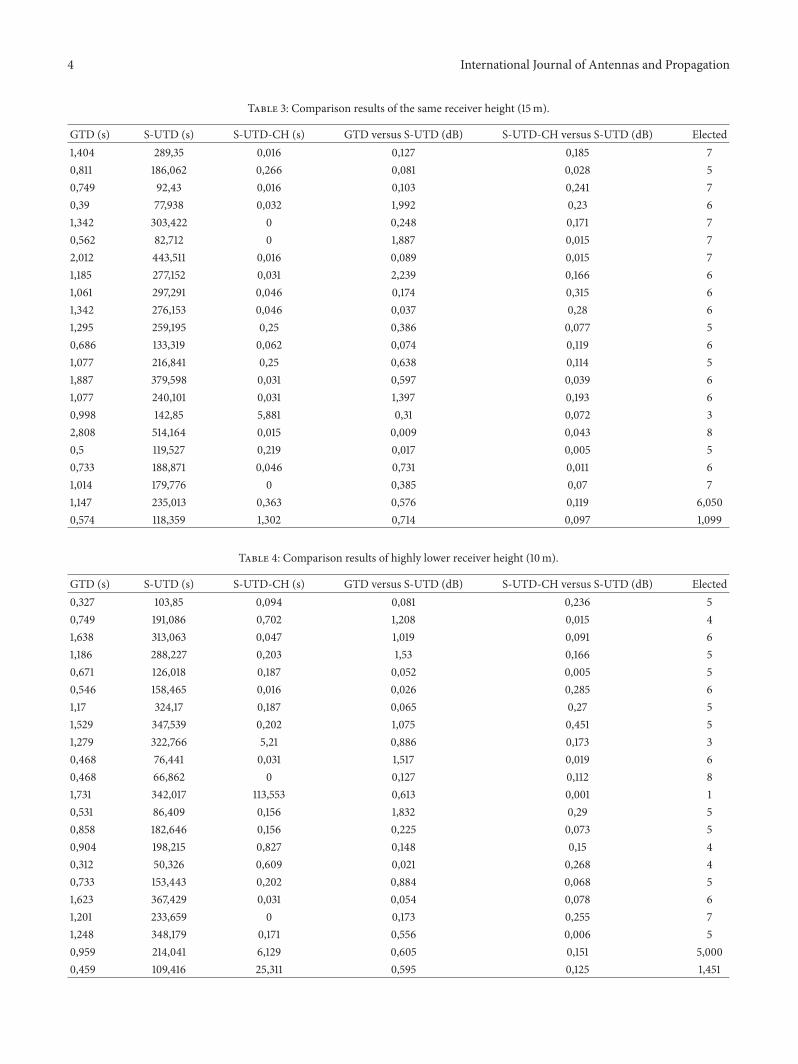
Thirdly, transmitting antenna height is selected as 15m(same) with all the same parameters, and results are given inTable 3.
20 simulations are made for each model. Last two rowsillustrate the mean and standard deviation. Moreover it isillustrated in Table 3 that S-UTD model again has the mostcomputation time. Because of ignoring not effective building,computation time of S-UTD-CHmodel is very lower. In spiteof that S-UTD and S-UTD-CH models give almost the sameresults (0,119 dB), computation time of S-UTD-CH modelis 0,363 s whereas computation time of S-UTD model is235,013 s. The contribution of S-UTD model to GTD modelis 0,576 dB resulting from adding of derivatives of incomingfields. Furthermore averagely 6,05 buildings are excludedfrom the scenario caused by not having contribution.
Fourthly, transmitting antenna height is selected as 10m(lower) with all the same parameters, and results are given inTable 4.
20 simulations are made for each model. Last two rowsillustrate the mean and standard deviation. Moreover it isillustrated in Table 4 that S-UTD model again has the most
computation time. Because of ignoring not effective building,computation time of S-UTD-CH model is very lower. Inspite of that S-UTD and S-UTD-CH model gives almostthe same results (0,151 dB), computation time of S-UTD-CHmodel is 6,129 s whereas computation time of S-UTD modelis 214,041 s.The contribution of S-UTDmodel to GTDmodelis 0,605 dB resulting from adding of derivatives of incomingfields. Furthermore averagely 5 buildings excluded from thescenario caused by not having contribution.
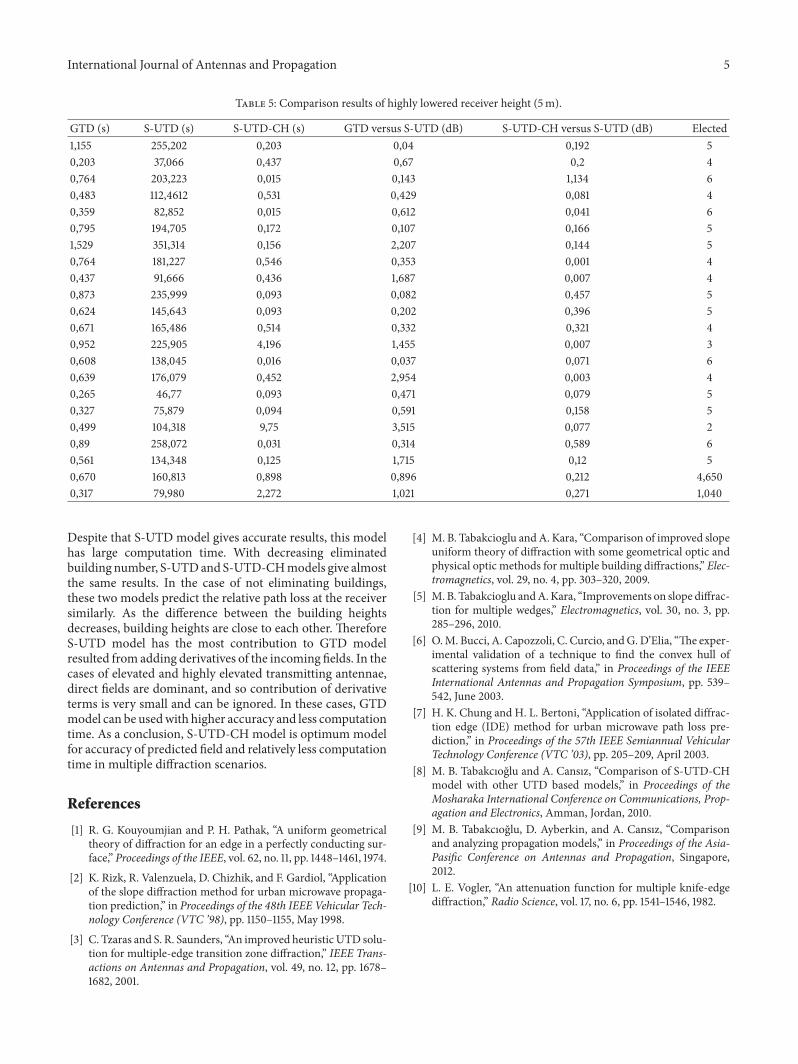
Finally, transmitting antenna height is selected as 5m(highly lower) with all the same parameters and results aregiven in the Table 5.
There are made 20 simulations for each model. Last tworows illustrate the mean and standard deviation. Moreoverit is illustrated in Table 5, S-UTD model again has the mostcomputation time. Because of ignoring not effective building,computation time of S-UTD-CH model is very lower. Inspite of that S-UTD and S-UTD-CH models give almostthe same results (0,271 dB), computation time of S-UTD-CHmodel is 0,898 s whereas computation time of S-UTD modelis 160,813 s.The contribution of S-UTDmodel to GTDmodelis 0,896 dB resulting from adding of derivatives of incomingfields. Furthermore averagely 4,65 buildings are excludedfrom the scenario caused by not having contribution.
4. Results and Discussions
In general, GTDmodel is the fastest model to predict the fieldstrength in radio propagation. If the scenario includes lessthan 11 buildings, S-UTD model gives the ultimate accuracy.
4 International Journal of Antennas and Propagation
Table 3: Comparison results of the same receiver height (15m).
GTD (s) S-UTD (s) S-UTD-CH (s) GTD versus S-UTD (dB) S-UTD-CH versus S-UTD (dB) Elected1,404 289,35 0,016 0,127 0,185 70,811 186,062 0,266 0,081 0,028 50,749 92,43 0,016 0,103 0,241 70,39 77,938 0,032 1,992 0,23 61,342 303,422 0 0,248 0,171 70,562 82,712 0 1,887 0,015 72,012 443,511 0,016 0,089 0,015 71,185 277,152 0,031 2,239 0,166 61,061 297,291 0,046 0,174 0,315 61,342 276,153 0,046 0,037 0,28 61,295 259,195 0,25 0,386 0,077 50,686 133,319 0,062 0,074 0,119 61,077 216,841 0,25 0,638 0,114 51,887 379,598 0,031 0,597 0,039 61,077 240,101 0,031 1,397 0,193 60,998 142,85 5,881 0,31 0,072 32,808 514,164 0,015 0,009 0,043 80,5 119,527 0,219 0,017 0,005 50,733 188,871 0,046 0,731 0,011 61,014 179,776 0 0,385 0,07 71,147 235,013 0,363 0,576 0,119 6,0500,574 118,359 1,302 0,714 0,097 1,099
Table 4: Comparison results of highly lower receiver height (10m).
GTD (s) S-UTD (s) S-UTD-CH (s) GTD versus S-UTD (dB) S-UTD-CH versus S-UTD (dB) Elected0,327 103,85 0,094 0,081 0,236 50,749 191,086 0,702 1,208 0,015 41,638 313,063 0,047 1,019 0,091 61,186 288,227 0,203 1,53 0,166 50,671 126,018 0,187 0,052 0,005 50,546 158,465 0,016 0,026 0,285 61,17 324,17 0,187 0,065 0,27 51,529 347,539 0,202 1,075 0,451 51,279 322,766 5,21 0,886 0,173 30,468 76,441 0,031 1,517 0,019 60,468 66,862 0 0,127 0,112 81,731 342,017 113,553 0,613 0,001 10,531 86,409 0,156 1,832 0,29 50,858 182,646 0,156 0,225 0,073 50,904 198,215 0,827 0,148 0,15 40,312 50,326 0,609 0,021 0,268 40,733 153,443 0,202 0,884 0,068 51,623 367,429 0,031 0,054 0,078 61,201 233,659 0 0,173 0,255 71,248 348,179 0,171 0,556 0,006 50,959 214,041 6,129 0,605 0,151 5,0000,459 109,416 25,311 0,595 0,125 1,451
International Journal of Antennas and Propagation 5
Table 5: Comparison results of highly lowered receiver height (5m).
GTD (s) S-UTD (s) S-UTD-CH (s) GTD versus S-UTD (dB) S-UTD-CH versus S-UTD (dB) Elected1,155 255,202 0,203 0,04 0,192 50,203 37,066 0,437 0,67 0,2 40,764 203,223 0,015 0,143 1,134 60,483 112,4612 0,531 0,429 0,081 40,359 82,852 0,015 0,612 0,041 60,795 194,705 0,172 0,107 0,166 51,529 351,314 0,156 2,207 0,144 50,764 181,227 0,546 0,353 0,001 40,437 91,666 0,436 1,687 0,007 40,873 235,999 0,093 0,082 0,457 50,624 145,643 0,093 0,202 0,396 50,671 165,486 0,514 0,332 0,321 40,952 225,905 4,196 1,455 0,007 30,608 138,045 0,016 0,037 0,071 60,639 176,079 0,452 2,954 0,003 40,265 46,77 0,093 0,471 0,079 50,327 75,879 0,094 0,591 0,158 50,499 104,318 9,75 3,515 0,077 20,89 258,072 0,031 0,314 0,589 60,561 134,348 0,125 1,715 0,12 50,670 160,813 0,898 0,896 0,212 4,6500,317 79,980 2,272 1,021 0,271 1,040
Despite that S-UTD model gives accurate results, this modelhas large computation time. With decreasing eliminatedbuilding number, S-UTDand S-UTD-CHmodels give almostthe same results. In the case of not eliminating buildings,these two models predict the relative path loss at the receiversimilarly. As the difference between the building heightsdecreases, building heights are close to each other. ThereforeS-UTD model has the most contribution to GTD modelresulted from adding derivatives of the incoming fields. In thecases of elevated and highly elevated transmitting antennae,direct fields are dominant, and so contribution of derivativeterms is very small and can be ignored. In these cases, GTDmodel can be usedwith higher accuracy and less computationtime. As a conclusion, S-UTD-CH model is optimum modelfor accuracy of predicted field and relatively less computationtime in multiple diffraction scenarios.
References
[1] R. G. Kouyoumjian and P. H. Pathak, “A uniform geometricaltheory of diffraction for an edge in a perfectly conducting sur-face,” Proceedings of the IEEE, vol. 62, no. 11, pp. 1448–1461, 1974.
[2] K. Rizk, R. Valenzuela, D. Chizhik, and F. Gardiol, “Applicationof the slope diffraction method for urban microwave propaga-tion prediction,” in Proceedings of the 48th IEEE Vehicular Tech-nology Conference (VTC ’98), pp. 1150–1155, May 1998.
[3] C. Tzaras and S. R. Saunders, “An improved heuristic UTD solu-tion for multiple-edge transition zone diffraction,” IEEE Trans-actions on Antennas and Propagation, vol. 49, no. 12, pp. 1678–1682, 2001.
[4] M. B. Tabakcioglu andA. Kara, “Comparison of improved slopeuniform theory of diffraction with some geometrical optic andphysical optic methods for multiple building diffractions,” Elec-tromagnetics, vol. 29, no. 4, pp. 303–320, 2009.
[5] M. B. Tabakcioglu andA.Kara, “Improvements on slope diffrac-tion for multiple wedges,” Electromagnetics, vol. 30, no. 3, pp.285–296, 2010.
[6] O.M. Bucci, A. Capozzoli, C. Curcio, andG.D’Elia, “The exper-imental validation of a technique to find the convex hull ofscattering systems from field data,” in Proceedings of the IEEEInternational Antennas and Propagation Symposium, pp. 539–542, June 2003.
[7] H. K. Chung and H. L. Bertoni, “Application of isolated diffrac-tion edge (IDE) method for urban microwave path loss pre-diction,” in Proceedings of the 57th IEEE Semiannual VehicularTechnology Conference (VTC ’03), pp. 205–209, April 2003.
[8] M. B. Tabakcıoglu and A. Cansız, “Comparison of S-UTD-CHmodel with other UTD based models,” in Proceedings of theMosharaka International Conference on Communications, Prop-agation and Electronics, Amman, Jordan, 2010.
[9] M. B. Tabakcıoglu, D. Ayberkin, and A. Cansız, “Comparisonand analyzing propagation models,” in Proceedings of the Asia-Pasific Conference on Antennas and Propagation, Singapore,2012.
[10] L. E. Vogler, “An attenuation function for multiple knife-edgediffraction,” Radio Science, vol. 17, no. 6, pp. 1541–1546, 1982.

International Journal of
AerospaceEngineeringHindawi Publishing Corporationhttp://www.hindawi.com Volume 2014
RoboticsJournal of
Hindawi Publishing Corporationhttp://www.hindawi.com Volume 2014
Hindawi Publishing Corporationhttp://www.hindawi.com Volume 2014
Active and Passive Electronic Components
Control Scienceand Engineering
Journal of
Hindawi Publishing Corporationhttp://www.hindawi.com Volume 2014
International Journal of
RotatingMachinery
Hindawi Publishing Corporationhttp://www.hindawi.com Volume 2014
Hindawi Publishing Corporation http://www.hindawi.com
Journal ofEngineeringVolume 2014
Submit your manuscripts athttp://www.hindawi.com
VLSI Design
Hindawi Publishing Corporationhttp://www.hindawi.com Volume 2014
Hindawi Publishing Corporationhttp://www.hindawi.com Volume 2014
Shock and Vibration
Hindawi Publishing Corporationhttp://www.hindawi.com Volume 2014
Civil EngineeringAdvances in
Acoustics and VibrationAdvances in
Hindawi Publishing Corporationhttp://www.hindawi.com Volume 2014
Hindawi Publishing Corporationhttp://www.hindawi.com Volume 2014
Electrical and Computer Engineering
Journal of
Advances inOptoElectronics
Hindawi Publishing Corporation http://www.hindawi.com
Volume 2014
The Scientific World JournalHindawi Publishing Corporation http://www.hindawi.com Volume 2014
SensorsJournal of
Hindawi Publishing Corporationhttp://www.hindawi.com Volume 2014
Modelling & Simulation in EngineeringHindawi Publishing Corporation http://www.hindawi.com Volume 2014
Hindawi Publishing Corporationhttp://www.hindawi.com Volume 2014
Chemical EngineeringInternational Journal of Antennas and
Propagation
International Journal of
Hindawi Publishing Corporationhttp://www.hindawi.com Volume 2014
Hindawi Publishing Corporationhttp://www.hindawi.com Volume 2014
Navigation and Observation
International Journal of
Hindawi Publishing Corporationhttp://www.hindawi.com Volume 2014
DistributedSensor Networks
International Journal of