applicability comparison of transmission line … rlgc parameters for transmission lines using...
TRANSCRIPT

J Electr Eng Technol.2017; 12(?): 1921-718 http://dx.doi.org/10.5370/JEET.2017.12.1.1921
1921Copyright The Korean Institute of Electrical Engineers
This is an Open-Access article distributed under the terms of the Creative Commons Attribution Non-Commercial License (http://creativecommons.org/ licenses/by-nc/3.0/) which permits unrestricted non-commercial use, distribution, and reproduction in any medium, provided the original work is properly cited.
Applicability Comparison of Transmission Line Parameter Extraction Methods for Busbar Distribution Systems
Zeynep Hasirci†, Ismail Hakki Cavdar* and Mehmet Ozturk*
Abstract – Modeling busbar distribution system as a transmission line is an important subject of power line communication in the smart grid concept. This requires extraction of busbar RLGC parameters, accurately. In this study, a comparison is made between conventional and modified method for the aspect of optimum RLGC parameters extraction in the 1 MHz to 50 MHz frequency band. The usefulness of these methods is shown both in time and frequency-domain analysis. The frequency-domain analyzes show that the inherent power of modified method can eliminate the errors especially due to the discontinuities arise in conventional method. This makes the modeling approach of modified method more advantageous for the busbars due to its robustness against disturbances in the S-parameters measurements which cannot be eliminated with the calibration procedure. On the other hand, time-domain simulations show that the transmission line representation of the modified method is closer to physical reality by handling causality issues.
Keywords: Busbar distribution system, Causality, Conventional method, Modified method, Parameter extraction, Power line communication, Smart grid, Transmission line model
1. Introduction Smart grid is an important area in the electrical
engineering discipline. It requires to use effective com-munication technologies throughout the electrical network in order to achieve a smart grid. The main targets of the smart grid are controlling, metering, increasing energy quality, monitoring of consumptions, monitoring of loads, etc. Power line communication (PLC) is one of the promising communication methods for smart grid concept due to its use of the existing infrastructure (power cables) for data transferring. The busbar distribution system is also a part of the existing infrastructure of low-voltage (LV) power grid, just as power cables. Busbars are widely used in industrial areas under high power loads, in high-rise buildings, factories, hotels, etc. to carry energy; and are located between the high power electrical sources and high power loads. For this reason, to provide a com-munication network in the all power grid, busbars, should be investigated to establish their behavior in the different frequency bands of interest.
Extraction of the transmission line characteristics from S-parameter measurements is an important issue. In the literature, there is a gap about the characterization of the busbar distribution systems for broadband PLC applications which should be closed. In particular, busbars should be analyzed as transmission lines [1, 2]. In the literature,
several techniques have been introduced to extract the transmission line parameters for different transmission lines (RLGC parameters, characteristic impedance Zc, and propagation constant γ). Basically, they can be grouped as conventional methods (CM) and modified methods (MM) [3-6]. Some of them are generally based on measurements of the S-parameters [7-12]. Also, time-domain measurements are used to extract parameters [13-15]. Another part of the studies have proposed a method for calculating the RLGC parameters via the measured Zc and γ [7, 12, 16]. However, recent studies about extraction of RLGC parameters from measured S-parameters focus on a frequency-dependent RLGC( f ) modeling for transmission lines. These studies use an optimization algorithm to find the parameters instead of calculating them directly. The results are more accurate and efficient in a large frequency band since they eliminate the discontinuity caused by the hyperbolic functions [17-23]. On the other hand, these modeling studies are important in terms of ensuring the causality requirements. For this reason, in this study, a comparison is made between the CM and the MM based on RLGC( f ) modeling approach to show the effectiveness of the modeling approach on busbars. Thus, broadband characterization of busbar distribution system is made and applicability comparison between the CM and the MM is presented.
2. Measurement Setup Busbar energy distribution systems are a part of LV
grid like power cables, and conduct electricity. They have different current carrying capacities. They are three phase
† Corresponding Author: Dept. of Electrical and Electronic Engineering, Karadeniz Technical University, Turkey. ([email protected])
* Dept. of Electrical and Electronic Engineering, Karadeniz Technical University, Turkey. (cavdar, [email protected])
Received: August 30, 2016; Accepted: December 28, 2016
ISSN(Print) 1975-0102ISSN(Online) 2093-7423
Proofreading

Applicability Comparison of Transmission Line Parameter Extraction Methods for Busbar Distribution Systems
1922 J Electr Eng Technol.2017; 12(1): 1921-718
system (L1, L2, L3) with a neutral (N) and they can be made of either aluminum or copper as shown in Fig. 1 [24]. The dielectric material between the metals is generally polyester or polypropylene. In this study, an aluminum type busbar was selected due to its widespread usage. Its dielectric material between the conductors is polyester film. The default production length of the analyzed busbar is 3 m [24].
Due to providing an integrated communication medium for PLC, busbar distribution system should be examined as a part of the LV grid. For this purpose, the comparisons are made for busbar distribution system and their transmission line behavior for frequency band of interest (1 MHz to 50 MHz).
S-parameters measurements are conducted for busbar characterization in terms of a transmission line. Due to a busbar having three-phases, it can be defined as six different two-port network namely L1-N, L2-N, L3-N (phase to neutral) and L2-L1, L3-L1, L3-L2 (phase to phase) [1, 2, 25, 26]. S-parameters measurements were made for all possible port connections. Additionally, the RLGC modeling is also made for all port connections. All port connections give similar results for the aspect of applicability comparison. Instead of giving all the results, any port connection can be presented here for the purpose of this study. Thus, the L1-N signal path is chosen as a representative example.
As it is known, an elementary cell of a transmission line with dx length represents the whole transmission line as shown in Fig. 2.
( , ) ( , )( , ) 0v x t i x tRi x t Lx t
∂ ∂+ + =
∂ ∂ (1)
( , ) ( , )( , ) 0i x t v x tGi x t C
x t∂ ∂
+ + =∂ ∂
(2)
If RLGC parameters of a transmission line given in Telegrapher’s Eqs. (1) and (2) are known, transmission line parameters Zc and γ can be obtained from (3) and (4), respectively.
( ) 2 ( )( ) 2 ( )c
R f j fL fZG f j fC f
ππ
+=
+ (3)
( ( ) 2 ( ))( 2 ( ) )R f j fL f G j fC fγ π π= + + (4) MS2026C Anritsu VNA Master was used for S-
parameter measurements in 1 MHz-50 MHz frequency band. The measurement set up for a 3 m length busbar as shown in Fig. 3. An M17/75-RG214 type coaxial cable with 50Ω characteristic impedance is used to connect the VNA to the busbar. For the minimization of the non-ideal effects caused by the connection between coaxial cable and busbar, two port calibration is made. However, calibration does not guarantee elimination of the measurement errors. Thus, the preferred method for parameter extraction procedure should play an important role of eliminating these unwanted effects.
3. RLGC Extracting Methods
3.1 Conventional method There are many difficulties when extracting accurate
frequency-dependent RLGC parameters for transmission lines using S-parameter measurements with CM. CM causes inevitable errors due to the equations used in CM having the discontinuity caused by hyperbolic functions. In other words, these equations have some strict boundaries for the RLGC extraction procedure such as specific frequency band, specific length, and number of lines, etc.
In the conventional parameter extraction approach, measured S-parameter matrix are converted to Z-parameter matrix as in (5).
11 12 10
21 22
( )( )Z Z
Z Z I S I SZ Z
−⎡ ⎤= = + −⎢ ⎥⎣ ⎦
(5)
where S is S-parameter matrix, I is the identity matrix, and
Fig. 1. Example of 630 A current level busbar used in this
study (3 m length)
R dx L dx
C dx G dx
i(x,t)
v(x,t)
i(x+dx,t)
v(x+dx,t)
+ +
- -dx
Fig. 2. The elementary cell of a transmission line (dxlength)
Fig. 3. S-parameters measurement set up for busbar
Proofreading

Zeynep Hasirci, Ismail Hakki Cavdar and Mehmet Ozturk
http://www.jeet.or.kr 1923
Z0 is the reference impedance matrix (50 Ω). Then, it is converted to the T-transmission matrix as in (6)
1 1
11 12 11 21 11 21 22 121 1
21 22 21 21 22
T T Z Z Z Z Z ZT
T T Z Z Z
− −
− −
⎡ ⎤⎡ ⎤ −= = ⎢ ⎥⎢ ⎥⎣ ⎦ ⎣ ⎦
(6)
where Z is Z-parameter matrix. T-parameter matrix of transmission line (6) refers to ABCD parameters as in (7) [27, 28].
1
1
cosh( ) sinh( )sinh( ) cosh( )c c c
c
A B Z l Z Z lT
C D l Z lγ γ
γ γ
−
−
⎡ ⎤⎡ ⎤= = ⎢ ⎥⎢ ⎥⎣ ⎦ ⎣ ⎦
(7)
ABCD parameters in (7) represent the transmission line
with some specific parameters such as propagation constant, γ (rad/m), characteristic impedance, Zc (Ω), and transmission line length, l (m). Zc and γ are calculated from (7) with a known line length. RLGC parameters can be calculated using (5), (6) and (7) for each frequency point as in (8) [29].
( ) Re( )( ) Im( ) (2 )
c
c
R f ZL f Z f
γγ π
==
1
1
( ) Re( )( ) Im( ) (2 )
c
c
G f ZC f Z f
γγ π
−
−
==
(8)
Re( ) and Im( ) provide real and imaginary parts of their
operators in (8), respectively.
3.2 Modified method MMs are generally based on measurements of the S-
parameters in frequency-domain or time-domain to extract transmission line parameters. In this study, frequency-dependent RLGC( f ) modeling from measured S-parameters is used. On the other hand, describing a real material with numerical elements such as RLGC engenders causality issues. For this reason, dielectric loss, dielectric dispersion, and skin effect loss should be considered for producing a causal model to reflect the reality. Here, frequency-dependent RLGC( f ) modeling with these considerations was used to extract the parameters of the busbar transmission line as in (9) [18].
0
0 0
0
( )( ) (2 )( ) 2 ' tan( ) '
s
s
g r
g r
R f R R fL f L R fG f G fCC f C
ππ ε ε δ
ε ε
∞
= +
= += +=
(9)
where R0 , Rs , L∞ , G0 and Cg refer to DC resistance, skin effect loss, inductance at high frequencies (generally constant), shunt current due to free electrons in an imperfect dielectric, and geometry-related capacitance constant, respectively. 'rε and ''rε are the real and imaginary parts of the frequency-dependent relative permittivity ( rε ), respectively.
Table 1. Typical 'rε and tan( )δ values of Mylar®
Polyester Film at 25°C [30]
Frequency 'rε tan( )δ
60 Hz 3.30 0.0025 1 kHz 3.25 0.0050 1 MHz 3.00 0.0160 1 GHz 2.80 0.0080
Fig. 4. Fitted curves for typical electrical properties of the
dielectric material The rε and loss tangent tanδ can be defined as in
(10).
' ''r r rjε ε ε= − , ''
tan'
r
r
εδ
ε= (10)
The 'rε and tanδ values at 25°C for specific
frequencies for typical electrical properties of Mylar®
Polyester Film are obtained from the manufacturer catalogue [30] and are given in Table 1.
To calculate 'rε and tanδ values for the frequency band of interest, they were modeled with frequency-dependent curves given in (11) and (12), respectively.
0.01018'( ) 3.46r f fε −= (11)
2
10((log ( ) 6.346)/3.184)tan ( ) 0.01611 ff eδ − −= (12) Fitted curves shown in Fig. 4, are used to estimate the 'rε and tanδ with a mean square error of 2.54x10⁻⁴ and
7.98x10⁻⁸, respectively. The coefficient of determination for both of curves is 0.9937 and 0.9969, respectively.
The aim of frequency-dependent RLGC( f ) modeling is to optimize the model parameters R0, Rs, L∞, G0, and Cg according to a well-defined objective function, Fobj. The objective function aims to minimize the error between measured and the estimated S-parameters. In this study, this error is calculated via the sum of absolute differences of real and imaginary parts, separately as in (13).
1
1
1 Re( ( ) ( ))
1 Im( ( ) ( ))
N m eobj jk i jk i
i
N m ejk i jk i
i
F S f - S fN
S f - S fN
=
=
= ∑
+ ∑ [ ], 1, 2j k ∈ (13)
Proofreading
Applicability Comparison of Transmission Line Parameter Extraction Methods for Busbar Distribution Systems
1924 J Electr Eng Technol.2017; 12(1): 1921-718
where ( )mjk iS f and ( )e
jk iS f refer to measured and estimated S-parameters at ith frequency from the busbar RLGC( f ) model, respectively.
S-parameters from model are calculated from RLGC parameters with known equations. Firstly, Zc and γ parameters are calculated from RLGC parameters with (3) and (4), respectively. Then, the ABCD matrix are created with calculated Zc and γ parameters for l = 3 m line length as in (7). Finally, the S-parameters for busbar ( eS ) are obtained from the ABCD matrix as in (14) [31].
2
0 0 0 0
11 122
21 22 0 0 0 0
2( )
2
e ee
e e
AZ B CZ DZ AD BC ZS SSS S Z AZ B CZ DZ
⎡ ⎤+ − − −⎢ ⎥⎡ ⎤ ∇ ∇⎢ ⎥= =⎢ ⎥ − + − +⎢ ⎥⎣ ⎦⎢ ⎥∇ ∇⎣ ⎦
20 0 0AZ B CZ DZ∇ = + + + (14)
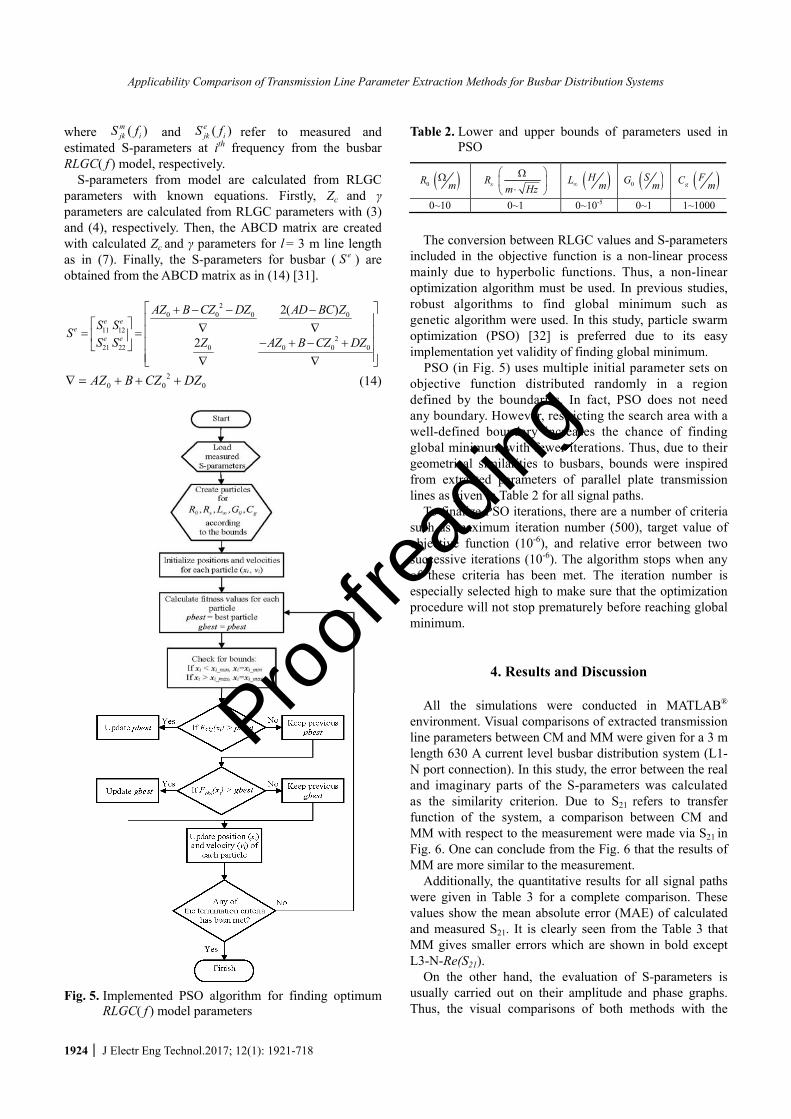
Fig. 5. Implemented PSO algorithm for finding optimum
RLGC( f ) model parameters
Table 2. Lower and upper bounds of parameters used in PSO
0R ( )mΩ
sRm Hz
⎛ ⎞Ω⎜ ⎟
⋅⎝ ⎠ L∞ ( )H
m 0G ( )Sm gC ( )F
m
0~10 0~1 0~10-5 0~1 1~1000
The conversion between RLGC values and S-parameters
included in the objective function is a non-linear process mainly due to hyperbolic functions. Thus, a non-linear optimization algorithm must be used. In previous studies, robust algorithms to find global minimum such as genetic algorithm were used. In this study, particle swarm optimization (PSO) [32] is preferred due to its easy implementation yet validity of finding global minimum.
PSO (in Fig. 5) uses multiple initial parameter sets on objective function distributed randomly in a region defined by the boundaries. In fact, PSO does not need any boundary. However, restricting the search area with a well-defined boundary increases the chance of finding global minimum with fewer iterations. Thus, due to their geometrical similarities to busbars, bounds were inspired from extracted parameters of parallel plate transmission lines as given in Table 2 for all signal paths.
To finalize PSO iterations, there are a number of criteria such as maximum iteration number (500), target value of objective function (10-6), and relative error between two successive iterations (10-6). The algorithm stops when any of these criteria has been met. The iteration number is especially selected high to make sure that the optimization procedure will not stop prematurely before reaching global minimum.
4. Results and Discussion All the simulations were conducted in MATLAB®
environment. Visual comparisons of extracted transmission line parameters between CM and MM were given for a 3 m length 630 A current level busbar distribution system (L1-N port connection). In this study, the error between the real and imaginary parts of the S-parameters was calculated as the similarity criterion. Due to S21 refers to transfer function of the system, a comparison between CM and MM with respect to the measurement were made via S21 in Fig. 6. One can conclude from the Fig. 6 that the results of MM are more similar to the measurement.
Additionally, the quantitative results for all signal paths were given in Table 3 for a complete comparison. These values show the mean absolute error (MAE) of calculated and measured S21. It is clearly seen from the Table 3 that MM gives smaller errors which are shown in bold except L3-N-Re(S21).
On the other hand, the evaluation of S-parameters is usually carried out on their amplitude and phase graphs. Thus, the visual comparisons of both methods with the
Proofreading

Zeynep Hasirci, Ismail Hakki Cavdar and Mehmet Ozturk
http://www.jeet.or.kr 1925
original data were also conducted in terms of amplitude and phase of S21 as shown in Fig. 7. Both methods give similar results for the amplitude of S21. However, CM fails to match the phase term. This result can be expected from the Fig. 6 and Table 3.
The obtained R and L values from CM and MM have similar mean values as shown in Fig. 8. However, the disruptive effect of discontinuity regions on R is higher for
CM and it gives negative R values which may not be realized in a physical system.
The comparative results for G and C values from CM and MM are shown in Fig. 9. The problems mentioned for R and L can also be seen for G and C values.
Fig. 10 shows that the obtained Zc and γ from CM are in a good agreement with the results from MM. However, because these parameters are calculated from RLGC parameters, the same discontinuity problems arise here as expected.
In Fig. 11, transfer functions (H(f)) of all signal paths are given to show the performances of both methods. The upper plot in Fig. 11 compares the CM and MM via L1-N with respect to the performance of H(f) calculation. It is easily seen that CM reflects the disturbances of extracted
Table 3. MAE of CM and MM Re(S21) Im(S21) Signal Paths
CM MM CM MM L1-N 0.047 0.037 0.163 0.029 L2-N 0.069 0.063 0.237 0.052 L3-N 0.054 0.081 0.229 0.064 L2-L1 0.062 0.035 0.161 0.031 L3-L1 0.065 0.058 0.239 0.048 L3-L2 0.060 0.034 0.163 0.028
Fig. 6. Comparison of original Re(S21) and Im(S21) with the results of CM and MM
Fig. 7. Comparison of original S21 with the results of CM
and MM
Fig. 8. Comparison of R( f ) and L( f ) for CM and MM
Fig. 9. Comparison of G( f ) and C( f ) from CM and MM
Fig. 10. A comparison of Zc and γ values for CM and MM
Fig. 11. Simulated transfer functions, H(f) Proofreading

Applicability Comparison of Transmission Line Parameter Extraction Methods for Busbar Distribution Systems
1926 J Electr Eng Technol.2017; 12(1): 1921-718
RLGC values, as expected. On the other hand, MM results are far more well-behaved and meaningful as shown in Fig. 11.
The results so far are given in frequency-domain. In Fig. 12 and Fig. 13, time domain analysis is given for both methods. The aim of the time-domain analysis is to show the performance of these parameters to represent a real physical system. First, a 50 ns width and normalized amplitude pulse signal is applied to the input of a 3 m length busbar defined with CM and MM (in Fig. 12). It clearly demonstrates that the result of MM (RLGC( f ) model) are causal, but the CM is not.
Fig. 13 shows the responses of these systems to a rectangular shape pulse with an amplitude of 2 V to show the distortion of CM and MM on a square wave even for a short transmission line length. This result again proves that
CM is ineffective at characterizing the busbar as a transmission line.
It is clearly seen that the modeling approach gives more accurate representations. For the sake of completeness, time-domain responses for all possible port connections are also given in Fig. 14 and Fig. 15.
5. Conclusion This study presents a comparison between CM and MM
transmission line parameter extraction methods to show the usefulness of the two methods. Here, S-parameter measurements were conducted on 630 A current level busbar with VNA. The results show that the inherent power of the MM, in this study, is capable of eliminating the errors due to the measurement faults. While the results indicate that the obtained RLGC values from both methods are roughly similar to each other, the results of MM are more practical to use without any unrealistic outcomes such as negative RLGC values.
On the other hand, the electrical properties of the dielectric material were also modeled to handle the causality issues in MM. The better dielectric material representation allows the extracted parameters to be more realistic and hence a causal system. The time domain responses of proposed MM reveal that its representation is closer to physical reality. The non-ideal effects caused by measurement set up may be minimized partially with calibration techniques during the S-parameter measure-ments. However, the remaining distortions after calibration correction cause some faults for parameter extraction procedure in CM. The MM which is designed to represent only the parameters of a transmission line (busbar distribution system), is capable of handling the remaining disturbances. As a result, the modeling approach is more advantageous in terms of transmission line parameter extraction, especially for busbar distribution system.
In this aspect, to the best of authors’ knowledge this is the first study for high-frequency modeling of busbar distribution system with this RLGC( f ) approach. In the future, this modeling approach has a potential for
Fig. 12. Comparison of time-domain responses for CM and MM
Fig. 13. Comparison of time-domain responses for CM and MM to a rectangular pulse
Fig. 14. Time-domain responses of all signal paths for MM
Fig. 15. Time-domain responses of all signal paths for MM
to a rectangular pulse
Proofreading
Zeynep Hasirci, Ismail Hakki Cavdar and Mehmet Ozturk
http://www.jeet.or.kr 1927
improvement by incorporating some parameters such as type, size, operating temperature of busbars. Additionally, for higher data rates, the investigated frequency range can be extended more to show the broadband PLC channel possibilities of busbars.
Acknowledgements This work was supported in part by the TUBITAK (The
Scientific and Technological Research Council of Turkey), 1003- Primary Subjects R&D Funding Program, Project No: EEEAG-115E137.
References
[1] Z. Hasirci and I. H. Cavdar, “Modeling of high power busbar systems for power line communica-tions,” presented at IEEE International Energy Conference (ENERGYCON2014), Dubrovnik, Croatia, 2014.
[2] Z. Hasirci, I. H. Cavdar, N. Suljanovic, and A. Mujcic, “Investigation of Current Variation Effect on PLC Channel Characteristics of LV High Power Busbar Systems,” presented at The 5th IEEE PES Innovative Smart Grid Technologies (ISGT) European 2014 Conference, Istanbul, Turkey, 2014.
[3] M. K. Sampath, “On addressing the practical issues in the extraction of RLGC parameters for lossy multi-conductor transmission lines using S-parameter models,” presented at Electrical Performance of Electronic Packaging (IEEE-EPEP2008), San Jose, USA, 2008.
[4] R. B. Marks, “A multiline method of network analyzer calibration,” IEEE Trans. Microw. Theory Tech., vol. 39, pp. 1205-1215, 1991 (current ver. 2002).
[5] J. Kim, and D. H. Han, “Hybrid method for frequency-dependent lossy coupled transmission line characterization and modelling,” presented at 12th Topical Meeting on Electrical Performance of Electronic Packaging (IEEE-EPEP 2003), Princeton, USA, 2003.
[6] K. Narita, and T. Kushta, “An accurate experimental method for characterizing transmission lines embedded in multilayer printed circuit boards,” IEEE Trans. on Adv. Packaging, vol. 29, pp. 114-121, 2006.
[7] R. Papazyan, P. Petterson, H. Edin, R. Eriksson, and U. Gafvert, “Extraction of high frequency power cable characteristics from S-parameter measurements,” IEEE Trans. on Dielectrics and Insulation, vol. 11, pp. 461-470, 2004.
[8] R. B. Marks, and D. F. Williams, “Characteristic impedance determination using propagation constant measurement,” IEEE Microwave Guided Wave Lett., vol. 1, pp. 141-143, 1991.
[9] S. B. Goldberg, M. B. Steer, and P. D. Franzon, “Experimental Electrical Characterization of Inter-connects and Discontinuities in High-Speed Digital Systems,” IEEE Trans. Comp. Packag. Manufact. Technol., vol. 14, pp. 761-765, 1991.
[10] D. F. Williams, J. E. Rogers, and C. L. Holloway, “Multiconductor transmission - line characterization: representations, approximations, and accuracy,” IEEE Trans. Microwave Theory Tech., vol. 47, pp. 403-409, 1999.
[11] G. Chen, L. Zhu, and K. Melde, “Extraction of frequency dependent RLCG parameters of the packaging interconnects on low-loss substrates from frequency domain measurements,” presented at 14th Topical Meeting on Electrical Performance of Electronic Packaging (IEEE-EPEP 2005), Austin, USA, 2005.
[12] J. Kim, D. Han, “Hybrid method for frequency-dependent lossy coupled transmission line charac-terization and modeling,” presented at Electrical Performance of Electronic Packaging (EPEP2003), Princeton, USA, 2003.
[13] A. Deutsch, G. Arjavalingam, G. V. Kopcsay, “Characterization of resistive transmission lines by short-pulse propagation,” IEEE Microwave and Guided Wave Lett., vol. 2, pp. 25-27, 1992 (current ver. 2002).
[14] P. Ferrari, B. Flechet, and G. Angenieux, “Time domain characterization of lossy arbitrary characteristic impedance transmission lines,” IEEE Microwave and Guided Wave Lett., vol. 4, pp. 177-179, 1994 (current ver. 2002).
[15] W. Kim, S. Lee, M. Seo, M. Swaminathan, and R. Tummala, “Determination of propagation constants of transmission lines using 1-port tdr measurements,” presented at 59th ARFTG Conference Digest, Seattle, USA, 2002.
[16] M. J. Degerstrom, B. K. Gilbert, and E. S. Daniel, “Accurate resistance, inductance, capacitance, and conductance (RLCG) from uniform transmission line measurements,” presented at Electrical Performance of Electronic Packaging (IEEE-EPEP2008), San Jose, USA, 2008.
[17] J. Zhang, Q. B. Chen, Z. Qiu, J. L. Drewniak, and A. Orlandi, “Extraction of causal RLGC models from measurements for signal link path analysis,” presented at 2008 International Symposium on Electromagnetic Compatibility - EMC Europe, Hamburg, Germany, 2008.
[18] J. Zhang, J. L. Drewniak, D. J. Pommerenke, M. Y. Koledintseva, R. E. Dubroff, W. Cheng, Z. Yang, Q. B. Chen, and A. Orlandi, “Causal RLGC(f) models for transmission lines from measured S-parameters,” IEEE Transactions on Electromagnetic Compatibility, vol. 52, pp. 189-198, 2010.
[19] J. Zhang, M. Y. Koledintseva, J. L. Drewniak, G.
Proofreading

Applicability Comparison of Transmission Line Parameter Extraction Methods for Busbar Distribution Systems
1928 J Electr Eng Technol.2017; 12(1): 1921-718
Antonini, and A. Orlandi, “Extracting R, L, G, C parameters of dispersive planar transmission lines from measured S-parameters using a genetic algorithm,” presented at International Symposium on Electromagnetic Compatibility, EMC 2004, Eindhoven, Netherlands, 2004.
[20] Z. Q. Chen, and S. J. Chun, “Per-unit-length RLGC extraction using a lumped port De-embedding method for application on periodically loaded transmission lines,” presented at 56th Electronic Components & Technology Conference, San Diego, USA, 2006.
[21] R. L. Wigington, and N. S. Nahman, “Transient analysis of coaxial cables considering skin effect,” in Proc. 1957 IRE, pp. 166-174.
[22] T. R. Arabi, A. T. Murphy, and T. K. Sarkar, and R.F. Harrington, “On the modeling of conductor and substrate losses in multiconductor, multidielectric transmission line systems,” IEEE Trans. Microwave Theory Tech., vol. 39, pp. 1090-1097, 1991.
[23] C. Svensson, and G. E. Dermer, “Time-domain modeling of lossy interconnects,” IEEE Trans. Adv. Packag., vol. 24, pp. 191-196, 2001.
[24] EAE Company, Turkey, “E-Line KX Busbar Power Distribution System (datasheet),” 57 pages. [Online] Cited 2016-07-15
[25] Z. Hasirci and I. H. Cavdar, “Extraction of narrow-band propagation properties of a 630 A current level busbar,” presented at 39th International Conference on Telecommunications and Signal Processing (TSP 2016), Vienna, Austria, 2016.
[26] Z. Hasirci, I. H. Cavdar, and M. Ozturk, “Estimation of propagation parameters for aluminum busbar up to 500 kHz, “ presented at International Symposium on Innovations in Intelligent Systems and Applications (INISTA 2016), Sinaia, Romania, 2016.
[27] R. Achar and M. Nakhla, “Simulation of high-speed interconnects, “ in Proc. of the IEEE, vol. 89, no. 5, pp. 693-728, 2001.
[28] W. R. Eisenstadt and Y. Eo, “S-parameter-based IC interconnect transmission line characterization, “IEEE Trans. Compon., Hybrids, Manufac. Technol., vol. 15, pp. 483-489, 1992 (current ver. 2002).
[29] W. Kim, J. H. kim, D. Oh, and C. Yuan, “S-parameters based transmission line modeling with accurate low-frequency response,” in Proc. 2006 IEEE 15th Topical Meeting, pp. 79-82.
[30] DuPont Teijin Films, http://usa.dupontteijinfilms. com/informationcenter/downloads/Electrical_Properties.pdf, Last Access Date: 18 Aug. 2016.
[31] D. M. Pozar, “Microwave Engineering, “New York: Wiley, 1998.
[32] J. Kennedy, and R. C. Eberhart, “Particle swarm optimization,” in Proc. 1995 IEEE International Conference on Neural Networks, pp. 1942-1948.
Zeynep Hasirci She received B.Sc. and M.Sc. degrees from Karadeniz Technical University (KTU), Trabzon in 2008 and 2011, respectively. She studied for her Ph.D. thesis in Halmstad University, Sweden for one year. She is currently a Ph.D. student at the Department of Electrical and
Electronics Engineering, KTU. Her research interests include communication systems, mobile and satellite communication, propagation modelling and power line communication.
Ismail Hakki Cavdar He received his Ph.D. degree in Electrical and Elec-tronics Engineering from Karadeniz Technical University (KTU), in 1994. He has been a Full Professor at KTU since 1985. He was a Visiting Professor at Smart Grid Lab in the Department of Electrical and Computer Engineering,
The University of Akron, OH USA, in 2011. His research interests include communications systems, mobile and satellite communication, power line communications, smart grids, and power electronics.
Mehmet Ozturk He received his B.Sc degree in Electronics Engineering from Kadir Has University, Istanbul in 2004. He received his M. Sc. and Ph.D. degrees in Electrical and Electronics Engineering from Karadeniz Technical University (KTU) in 2007 and 2013, respectively. His research interests
include signal and image processing, computer vision, modeling, and optimization.
Proofreading