appendixes (from no. 1 to no. 30 - uni-halle.de · t= temperature (°c), l% is the optimum lime...
TRANSCRIPT

131
Appendixes (from No. 1 to No. 30
Appendix (1a) X-ray powder diffractogram of Lippendorf fly ash.

132
Appendix (1b) X-ray powder diffractogram of natural teriary clay.
Position [°2Theta]
10 20 30 40 50 60
Counts
0
100
400
Residue + Peak List
00-005-0490; Si O2; Quartz, low
00-006-0221; Al2 Si2 O5 ( O H )4; Kaolinite 1Md
00-012-0219; Na0.3 ( Al Mg )2 Si4 O10 O H2 !6 H2 O; Montmorillonite-18A
00-001-1098; H2 K Al3 ( Si O4 )3; Muscovite
00-003-0184; Al2 Si2 O5 ( O H )4; Halloysite-7A

133
Appendix (2) X-ray powder diffractogram of natural organic silt
Position [°2Theta]
10 20 30 40 50 60
Counts
0
100
400
natural organic silt
Residue + Peak List
01-072-1937; Ca C O3; Calcite
01-083-0539; Si O2; Quartz
00-002-0467; K Al2 ( Si3 Al ) O10 ( O H , F )2; Muscovite
00-003-0184; Al2 Si2 O5 ( O H )4; Halloysite-7A

134
Appendix (3) X-ray powder diffractogram of natural weathered soil
Position [°2Theta]
10 20 30 40 50 60 70
Counts
0
100
400
900
Natural weathered soil
Residue + Peak List
01-089-8936; Si O2; Quartz $GA
00-007-0032; K Al2 Si3 Al O10 ( O H )2; Muscovite 2M1, syn
00-006-0221; Al2 Si2 O5 ( O H )4; Kaolinite 1Md
00-033-0311; Ca S O4 !2 H2 O; Gypsum, syn

135
Appendix (4) X-ray powder diffractogram of treated stabilized weathered soil
(weathered soil + 35% fly ash after 28 days curing)
Position [°2Theta]
10 20 30 40 50 60 70
Counts
100
400
900
weathered soil + 35% fly ash
Residue + Peak List
01-089-8936; Si O2; Quartz $GA
00-007-0032; K Al2 Si3 Al O10 ( O H )2; Muscovite 2M1, syn
01-072-0646; Ca6 ( Al ( O H )6 )2 ( S O4 )3 ( H2 O )25.7; Ettringite
136
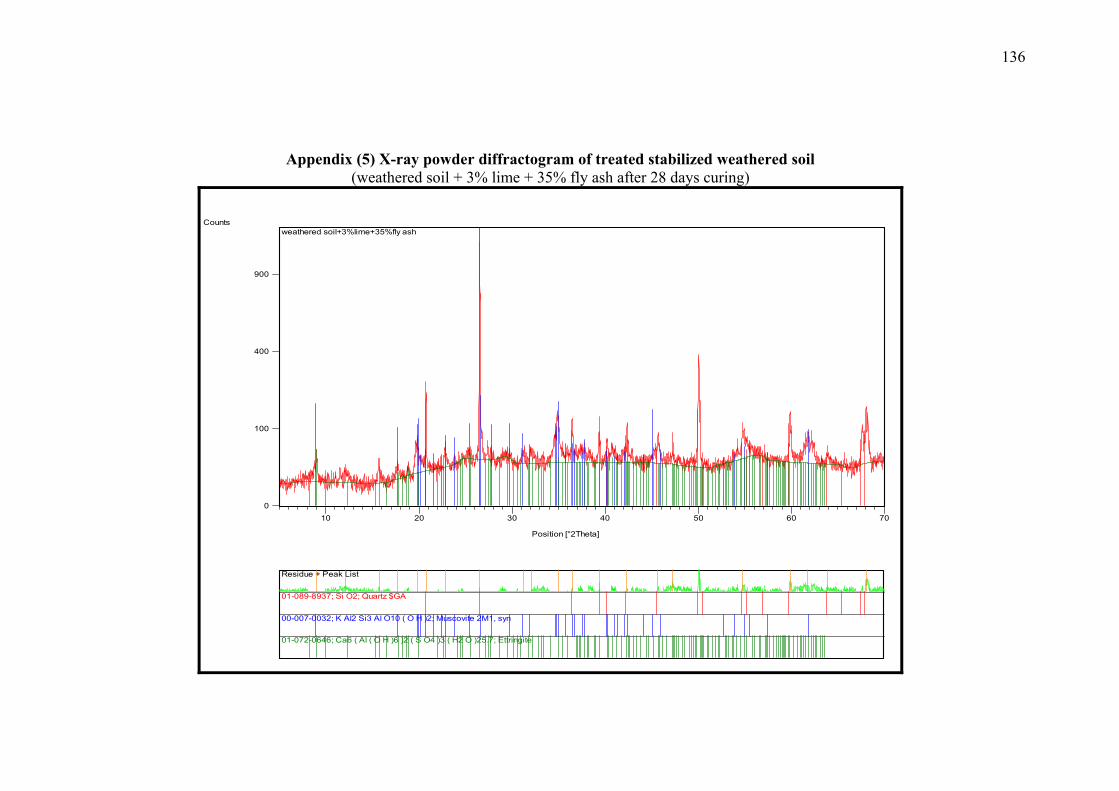
Appendix (5) X-ray powder diffractogram of treated stabilized weathered soil (weathered soil + 3% lime + 35% fly ash after 28 days curing)
Position [°2Theta]
10 20 30 40 50 60 70
Counts
0
100
400
900
weathered soil+3%lime+35%fly ash
Residue + Peak List
01-089-8937; Si O2; Quartz $GA
00-007-0032; K Al2 Si3 Al O10 ( O H )2; Muscovite 2M1, syn
01-072-0646; Ca6 ( Al ( O H )6 )2 ( S O4 )3 ( H2 O )25.7; Ettringite

137
Appendix (6) pH-measurement of natural soils and soil-lime, soil-fly ash, and soil-lime/fly ash mixtures to determine the optimum lime-, fly ash- and lime/fly ash-content for the studied soils. T= Temperature (°C), L% is the optimum lime content minus 2% in case of the tertiary clay and the weathered soil and is the optimum lime content minus 1% in case of the organic silt. The Blue numbers indicate to the optimum chemical additive content according to pH-test.
Tertiary clay Organic silt Weathered soil Type of chemical additive
Percent of chemical additive
% Average pH
T Average pH
T Average pH
T
Without agent 0 7.65 25.00 7.31 25.00 2.65 25.00
Hydrated lime
1 2 3 4
4.5 5 6 7 8
11.80 12.23 12.32 12.38 12.40 12.42 12.44 12.46 12.47
25.00 25.00 25.00 25.00 25.00 25.00 25.00 25.00 25.00
11.80 12.32 12.40 12.43
- 12.44 12.45 12.46 12.47
25.00 25.00 25.00 25.00 25.00 25.00 25.00 25.00 25.00
4.50 9.20
11.20 12.00
- 12.40 12.45 12.50 12.55
25.00 25.00 25.00 25.00 25.00 25.00 25.00 25.00 25.00
Fly ash
8 12 16 20 25 30 35 40
12.09 12.31 12.40 12.43 12.46
- - -
25.00 25.00 25.00 25.00 25.00 25.00 25.00 25.00
11.85 12.00 12.20 12.42 12.45
- - -
25.00 25.00 25.00 25.00 25.00 25.00 25.00 25.00
9.50 10.75 10.97 11.62 12.02 12.25 12.40 12.40
25.00 25.00 25.00 25.00 25.00 25.00 25.00 25.00
Lime/fly ash
L% /8%F L% /12%F L% /16%F L% /20%F L% /25%F
12.47 12.49 12.51 12.52 12.53
25.00 25.00 25.00 25.00 25.00
12.36 12.45 12.48 12.52 12.54
25.00 25.00 25.00 25.00 25.00
12.28 12.38 12.39 12.42 12.46
25.00 25.00 25.00 25.00 25.00

138
Appendix (7) Relationship between pH-value and hydrated lime content
Figure (2.19) The relationship betwen pH-values and hydrated lime content (%) to determine the optimum lime-content of
soils using Eades and Grim pH-test.
0
2
4
6
8
10
12
14
0 1 2 3 4 5 6 7 8 9 10Hydrated lime (%)
pH-v
alue
Tertiary clayOrganic siltWeathered soil
The arrows point to the optimum lime content

139
Appendix (8) Relationship between pH-value and fly ash content
Figrure (2.20) The relationship between pH-values and fly ash content (%) to determine the optimum fly ash
content of soils.
0
2
4
6
8
10
12
14
0 4 8 12 16 20 24 28 32 36 40 44
Fly ash (%)
pH-v
alue
Tertiary clayOrganic siltWeathered soil
The arrows point to the optimum fly ash content for each soil

140
Appendix (9) Relationship between pH-value and hydrated lime/fly ash content
Fig. (2.21) The relationship between pH-values and lime/fly ash content (%) to determine the optimum lime/fly ash-
content of soils.
0L/0F
2.5L/8F 2.5L/12F 2.5L/16F 2.5L/20F 2.5L/25F
0L/0F
2L/8F 2L/12F 2L/16F 2L/20F 2L/25F
3L/25F3L/8F 3L/12F 3L/16F 3L/20F
0L/0F
0
2
4
6
8
10
12
14
Lime/fly ash content (%)
pH-v
alue
Tertiary clayOrganic siltWeathered soil
The arrows point to the optimum lime/fly ash content for each soil

141
Appendix (10) Geotechnical properties of untreated compacted- and treated stabilized-tertiary clay with several blending.
Admixture mixing
Atterberg limits
Plas-ticityindex
Gs
Compaction
Curing time
CBR- value
qu- value
Tensile strength
σt-
Vp-value
L (%)
FA (%)
LL (%)
PL (%)
PI (%)
g/cm³
MDD g/cm³
OMC (%)
Days
(%)
kN/m²
kN/m²
m/sec
0 0 61.47 28.57 32.90 2.650 1.445 23.77 - 4.6 131.21 - 667 4.5* 6.5 8.5
0 0 0
65.32 62.95 66.70
48.61 46.13 46.10
16.7116.8220.6
2.573 2.534 2.456
1.366 1.349 1.328
29.40 31.12 32.53
7 7 7
60 61.8 62.3
1034.00 1147.80 1221.70
109.25 160.25 183.60
1418 1569 1600
0 0 0
0 0
8 12 16* 20 25
76.37 73.97 70.75
69.27 65.88
46.80 48.96 52.34
51.64 50.20
29.5725.0118.41
17.6215.68
2.614 2.607 2.606
2.588 2.594
1.369 1.364 1.361
1.353 1.344
30.85 31.17 31.26
31.53 31.61
7 7 7
28 56 180 7 7
21.9 36.6 39.4 73.8 77.0 94.9 61.1 51.6
366.88 594.90 820.38
1459.27 1660.64 1791.37 1064.97 950.00
43.70 72.90 102.00 185.80 211.26 276.82 153.00 152.95
1039 1215 1309 1513 1536 1600 1537 1485
2.5* 1.5 2.5 4.5 6.5
8* 16 16 16 16
71.52 70.40 70.34
70.20 54.30
48.51 48.90 51.96
51.70 35.20
23.0121.5018.38
18.5019.10
2.605 2.615 2.582
2.579 2.613
1.328 1.333 1.327
1.310 1.323
30.39 30.50 30.53
30.81 32.57
7 7 7
28 56 180 7 7
46.8 59.7 87.2 109
168.3 234.2 81.8 79.5
905.59 1424.42 1476.28 2256.57 3081.50 3505.23 1363.75 1159.56
123.85 131.15 142.06 240.4 335.10 400.66 138.41 127.49
1314 1491 1496 1655 1786 1875 1435 1371
L = Lime content (%) FA = Fly ash content (%) MDD = Maximum dry density (in Proctor test) OMC = Optimum moisture content (in Proctor test) LL = Liquid limt PL = Plastic limit Gs = Specific gravity CBR = California bearing ratio qu = Unconfined compression strength Vp = P-wave velocity
test-Optimum content according to pH *

142
Appendix (11) Geotechnical properties of untreated compacted- and treated stabilized-organic silt with several blending.
Admixture mixing
Atterberg limits
Plas-ticityindex
Gs
Compaction
Curing time
CBR- value
qu- value
Tensile strength
σt
Vp-value
L (%)
FA (%)
LL (%)
PL (%)
PI (%)
g/cm³
MDD g/cm³
OMC (%)
Days
(%)
kN/m²
kN/m²
m/sec
0 0 50.00 29.16 20.84 2.550 1.455 27.61 - 7.4 136.91 - 465 3* 5 7
0 0 0
55.33 54.75 54.62
41.75 42.12 42.68
13.5812.6311.94
2.510 2.482 2.500
1.386 1.383 1.345
28.40 30.29 30.76
7 7 7
16.8 23.4 23.4
439.49 634.40 628.03
87.40 109.30 101.95
852 961 917
0 0 0 0
0
8 12 16 20* 25
53.43 54.01 55.11 54.10
52.4
36.91 37.80 38.95 39.92
38.9
16.5216.2116.1614.14
13.47
2.551 2.559 2.559 2.560
2.562
1.401 1.404 1.407 1.410
1.416
28.94 29.74 29.94 30.34
30.75
7 7 7 7
28 56 180 7
14.7 28.7 37.0 45.8 58.2 94.4 105.0 47.8
322.29 532.48 620.38 685.35
1331.26 1385.55 1738.98 964.33
37.90 58.30 72.85 76.49 153.00 167.55 254.97 109.27
781 876 953 1011 1228 1297 1420 1098
2* 2
3 5
12* 20 20 20
51.05 51.00
50.01 49.90
37.18 3738
38.21 37.60
13.8713.01
11.8012.30
2.552 2.619
2.555 2.610
1.404 1.410
1.404 1.394
26.53 27.85
26.74 27.10
7 7
28 56 180 7 7
35.2 38.4 61.1 80.4 103.1 40.2 27.4
729.65 866.43
1348.78 1648.44 2148.35 871.88 796.11
65.55 80.13 152.98 189.41 258.61 83.78 72.90
929 991 1178 1342 1434 1013 949

143
Appendix (12) Geotechnical properties of untreated compacted- and treated stabilized-weathered soil with several blending.
Admixture mixing
Atterberg limits
Plas-ticityindex
Gs
Compaction
Curing time
CBR- value
qu- value
Tensile strength
σt
Vp-value
L (%)
FA (%)
LL (%)
PL (%)
PI (%)
g/cm³
MDD g/cm³
OMC (%)
Days
(%)
kN/m²
kN/m²
m/sec
0 0 63.72 32.36 31.36 2.64 1.502 25.74 - 3.2 173.25 - 721 5* 7 9
0 0 0
85.80 87.90 88.30
58.36 60.69 61.26
27.4427.2127.03
2.579 2.551 2.574
1.282 1.265 1.260
33.34 33.72 33.91
7 7 7
17.1 17.6 16.8
309.55 329.90 298.09
47.35 50.95 40.05
882 1034 1000
0 0 0 0 0 0
8 12 16 20 25 35*
88.65 87.84 86.32 86.29 86.2884.63
53.78 53.96 54.69 55.44 57.03 60.40
34.8833.8831.6330.8529.2524.23
2.64 2.638 2.635 2.628 2.618 2.604
1.343 1.313 1.253 1.247 1.350 1.370
28.34 31.11 32.06 32.27 32.30 32.70
7 7 7 7 7 7
28 56 180
15.3 17.5 22.8 26.4 43.5 50.2 51.0 62.9 95.3
294.27 301.54 335.50 389.81 526.12 938.85
1151.07 1184.21 1412.79
36.40 40.04 50.95 69.20 72.90 110.75 138.41 152.98 182.12
979 1018 1020 1021 1147 1236 1367 1371 1439
3* 3
5 7 8
* 20 35 35 35 35
79.44 69.09
74.24 74.56 83.72
57.12 45.93
48.89 45.31 49.76
22.3223.16
25.3528.2733.96
2.624 2.613
2.584 2.573 2.571
1.240 1.360
1.357 1.345 1.346
30.94 25.79
25.72 25.54 24.10
7 7
28 56 180 7 7 7
44.5 79.2 84.4 103.3 115.0 80.2 76.6 72.4
713.39 1327.30 1619.81 1751.11 2297.16 1421.54 1416.49 1376.68
109.30 116.56 145.70 160.27 236.80 182.10 174.80 149.34
1297 1368 1402 1453 1622 1392 1382 1370

144
Appendix (13) Calculation of elasticity modulus (ESecant) of untreated compacted- and treated stabilized-soils for different admixtures
and curing times Soil type Mixtures Δσ/Δε ESecant (MPa)
Tertiary clay
Untreated compacted 4.5% lime 7 days 16% fly ash 7 days 16% fly ash 28 days 16% fly ash 56 days 16% fly ash 180 days 2.5%lime/8% fly ash 7 2.5%L/16% fly ash 7 2.5%L/16% fly ash 28 2.5%L/16% fly ash 56 2.5%L/16%fly ash 180
40.704-7.643/0.01042-0.00342 639.49-31.847/0.00758-0.00358 385.99-112.102/0.00192-0.00042 659.47-112.56/0.00358-0.00342 977.991-402.797/0.00559-0.00358 1274.21-365.84/0.00517-0.00367 657.422-222.967/0.00758-0.00433 842.68-399.21/0.00667-0.00508 2043.59-1193.91/0.01025-0.00917 1734.957-632.007/0.00417-0.00292 2041.568-1555.754/0.00442-0.00400
4.70 100.50 100.80 300.40 300.00 600.10 100.30 200.80 700.90 882.30
1156.70
Organic silt
Untreated compacted 3% lime 7 days 20% fly ash 7 days 20% fly ash 28 days 20% fly ash 56 days 20% fly ash 180 days 2% L/12% fly ash 7 2% L/20% fly ash 7 2% L/20% fly ash 28 2% L/20% fly ash 56 2% L/20% fly ash 180
39.548-8.479/0.01533-0.00175 133.758-20.382/0.00333-0.00067 389.809-54.777/0.00925-0.00533 1217.922-393.928/0.01058-0.00533 1046.466-662.411/0.00408-0.00183 1563.6-289.609/0.00667-0.00167 282.037-69.236/0.00342-0.00142 542.250-216.639/0.00583-0.00283 1009.422-510.142/0.00650-0.004 1223.943-669.011/0.00600-0.00450 1508.086-1026.55/0.0045-0.00375
2.30 42.60 90.00 100.60 168.90 200.60 100.10 100.90 200.00 369.96 642.01
Weathered soil
Untreated compacted 5% lime 7 days 35% fly ash 7 days 35% fly ash 28 days 35% fly ash 56 days 35% fly ash 180 days 3% L/20% fly ash 7 3% L/35% fly ash 7 3% L/35% fly ash 28 3% L/35% fly ash 56 3% L/35% fly ash 180
59.873-25.478/0.01375-0.00867 192.357-38.217/0.00942-0.00467 626.752-62.420/0.00617-0.00108 979.222-416.546/0.00967-0.006 675.07-260.608/0.00767-0.00342 675.079-459.879/0.00967-0.008 203.688-411.884/0.00275-0.00058 1223.847-917.989/0.00908-0.00783 828.896-411.884/0.00683-0.005 1286.556-711.755/0.01067-0.00875 1509.289-1034.149/0.00342-0.00275
6.80 33.00 100.10 100.30 97.50 100.50 72.00 200.30 200.50 299.40 709.16

145
Appendix (14) calculation of the loss of weight for the stabilized soils after 12 cycles freezing/thawing–durability test (ASTM D560).
sSample
wet weight after
7 days
W
%
B gm
C 1
gm
C 2
C 3
C 4
C 5
C 6
C 7
C 8
C 9
C 10
C 11
C 12
qu-
KN/m²
W %
F.D.W
gm.
Loss of
weight %
Re- sult
Clay 16FClay 2.5L/16FSilt 20FSilt 2L/20Fw. soil 35F
w. soil 3L/35F
1735.9 1710.2
1710.4 1667.9
1660.2
1637.1
31.2 30.5
30.3 26.8
32.7
25.8
1323.1 1310.5
1312.7 1315.4
1251.1
1301.4
1735.2 1708.4
1703.3 1655.5
1626.6
1636.4
1724.8 1707.2
1703.0 1645.2
1614.9
1634.7
1711.5 1706.5
1699.2 1631.3
1612.3
1633.2
1721.1 1704.4
1693.2 1623.7
1611.7
1632.6
1722.4 1704.7
1681.3 1616.5
1610.9
1627.6
1710.9 1703.6
1676.0 1587.6
1608.8
1626.1
1702.3 1701.9
1672.6 1575.3
1604.7
1623.9
1695.7 1701.1
1664.5 1570.4
1602.8
1623.6
1692.7 1700.2
1663.5 1565.4
1602.5
1621.2
1690.3 1700.5
1660.1 1558.1
1601.6
1615.7
1680.5 1699.9
1598.3 1552.5
1600.1
1612.3
1677.7 1699.8
1690.7 1546.7
1598.4
1609.7
891.72 1044.6
1082.8 957.96
1031.8
1464.9
28.20 32.32
30.26 23.79
28.87
26.75
1308.7 1284.7
1297.9 1249.5
1240.3
1269.9
1.10 1.97
1.13 5.00
1.00
2.40
P p
P P
P P
C = Cycle, P = Pass, F = Fail B = Original calculated oven-dry weight A= Original calculated oven-dry weight minus final corrected oven-dry weight. W= Water content, F.D.W = Final corrected oven-dry weight. Loss of weight, % = (A/B) * 100

146
Appendix (15) calculation of the loss of weight for the stabilized soils after 12 cycles wetting/drying–durability test (ASTM D559).
sSample
wet weight after
7 days
W %
B gm
C 1
gm
C 2
C 3
C 4
C 5
C 6
C 7
C 8
C 9
C 10
C 11
C 12
qu
KN/m²
W %
F.D.W
gm.
Loss of
weight %
Re- sult
Clay 16FClay 2.5L/16FSilt 20FSilt 2L/20Fw.soil 35F
w.soil 3L/ 35F
1732.8 1720.3
1705.2 1653.6
1618.7
1654.7
31.2 30.5
30.3 26.8
32.7
25.8
1323.1 1310.2
1308.7 1304.1
1219.8
1315.3
1609.8 1646.9
1646.9 1625.6
1566.1
1566.6
1584.9 1618.7
1621.2 1625.0
1501.8
1564.9
1561.6 1615.7
1606.9 1623.3
1499.8
1546.5
1551.1 1593.1
1597.6 1619.4
1438.2
1505.3
1512.8 1590.5
1595.0 1611.3
1410.3
1503.1
1490.6 1583.8
1594.7 1600.6
1400.5
1492.1
1477.5 1581.6
1592.3 1596.5
1398.6
1480.4
1459.6 1577.3
1590.7 1588.6
1380.5
1471.0
1420.7 1575.4
1593.5 1580.5
1345.8
1469.5
1414.6 1573.1
1589.1 1574.2
1319.6
1460.9
1410.4 1571.5
1583.2 1562.4
1311.2
1455.3
1405.5 1569.1
1580.4 1555.8
1292.6
1448.5
649.68 1439.5
1477.7 1541.4
458.60
1019.1
26.57 26.90
23.30 21.12
22..30
23.60
1110.8 1236.5
1281.8 1284.5
1056.9
1171.9
16.10 5.60
2.10 1.50
13.40
10.90
F P
P P
F F
B = Original calculated oven-dry weight. A = Original calculated oven-dry weight minus final corrected oven-dry weight. Loss of weight, % = (A/B) * 100 C = Cycle, P = Pass, F = Fail W= Water content, F.D.W = Final corrected oven-dry weigh

147
Appendix (16, a) CBR-curves of tertiary clay

148
Appendix (16, b) follow: CBR-curves of tertiary clay

149
Appendix (17, a) CBR-curves of organic silt

150
Appendix (17, b) follow: CBR-curves of organic silt

151
Appendix (18, a) CBR-curves of weathered soil

152
Appendix (18, b) follow: CBR-curves of weathered soil

153
Appendix (19) Calculation of tensile strength of tertiary clay
Admixture mixing
Curing time
L
D
P
σt = 2P/π.D.L
= 0.636P/D.L
σt
L (%)
FA (%)
Days (mm) (mm) (N) (MPa) (KN/m²)
4.5* 6.5 8.5
0 0 0
7 7 7
100 100 100
100 100 100
1717.8 2519.6 2886.8
0.10925 0.16025 0.18360
109.25 160.25 183.60
0 0 0
0 0
8 12 16* 20 25
7 7 7
28 56
180 7 7
100 100 100 100 100 100 100 100
100 100 100 100 100 100 100 100
687.1 1146.2 1603.8 2921.4 3321.7 4352.5 2405.7 2404.9
0.4370 0.7290
0.10200 0.18580 0.21126 0.27682 0.15300 0.15295
43.70 72.90 102.00 185.80 211.26 276.82 153.00 152.95
2.5* 1.5 2.5 4.5 6.5
8* 16 16 16 16
7 7 7
28 56
180 7 7
100 100 100 100 100 100 100 100
100 100 100 100 100 100 100 100
1947.3 2061.1 2233.6 3779.9 5268.9 6299.7 2176.3 2000.6
0.12385 0.13115 0.14206 0.2404
0.33510 0.40066 0.13841 0.12749
123.85 131.15 142.06 240.4 335.10 400.66 138.41 127.49
L = Thickness of the tested specimen (mm) D = Diameter of the tested specimen (mm) P = Load at failure (N) σt = Tensile strength (MPa)

154
Appendix (20) Calculation of tensile strength of organic silt
Admixture mixing
Curing time
L
D
P
σt = 2P/π.D.L
= 0.636P/D.L
σt
L (%)
FA (%)
Days (mm) (mm) (N) (MPa) (KN/m²)
3* 5 7
0 0 0
7 7 7
100 100 100
100 100 100
1374.2 1718.6 1603.0
0.08740 0.10930 0.10195
87.40 109.30 101.95
0 0 0 0
0
8 12 16 20* 25
7 7 7 7
28 56
180 7
100 100 100 100 100 100 100 100
100 100 100 100 100 100 100 100
595.9 916.7 1145.4 1202.7 2405.7 2634.4 4009.0 1718.1
0.03790 0.05830 0.07285 0.07649 0.15300 0.16755 0.25497 0.10927
37.90 58.30 72.85 76.49 153.00 167.55 254.97 109.27
2* 2
3 5
* 12 20 20 20
7 7
28 56
180 7 7
100 100 100 100 100 100 100
100 100 100 100 100 100 100
1030.7 1259.9 2405.3 2978.1 4066.2 1317.3 1146.2
0.06555 0.08013 0.15298 0.18941 0.25861 0.08378 0.07290
65.55 80.13 152.98 189.41 258.61 83.78 72.90

155
Appendix (21) Calculation of tensile strength of weathered soil
Admixture mixing
Curing time
L
D
P
σt = 2P/π.D.L
= 0.636P/D.L
σt
L (%)
FA (%)
Days (mm) (mm) (N) (MPa) (KN/m²)
5* 7 9
0 0 0
7 7 7
100 100 100
100 100 100
744.5 801.1 629.7
0.04735 0.05095 0.04005
47.35 50.95 40.05
0 0 0 0 0 0
8 12 16 20 25 35*
7 7 7 7 7 7
28 56
180
100 100 100 100 100 100 100 100 100
100 100 100 100 100 100 100 100 100
572.3 629.6 801.1 1088.1 1146.2 1741.4 2176.3 2405.3 2863.5
0.03640 0.04004 0.05095 0.06920 0.07290 0.11075 0.13841 0.15298 0.18212
36.40 40.04 50.95 69.20 72.90 110.75 138.41 152.98 182.12
3* 3
5 7 8
* 20 35 35 35 35
7 7
28 56
180 7 7 7
100 100 100 100 100 100 100 100
100 100 100 100 100 100 100 100
1718.6 1832.7 2290.9 2520.0 3723.3 2863.2 2748.4 2348.1
0.10930 0.11656 0.14570 0.16027 0.23680 0.18210 0.17480 0.14934
109.30 116.56 145.70 160.27 236.80 182.10 174.80 149.34
156
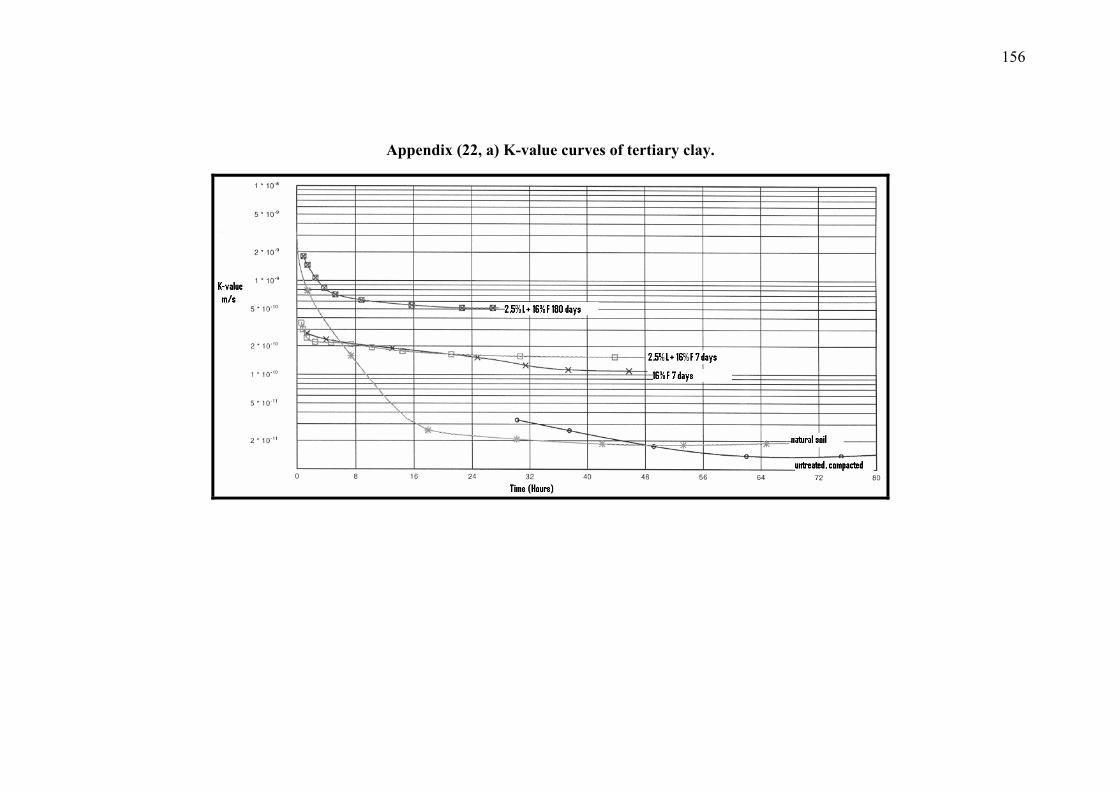
Appendix (22, a) K-value curves of tertiary clay.

157
Appendix (22, b) follow: K-value curves of tertiary clay.

158
Appendix (23, a) K-value curves of organic silt.

159
Appendix (23, b) follow: K-value curves of organic silt.

160
Appendix (23, c) follow: K-value curves of organic silt.

161
Appendix (24, a) K-value curves of weathered soil

162
Appendix (24, b) follow: K-value curves of weathered soil.

163
Appendix (24, c) follow: K-value curves of weathered soil.
164
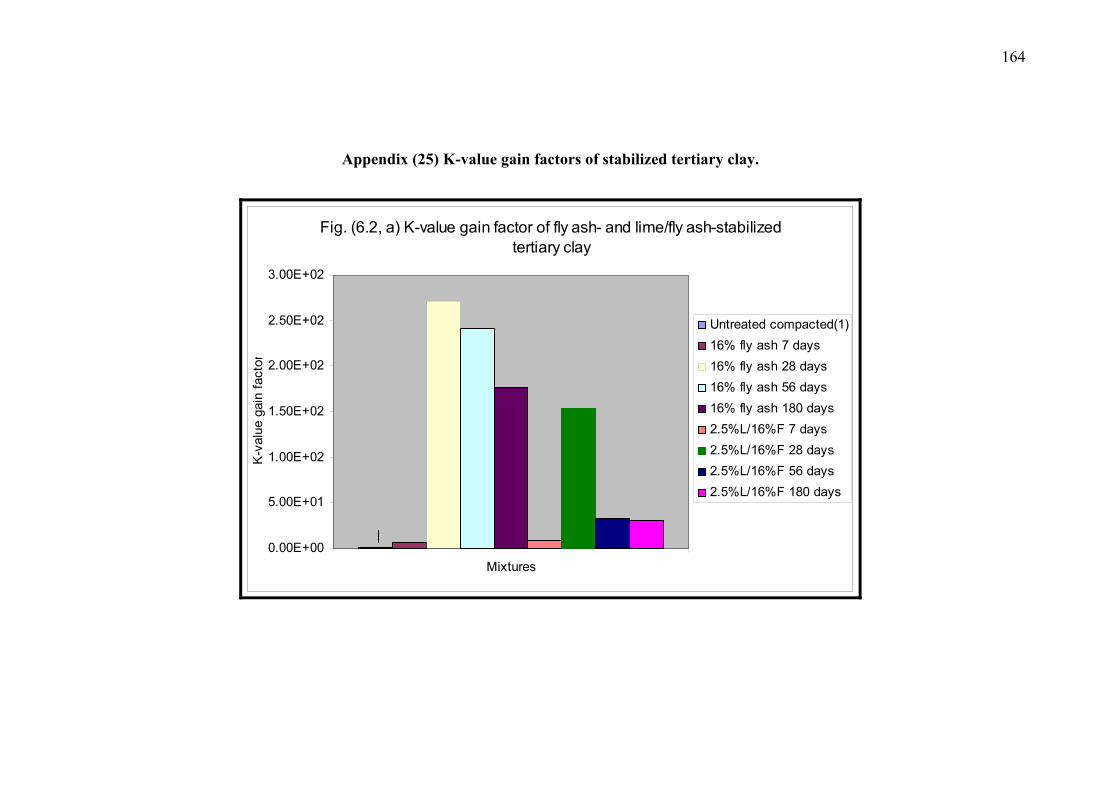
Appendix (25) K-value gain factors of stabilized tertiary clay.
Fig. (6.2, a) K-value gain factor of fly ash- and lime/fly ash-stabilized tertiary clay
0.00E+00
5.00E+01
1.00E+02
1.50E+02
2.00E+02
2.50E+02
3.00E+02
Mixtures
K-v
alue
gai
n fa
ctor
Untreated compacted(1)16% fly ash 7 days16% fly ash 28 days16% fly ash 56 days16% fly ash 180 days2.5%L/16%F 7 days2.5%L/16%F 28 days2.5%L/16%F 56 days2.5%L/16%F 180 days

165
Appendix (26) K-value gain factors of stabilized organic silt.
Fig. (6.2, b) K-value gain factor of fly ash- and lime/fly ash-stabilized organic silt
0.00E+00
1.00E+02
2.00E+02
3.00E+02
4.00E+02
5.00E+02
6.00E+02
7.00E+02
8.00E+02
Mixtures
K-v
alue
gai
n fa
ctor
Untreated compacted(1)20% fly ash 7 days20% fly ash 28 days20% fly ash 56 days20% fly ash 180 days2%L/20%F 7 days2%L/20%F 28 days2%L/20%F 56 days2%L/20%F 180 days

166
Appendix (27) K-value gain factors of stabilized weathered soil.
Fig. (6.2, c) K-value gain factor of fly ash- and lime/fly ash-stabilized weathered soil
0.00E+00
5.00E+02
1.00E+03
1.50E+03
2.00E+03
2.50E+03
3.00E+03
Mixtures
K-v
alue
gai
n fa
ctor
Untreated compacted(1)35% fly ash 7 days35% fly ash 28 days35% fly ash 56 days35% fly ash 180 days3%L/35%F 7 days3%L/35%F 28 days3%L/35%F 56 days3%L/35%F 180 days

167
Appendix (28) Calculation of Vp-value for tertiary clay
Admixture mixing
Curing time
X
Average of ta
Vp-value
L (%)
FA (%)
Days (m) (μs) (m/sec)
0 0
0 0
Natural soil Untreated
compacted
0.12 0.12
186.6 179.9
643 667
4.5* 6.5 8.5
0 0 0
7 7 7
0.12 0.12 0.12
84.6 76.5 75.0
1418 1568 1600
0 0 0
0 0
8 12 16* 20 25
7 7 7
28 56
180 7 7
0.12 0.12 0.12 0.12 0.12 0.12 0.12 0.12
115.5 98.8 91.4 79.3 78.1 77.2 78.1 80.8
1039 1215 1309 1513 1536 1600 1537 1485
2.5* 1.5 2.5 4.5 6.5
8* 16 16 16 16
7 7 7
28 56
180 7 7
0.12 0.12 0.12 0.12 0.12 0.12 0.12 0.12
91.3 80.5 80.2 72.5 67.2 64.0 83.6 87.5
1314 1491 1496 1655 1786 1875 1435 1371
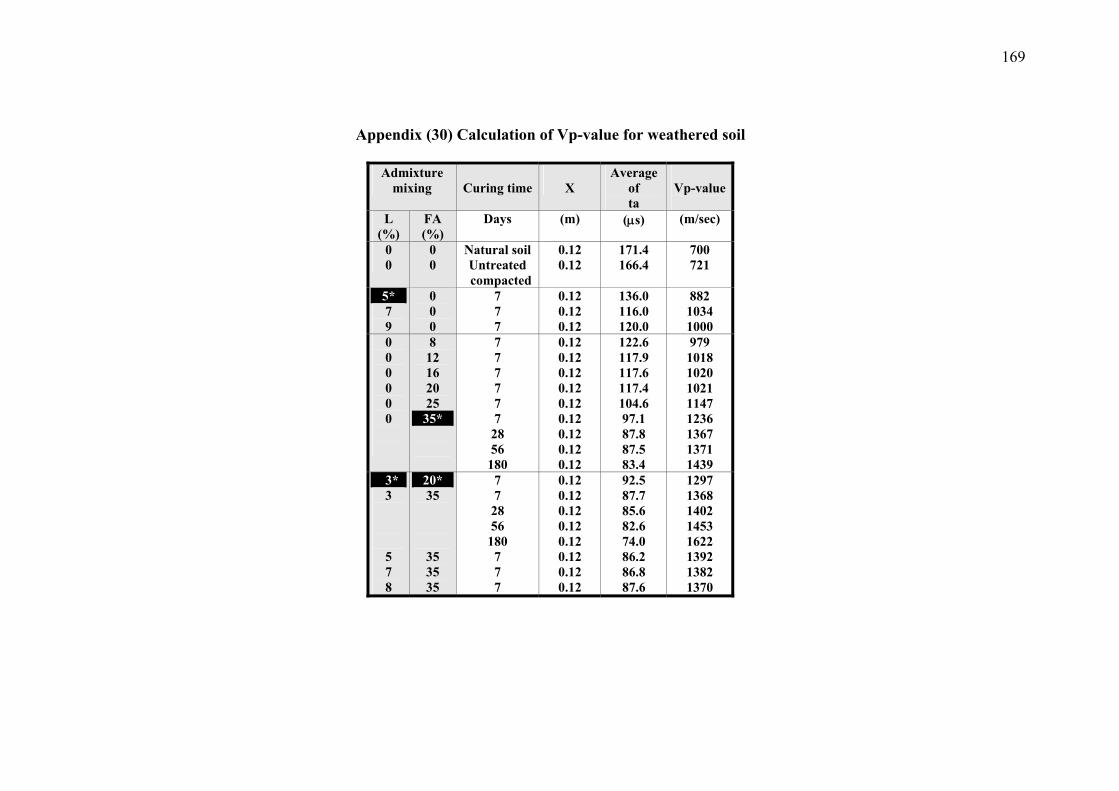
X = Height (thickness) of the specimen (m) ta = Average (4-Measurments) of arrival (travel)-time (μs)
Vp = Velocity of ultrasonic p-wave (m/sec)

168
Appendix (29) Calculation of Vp-value for organic silt
Admixture mixing
Curing time
X
Average of ta
Vp-value
L (%)
FA (%)
Days (m) (μs) (m/sec)
0 0
0 0
Natural soil Untreated
compacted
0.12 0.12
283.0 258.2
424 465
3* 5 7
0 0 0
7 7 7
0.12 0.12 0.12
140.8 124.9 130.8
852 961 917
0 0 0 0
0
8 12 16 20* 25
7 7 7 7
28 56
180 7
0.12 0.12 0.12 0.12 0.12 0.12 0.12 0.12
153.6 137.0 125.9 118.7 97.7 92.5 84.5
109.3
781 876 953 1011 1228 1297 1420 1098
2* 2
3 5
12* 20 20 20
7 7
28 56
180 7 7
0.12 0.12 0.12 0.12 0.12 0.12 0.12
129.2 121.1 101.9 89.4 83.7
118.5 126.5
929 991 1178 1342 1434 1013 949
169
Appendix (30) Calculation of Vp-value for weathered soil
Admixture mixing
Curing time
X
Average of ta
Vp-value
L
(%) FA (%)
Days (m) (μs) (m/sec)
0 0
0 0
Natural soil Untreated
compacted
0.12 0.12
171.4 166.4
700 721
5* 7 9
0 0 0
7 7 7
0.12 0.12 0.12
136.0 116.0 120.0
882 1034 1000
0 0 0 0 0 0
8 12 16 20 25 35*
7 7 7 7 7 7
28 56
180
0.12 0.12 0.12 0.12 0.12 0.12 0.12 0.12 0.12
122.6 117.9 117.6 117.4 104.6 97.1 87.8 87.5 83.4
979 1018 1020 1021 1147 1236 1367 1371 1439
3* 3
5 7 8
20* 35 35 35 35
7 7
28 56
180 7 7 7
0.12 0.12 0.12 0.12 0.12 0.12 0.12 0.12
92.5 87.7 85.6 82.6 74.0 86.2 86.8 87.6
1297 1368 1402 1453 1622 1392 1382 1370