appendix to part i some specific research projects …978-94-009-4740...appendix 75 appendix to part...
TRANSCRIPT

APPENDIX 75
APPENDIX TO PART I Some specific research projects on greenhouses
In this appendix, seven projects in the area of solar energy applications in the greenhouse sector are described in detail.
1. EVALUATION OF DIFFERENT COVERING MATERIALS FOR GREENHOUSE PRODUCTION OF STRAWBERRIES (Belgian project, cf. p. 76)
2. THE BIOLOGICAL EFFECTS OF ENERGY SAVINGS IN GREENHOUSES (Danish project, cf. p. 84)
3. EVALUATION OF DOUBLE-COVERED POLYTHENE GREENHOUSES FOR EARLY TOMATO PRODUCTION (Irish project, cf. p. 95)
4. COMPARISON OF THE LIGHT TRANSMISSION OF GREENHOUSES COVERED WITH TWINWALLED SHEETS OF POLY CARBONATE AND ACRYLIC (English proj ect, cf. p. 104)
5. GREENHOUSE CLIMATIZATION BY MEANS OF HELIOBLOCS (French project, cf. p. 111)
6. GREENHOUSE CLlMATIZATION BY AN EARTH-AIR HEAT EXCHANGER (Greek project, cf. p. 122)
7. DEVELOPMENT OF A SOLAR SYSTEM FOR HEATING GREENHOUSES (Greek project, cf. p. 131)
The reporting formats used to compile the detailed descriptions are explained in the ADDENDUM, p. 467. The numbering of the subheadings in the detailed descriptions corresponds to the reporting format.

APPENDIX 76
1. Evaluation of different covering materials for greenhouse production of strawberries
Project location
GEMBLOUX. BELGIUM
Study Center : - Project Leader - Institution :
Running since 1979.
Project description
Prof. J. Deltour Faculte des Sciences Agronomiques de l'Etat State University 8 Avenue de la Faculte 5800 Gembloux Belgium
The strawberry crop is grown in different greenhouses of similar size (18 m2 -22 m2 ). This research is part of a program of similar experiments with other vegetable crops (lettuce and tomatoes). The main objective is to evaluate the relation between the plant production and different covering materials. The research was also aimed to analyse the reaction on yield and quality of strawberries when energy saving covering materials are employed.

APPENDIX 77
Scheme
The site plant of the 9 greenhouses is as follows
N
()
D DB
SV 1 hortiplus covered greenhouse SV 2 glass doubled greenhouse with a polyethylene film SV 3 reference greenhouse SV 4 double glass greenhouse SP 1 polycarbonate covered greenhouse SP 2 acryl covered greenhouse TU 1 Ethylene Vinyl Acetate covered tunnel TU 2 polyethylene "Infrared" covered tunnel TU 3 polyethylene covered tunnel
Conclusions
The rate of air renewal differs greatly between the various types of greenhouses and depends very much on the wind speed. The strawberry crop is not very sensitive to variations of illumination and temperature conditions, as compared with lettuce and tomatoes. However, it is observed that the quality and the yield of strawberries, as found earlier with tomatoes and lettuce, are not exclusively correlated with light transmission. The final yield is mainly determined by the balance between temperature and light. Due to the limited dimensions of the greenhouse, the observed results have a very relative significance.

PROJECT ANALYSIS
1. Site and climate
1.1. Site
Latitude Longitude : Altitude : Nearest main city Distance from main city: Direction from main city Obstructions :
APPENDIX 78
1.3. Annual long-term averages
(Ov 30 er years : 1949 1979) -
1. Prevailing wind direction Winter Summer
2. Average wind speed W m/s S m/s
3. Total precipitation mm/yr 4. Relative humidity W %
S %
50°35' N 4°41'14" E
180 m Namur 20 km NW None
Project
SSW SSW 3.3 2.1 779 88 79
5. Global irradiation on MJ/(m2 .yr) 3 452 horizontal plane
6. Diffuse proportion 8. Hours sunshine 9. Ambient temperature
10. Average max. temp. (Jul/Aug) 11. Average min. temp. (Jan)
12. Meteorolo$ical station
2. Plant
2.1. Greenhouses
% hrs/yr C C C
52 1 553
9.1 26.2 -4.9
Gembloux (at distance of 2 km from site)
SV 1 Hortiplus (low emissivity glass) covered greenhouse SV 2 Greenhouse covered with glass. doubled with a polyethylene film SV 3 Reference greenhouse : glass cover SV 4 Double glass covered greenhouses
- Floor area : 18 m2
- Volume : 35.1 mS
- Glazing area 50.5 m2 (roof 21 m2 ; sides 29.5 m2 )
- Ventilation system 1 fan

SP 1 SP 2
Acryl (PMMA) covered Polycarbonate (8 mm) - Floor area : - Volume :
APPENDIX 79
greenhouse covered greenhouse
21.6 m2
51.8 mS
- Glazing area - Ventilation system
64.9 m2 (roof 24 m2 ; sides 40.9 m2 )
1 fan
TU 1 Ethylene Vinyl Acetate covered tunnel TU 2 Polyethylene "Infrared" covered tunnel TU 3 Polyethylene covered tunnel
- Foor area: 21.6 m2
- Volume : 34.9 mS
- Glazing area 47.6 m2
2.5. Installation parts and measuring devices
2. Description of the sensors - Temperature. NTC resistor IN 914 or Pt 100, giving an accuracy of
0.3°C in the range - 20°C + 90°C. Calibration is realised at 5°C and 50°C. The sensors are mounted in a black integrating sphere (radiation temp.) and in a reflecting cylinder (air temp.).
- Relative humidity. Rotronic RHTT with an accuracy of 2% in the range o - 100%; calibration at 80%. The sensor is mounted in a reflecting cylinder.
- Photosynthetic photon flux density. LICOR 190 S or MACAM SD 101 Q, giving an accuracy of 1% in the range 0 - 2000 uE/(m2 .s). The Macam sensors are calibrated against the Licor which is calibrated by the National Bureau of Standards. The sensors are mounted on horizontal levelling.
- Energy consumption. Standard kWh meters. - Wind speed. Standard cupola anemometer.
3. Scheme of measurement points (cf. figure 2.5.3.)
3. Products
3.1. Culture in greenhouse
(for: SV 1, SV 2, SV 3, SV 4, SP 1, SP 2, SP 3.)
1. Type of crop : Strawberry. 2. Date of sowing / planting : 01/08
harvesting : 15/04 - 15/06 3. Growing system : Conventional
4. Required temp. regime : min. temp. 15/01 night °c 5 day °c 8
max. temp. 35°C
15/02 7
10
15/03 10 15
7. How sensitive is the crop to light ? Low sensitivity.

E (J
0 ~
20C 92
E I I I
(J I 0 ~2 It)
~: } temperature O2 :
P
6 o:humidity and temperature
APPENDIX 80
P: Photosynthetic photon flux density
Fig. 2.5.3. Scheme of measurement points.
3.2. Culture in tunnels
(for: TU 1, TU 2, TU 3)
1. Type of crop : Strawberry 2. Date of sowing / planting : 01/08
harvesting : 15/04 - 15/06 3. Growing system: Conventional 4. Required temp. regime : min. temp.
max. temp. 7. How sensitive is the crop to light Low sensitivity.
4. Economic aspects (1)
4.1. Economic environment
1. Energy price of oil (ECU/1) 2. Energy price of electricity (ECU/kWh) 3. Energy price evolution prospects
(real terms) 5. Interest rate of loans for equipment
(1) presumabZy 1983 prices (N.D.T.E.)
0.33 0.11
+ l%/yr -12%/yr

APPENDIX 81
4.2. Investment expenses
Price of the different covering materials in ECU/m2 •
1. Hortiplus (low emissivity plan) 2. Glass doubled with a polyethylene film 3. Normal horticultural glass 4. Double glazing 5. PMMA-acryl 6. Polycarbonate 7. Ethyl Vinyl Acetate 8. Polyethylene "Infrared" 9. Polyethylene
5. Results
5.2. Weather conditions and energy
6 - 7 ECU/m2
3.9 + 2.3 ECU/m2
2.3 ECU/m2
17 - 18 ECU/m2
30 ECU/m2
11 - 14 FCU/m2
0.45 ECU/m2
0.45 ECU/m2
0.33 ECU/m2
For the period 15/01 - 30/05 the average ambient temperature was 6.44°C, the average wind speed 2.83 m/s and the average solar radiation 9.5 MJ/m2 •
The electricity consumption for the different houses, in MJ, was as follows
SV 1 SV 2 SV 3 SV 4 SP 1 SP 2 TU i TU 2 TU 3
9 360 4 586 9 450 8 440 4 530 8 640 8 506 5072
12 376
5.3. Inside climate of greenhouse or tunnel
1. arbient
2. outside SV1 SV2 S\T3 SV4 SP1 SP2 SP3 TU1
3. 10.0 5.0 5.1 4.9 5.2 5.1 4.9 5.0 5.0
4. 6.44 15.4 15.4 16.7 13.9 14.4 15.8 14.0 12.5
5. 16.0 34.9 37.2 35.3 32.6 39 . 35.1 30.0 32.6
6. 38.5 36.7 34.6 39.8 39.2 31.0 23.1 29.1 50.3
7. 78.8 71.0 86.2 88.9 85.0 72.7 66.8 66.6 82.8
8. 100 81.3 99.8 100 97.6 100 100 81.3 96.6
10. 100 42.9 45.4 53.3 48.6 53.2 40.7 23.9 60.3
fran : 15/01 PERICD
TU2 TU3 till: 30/05
5.3 5.1 ·c run. r 12.1 12.2 ·c average 'lDIPERATURE
33.4 30.2 ·c max.
47.8 56.4 % Mm. }
75.0 74.0 % :~ge Hl.lMlDlTY 85.3 78.9 %
56 51.4 % PAR (% of outsice)

APPENDIX S2
5.4. Crop results
SVI SV2 SV3 SV4
1. Date of sowing 01/0S olioS 01/0S 01/0S 2. Harvesting Date : 15/04-15/06 15/04-15/06 15/04-15/06 15/04-15/06 4. Flower number/plant
(24/3) 6 4 4 6 5. Fruit number/plant 22.1 21.0 22.5 19.4 6. Leaf area measure- -4 -4 -4 -4 ment/plant (m2 ) 23.97x10 19.44x10 19.54x10 22.S0xl0 7. Production obtained/
plant (gr) 304.7 294.6 363.5 301.6 S. Other differences :
yield ECU/pl. 11.64 10.14 12.72 10.SS 9. Half harvesting date OS/05 15/05 12/05 07/05
SP1 SP2
1. Date of sowing 01/0S 01/0S 2. Harvesting date : 15/04-15/06 15/04-15/06 5. Fruit number/plant 14.0 13.0 6. Leaf area measure- -4 -4 ment/plant (m2 ) 15.53xl0 1l.SOx10 7. Production obtained/
plant (gr) 243.9 204.7 8. Other differences :
yield ECU/pl. S.49 7.43 9. Half harvesting date 04/05 12/05
TUI TU2 TU3
1. Date of sowing 01/08 01/08 01/08 2. Harvesting date : 15/04-15/06 15/04-15/06 15/04-15/06 5. Fruit number/plant 12.7 16.8 13.1 6. Leaf area measure- -4 -4 16. 77x10-4 ment/plant (m2 ) 16.12xl0 16.S4xl0 7. Production obtained/
plant (gr) 205.5 236.8 224.3 8. Other differences :
yield ECU/pl. 6.4S 7.40 7.02 9. Half harvesting date 13/05 19/05 12/05
5.7. An example of some measured data
A number of data are available for a central computer system. Below an example is given of the average greenhouse temperature (sensors 0-9), the soil temperature and the average transmissivity of radiation for the different greenhouses. The data are the average on March Sth 19S3 from 7.30 - IS.30.

APPENDIX 83
Average green- Average soil Average house temp. temperature transmissivity
SVI 14.0oe 11 °C 0.48% SV2 18.4°e 12.soe 0.43% SV3 19.9°e - 0.60% SV4 20.8°C - 0.52% SPI 17.4°C Is.2°e 0.61% SP2 16.9°e 13.2°e 0.55%

APPENDIX 84
2. The biological effects of energy savings in greenhouses
Pro ject location
AARSLEV, DENMARK (since 1979)
Study Center - Project Leader M.G. AMSEN
O. FR0SIG NIELSEN - Institution : Danish Research Service for Plant and Soil Science
Project description
Research Centre for Horticulture Institute of Glasshouse Crops Department of horticultural engineering DK-5792 Aarslev, Kirstinebjergvej 10 DENMARK
In four greenhouses plant growth and use of energy are recorded. The four houses are identical with respect to dimensioning and technical installation, except for the following differences :
House 1 Covered with single glass (reference solution) House 2 Covered with double glass (Sedoglass 2.4) House 3 Covered with double aeryl (Stegdoppeltplatte 16 mm) House 4 Covered with single glass, and equipped with aluminized thermal
screens, which are activated at night.

APPENDIX 85
A selection of 7 different pot plants are grown in the houses. In houses 1 and 4 shading curtains are installed and activated also during night.
The main objective is to investigate how thermal screens and different coverings influence the heat loss from greenhouses and the plant growth in these houses.
The glasshouses are built according to a normal Danish wide span house equipped with rolling benches for maximum space utilization.
The heating system is dimensioned to keep a maximum temperature difference of 30 K between inside and outside.
The heating system is divided into top- and wall heating, floor heating (below the benches), and bench heating in the benches insulated with styropor downwards.
The three heating systems are controlled individually and energy consumption is measured separately for each system.
Furthermore, the total energy consumption for the whole house is measured independently.
The benches are equipped with a capillary watering and feeding system and covered with a matting which is kept wet constantly (as common in Danish pot plant nurseries).
Maximum air humidity is controlled by a hygrostat and mutual activation of the heating- and ventilation system.
Carbon dioxide is supplied at a steady flow rate which allows 1 200 ppm at an outside wind velocity of 4 m/s.
Scheme
The air temperature in the four greenhouses is controlled by a set point min. temperature, which is 17°C when the light intensity is below 300 Lux (1) outside and 20 0 e when the irradiation is higher than 300 Lux outside.
The bench temperature is controlled around a min. of 19°C.
The shading curtains are drawn when the irradiation is higher than 200 W/m2 ,
Both the shading curtains and the thermal screens are drawn when the irradiation is lower than 100 Lux outside.
The air ventilators are opened when the air temperature inside the greenhouse is higher than 28°C, or if the air humidity is higher than 92% R.H.
(l) "Lux" is a measure of the light intensity as the human eye perceives it. Cf. chapter 1, p. 11. (N.O.T.E.)

APPENDIX 86
The benches are watered with 3 mm of water, whenever 2 mm are evaporated from an evaporimeter.
Greenhouse no. I ~m I 16m I Um I 1. House covered with single glass
and shading curtains acting as a reference house.
E 2. House covered with double glass III
(sedoglass 2.4). ~
3. House covered with double acryl (stegdobbeltplatte 16 mm).
4. House covered with single glass, shading curtains and equipped E 4 2
with thermal screens, which are ... activated at night. ~
ON E III
'" '"
-'--
:3 1
Conclusions
By using double glass or double acryl for covering greenhouses or by installing aluminized thermal screens in greenhouses much energy for heating can be saved, as compared to a single glass covered house without thermal screens.
Results for the period 1/11/1981 - 30/4/1982
Average Average Re!. Average light House Heating energy room temp. humidity inside house
GJ reI. °c % W/m2
Thermal screens. 338 76 18.5 77 105 Double glass. 302 68 18.8 84 109 Double aery!. 273 61 19.1 83 105 Single glass 446 100 18.7 80 107 (reference)
The effect on plant growth of the different insulating materials has proved to be rather small. In some cases the use of insulating materials resulted in a shorter growth period. This means that even more energy may be saved per produced pot plant, as compared to production in a single glass covered house.
In the houses with double covering significantly higher relative humidity. plant growth has been observed.
materials there has been a However, no effect of this on

APPENDIX 87
It has been observed that the max. Rh was significantly higher in the houses with twin walled materials in spite of air humidity control set at 90% rho Due to installation of shading curtains the amount of light inside the four houses has been very similar, even though the cover materials have different light reductions. There is however still a difference between the houses when light intensity is low (shading curtains not used). In houses with twin walled covers, the heating system may be reduced significantly as compared to normal standards.
PROJECT ANALYSIS
1. Site and climate
1.1. Site
Latitude Longitude : Altitude : Nearest main city : Distance from main city Direction from main city : Obstructions :
1.3. Annual long-term averages
1. Prevailing wind direction 2. Average wind speed
3. Total precipitation 4. Relative humidity
5. Global irradiation on horizontal plane
7. Degree days (Base temp = 17°C) 8. Hours sunshine-9. Ambient temperature
10. Average max. temp. (July/Aug) 11. Average min. temp.
Note W = Winter S = Summer
(Jan)
W S
W S
55°18'29" N 10°26'53" E 10 m Odense 12 km South None
Project
-1 SW W
mS_ 1 ms mm/yr 631 % % MJ/(m2 yr)
°c days 3 191 hrs/yr 1 777 °c 7.9 °c °c
Country in general
SW W 3.6 3.0 664
85 73
3 635
3 209 1 739
7.9 20.8
- 2.4
APPENDIX 88
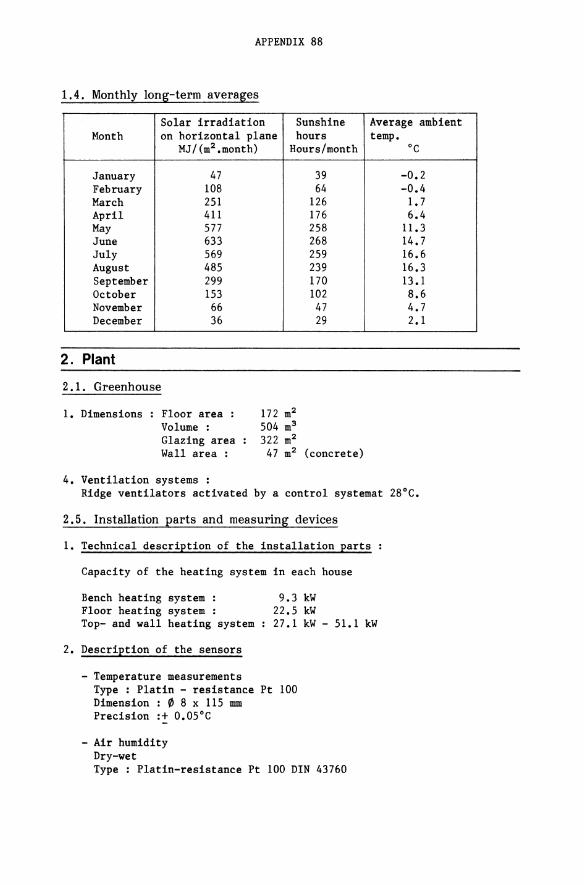
1.4. Monthly long-term averages
Solar irradiation Sunshine Average ambient Month on horizontal plane hours
MJ/(m2 .month)
January 47 February 108 March 251 April 411 May 577 June 633 July 569 August 485 September 299 October 153 November 66 December 36
2. Plant
2.1. Greenhouse
1. Dimensions: Floor area: Volume : Glazing area Wall area
4. Ventilation systems :
Hours/month
172 m2
504 m3
322 m2
39 64
126 176 258 268 259 239 170 102
47 29
47 m2 (concrete)
temp. °C
-0.2 -0.4
1.7 6.4
11.3 14.7 16.6 16.3 13.1 8.6 4.7 2.1
Ridge ventilators activated by a control systemat 28°C.
2.5. Installation parts and measuring devices
1. Technical description of the installation parts
Capacity of the heating system in each house
Bench heating system : Floor heating system : Top- and wall heating system
2. Description of the sensors
- Temperature measurements
9.3 kW 22.5 kW 27.1 kW - 51.1 kW
Type : Platin - resistance Pt 100 Dimension : 0 8 x 115 mm Precision :+ 0.05°C
- Air humidity Dry-wet Type : Platin-resistance Pt 100 DIN 43760

APPENDIX 89
- Waterflow Indication : Magnetic flowmeter Precision :+ 1% Fabr. : Fischer & Porter
- Solar irradiation on horizontal plane (Kipp solarimeter) Wavelength Range: 300 nm to 2.5 ~m Accuracy within 1%; linearity < 1%; temperature coefficient 0.15%/K
- Infrared measurement instrument Objective : K Range : 0-100°C Emission: 0.95 Fabr. : Heimann.
3. Measurement points (cf. figure 2.5.3.)
top and wall heating system
item 3 ~ ~item 1
bench heating system
floor heating system
Key 0 Temperature sensor. 6 Relative humidity sensor. of' Windspeed sensor • .D. Solar irradiation sensor.
( ® and ~ are input variables in the regulation system)
Figure 2.5.3. : Scheme of the measurement points
item4
()
(For an explanation of the indicated items, see next page).

APPENDIX 90
Item In the centre of the greenhouse an aspirated box measures the air temperature and the air humidity.
Item 2 Above the top heating pipes the solar irradiation on horizontal plane is measured.
Item 3 By infrared measuring instruments the temperature of the roof inside and the temperature of the leaves are measured.
Item 4 Outdoor climate results are given by the meteorological station at the Research Centre.
Further measurements : Inlet water temperature, outlet water temperature and circulating waterflow for bench, top and wall, floor and total system.
All measurements are collected and stored on line on disk and tape by the local computer of the Research Centre.
3. Products
3.1. Culture in greenhouse
1. Type of crop A selection of 7 different types of green foliage or flowering pot plants is used :
3.
4.
5.
Chrysanthemum 'Yellow Mandalay'; Codiaeum variegatum 'Hollufiana'; Diffenbachia maculata 'Compacta'; Ficus benjamina; Hedera canariensis 'Gloire de Marengo'; Kalanchoe blossfeldiana 'Anette' and Saintpaulia ionantha 'Ballet'.
Growins s~stem Capillary benches.
Reguired temE' reSime min. temp. : l7°C; max. temp. 28°C.
Reguired humidit~ resime max. relative humidity : 90%
6. .£2.2 regime CO2 is supplied at a steady flow rate which allows a concentration of 1 ZOO ppm for an outside wind velocity of 4m/s.
4. Economic aspects
4.1. Economic environment
1. Energy price of oil 2. Energy price of electricity 3. Energy prices evolution prospects
- of oil or gas - of electricity
ECU/1 ECU/kWh
%/yr %/yr
0.12 - 0.25 0.063
10 10

APPENDIX 91
4.2. Investment expenses (1)
HOUSE 1 HOUSE 2 HOUSE 3 HOUSE 4
1. Total investment budget ECU 45 600 52 300 52 200 50 000
2. Cost of equipment : - cost of greenhouse per m2 ECU 138 201 201 187 - cost of regulation equipment ECU 5 500 5 800 5 800 5 800 Measurement - and registration equipment ECU 12 100 12 100 12 100 12 100
3. Time of personnel for the con-ception, installation and start-up of equipment man-months 9 9 9 9 Cost of personnel for the con-ception, installation and start-up of equipment ECU 17 350 17 350 17 350 17 350
4. Lifetime of the equipment Years 20 20 20 20
(1) Built in 1979 Monetary unit year 1979
4.3. Operating expenses (over period 1/11/81-30/4/82)
HOUSE 1 HOUSE 2 HOUSE 3 HOUSE 4
2. Maintenance cost ( replacement of material or components) - spare parts (mostly plants) ECU 1 550 1 550 1 550 1 550 - salaries (internal-external) ECU 6 200 6 200 6 200 6 200
4. Other manpower costs man-month 15 15 15 15 ECU 31 000 31 000 31 000 31 000
5. Results
5.2. Energy
I. Results measured over the period of 1/11/81 - 30/4/82
HOUSE 1 HOUSE 2 HOUSE 3 HOUSE 4
4. Heating energy (non-solar) GJ 446 302 273 338 5. Energy for operation
(pumps, fans, ••• ) GJ 3 3 3 3
II. Calculated energy consumption per m2 for a standard greenhouse of 20 x 50 m2 based on a Danish reference year. (cf. figure 5.2)

APPENDIX 92
Accumulated GJ/m2
3.0 y--------------, 2.7
2.4 single glass and shading curtains
2.1 twinwalled acryl ("stegdoppel")
1.8
1.5
1.2
o.g
0.6
0.3
0.0 ~+-+-+-+--+-+-+-+-+--+--+--I
jan feb mar apr may jun jul aug sep oct nov dec
Accumulated GJ/m2
3.0 ~-------------,
2.7
2.4
2.1
1.8
1.5
1.2
0.9
0.6
0.3
single glass. thermal screen and
shading curtains
twinwalled glass (sedo)l
0.0 -F-+--+-+-+--+-+--+--+--+--+--+--l
jan feb mar apr may jun jul aug sep oct nov dec
Fig. 5.2. : Calculated energy consumptions as a function of covering materials for a standard greenhouse (20x50 m2 ) in Denmark.
5.3. Inside climate (measuring period of 1/11/85 - 30/4/85)
HOUSE 1 HOUSE 2 HOUSE 3 HOUSE 4
1. Temperature : min. DC 15.9 16.1 16.4 15.5 average DC 18.8 18.8 19.1 18.5 max. DC 28.4 28.3 28.6 28.1
2. Humidity : min. % 54 53 57 47 average 80 84 83 77 max. -2 93 95 94 93
3. Light : average Wm 107 109 105 105
5.4. Crop results
HOUSE 1 HOUSE 2 HOUSE 3 HOUSE 4
1. Date of planting 1/10 1/10 1/10 1/10 2. • Harvesting date (production
time in number of days) Chrysanthemum 62.3 66.7 64.8 62.5 Codiaeum 145.5 140.8 133.4 138.8 Diffenbachia 108.3 107.3 109.3 103.7 Ficus benjamina 143.6 139.7 129.6 132.5 Hedera 55.9 60.9 52.1 50.9 Ka1anchoe 109.4 107.0 106.2 106.1 Saintpaulia 76.7 80.0 82.4 74.5 . mg • dry weight/
cm2 leaf area Chrysanthemum 2.0 1.8 2.0 2.0 Codiaeum 65.2 64.0 72.0 67.8 Diffenbachia 29.6 31.4 29.7 35.0 Ficus benjamina 6.4 6.1 6.0 6.3 Hedera 3.3 3.1 3.2 3.3 Kalanchoe 6.9 6.5 6.2 6.4 Saintpaulia 5.6 5.3 6.1 4.9

APPENDIX 93
HOUSE 1 HOUSE 2 HOUSE 3 HOUSE 4
• Dry matter of saleable plants (g/p1ant)
Chrysanthemum 3.8 3.4 4.2 3.7 Codiaeum 11.9 11.1 11.2 11.8 Diffenbachia 6.7 6.5 7.2 6.6 Ficus benjamina 8.8 8.0 8.2 7.8 Hedera 3.5 3.5 3.4 3.3 Ka1anchoe 8.4 7.2 8.6 7.3 Saintpaulia 4.0 3.5 4.4 3.8
• Fresh weight of saleable plants (g/p1ant)
Chrysanthemum 45.1 41.6 48.2 45.9 Codiaeum 62.1 56.6 60.1 60.3 Diffenbachia 82.4 77 .2 89.7 83.9 Ficus benjamina 33.4 31.0 32.5 30.2 Hedera 22.8 22.2 21.9 21.4 Ka1anchoe 170.9 152.2 179.3 149.3 Saintpaulia 89.2 76.4 ' 94.6 95.6
It was expected that light reduction in the permanently insulated greenhouses (nos. 3 and 4) would have a severe influence on dry matter production and growth rate of the different types of potp1ants : this was only the case for a few plants.
5.6. Average Water temperature (OC)
HOUSE 1 HOUSE 2 HOUSE 3 HOUSE 4
Inlet bench 38.9 32.9 30.4 36.1 Outlet bench 36.6 31.3 28.9 34.2 Inlet floor 60.3 53.3 49.9 53.5 Outlet floor 52.2 46.5 44.1 46.8 Inlet top/wall 43.2 35.1 35.2 30.7 Outlet top/wall 40.0 32.2 32.4 28.7 Inlet total 84.0 83.7 83.2 83.2 Outlet total 63.3 66.0 66.7 66.9
5.7. An example of some measured data (cf. figures 5.7.1 and 5.7.2)
The measurments are stored on disk and tape of the computer installation of the Research Station. The measurements are available for every hour and different computer programs allow a printout and a graphical scheme of the recorded values for each greenhouse. Below an example is given of the average leaf temperature over the period March 16-April 30 1982 in greenhouse 1 and greenhouse 2.

APPENDIX 94
Temperature ·C 40
30
20
10
o o 1 2 3 4 5 6 7 8 9 10 11 12 13 14 15 16 17 18 19 20 21 22 23 Hour
• max values o averages IIlII[[J min values
Fig. 5.7.1 Leaf temperature in the reference greenhouse, March 16-April 30 1982.
Temperature ·C
o 1 2 3 4 5 6 7 8 9 10 11 12 13 14 15 16 17 18 19 20 21 22 23 Hour
max values o averages IIIIIIIIl min values
Fig. 5.7.2. Leaf temperature in the double glass greenhouse, March / 16-April 30 1982.

APPENDIX 95
3. Evaluation of double - covered polythene greenhouse for early tomato production
Project location
DUBLIN. IRELAND
Study Center : - Project leader - Institution :
Running since 1977
Project description
Dr. T. O'FLAHERTY Kinsealy Research Centre Malahide Road Dublin 5 IRELAND
The project is based on a triple-span 30 m x 20 m double covered polythene greenhouse. with a piped hot water heating system. The control of heating. ventilation and CO2 supplementation in the greenhouse is incorporated in an integrated system involving a Nascom 2 microcomputer. with analogue back-up which takes over automatically in the event of computer failure. The input parameters to the control system are the temperature, relative humidity and CO concentration in the greenhouse, and the temperature. relative humtdity and light intensity outside. The control strategy to be implemented through the microcomputer software

APPENDIX 96
will have the following main objectives.
(1)
(2)
(3)
to achieve desired values of air temperature in the greenhouse, in accordance with outside light intensity. to achieve desired levels of CO 2 concentration in the greenhouse, in accordance with outside light intensity (i.e. day or night). to moderate the rise of humidity levels in the greenhouse by the use of ventilation, within certain limits of energy consumption, as determined by prevailing levels of inside and outside temperature and humidity.
Scheme
Over a range of conditions the energy requirement of a single-clad polythene greenhouse and of a traditional glasshouse are closely similar. Therefore it is reasonable to consider that the heating energy data given here for the single-covered polythene reference solution (where no use is made of the studied climate regulation system) are applicable also to a classical single-glazed glasshouse fully equipped with conventional environmental control facilities.
The heating system in such a house is normally a piped hot-water system supplied from an oil-fired boiler. In a typical commercial unit of area 0.4 ha, the system is designed to supply a peak heating load in the glasshouse of about 900 kW. The temperature of the water in the heating pipes is controlled by a mixing valve, which in turn is controlled from a temperature sensor in the glasshouse.
GREENHOUSE
Steam Valve ventilator
rb-, I .~,~--~------~ I I __ ..J
~ & Temperature sensor. $ Relative humidity sensor. ~Solar radiation sensor.
CONTROL BUILDING
i I \. ____ --.I-i---------~ • CO2 controller
controlled relays
All the indicated sensors provide the measured variables as input parameters to the control unit.

APPENDIX 97
Ventilation is provided by ridge ventilators in the roof of the glasshouse, giving a total ventilator opening area equal to approximately one sixth of the floor area of the house. The degree of ventilator opening under any given temperature conditions in the glasshouse is controlled by a thermostat, acting normally through a PI or PIn controller.
No special provision is generally made for control of humidity in the glasshouse.
Carbon dioxide (C02) supplementation is provided by propane burners. In a 0.4 ha unit ten burners each with a consumption of 0.9 kg/h are sufficient to provide enrichment to a level of approximately 1 000 ppm.
Watering and plant feeding is provided through a trickle irrigation system whereby each tomato plant is supplied through an individual drip nozzle.
The growing system to be used is a ground NFT (nutrient film technique) system. This means that the floor of the house is graded to a slope of 1 in 50 and rolled and covered with fine gravel. The polythene gullies are laid directly on the floor, with polystyrene slabs under them for insulation. The system is split half way along the house so that the gully length is 14 m. Solution warming is provided by a 9 kW immersion heater in the reservoir.
Conclusions
The heating energy used by a triple-span double-clad polythene greenhouse over the period January 1 to November 9 was 1 624 MJ/m2, while the amount used by the reference single-clad polythene house over the same period was 2 013 MJ/m2•
The transmission of photosynthetically active radiation (PAR) by the triple-span double-clad house was 60.5%.
The yield of tomatoes by June 30 in the double-clad house was 14.3 kg/m2, compared to 10.2 kg/m2 in the reference house.
Double polythene greenhouses have wide potential application in the northern countries of the European community, because of the substantial reduction in energy requirements which they offer together with their low capital cost compared with traditional glasshouses. Their effective and economic application will be particularly aided by the implementation of lowcost microcomputer techniques for climate control.
The most important area where future work will be needed is likely to be in the further development and refinement of climate control techniques; this will relate both to the performance and reliability of sensing devices and control hardware, and also to the improvement of control strategy through further development of software. Work is also likely to be needed in the application of similar techniques to types of energy-conserving greenhouses other than double polythene houses.

APPENDIX 98
Further references
O'FLAHERTY, T., Some methods of reducing fuel requirements for greenhouse heating. In "Technical and Physical aspects of Energy Saving in Greenhouses", CEC Pub!. No. EUR 567ge, 67-71. (1977)
O'FLAHERTY, T. and MAHER, M.J., .Fuel consumption and crop performance in double-covered polythene greenhouses. Acta Hort. 107, 81-85. (1981)
O'FLAHERTY, T. and GRANT, J., Use of double cladding techniques to reduce greenhouse heat loss. Acta Hort. (1983)
PROJECT ANALYSIS
1. Site and climate
1.1. Site
Latitude Longitude : Altitude : Nearest main city Distance from main city Direction from main city :
53°25' N 6°10' W
20 m Dublin 11km North
Obstructions : No significant obstructions
1.3. Annual long-term averages
1. Prevailing wind direction W S
2. Average wind speed W m/s S m/s
3. Total precipitation mm/yr 4. Absolute humidity W g/kg
S g/kg 5. Global irradiation on
horizontal plane MJ / (m2 yr) 6. Diffuse proportion % 7. Degree days (Base temp. = 4.4°C) C days 8. Hours sunshine hrs/yr 9. Ambient temperature C
10. Average max. temp. (July/Aug.) C 11. Average min. temp. (Jan.)
Note : W = Winter S = Summer
12. Meteorological station 13. Latitude : 14. Longitude : 15. Altitude 16. Distance from site
C
Dublin Airport 53°26' N
6°15' W 68 m 5km
Project
W-SW W-SW 5.8 4.6 763 4.5 8.5
3 800 60
2 004 1 470
9.6 18.8 1.9
Country in general
SW SW
3.8-8.3 3.8-6.7 720-2 600
3 600 60
1 770-2 270 1 300-1 650
9.0-10.5 18.0-20.0 1.0-4.5

APPENDIX 99
2. Plant
2.1. Greenhouse
1. Dimensions - Floor area : 600 m2
- Volume : 1 950 m3
- Glazing area 1 000 m2
2. Glazing : Double polythene (air-inflated) 3. Covers/Screens : None 4. Ventilation system: 2 x 1.2 m propellor fans.
2.5. Installation parts and measuring devices
2. Description of the sensors
- Temperature (T ., T ) : - Wirewound PRT a~ ao _ BS1904 Grade II
- Humidity (RH i' RH ) a ao
- Solar radiation
- Precision: 0.1 C - Range : ~100 ••• + 100C
- Va:l.sala : Humicap HMP 2lU - Precision : +2% - Range: 0 •• : 100%RH
Kipp and Zonen Solarimeter CM 5/6 - Accuracy: +0.1%
- TFDL Selenium Flat, responsive to photosynthetically active radiation
- Flowrate (heating water) - Kiercol SF 200 8
- Temperature (heating water)
- Heat consumption (H)
- CO2-concentration (C)
- Wind speed (v)
- Accuracy : + 1% FSD - Range : 200-litre/min
- PRT (as for Ti, To)
- Computation from heating water flowrate and flow and return temperature by Nascom 2 microcomputer
- Siemens CO2 Analyser Type Ms2080 - A61 - Accuracy: + 100 ppm at 0.1% - Range : 0 -3000 ppm
- Vector Instruments photo-electric anemometer
- A100M - Accuracy: +2% +-0.1 m/s

APPENDIX 100
3. Scheme of measuring points (cf. figure 2.5.3.)
a I I I ~
c 3 X 38 mm pipes on walls
38mm loops
20m
~~windspeed and permanent solar radiation sensors o air temperature sensors o relative humidity sensors
I I I I ,
PARo ' PARi portable PAR sensors used for measurement of PAR transmission of greenhouse at multiple positions within the house measurement of heating water flowrate and temperature for Q computation of rate of heat consumption Q measurement of CO 2-concentration for CO2-supplementation system
C
Figure 2.5.3. Scheme of the measuring points
3. Products
3.1. Culture in greenhouse
1. Type of crop : tomatoes 2. Date of planting : February
harvesting : April - October 3. Growing system: Nutrient film technique
zone warming (NFT) with root
16°C 25°C
4. Required temperature regime : min. temp. max. temp.
6. Required CO2 regime : min. CO2 : 0.03% max. CO 2 : 0.1%
7. How sensitive is the crop to light? Highly sensitive 8. Other (related), crops which require an analogous inside
climate and luminosity : Cucumbers, peppers, aubergines.
control of

APPENDIX 101
4. Economic aspects
Incl. V.A.T. 1983
4.1. Economic environment
1. Energy price of oil ECU/l 0.28 2. Energy price of electricity ECU/kWh 0.109 3. Energy prices evolution
4. Manpower cost
5. Interest rate of loans for farm equipment (rate without subsidy)
6. Subsidies available for the solar and competitor farm equipment
4.2. Investment expenses
1. Total investment budget
Oil may remain stable Electricity may increase by 5-10%/yr (i.e. the same as inflation rate) 261 ECU per man-day (professional) 180 ECU per man-day (technical)
17%/yr
25% (as capital grant)
double Reference polythene
ECU 52 800 75 000 (materials only-600 m2 floor area)
2. Cost of equipment : - expenses for buildings ECU/m2 25 62 - cost of regulation equipment ECU/m2 20 20 - other material costs ECU/m2 43 43
3. - Time of personnel for the conception, installation and start-up of equipment man-days 200 200
- Cost of personnel for the conception, installation and start-up of equipment ECU 44 000 44 000
4. Lifetime of the equipment years (evaluation) 15 20
5. Residual value of the investment ECU Nil Nil
4.3. Operating expenses
Double ~eference Polythene
1. Energy cost ECU/year 4 500 7 000 2. Maintenance cost (replacement 450
of materials or components) (polythene) - spare parts 450 None - salaries (internal-external) 750 750
3. Hire of surface for the installation None None 4. Other manpower cost ECU/yr 15 000 15 000 6. Raw material cost ECU/yr 11 200 11 200

APPENDIX 102
4.4. Hidden cost and benefits
Double Reference polythene
1. Production obtained (kg tomatoes/ m2 floorarea by June 30) 14.3 10.2
2. Average sales price per unit produced ECU/kg 0.75 0.75
3. Total income obtained per greenhouse of 600 m2 ECU 6 420 4 560
5. Results
5.2. Weather conditions and energy
1. Dec Jan Feb '1ar Anr ~1ay Jun Jul AU<1 Sep Oct Nov Ibnth PERIal
2. 21 31 28 31 30 31 30 31 31 30 31 9 Days ref.erence year
3. 7.5 4.1 5.3 7.3 7.6 10.5 12.3 15.6 14.7 12.8 11.7 6.0 ·C average rurbient TEMP
4. 4.0 3.5 3.5 4.1 4.1 2.5 2.7 2.8 2.6 3.1 3.6 4.0 nVs average \"I]}[)
46 t-IJ/i OJ
II. 169 322 334 305 154 124 41 26 54 86 132 AUXILIARY HE1'.TIN:; eneray Q) C
13. 211 402 417 381 193 155 52 33 68 108 165 57 t-IJ/m2 OIL coosurrpticn n=0. 7 ~.1! .g~
14. 0 0.08 0.14 0.16 0.27 1.15 1.7 2.5 2.2 1.15 0.92 0.11 t-IJ/i EUXTRICTIY ronsurpticn a 48 t-IJ/i
Q)
15. - 479 443 401 224 149 42 14 38 64 110 HEATIN:; energy u ai-
17. - 599 554 501 280 186 52 19 48 80 138 60 t-IJ/i OIL coostmpticn ,,8 Q)-
o lu/m2 ...
18. - 0 0.1 0.3 0.5 1.3 3.9 9.5 6.1 1.8 0.9 ELECl'RICITY coosUllPt:ion \'!
5.3. Inside climate of greenhouse
I. Dec Jan feb ~1ar Apr llay Jun Jul Aug Sep Oct Nov r-bnth
2. 21 31 28 31 30 31 30 31 31 30 31 9 Days
3. 13.5 17.0 17.0 18.0 15.0 15.0 15.0 15.0 15.0 15.0 15.0 15.0 ·c :: }TF11PERAWRE 5. 15.5 17.0 17.0 25.0 25.0 25.0 25.0 25.0 25.0 25.0 25.0 17.0 ·c
9. 28 44 62 124 233 365 327 327 275 153 116 69 W/m2 Radiation
12. 0.1 0.1 0.1 0.1 0.1 0.03 0.03 0.03 0.03 0.03 0.03 0.03 % Average CO2
14. 17.0 17.0 17.0 17.0 17.0 17.0 17.0 17.0 17.0 17.0 17.0 17.0 ·C
:: }IDPrnAWRE ~ 16. 17.0 17.0 17.0 25.0 25.0 25.0 25.0 25.0 25.0 25.0 25.0 17.0 ·C· ~ 20. 36 55 78 155 293 458 410 410 345 197 145 86 w/m2 Radiatioo ~
23. 0.1 0.1 0.1 0.03 0.03 0.03 0.03 0.03 0.03 0.03 0.03 0.03 % Average CO2 \'!
5.4. Crop results
double polythene reference
1. Date of planting : 20 February 28 February 2. Harvesting date : 5 April-12 Nov. 25 Apr.-30 June 3. Flowering date : 14 February 7. Production obtained : 14.3 (by 30 Jun) 10.2 (by 30 Jun)
(kg/m2 ) 30.3 (by 12 Nov) -
APPENDIX 103
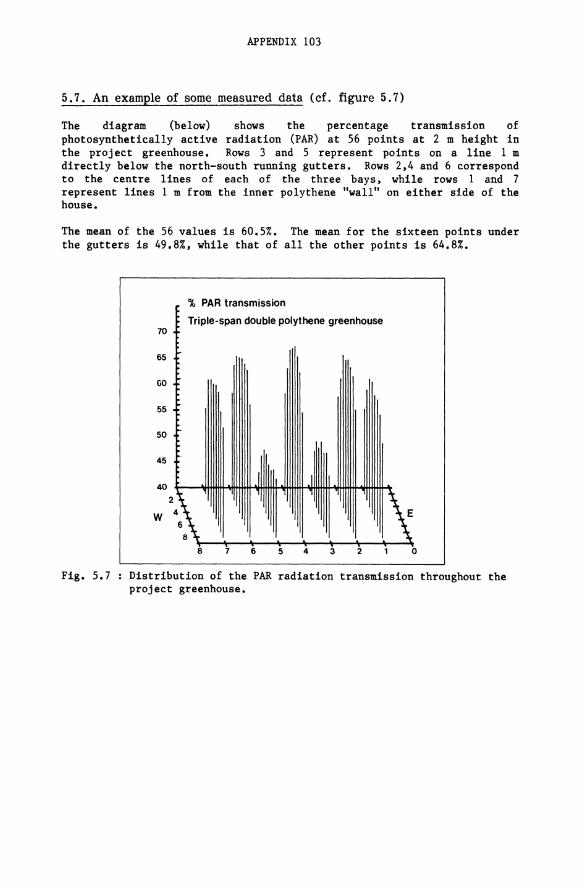
5.7. An example of some measured data (cf. figure 5.7)
The diagram (below) shows the percentage transmission of photosynthetically active radiation (PAR) at 56 points at 2 m height in the project greenhouse. Rows 3 and 5 represent points on a line 1 m directly below the north-south running gutters. Rows 2,4 and 6 correspond to the centre lines of each of the three bays, while rows 1 and 7 represent lines 1 m from the inner polythene "wall" on either side of the house.
The mean of the 56 values is 60.5%. The mean for the sixteen points under the gutters is 49.8%, while that of all the other points is 64.8%.
% PAR transmission
Triple-span double polythene greenhouse 70
65
GO
55
50
45
w
Fig. 5.7 Distribution of the PAR radiation transmission throughout the project greenhouse.

APPENDIX 104
4. Comparison of the light transmission of greenhouses covered with twinwalled sheets of polycarbonate and acrylic
Project locat ion
BEDFORD, ENGLAND (1980)
Study Center: - Project leader - Institution :
Project description
Dr. B.J. Bailey National Institute of Agricultural Engineering Wrest Park. Silsoe, Bedford. England
The average light transmissions across the central spans of two three-span double clad greenhouses at gutter level are measured. In one house the double cover is made of polycarbonate, in the other acrylic is used. The objective is to compare the light transmission of acrylic and polycarbonate, double clad greenhouses under diffuse light and sunlight conditions within the PAR and total radiation waveband. ranges.

APPENDIX 105
Scheme
The internal light detectors comprise ten PAR sensors, distributed uniformly across the central span, and two total radiation detectors (Kipp) at one-third and two-thirds of the way across the same central span. External light is monitored by one PAR and two Kipp detectors, K1, K2, one of which, K2, is shaded against the sun. Transmissivify measurements are made between the hours of 10.00 a.m. and 2.00 p.m. under conditions of cloudy weather only (diffuse radiations), (K2 : ~ > 0.9) and bright sun only (diffuse and direct radiation), (K2 I Kl < O.ZS). For other conditions transmissivity measurements are nof carried out, though total light integrals are logged on a daily basi.s. Records are made every 30 secs, under the control of an APPLE 48K mini-computer and Solartron data logging AID converter.
HOUSE LAYOUT
~ ~ N ~ I
I I l I I I I I I I I I I I I I I
I : I I
1/1 I
/. V I 1 I I I
I I I I I I I tJ I I n I I 0 I I
acrylic external sensors
polycarbonate
scale Om 10m 20m (PARo • K1• K2)
_ location of internal sensors (10 PAR sensors. 2 total irradiation sensors)
Note : During early June, a haiZstorm virtually destroyed the polyaarbonate house, thereby terminating the aurrent experiment.
Conclusions
The acrylic house transmits 5% more light under both cloudy and sunny weather conditions, for both PAR and total (Kipp) radiation.

APPENDIX 106
Acr:l!:lic House Pol:l!:carbonate House Research
Average diffuse radiation 59 54 June 82-transmissivity % (PAR) June 83 (cloudy weather)
Average diffuse radiation 61 56 " transmissivity % (KIPP) (cloudy weather)
Average global radiation 59 54 June 82-transmissivity % (PAR) Sept.82 (sunny weather)
Average global radiation 65 61 " transmissivity % (KIPP) (sunny weather)
Total radiation appears to have a higher transmissivity than PAR, but this result is not conclusive as there are only two total radiation measurements compared with ten PAR measurements across the span.
PROJECT ANALYSIS
1. Site and climate
1.1. Site
Latitude Longitude: Altitude : Nearest main city : Distance from main city Direction from main city : Obstructions :
1. 3. Annual long-term averages
1. Prevailing wind direction 2. Average wind speed 3. Total precipHation 5. Global irradiation on
horizontal plane 8. Hours sunshine
50°44' N 1°34' W
15.5 m Southampton 21.4 km SSW none
m/s mm/yr
MJ/(m2 yr) hrs/yr
10. Average max. temp. (July/Aug) C 11. Average min. temp. (Jan) C
12. Meteorological station : on site
• Project
SW 2.5
777 .8
3 936 1 725
20.2 2.1

APPENDIX 107
2. Plant
2.1. Greenhouse
Poly. acryl
1. Dimensions - Floor area : m2 627 614 - Volume : m3 2 584 2 445 - Glazing area : m2 1 136 1 156 - roof area : m2 701 686 - sides area : m2 435 470
2. Glazing Bayer Makrolon polycarbonate (Thermoclear) ICI Diakon PMMA (Ecocal)
3. Covers/screens : none
4. Ventilation system : Double sided ridge ventilators 75 m2
ventilator area.
2.5. Installation parts and measuring devices
2. Description of the sensors :
Measurements were made of solar radiation and photosynthetically active radiation (PAR). Solar radiation was measured over the wavelength range 0.3-2.5 ~m using Kipp and Zonen solarimeters. These black body (total energy) detectors used a thermopile as the sensing element. The PAR was measured using quantum sensors which contained a silicon photodiode as the detecting element. These sensors were filtered to respond to wavelengths of 400-700 ~m and their response over this range was dependent on photon energy, thus they measured photon flux density.
3. Scheme of measurement points
Ten PAR sensors were equally spaced along a beam installed diagonally across one span near the middle of each greenhouse just above the crop wires at a height of 3.2 m. Two solarimeters were also fitted on each beam at one-third and two-third of the way across the beam. The radiation outside the greenhouse was detected by two solarimeters and one PAR sensor mounted on a mast at a height of approximately 7 m. The arrangement is indicated in the scheme on p. 116. One solarimeter was fitted with a shade ring so by comparing the signals from the two solarimeters the quality of the light, i.e. whether it was direct (bright sunlight). diffuse (overcast sky), or a mixture of both. could be determined. Signals from all sensors were measured automatically by a computer control data logger at 30 second intervals whenever there was a finite amount of light. When the light was predom1nantly diffuse or direct the ratios of the signals of the internal to external sensors were also recorded. At midnight information on the total amount of solar radiation and PAR received externally and inside each greenhouse was printed on a paper chart. In addition. all data were transferred to disc stores which were periodically sent to NIAE for detailed analysis.
APPENDIX 108
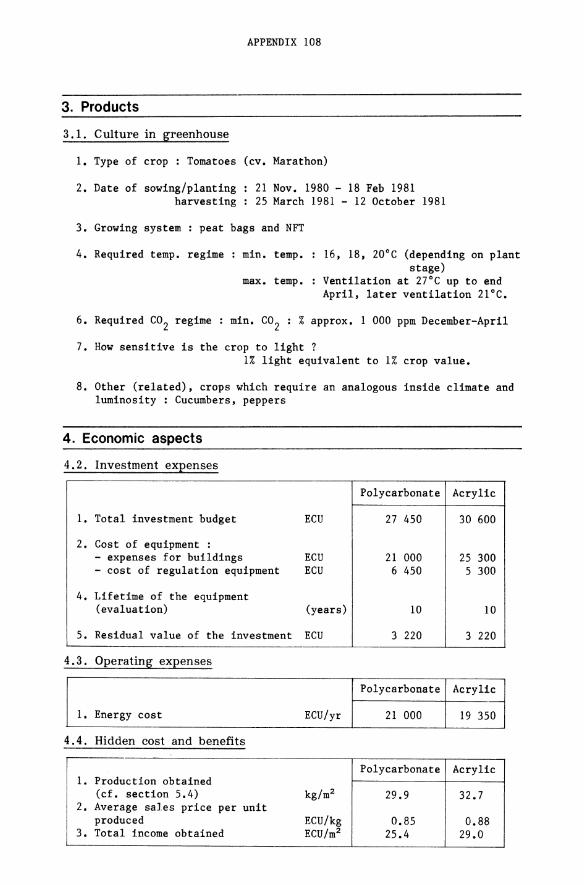
3. Products
3.1. Culture in greenhouse
1. Type of crop : Tomatoes (cv. Marathon)
2. Date of sowing/planting harvesting
21 Nov. 1980 - 18 Feb 1981 25 March 1981 - 12 October 1981
3. Growing system: peat bags and NFT
4. Required temp. regime min. temp. 16, 18, 20°C (depending on plant stage)
max. temp. Ventilation at 27°C up to end April, later ventilation 21°C.
6. Required CO2 regime : min. CO 2 : % approx. 1 000 ppm December-April
7. How sensitive is the crop to light? 1% light equivalent to 1% crop value.
8. Other (related), crops which require an analogous inside climate and luminosity : Cucumbers, peppers
4. Economic aspects
4.2. Investment expenses
Polycarbonate Acrylic
1. Total investment budget ECU 27 450 30 600
2. Cost of equipment : - expenses for buildings ECU 21 000 25 300 - cost of regulation equipment ECU 6 450 5 300
4. Lifetime of the equipment (evaluation) (years) 10 10
5. Residual value of the investment ECU 3 220 3 220
4.3. Operating expenses
Polycarbonate Acrylic
1. Energy cost ECU/yr 21 000 19 350
4.4. Hidden cost and benefits
Polycarbonate Acrylic 1. Production obtained
(cL section 5.4) kg/m2 29.9 32.7 2. Average sales price per unit
produced ECU/kg 0.85 0.88 3. Total income obtained ECU/m2 25.4 29.0

APPENDIX 109
5. Results
5 .1. Method of calculation
The data stored after midnight on disc consists of the following time integrals taken over the immediately previous day :
(1) Total, diffuse and PAR radiation for the previous 24 hours. (2) Transmissivities (R) over the peried between 10 a.m. and 2 p.m.;
summation of readings in each house, (r(R». (3) The square of the transmisssivities in (2), r(R)2.
Subsequent processing consists of adding successive totals over each month to produce monthly totals for the light integrals, and average monthly transmissivities. The transmissivities are further space-averaged to produce mean house transmissivities.
5.4. Crop results (greenhouse) (growing season '80/81, cf. section 3.1.2) 1980/81
Acrylic Polycarbonate
7. Production obtained : kg/m2 32.7 29.9
8. Other differences : (in results, aspects,
dimensions, ... ) Quality % of Class "I fruit % 87 83
5.7. An example of some measured data (cf. figures 5.7.1 and 5.7.2)
Transmissivity measurements are made between 10 a.m. and 2 p.m., separately under diffuse light and sunlight. Records are available every 30 secs. Comparative results are given below for 1982/1983.
Transmissivity %
60
acrylic
"---j I I I I
~ ___ " I .... I polycarbonate --, t....: ___________ ,
I I lot
.. -----, L_-f
PAR overcast condition
~- (= diffuse radiation only)
50~---~----+---_+---~~---r_---+----~---~---_+---~
may 1982
june jul aug sep oct nov dec jan feb 1983
Fig. 5.7.1 PAR transmissivity values for overcast conditions over time

APPENDIX 110
Transmissivity %
60+--'" acrylic
50
1---, I L.P2!l:'!!'~~~!? ___ _
criterion for sunny conditions not met
may june jul 1982
I I .. I I I I I I L ____ _
I I I 4
I-
aug sept oct nov dec jan feb 1983
PAR sunny conditions (. global radiation)
Fig. 5.7.2. PAR transmissivity values for sunny conditions over time

APPENDIX 111
5. Greenhouse climatization by means of C<helioblocs»
Project location
AUTEUIL (Paris), FRANCE
Study Center : - Project leader - Institution :
Project description
J.-P. Hauet and B. Letellier. Novelerg (subsidiary of the C.G.E. Group) Research and engineering company 12 rue de la Baume 75008 PARIS FRANCE
This study of greenhouses, totalling 4 800 m2 , is focused on energy conservation and presents a double interest
- The old-fashioned conception (single glazing, non weather-proof, uncontrolled ventilation and humidity) leads to high energy consumption and puts further utilization in question.
- Tropical climatic conditions require a heating and regulating system that takes the living conditions of the plants (temperature, humidity, ••• ) very precisely into consideration.

APPENDIX 112
The measures will enable the research team to :
- know the detailed performance of the system and to understand its functioning;
- understand the functioning of the installations such that remedies for the failures are expedited.
The measures will enable the perfection of different new systems (among other things of an active solar collecting system).
Scheme
The renovated test greenhouse has been weather proofed and equipped with : - a cover of low emissivity glass or double paned glass. - automated aeration, watering and shading systems (shades mounted on
outside of greenhouse. In a further step an active solar heating system will be built which functions on the basis of helioblocs. A site section of the greenhouses with helioblocs is given in figure 5.1
Fig. 5.1 : Site section of greenhouses with helioblocs
The storage system of the active solar heating system would function as follows
I Excess solar energy (storage loading action) (cf.fig.S.2)
Fig.S.2 Storage loading

APPENDIX 113
The greenhouse and the variable screen collect solar energy and contribute to the elevation of the ambient air temperature. When the programmed temperature is attained, the hot air is extracted along the slope of the roof and is directed to the storage area where it gives up its excess heat. The fresh air coming from the storage area is then recirculated back into the greenhouse.
II Insufficiant solar radiation (storage unloading action)
Fig. S.3 : Storage unloading
During the heating periods, the air of the greenhouse is heated in the storage area by forced circulation. The traditional heating system using vented pipes is used as a back-up system.
Operation modes (For location of regulating sensors, cf. fig. S.4)
Storage and heat recovery will be monitored by a computer steered process :
Storing: Storage is activated if
Heat recovery
TI > T desired + t.Tx T2 > TS + t.Ty T4 < T3
Heat recovery is activated if Tl < T desired TS < T4
In this report a comparison is made between the performance of a renovated test-greenhouse (still without active solar collection set-up) and that of a similar not renovated one (single glazing; manual ventilation).
APPENDIX 114
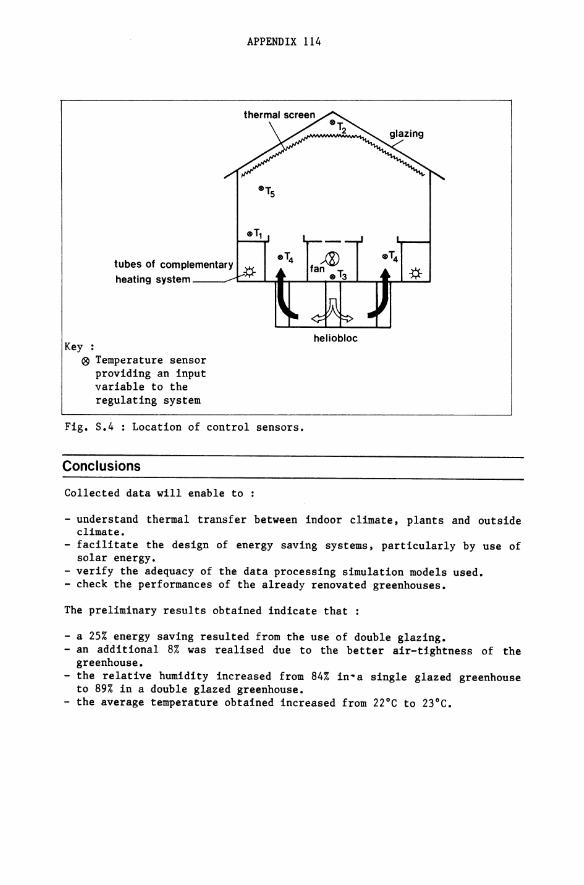
®T4 tV'I tubes of complementary * fa~"f. * heating system ___ ~"';"'-L.-ilFr.....JL-~®y3~_-rlIi-..J....':"':";'-J
Key : ® Temperature sensor
providing an input variable to the regulating system
Fig. S.4 : Location of control sensors.
Conclusions
Collected data will enable to :
heliobloc
- understand thermal transfer between indoor climate, plants and outside climate.
- facilitate the design of energy saving systems, particularly by use of solar energy.
- verify the adequacy of the data processing simulation models used. - check the performances of the already renovated greenhouses.
The preliminary results obtained indicate that
- a 25% energy saving resulted from the use of double glazing. - an additional 8% was realised due to the better air-ti.ghtness of the
greenhouse. - the relative humidity increased from 84% in·a single glazed greenhouse
to 89% in a double glazed greenhouse. - the average temperature obtained increased from 22°C to 23°C.

PROJECT ANAL VSIS
1. Site and climate
1.1. Site
Latitude Longitude : Altitude :
APPENDIX 115
48°49' N 2°20' E
75 m Nearest main city Direction from center
Paris (located in) West
1.3. Annual long-term averages
1. Prevailing wind direction W S
2. Average wind speed W m/s S m/s
3. Total precipitation mm/yr 4. Relative humidity W %
S % 5. Global irradiation on
horizontal plane MJ/(m2 yr) 6. Diffuse proportion % 8. Hours sunshine Hrs/yr 9. Ambient temperature C
10. Average Max. temp. (Jul/Aug) C 11. Average Min. temp. (Jan) C
12. Meteorological station Montsouris 13. Latitude: 48°49' N 14. Longitude : 2°20' E 15. Altitude : 75 m 16. Distance from site 5 km Note: W = Winter Jan., Feb., Nov., Dee.)
S = Summer: Jun., Jul., Aug., Sept.)
2. Plant
Project
W NW W NW
3.5 3.2
643 81 70
not available
" 1 714
11.4 30.6
- 6.6
2.1. Greenhouses (Data on the tested greenhouses)
1. Dimensions - Floor area: 175 m2
- Volume : 400 m3
- Roof glazing area 200 m2
- Wall area : 55 m2
2. Glazing: double glazing (k = 4.2 W/(m2 .K»
Country in general
W NW W NW
not available " " " "
3 960 50
1 750 to 2 000 10.9 30
- 7
3. Covers/screens : inside the future greenhouses and outside the actual monitored greenhouses.

APPENDIX 116
4. Ventilation system : natural ventilation for actual greenhouses and SOLPAC-system for future greenhouses.
Note The municipal greenhouses in Paris consist of : - Tropical greenhouses, totalling 1 300 m2 , in the process of being
renovated, and dedicated to the culture of orchids and rare plants;
- Plain greenhouses, totalling 3 500 m2 , to be totally remodelled and dedicated to the culture of regular plants and flowering plants.
2.4. Heat storage
1. Medium of heat storage : HELIOBLOCS (beton blocks) provided with channels for air ventilation (NOVELERG patent).
2. Description, location in the system The HELIOBLOCS are situated in the greenhouse soil and bedded in a ca10ritherm covering.
3. Insulation Insulation by 10 cm of polystyrene. 4. Dimensions : - Volume of HELIOBLOC : 32 m3
- Total dimensions, including channels 19 m x 6.70 m x 0.70 m
5. Thermal capacity : 51.2 MJ/K 6. Overall heat loss coefficent 112 W/K 7. Diagram: cf. fig. 2.4.7
heliobloc
Fig. 2.4.7 : Diagram of heliobloc heat storage
2.5. Installation parts and measuring devices
2. Description of the sensors
- Temperature (OC) (Tl, T2, T3, Te, Tpo, Tpi; cf. sheme in section 2.5.3) Type : Platina sensor PT 100 (Louzot)
Precision: + 0.3 °c Measuring range : - 70°C
+ 200°C Variation : 0.39 Q/oC
- Relative humidity (%) (RHi, RHo) Type : Hygromer HTK (Rotronic)
Precision: + 0.5% Measuring range : 5% - 100% RH

APPENDIX 117
- Interior solar radiation intensity (W/m2) (Ihi) Type : Photo-electric cell
I.N.C. ~ 80 (Photowatt) - Exterior solar radiation intensity (W/m2) (Iho)
Type : CM 11 (Kipp and Zonen) Precision : + 3%
- Energy consumption (W/m2) (Q) thermal energy meter Type : GWF WPM HK 125 The consumption of individual greenhouses is measured by a microcomputer (System GERTEP).
3. Scheme of measurement points
Key 6 Relative humidity RH £>Solar radiation Iho, Ihi
o or II temperature T Tl in ridge of roof T2 at mid height T3 at the level of the plants
.Cl. Iho o RHo o Tao
Tpi on the inside of the transparent cover Tpo on the outside of the transparent cover
Q Heat input.
Fig. 2.5.3 Positions of the sensors in the instrumental greenhouse
3. Products
3.1. Culture in greenhouse
1. Type of crop : potted plants; begonias, orchids ••• 2. Date of sowing/planting : permanent cultures (plant collection) 3. Growing system : conventional 4. Required temp. regime : min. temp. : 16°C
max. temp. : 22°C 5. Required humidity regime : min. ReI. humidity 60%
max. ReI. humidity 85%

APPENDIX 118
7. How sensitive is the crop to light? Maximum 200W/m2 (1) Therefore shading curtains are used.
(1) These are obviously shade plants. For such plants, long hours of shading will be required and hence equally long hours of active solar radiation collection will be possible in the future greenhouse set-up (N.D.T.E.)
4. Economic aspects
Base : 1982 prices
4.1. Economic environment
1. Energy price of gas 2. Energy price of electricity 3. Energy prices evolution prospects
- of oil or gas (real terms) - of electricity (real terms)
ECU/kWh ECU/kWh
%/year %/year
0.0216 0.039
+ 3 o
4.2. Investment expenses estimated expense for 1 greenhouse)
Future active Actual renovated solar green- "passive" solar house greenhouse
2. Cost of equipment - expenses for buildings ECU 42 000 27 400 - cost of regulation
equipment ECU 4 665 1 550 - other material (including
positioning and start-up) 15 552 none 4. Lifetime of the equipment
(evaluation) (years) + 50 + 50 except the fan and-the screen : T10
years 5. Residual value of the
investment ECU 31 415 none
4 .3. Operating expenses (estimated expense for 1 greenhouse)
Future active Non-renovated solar greenhouse reference sol.
1. Energy cost ECU/yr 1 550 2 954 2. Maintenance cost ECU/year 77 .5 none

APPENDIX 119
5. Results
5.1. Method of calculation
The energy consumption of 'each individual greenhouse is known from the global energy consumption, provided by the general calorimeter and the indexes, which are monitored by the GERTEP system for each greenhouse separately (cf. figure 5.1). For comparison and extrapolation, the observed results are related to the number of degree-days. The number of degree days equals the numer of days heated, multiplied by the difference between the exterior temperature and the corrected interior temperature. For 1983 the total number of degree days in Paris-Montsouris was 1 492.
sensors for heating general calorimeter for i , total energy consumption
C~
IlL, t GERTEP
index of consumption -for each individual
greenhouse I percent %1
I consumption of each greenhouse I Fig. 5.1 : Scheme of the energy consumption monitoring system.
5.2. Weather conditions
1. Jan Feb Mar Apr May J", Jul 2. 111
3. 6.a 3.1 8.1 9.8 12,2 18.8 26.5
4. 4.0 4.2 3.7 4.0 4.1 N.A. N.A.
5. N.A. N.A. N.A. N.A. N.A. N.A. 20.3
5bis 82 75 17 78 78 N.A. 59.8
11. 38 47 57 26 37 0 0
15. 71 94 72 22 41 0 0
(1) Defeat from 16 to 30 ApriZ (2) Data from 1 to 15 September
Aug l'oep fran, January PERI(D
12.1 until : 5ept:eniler
22.3 16.6 ·c a_age arilient TEMP
N.A. n.A. nVs average WIW
17.3 11.5 lU/lm2.day) average SCLAR lW)
59.7 75.7 \ relat1 ve HlIDDITY
0 0 GJ/ (greenhouse. yr) HEATllIG ener<)Y (non-solar)
0 0 r.J/ (greenhouse. yr) HEATING energy
~ ~

APPENDIX 120
5 .3. Inside climate of greenhouse
1. Fran: 28/07 PERIOO Jul Aug Sep Unit
until: 15/09 2.
3. 20.6 17.1 19.2 DC -I 4. 26.0 23.0 21.9 DC average AIR TEMPERA'IURE ~ 5. 32.7 33.7 28.5 DC rraxim.mt (at 1/2 height) .....
~ 6. 35.3 27.0 33.0 % -} ~ 7. 71.6 81.5 77.1 % == RErATIVE HUMIDITY
• .-< III
8. 100.0 100.0 100.0 % a 9. 3.8 3.5 3.1 ill/(m2.day) average inside RADIATIOO
14. 18.8 13.6 17.2 DC -} 15. 26.4 22.1 21.9 DC average AIR TEMPERA'IURE
16. 35.9 33.4 32.3 DC rraxim.mt (at 1/2 height) ~ 17. N.A. 39.3 61.2 % rnin:im.Jrn
}RErATIVE IDIIDITY 18. N.A. 82.0 88.8 % ~ average ~ 19. N.A. 100.0 100.0 % rnaxinurn
20. 4.2 2.3 3.3 Ml"/ (102 .day) Average inside RADIATION
5.7. An example of some measured data
Jul Aug Sep Unit
1. 26.7 23.2 20.9 DC temperature of glass (interior side)
2. 26.1 22.0 18.0 DC temperature of glass (exterior side)
openin<;1 of frame ~
3. 8 36 8 % LEFT ClDSID i 4. 27 26 74 % 50% OPEN
5. 65 38 17 % 100% OPEN
6. 69 90 96 % RIG!IT ClDSID M 7. 13 6 4 % 50% OPEN
2 8. 18 3 0 % 100% OPEN
..... 9, 26.9 21.7 19 DC temperature of glass ~
The collected data for radiation, humidity and temperature are stored on disk. In figure 5.7 an example is given of temperature data on August 1st 1983.
On the basis of the characteristics of each greenhouse and the number of degree days (August-December) a comparison was made for the estimated energy use of the passive solar greenhouse and the reference greenhouse :
Energy consumption Passive solar green- Tot. renovated reference house GJ/(yr.green- greenhouse GJ/(yr.green-house) house)
Sep-Dec 128 188 Jan-May 205 300
Total 333 488
Energy saving 31.7

APPENDIX 121
"C W/m2
43 1000
40 900 _.- solar, radiation
········exterior temperature 37 --greenhouse solar
----- greenhouse reference 34
31
28
25
22
19 200 , \
16 100 \ ....... 13
13 14 15 16 17 18 19 20 21 22 23
Aug 1st 1983
Fig. 5.7 Some temperature measurement data.
APPENDIX 122
6. Greenhouse climatization by an earth - air heat exchanger
Project location
ATHENS, GREECE
Study center : - Project Leaders
- Institution :
Running since 1982
Project description
Prof. S. Kyritsis Dr. G. Mavrogianopoulos Agricultural University of Athens Iera odos 75 Votanikos Athens 11855 Greece
In a 150 m2 greenhouse an earth-air heat exchanger was built at a depth of 2 m. The heat exchanger consists of 20 aluminium pipes of 15 m length, 0.2 m diameter and 0.2 mm thickness. The greenhouse air is blown through the pipes at a total rate of 15 000 m3 /h whenever the greenhouse temperature falls below 12°C or exceeds 28°C. The heat gained from the soil (Qso) was determined by measuring the energy consumption of an electrotherm placed in a completely similar greenhouse. In both greenhouses, the inside temperature was kept the same by means of

APPENDIX 123
a differential thermostat, controlling both heating and venti.lation. The share of the solar energy input into storage which exceeds the energy demand for daytime temperature stabilisation at a 28°e temperature level was also calculated. (= Q ') This energy can be stored ~or night-time or longer range heating purposes.
The objectives of this study are : - To determine the heat gain from the subsoil, during the period from
November to May. (Q ) - To observe the therm~~ environment inside the greenhouse. - To determine the excess of greenhouse heat that could be stored in the
subsoil over daytime. (Q ') - To determine the efficie~cy and the limitations of the earth-air heat
exchanger.
Scheme
SOLAR GREENHOUSE
@
@
Fig. Measurements 1 Air temperature at inlet of heat exchanger 2 Air temperature at outlet of heat exchanger 3 Air temperature inside 4 Air temperature outside 5 Outside soil temperature at 2 m depth 6 Inside soil temperature at 2 m depth
Also measured : - Energy input for fan function in "solar" greenhouse - Energy input for Electrotherm function in reference greenhouse - The solar energy radiation penetrating inside the greenhouse

APPENDIX 124
Fig. Site section of the solar and underground heated greenhouse.
SOLAR
REFERENCE
1 Fan. 2 Heat exchanger. 3 Solar heat storage
+ underground heat. 4 Electrotherm. 5 Heat distribution. 6 Differential thermostat.
in ~
ill
Fig. Schematic representation of the solar versus reference greenhouse
Conclusions
- Measured heat output of the earth-air heat exchanger (Qso) 4 410 MJ/month in November
12 351 MJ/month in December 15 904 MJ/month in January 13 570 MJ/month in February 11 300 MJ/month in March 4 485 MJ/month in April
(for an explanation of method, cf. Project p. 122)
was
the measuring description,
APPENDIX 125
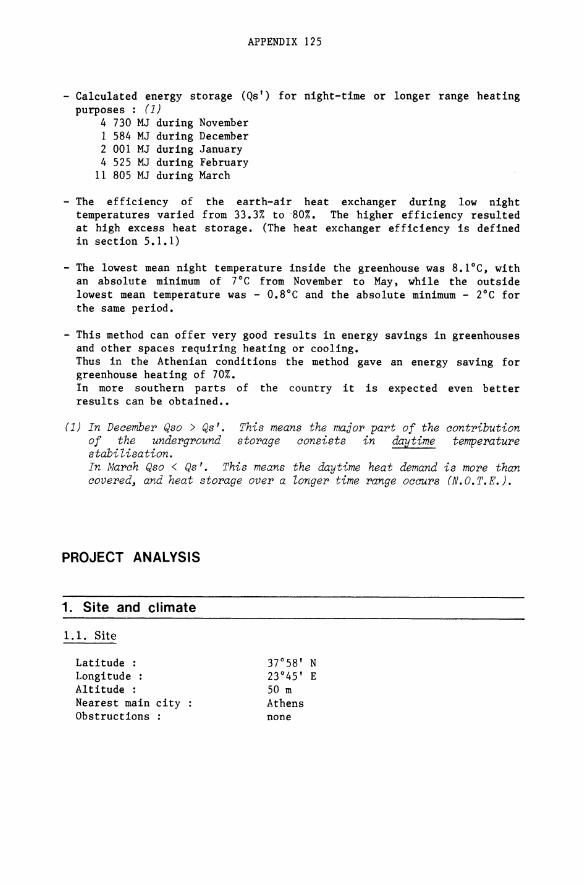
- Calculated energy storage (Qs') for night-time or longer range heating purposes : (1)
4 730 MJ during November 1 584 MJ during December 2 001 MJ during January 4 525 MJ during February
11 805 MJ during March
- The efficiency of the earth-air heat exchanger during low night temperatures varied from 33.3% to 80%. The higher efficiency resulted at high excess heat storage. (The heat exchanger efficiency is defined in section 5.1.1)
- The lowest mean night temperature inside the greenhouse was 8.1°C, with an absolute minimum of 7 DC from November to May, while the outside lowest mean temperature was - 0.8°e and the absolute minimum - 2°e for the same period.
- This method can offer very good results in energy savings in greenhouses and other spaces requiring heating or cooling. Thus in the Athenian conditions the method gave an energy saving for greenhouse heating of 70%. In more southern parts of the country it is expected even better results can be obtained ••
(1) In December Qso > Qs'. This means the major part of the contribution of the underground storage consists in daytime temperature stabilisation. In March Qso < Qs'. This means the daytime heat demand is more than covered, and heat storage over a longer time range occurs (N.O.T.E.).
PROJECT ANALYSIS
1. Site and climate
1.1. Site
Latitude Longitude : Altitude : Nearest main city Obstructions
37°58' N 23 0 45' E 50 m Athens none

APPENDIX 126
1.3. Annual long-term averages
1. Prevailing wind direction W NNE/NE S NE/SSW/SW
2. Average wind speed W m/s 2.3 S m/s 1.9
3. Total precipitation mm/yr 408.2 5. Global irradiation on horizontal plane ~w/(m2 yr) (1)
8. Hours sunshine hrs/yr 2 871 9. Ambient temperature C 17 .5
10. Average max. temp. (July) C 27.0 11. Average min. temp. (Jan) C 8.9
12. Meteorological station : Meteorological Institute National observatory of Athens
13. Latitude : 3r58'3" 14. Longitude : 23°45' E 15. Altitude 107 m 16. Distance from site lkm
Note : W = Winter (Oct-Mar) S = Summer (Apr-Sep)
(1) The Zong tel'TT/ annual average according to the map on p. 5 is + 6 200 MJ/(m2 .yr).
2. Plant
2.1. Greenhouse
1. Dimensions - Floor area : - Volume : - Glazing area
2. Glazing : Polyethylene 3. Covers/screens : none 4. Ventilation system : Fan.
2.4. Collectqr and heat storage
150 m2
457.5 m3
293.5 m2 (roof = 151.5 m2/sides 142 m2)
1. Medium of heat storage: Subsoil, Sandy clay; 23.5% moisture content around the heat exchangers.
2. Location of the system : 2 m deep under the greenhouse soil 3. Insulation : none 4. Dimensions : not limited 6. Conductive heat loss coefficient A 1.04 W/(mK) 7. Diagram: cf. Figure 2.4.7

APPENDIX 127
heat exchangers: total air flow rate: 15000 m3th
Fig. 2.4.7 : Diagram of "collecting system"
2.5. Installation parts and measuring devices
1. Technical description of the installation parts
- Heat exchangers : number : length : diameter wall thickness:
20 15.00 m 0.20 m 0.5 mm each
- Electrical fan capacity: 15000 m3 /h power: 5 kW static pressure: 2 000 - 2 400 Pa
- Electrotherm 220 V electrical resistances max Power 90 kW
2. Description of the sensors.
- The air flow rate was determined by a wallas facility based on the principle of gas calorimetry.
- The electric energy consumption was measured by a kWh meter - The indoor and outdoor air temperature were measured by
thermographs and max-min thermometers. - The solar energy in the greenhouse was determined by an Eppley type
pyranometer and an AEG integrator. - The air temperature on the control pipe of the Earth-Air heat
exchanger at inlet and outlet, as well as the outside subsoil temperature were measured by thermistor sensors connected to an ULTRACUT 100 Q temperature recorder.

APPENDIX 128
3. Products
3.1. Culture in greenhouse
1. Type of crop: tomatoes 2. Date of planting 1 Dec.
harvesting : 10 March till 30 May 3. Growing system: N.F.T. 4. Required temp. regime : min. temp. 12°C
max. temp. 28°C 5. Required humidity regime : min. humidity 60%
max. humidity 80% 6. Required CO2 regime: min. CO2 : 0.03%
max. CO2 : 0.1% 7. Sensitivity to light: Medium 8. Other (related), crops which require an analogous inside climate
and luminosity : peppers and aubergines.
4. Economic aspects
4.1. Economic environment
1. Energy price of oil ECU/1 0.32 2. Energy price of e1ectdcity ECU/kWh 0.064 3. Energy prices evolution prospects
- of oil or gas %/yr 15 - of electricity %/yr 15
5. Interest rate of loans for farm equipment (rate without subsidy) %/yr 14
4.2. Investment expenses
Solar Reference greenhouse greenhouse (with
electrotherm)
1- Total investment budget(materials ECU 15 300 5 350 2. Cost of equipment : only)
- expenses for buildings ECU 3 060 3 060 - cost of regulation equipment ECU 9 180 1 530 - other material cost ECU 3 060 760
3. Time of personnel for the concep-tion, installation and start-up of equipment 1 man year Cost of personnel for the concep-tion, installation and start-up of equipment ECU 7 650
4. Lifetime of the equipment years 8 years
I 8 years
5. Residual value of the investment ECU none none
APPENDIX 129
4.3. Operating expenses
Solar Reference greenhouse greenhouse
1. Energy cost for the period of Dec-Febr (ECU/period) 150 740
for fan for electrotherm operation operation
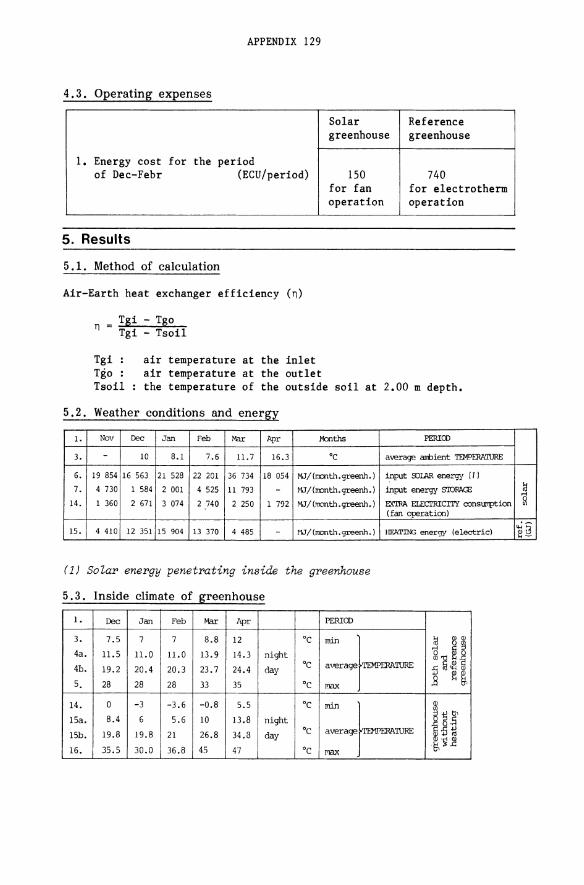
5. Results
5.1. Method of calculation
Air-Earth heat exchanger efficiency (n)
Tgi - Tgo n = Tgi - TsoH
Tgi air temperature at the inlet Tgo air temperature at the outlet Tsoil the temperature of the outside soil at 2.00 m depth.
5.2. Weather conditions and energ~
1- Nov Dec Jan Feb Mar Apr Jobnths PERIOO
3. - 10 8.1 7.6 11.7 16.3 ·c average arrbient TEMI?ERATURE
6. 19 854 16 563 21 528 22 201 36 734 18 054 MJ/ (r.ooth .greenh. ) input &lIAR eneI'q'1 (/1
7. 4 730 1 584 2 001 4 525 11 793 - ~\J / (nonth. greenh. ) input energy S'IDRAGE ~ .-<
14. 1 360 2 671 3 074 2 740 2 250 1 792 MJ / (!lOI1th .greenh. ) EXTRA ELECl'RICITY consunption ~ (fan operation)
15. 4 410 12 351 15 904 13 370 4 485 - /U I (=th. greenh. ) HE'ATING energy (electric) "':5 Il-
(1) SoZar energy penetrating inside the greenhouse
5 3 Inside climate of greenhouse . 1. Dec Jan Feb Mar Apr PERIOO
3. 7.5 7 7 B.B 12 ·c
=-}-- ~ ~~ 4a. 11.5 11.0 11.0 13.9 14.3 night
40. 19.2 20.4 20.3 23.7 24.4 day ·c j~~I,
5. 28 28 28 33 35 ·c max
14. 0 -3 -3.6 -0.8 5.5 ·c
~}-ffi
15a. 8.4 6 5.6 10 13.8 night iH ISh. 19.8 19.8 21 26.8 34.0 day ·c . .~ 1]
16. 35.5 30.0 36.8 45 47 'c

APPENDIX 130
5.4. Crop results
Solar Reference
1. Date of planting : 1 Dec 1982 2. Harvesting date : 10 March 2 March
till 30 May 7. Production obtained : 3 800 kg 4 200 kg 8. Other differences :
(in results, aspects, dimensions, ... ) Normal Normal
Variety Sonetino Sonetino
5.7. Some additional data
The effect of the energy storage on the minimum night and the maximum day temperature is shown on figure 5.7 : here a comparison is made between the solar greenhouse and a non-heated greenhouse.
Fig.S.7
minimum temperature during the night 'C
16
12
8
4
o
1 4 8 12 16 20 24 1 4 8 12 16 20 24 28 31
I.--february 1983---!.I.. .... --march 1983 .1
maximum temperature during the day 'C
40
32
14
16
8
o 1 3 7 11 15 19 23 27 1 3
!---february 1983 .Ie experimental greenhouse outside temperature
7 11 15 19 23 27 31
march 1983 J
temperature of a non-heated greenhouse
Effect of energy storage on minimum night and maximum day temperature

APPENDIX 131
7. Development of a solar system for heating greenhouses
Project location
THESSALONIKI, GREECE
Study Center : - Project Leader - Institution :
Running since 1981
Project description
Dr. Mavr. Grafiadellis Agricultural Research Center of Northern Greece Elliniki Georgiki Scoli. - Thessaloniki Greece
The "solar system" consists of an underground water reservoir, a fan, a water pump and two plastic tubes through which water and air are circulating simultaneously. The solar system itself is actually an air-water plastic heat exchanger. During the day, the water absorbs excess solar heat collected by the greenhouse; at night the previously solar heated water in turn heats the greenhouse air. The goals are the determination of
- the size of the heat exchanger, the air and water quantity needed and the size of the water reservoir for heating a greenhouse.
- the performance of the solar system. - the effect of the solar system on temperature and light in greenhouses.

APPENDIX 132
- the effect of the solar system on the earliness, quality and the yield of the most important vegetable crops.
- the cost of the solar system and the pay-back period.
Scheme
Two identical greenhouses of 1iO m2 are covered with polyethylene. The materials and the construction techniques utilised are currently available in the Greek greenhouse industry.
Site plan:
Orientation east-west. Figure Sl)
solar greenhouse
20 m
There are no obstructions to the sun. (cf.
reference greenhouse: j protect/on (, lor air temperatures below 4 ·C) L
_C_la_S_Si_ca_I_P_O_ly_e_th_Y_le_n_e_9_T_ee_n_h_O_US_e_-!I .,...E~. not heated except lOT I TOSt ~
20 m
lO~ -"L~-"'7.6,-"m,--_~--~-
Fig. Sl : Ground-plan and perspective elevation of greenhouses
Operating modes
In the first two years (1981 and 1982) the water pump and the fan were connected to a time switch and were adjusted to operate in the warmer and colder hours of the day. (For example from 9 a.m. to 4 p.m. and from 9 p.m. to 7 a.m.). In 1983 the system was improved by using differential thermostats. When the temperature of air in the greenhouse is 5°C higher than the temperature of water in the reservoir, water pump and fan are switched on. Again at night time, when the air temperature in the solar greenhouse drops below 12°C, the water pump and the fan are activated.
Scheme of the "solar system" (cf. figure S2)
The different parts of the system are as follows
- a water pump of 0.75 kW delivers 2.8 mS of water per hour. The pump is connected to a time switch and to two thermostats.
- a fan is circulating 2 200 m3 /h of air inside the solar greenhouse and is connected to the same controllers as the pump. (In 1981 and in 1982 a smaller fan of 1 000 m3 /hr capacity was used.)

APPENDIX 133
support for the pipe and the plastic tubes water distribution pipe
water sprayer internal plastic tube
support
wate;:--=:- water collecting pipe reservoir
Fig. S2 : Scheme of the solar system
- two polyethylene tubes which serve as air-water heat exchangers. The external tube has a diameter of 76.4 cm and the internal black polyethylene tube has a diameter of 70.1 cm.
- an underground water reservoir of 11 m3 •
Conclusions
The results obtained indicate
- Solar heating increased the total yield by 10%. - The solar heated greenhouse gained approximately 2-3 weeks earliness for
the most important vegetable crops. - For the data given in section 5.2 the solar system transferred into
useful energy 19% of the solar radiation measured inside the greenhouse. - When the air temperature in the non-heated greenhouse was DoC, the solar
heated greenhouse usually had an air temperature of 8°C. In warmer weather conditions the difference of temperature in solar heated and in non-heated greenhouses was smaller.
- At night, a considerable quantity of heat is also liberated from the soil through air circulation into the greenhouse air. (The soil actually also plays the role of some kind of a solar energy storage.)
- The cost of the solar system for heating, extrapolated to a greenhouse of 1 000 m2 , was estimated to be about 2 270 ECU (1).
- Based on the relatively low investment price and the significant yield improvements, the payback period :I.s expected to be very short.
- The main problem of the project was the lack of a temperature recording instrument.
(1) Counting equipment costs onZy, and at 1981 price rates.

APPENDIX 134
Further references
- GRAFIADELLIS, M. and KYRITSIS, S. 1981 : Heating greenhouses with solar energy. Acta Horticulturae. nr. 115; 591-597.
PROJECT ANALYSIS
1. Site and climate
1.1. Site
Latitude Longitude : Altitude : Nearest main city : Distance form main city Direction from main city : Obstructions :
1. 3. Annual long-term averages
1. Prevailing wind direction
2. Average wind speed (is noticed 8 % of days of the year)
3. Total precipitation 4. Relative humidity
5. Global irradiation on horizontal plane
6. Diffuse proportion 8. Hours sunshine per year 9. Ambient temp. mean/year
10. Average max. temp. (Jul/Aug)
2. Plant
2.1. Greenhouse
1. Dimensions: - Floor area : - Volume : - Glazing area
40°41' N 23° E 30 m Thessaloniki - Greece 13 km East Solar collector is inside the greenhouse and it shades some plants near the North wall.
Winter Summer -W S
W S
m/s m/s mm/yr % %
MJ/ (m2
% hrs/yr C C
150 m2
450 m3
yr)
Project Country in general
North North South South
15 12 12 10
456 360-2 289 73 71 56 55
5 660 6 020 37 35
2 555 2 700 16 18 34.2 35
280 m2 (roof = 160 m2 ; sides 120 m2 )
2. Glazing Single' long-lasting polyethylene which transmits 70% of the visible light and has a durability of two years.

APPENDIX 135
4. Ventilation system : The greenhouses have a side ventilation system. One side is opened manually and the other automatically. The surface of the openings is 22% of the covered area of the ground.
2.3. "Solar system"
1. Material : Polyethylene plastic film.
2. Dimensions - length : 15 m - External diameter of tube 0.764 m - Internal diameter of tube 0.701 m
3. Flow rate : In 1981 and 1982 the air flow was 1 000 m3 /hr and the water flow was 2.8 m3 /hr. In 1983 the air flow increased to 2 200 m3 /hr and the water flow remained the same.
2.4. Heat storage
1. Medium of heat storage : An underground water reservoir of 11 m3 •
2. Description, location in the system: Underground, inside the solar greenhouse.
3. Insulation : Two sheets of black polyethylene film and a sheet of triplex film with air bubbles.
4. Dimensions : 2 x 2.2 x 2.5 m
5. Thermal capacity : 46 MJ/K
2.5. Installation parts and measuring devices
2. Description of the sensors
Water quantity is measured with a mechanical water meter. The air flow rate in the solar system is measured with an anemometer. Solar radiation is measured with a Kipp solarimeter. Relative humidity of air is measured manually with an electronic relative humidity indicator. Air temperature is measured with thermometers and with an electronic temperature indicator. For soil temperature measurements special mercury thermometers are used.

APPENDIX l36
3. Scheme of measurement points (cf. figure 2.5.3)
~;;~~~~~~~~~~~~~~~~~~~~ air distribution ::::: OT4
o T1
oTa -
Key :Tl - T6 : T7 - T10 : ~wl - ~w2 : ~g :
Also measured
fan
water reservoir
o T2 T
Air temperature (OC) Water temperature (OC) Water flow (m3 /h) Air flow (m3 /h)
- Air temperatures at different places inside and outside the greenhouse (OC).
- Different soil temperatures (OC). - Relative humidity inside and outside (%). - Solar radiation inside (W/m2 ).
Fig. 2.5.3 : Scheme of measurement points
3. Products
3.1. Culture in greenhouse
1. Type of crop: Tomatoes, peppers, egg plants and cucumbers. 2. Date of sowing/planting : 22 to 24 December / First week of March.
harvesting : Beginning of May till September. 3. Growing system : Conventional 4. Required temp. regime : min. temp. SoC
max. temp. 35°C 5. Required humidity regime : min. reI. humidity
max. reI. humidity 6. Required CO2 regime : min. CO 2 : 0.03 %
max. CO2 : O.lS % 7. How sensitive is the crop to light?
In summer time cucumbers need shading.
60 % SO %
S. Other (related), crops which require an analogous inside climate and luminosity : Melons, beans.
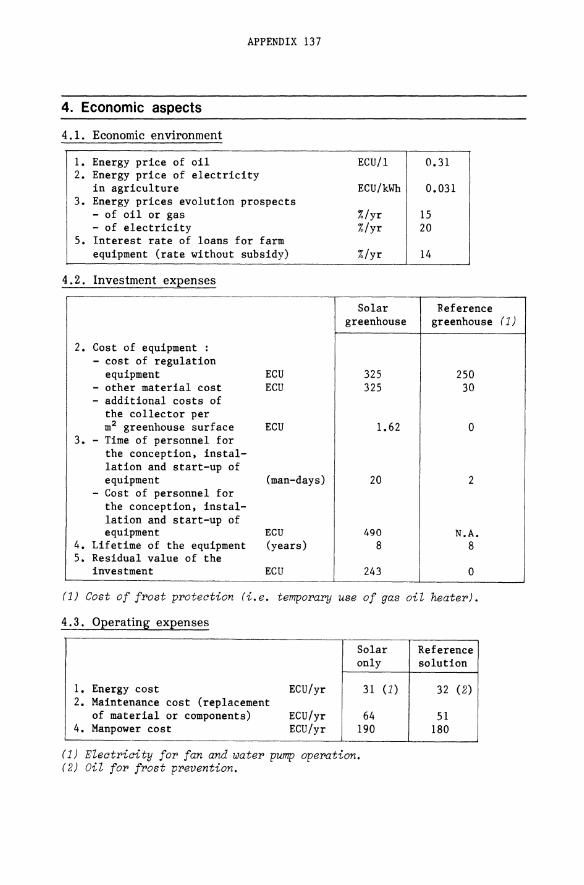
APPENDIX 137
4. Economic aspects
4.1. Economic environment
1. Energy price of oil 2. Energy price of electricity
in agriculture 3. Energy prices evolution prospects
- of oil or gas - of electricity
5. Interest rate of loans for farm equipment (rate without subsidy)
4.2. Investment expenses
2. Cost of equipment : - cost of regulation
equipment ECU - other material cost ECD - additional costs of
the collector per m2 greenhouse surface ECU
3. - Time of personnel for the conception, instal-lation and start-up of equipment (man-days)
- Cost of personnel for the conception, instal-lation and start-up of equipment ECD
4. Lifetime of the equipment (years) 5. Residual value of the
investment ECD
ECU/l 0.31
ECU/kWh 0.031
%/yr 15 %/yr 20
%/yr 14
Solar Reference greenhouse greenhouse
325 250 325 30
1.62 0
20 2
490 N.A. 8 8
243 0
(1) Cost of frost protection (i.e. temporary use of gas oil heater).
4.3. Operating expenses
Solar only
1. Energy cost ECU/yr 31 2. Maintenance cost (replacement
of material or components) ECU/yr 64 4. Manpower cost ECU/yr 190
(1) Electricity for fan and water pump operation. (2) Oil for frost prevention.
(1)
Reference solution
32 (2)
51 180
(1)

APPENDIX 138
4.4. Hidden cost and benefits
Solar Reference only solution
1. Production obtained kg/yr 1 375 1 255 2. Average sales price per unit
produced ECU/kg 0.26 0.175 3. Total income obtained ECU/yr 357 219
5. Results
5 2 Weather conditions and energy
1. 7 Apr 8 Apr 11 Apr 21 Apr PERIa> 1983 1983 1983 1983
2. 5hr 5hr 5hr 5hr Fran 9 hr till 14 hr
3. 12 10 13 17 °c average anbient TEMPERAWRE
4. 1 0 2 2 m/s average WIND
5. 455 366 543 471 w/m2 average SOLAR RAD on horizontal plane inside
1229 988 1467 1272 MJ/ (5h. greenhouse) the greenhouse - 1---1---- -
7. 202 227 329 277 MJ/5h input energy S'IDRAGE I 8. 18 20 30 25 MJ/5h S'IDRAGE HEAT LOSSES I 9. 20 19 22 23 °c average TEMPERATURE storage 11) ~
M
10. 184 207 299 252 MJ/5h USEFUL energy [1) @
14. 15 15 15 15 MJ/5h ELEX:TRICITY consumption
(1) Discharged Zater in the day.
5 3 Inside climate of greenhouse
1. 7 Apr 8 Apr 11 Apr 21 Apr PERIa> 1983 1983 1983 1983
2. 5hr 5hr 5hr 5hr Fran 9 hr till 14 hr
3. 6 7.5 10 13 °c minimum
4. 17 18 20 23 °c average TEMPERATURE
5. 30 27 30 33 °c maximum ~
6. 48 60 45 62 % minimum M @
7. 61 71 68 73 % average RElATIVE Hlll'UDITY
8. 75 82 70 85 % maximum
9. 455 366 344 472 w/m2 radiation
14. 1 2 4 8.5 °c ~-f 15. 14 14 17 20 °c == TENPERAWRE
°c Q)
16. 30 26 30 32
J 17. 50 58 44 60 % minli= }
18. 61 67 55 71 % == RElATIVE Hlll'UDITY ~ 19. 72 76 66 82 %
20. 455 366 544 472 w/m2 radiation

APPENDIX l39
5.4. Crop results (greenhouse)
Solar Reference
1. Date of sowing 20 December 20 December 2. Beginning harvesting date :
- Tomatoes 12 May 18 May - Cucumbers 12 May 18 May - Peppers 30 April 15 May - Egg plants 20 May 30 May
5. Fruit number : - Tomatoes/plant 27.2 21.0 - Cucumbers/plant 34.9 30.9 - Peppers/plant 111.3 80.3 - Egg plants/plant 24.6 24.4
7. Production obtained : gr/plant - Tomatoes 7 829 7 160 - Cucumbers 12 359 10 706 - Peppers 3 815 3 376 - Egg plants 6 584 6 694
5.6. Heated water
1. 7 Apr 8 Apr 11 Apr 21 Apr PERRO 1983 1983 1983 1983
2. 5hr 5hr 5hr 5hr Fran 9hr till 14 hr
3. 17 18 18 20 °c average input water temperature
4. 0.77 0.77 0.77 0.77 1/s average flow rate
5. 23 23 23 26 °c average heated water temperature