appendix t0 the 2006-07 report of degrees · pdf fileappendix t0 the 2006-07 report of degrees...
TRANSCRIPT

APPENDIX T0 THE 2006-07 REPORT OF DEGREES AWARDED BY THE UNIVERSITY OF MISSOURIDEPARTMENT DETAIL SECTION
P&B 2007, Report 5 Appendix
Randy SadeAssistant Research Analyst
Office of Institutional Research and Planning717 Lewis Hall
University of Missouri System
September 2007
http://www.umsystem.edu/ums/departments/fa/planning/

Change in FY07SCHOOL/COLLEGE FY FY FY FY FY FY FY FY FY FY Average relative to the DEPT PROGRAM DEGREE 1998 1999 2000 2001 2002 2003 2004 2005 2006 2007 3-Year 5-Year 10-Year 10-Year Avg.
INTDEP- General Agriculture BS (32) 62 47 52 28 33 16 23 24 18 17 19.7 19.6 32.0 -47%
INTDIV- Agricultural Education BS (32) 23 19 23 24 24 25 28 28 23 13 21.3 23.4 23.0 -43%MS 1 6 10 4 10 16 10.0 9.2 N/APHD 2 4 0 1 3 2 2.0 2.0 N/A
AG EC- Agribusiness Management BS (62) 0 7 24 25 37 39 37 49 31 39.0 38.6 N/AAgricultural Economics BS 42 46 43 44 39 40 23 27 19 20 22.0 25.8 34.3 -42%
MS 4 6 8 8 10 4 6 10 7 5 7.3 6.4 6.8 -26%PHD 5 7 4 5 6 1 3 5 5 6 5.3 4.0 4.7 28%
AGRON- Agronomy MS 3 6 4 7 6 4 4 3 4 9 5.3 4.8 5.0 80%PHD 1 4 0 1 1 3 5 0 0 3 1.0 2.2 1.8 67%
AN SCI- Animal Sciences (20) BS (9) (32) 52 39 49 70 35 61 60 43 55 71 56.3 58.0 53.5 33%MS 9 7 8 11 12 7 9 9 11 8 9.3 8.8 9.1 -12%PHD 7 4 8 7 7 8 5 7 9 7 7.7 7.2 6.9 1%
BIO EN- Agricultural Sys. Mgmt. (51) BS (32) 21 20 23 29 15 22 18 13 22 22 19.0 19.4 20.5 7%
BIOCHM- Biochemistry BS (32) 49 44 55 55 70 46 39 31 39 42 37.3 39.4 47.0 -11%MS 2 3 0 4 0 1 2 1 1 2 1.3 1.4 1.6 25%PHD 3 3 4 3 8 3 5 5 9 4 6.0 5.2 4.7 -15%
DASS- Agricultural Journalism BS (32) 5 6 11 7 3 6 10 11 16 4 10.3 9.4 7.9 -49%
ENTOM- Entomology MS 2 1 3 4 3 4 3 2 1 3 2.0 2.6 2.6 15%PHD 2 1 3 0 0 2 1 0 0 1 0.3 0.8 1.0 0%
FHSP- Food Science & Nutrition BS (32) 16 9 9 14 5 13 7 11 8 8 9.0 9.4 10.0 -20%Food Science MS 8 10 7 4 5 5 7 6 7 7 6.7 6.4 6.6 6%
PHD 1 2 4 5 1 3 2 2 0 1 1.0 1.6 2.1 -52%Hotel & Restaurant Mgmt. BS (25) (32) 63 62 68 46 43 48 69 56 84 86 75.3 68.6 62.5 38%
HORT- Horticulture MS 0 2 1 1 2 0 1 1 0 2 1.0 0.8 1.0 100%PHD 0 0 0 0 0 2 0 0 0 0 0.0 0.4 0.2 -100%
AGRICULTURE, FOOD, AND NATURAL RESOURCES, COLLEGE OF
Table 3.1. Degrees Awarded at the University Of Missouri - Columbia

Change in FY07SCHOOL/COLLEGE FY FY FY FY FY FY FY FY FY FY Average relative to the DEPT PROGRAM DEGREE 1998 1999 2000 2001 2002 2003 2004 2005 2006 2007 3-Year 5-Year 10-Year 10-Year Avg.
Table 3.1. Degrees Awarded at the University Of Missouri - Columbia
PLNT S- Plant, Insect and Microbial Sc. MS 1 0 0 0 1 0 0 1 1 2 1.3 0.8 0.6 233%PHD (43) 4 1 1 2 0 1 0 3 2 0 1.7 1.2 1.4 -100%
Plant Science (48) BS (32) 23 36 41 28 25 25 19 25 23 30 26.0 24.4 27.5 9%
RU SOC- Rural Sociology BS (32) (37) 0 0 1 N/A N/A N/AMS 2 2 0 3 4 6 1 0 1 1 0.7 1.8 2.0 -50%PHD 4 3 2 1 3 5 6 1 3 2 2.0 3.4 3.0 -33%
TOTAL-All Programs Bachelors 356 328 382 369 317 339 335 306 356 344 335.3 336.0 343.2 0%Masters 31 37 31 42 44 37 43 37 43 55 45.0 43.0 40.0 38%Doctorate 27 25 26 24 28 32 27 24 31 26 27.0 28.0 27.0 -4%
TOTAL-Agriculture, Food, & Natural Resources All 414 390 439 435 389 408 405 367 430 425 407.3 407.0 410.2 4%
ALL- International Studies (28) BA 21 30 37 32 52 41 55 62 69 53 61.3 56.0 45.2 17%
INTDEP- Linguistics BA 0 2 3 3 3 4 4 2 5 5 4.0 4.0 3.1 61%Microbiology BA 3 2 5 5 0 7 9 5 7 8 6.7 7.2 5.1 57%
INTDIV- Interdisciplinary BA 98 127 165 154 150 181 159 133 137 157 142.3 153.4 146.1 7%
ANTHRO- Anthropology BA 25 32 38 30 16 37 34 36 40 43 39.7 38.0 33.1 30%MA 6 3 3 2 11 6 8 4 8 6 6.0 6.4 5.7 5%PHD 0 6 4 1 4 7 0 5 3 2 3.3 3.4 3.2 -38%
AR H A- Art History & Archaeology BA 14 20 15 16 15 23 9 9 16 18 14.3 15.0 15.5 16%MA 3 3 2 2 3 0 3 2 3 5 3.3 2.6 2.6 92%PHD 4 2 3 0 0 1 4 2 1 2 1.7 2.0 1.9 5%
BIO SC- Biological Sciences BA,BS (7) 144 171 176 154 155 167 190 191 209 225 208.3 196.4 178.2 26%MA 4 3 8 1 1 6 3 3 4 4 3.7 4.0 3.7 8%PHD 12 8 10 11 7 7 8 8 8 9 8.3 8.0 8.8 2%
CHEM- Chemistry BA,BS 11 22 11 23 19 20 20 20 28 27 25.0 23.0 20.1 34%MS 5 4 4 6 5 7 4 11 4 5 6.7 6.2 5.5 -9%PHD 6 8 6 15 13 7 8 9 15 12 12.0 10.2 9.9 21%
ARTS AND SCIENCE, COLLEGE OF

Change in FY07SCHOOL/COLLEGE FY FY FY FY FY FY FY FY FY FY Average relative to the DEPT PROGRAM DEGREE 1998 1999 2000 2001 2002 2003 2004 2005 2006 2007 3-Year 5-Year 10-Year 10-Year Avg.
Table 3.1. Degrees Awarded at the University Of Missouri - Columbia
CL STY- Classics BA 5 11 14 9 6 9 9 6 16 18 13.3 11.6 10.3 75%Classical Studies MA 2 2 1 2 1 3 2 3 4 1 2.7 2.6 2.1 -52%
PHD 3 0 0 3 2 0 0 2 0.7 1.4 N/A
COMMUN- Communication (6) BA 89 86 115 105 140 117 107 106 134 122 120.7 117.2 112.1 9%MA 3 0 2 2 2 0 0 1 2 0 1.0 0.6 1.2 -100%
Com. Sci. & Disorders (6) (68) PHD 2 3 1 7 5 9 10 6 6 3 5.0 6.8 5.2 -42%
CS- Computer Science BA,BS 24 31 33 48 50 50 49 38 27 14 26.3 35.6 36.4 -62%MS (67) 15 7 0 0 0 0 0 1 1 0 0.7 0.4 2.4 -100%
ECONOM- Economics BA,BS (24) 18 17 21 22 17 14 17 10 22 28 20.0 18.2 18.6 51%MA,MST (34) 14 5 6 7 13 14 13 12 11 7 10.0 11.4 10.2 -31%PHD 6 5 4 10 8 12 5 12 8 7 9.0 8.8 7.7 -9%
ENGLSH- English BA 108 98 125 97 110 119 126 123 99 124 115.3 118.2 112.9 10%MA 9 15 3 9 7 8 10 10 4 14 9.3 9.2 8.9 57%PHD 7 10 10 7 11 5 14 12 11 5 9.3 9.4 9.2 -46%
G STDY- Evening General Studies BGS 4 8 2 6 11 6.3 6.2 N/AGeneral Studies BGS 29 18 21 17 32 52 49 68 71 79 72.7 63.8 43.6 81%
GEOG- Geography BA 31 23 17 17 24 19 16 14 18 18 16.7 17.0 19.7 -9%MA 6 7 3 10 5 8 2 5 9 4 6.0 5.6 5.9 -32%
GEOL S- Environmental Geology (26) BA,BS 13 5 9 9 3 5 9 4 5 1 3.3 4.8 6.3 -84%Geology MS 3 7 3 3 3 6 9 6 5 7 6.0 6.6 5.2 35%
PHD 3 0 0 0 1 4 1 1 1 1 1.0 1.6 1.2 -17%
G-R ST- German BA 7 8 17 6 3 8 6 6 9 8 7.7 7.4 7.8 3%MA 4 5 2 6 5 3 0 3 4 2 3.0 2.4 3.4 -41%
Russian BA 4 4 6 6 7 7 5 9 4 5 6.0 6.0 5.7 -12%Russian & Slavonic Studies (72) MA 0 0 1 1 3 3 2 2.7 2.0 N/A
HIST- History BA 67 83 97 67 95 75 88 102 102 102 102.0 93.8 87.8 16%MA 2 4 7 6 4 9 6 4 8 6 6.0 6.6 5.6 7%PHD 2 4 5 4 1 11 10 7 8 3 6.0 7.8 5.5 -45%

Change in FY07SCHOOL/COLLEGE FY FY FY FY FY FY FY FY FY FY Average relative to the DEPT PROGRAM DEGREE 1998 1999 2000 2001 2002 2003 2004 2005 2006 2007 3-Year 5-Year 10-Year 10-Year Avg.
Table 3.1. Degrees Awarded at the University Of Missouri - Columbia
SOCIOL- Sociology BA 29 30 31 29 35 42 56 57 64 62 61.0 56.2 43.5 43%MA 5 2 8 3 4 2 3 3 6 11 6.7 5.0 4.7 134%PHD 4 3 2 2 3 4 3 3 0 4 2.3 2.8 2.8 43%
STAT- Statistics BA,BS (7) 5 3 4 3 5 10 13 7 14 6 9.0 10.0 7.0 -14%MA 3 7 3 6 2 6 10 11 9 6 8.7 8.4 6.3 -5%PHD 6 4 5 1 4 2 4 5 5 6 5.3 4.4 4.2 43%
TOTAL-All Programs Bachelors 1,159 1,251 1,410 1,310 1,405 1,490 1,578 1,549 1,633 1,775 1,652.3 1,605.0 1,456.0 22%Masters 131 119 108 110 118 143 130 136 159 161 152.0 145.8 131.5 22%Doctorate 97 74 88 100 82 92 94 101 100 87 96.0 94.8 91.5 -5%
TOTAL-Arts & Science All 1,387 1,444 1,606 1,520 1,605 1,725 1,802 1,786 1,892 2,023 1,900.3 1,845.6 1,679.0 20%
ALL- Business Administration BSBA (1) 356 402 403 430 474 461 551 617 685 676 659.3 598.0 505.5 34%
INTDEP- Business Administration MBA 68 40 67 60 79 77 105 85 103 96 94.7 93.2 78.0 23%
ACCTCY- Accountancy BSACC 42 49 64 67 65 68 81 94 92 116 100.7 90.2 73.8 57%MACC,MS(46) 12 49 70 73 65 74 85 88 94 117 99.7 91.6 72.7 61%PHD 1 1 1 1 1 1 2 3 2 4 3.0 2.4 1.7 135%
Accounting Info. Systems GR CT (76) 28 37 36 30 23 21 24.7 29.4 N/ATaxation GR CT (76) 8 23 32 26 28 29 27.7 27.6 N/A
BUS- Business Administration PHD 5 4 4 3 9 4 6 5 4 10 6.3 5.8 5.4 85%
PUB AD- Public Administration (70) BSPA (23) 0 0 0 0 1 N/A N/A N/AMPA 21 26 26 6 8 2 1 1 N/A N/A N/A
TOTAL-All Programs Bachelors 398 451 467 497 540 529 632 711 777 792 760.0 688.2 579.4 37%Grad. Certif. 36 60 68 56 51 50 52.3 57.0 N/AMasters 101 115 163 139 152 153 191 174 197 213 194.7 185.6 159.8 33%Doctorate 6 5 5 4 10 5 8 8 6 14 9.3 8.2 7.1 97%
TOTAL-Business All 505 571 635 640 738 747 899 949 1,031 1,069 1,016.3 939.0 778.4 37%
BUSINESS, COLLEGE OF

Change in FY07SCHOOL/COLLEGE FY FY FY FY FY FY FY FY FY FY Average relative to the DEPT PROGRAM DEGREE 1998 1999 2000 2001 2002 2003 2004 2005 2006 2007 3-Year 5-Year 10-Year 10-Year Avg.
Table 3.1. Degrees Awarded at the University Of Missouri - Columbia
MATH- Applied Mathematics MS 4 5 7 3 2 11 9 8 6 7 7.0 8.2 6.2 13%Mathematics BA,BS (5) 15 27 27 20 26 21 27 19 19 32 23.3 23.6 23.3 37%
MA,MST 2 6 3 1 7 7 2 3 12 5 6.7 5.8 4.8 4%PHD 4 3 8 4 5 2 3 6 9 4 6.3 4.8 4.8 -17%
MUSIC- Music BA,BM 7 13 12 17 16 7 16 9 21 22 17.3 15.0 14.0 57%MA,MM 8 9 13 9 6 12 8 11 7 14 10.7 10.4 9.7 44%
PHIL- Philosophy BA 25 23 18 23 20 19 17 26 17 26 23.0 21.0 21.4 21%MA 4 3 2 3 4 2 1 2 7 8 5.7 4.0 3.6 122%PHD 1 0 2 4 2 1 0 3 2 5 3.3 2.2 2.0 150%
PHYS&A- Physics BA,BS 8 10 9 6 7 9 12 9 10 19 12.7 11.8 9.9 92%MS 4 2 3 2 3 1 7 3 7 5 5.0 4.6 3.7 35%PHD 9 3 3 4 3 5 5 4 8 3 5.0 5.0 4.7 -36%
POL SC- Political Science BA 98 95 112 108 134 122 134 145 142 174 153.7 143.4 126.4 38%MA 6 1 3 5 6 6 4 7 9 7 7.7 6.6 5.4 30%PHD 3 1 5 12 2 6 3 2 3 6 3.7 4.0 4.3 40%
PSYCH- Psychology BA 173 159 178 195 177 200 219 223 215 264 234.0 224.2 200.3 32%MA,MS 14 10 8 10 5 13 12 8 4 15 9.0 10.4 9.9 52%PHD 19 13 13 12 9 3 8 10 8 7 8.3 7.2 10.2 -31%
REL ST- Religious Studies BA (4) 12 5 15 6 10 12 18 12 7 12 10.3 12.2 10.9 10%MA (57) 0 0 1 1 4 3 0 1 7 2 3.3 2.6 1.9 5%
RM&LIT- French BA 14 8 7 6 5 9 11 8 6 10 8.0 8.8 8.4 19%MA 2 3 2 2 2 3 1 2 4 7 4.3 3.4 2.8 150%
Spanish BA 16 27 17 31 16 24 24 28 19 26 24.3 24.2 22.8 14%MA 1 3 3 5 4 1 7 3 6 9 6.0 5.2 4.2 114%
Romance Languages PHD 4 1 3 4 3 1 4 3 2 2 2.3 2.4 2.7 -26%
SFA-A- Art BA,BFA 38 48 38 37 44 43 47 43 62 48 51.0 48.6 44.8 7%MFA 2 3 7 2 8 4 4 5 3 2 3.3 3.6 4.0 -50%
SFA-T- Theatre (6) BA 8 13 17 9 13 13 15 17 13 8 12.7 13.2 12.6 -37%MA 0 0 1 2 1 1 1 1 2 0 1.0 1.0 0.9 -100%PHD 5 0 1 2 1 2 2 3 2 4 3.0 2.6 2.2 82%

Change in FY07SCHOOL/COLLEGE FY FY FY FY FY FY FY FY FY FY Average relative to the DEPT PROGRAM DEGREE 1998 1999 2000 2001 2002 2003 2004 2005 2006 2007 3-Year 5-Year 10-Year 10-Year Avg.
Table 3.1. Degrees Awarded at the University Of Missouri - Columbia
C & I- Career & Tech. Education (74) MED 18 22 21 25 17 9 4 4 5 1 3.3 4.6 12.6 -92%EDSP 3 8 2 3 1 2 0 1 0 0 0.3 0.6 2.0 -100%PHD,EDD 19 4 2 12 13 5 4 2 4 2 2.7 3.4 6.7 -70%
Curriculum & Instruction MA,MED 85 123 106 114 109 140 143 141 182 184 169.0 158.0 132.7 39%EDSP 6 1 6 7 3 2 3 2 2 0 1.3 1.8 3.2 -100%PHD,EDD 16 12 20 19 11 10 12 9 11 7 9.0 9.8 12.7 -45%
Health & Exercise Science PHD (81) 1 1 0 1 0 0 N/A N/A N/AElementary Education BSED 1 N/A N/A N/AMiddle Education BSED (62) 14 25 15 24 12 13 3 N/A N/A N/A
ED LPA- (44) Educational Leadership EDD (56) 0 0 14 11 17 21 15 31 22 34 29.0 24.6 16.5 106%Ed. Lead. & Policy Anlys. (66) MA,MED 22 9 9 7 10 21 20 16 26 28 23.3 22.2 16.8 67%
EDSP 14 21 2 23 17 19 12 12 0 20 10.7 12.6 14.0 43%PHD,EDD 24 34 13 14 6 3 10 7 4 15 8.7 7.8 13.0 15%
Higher & Adult Education PHD,EDD 7 0 2 1 1 2 N/A N/A N/ASocial & Phil Foundation of Ed. PHD,EDD 1 1 N/A N/A N/A
ESC PS- Curriculum & Instruction MED 2 2 N/A N/A N/AEd. & Counseling Psychology BES 3 0 0 N/A N/A N/A
MA,MED 24 31 31 24 30 42 37 42 62 46 50.0 45.8 36.9 25%EDSP 1 2 2 1 4 9 1 8 11 12 10.3 8.2 5.1 135%PHD 8 12 16 10 14 23 19 13 17 17 15.7 17.8 14.9 14%
H & ES- Health & Exercise Sc. (47) (63) MA,MED 5 1 1 0 1 N/A N/A N/APHD (81) 0 0 1 1 2 1 0 0 1 0 0.3 0.4 0.6 -100%
H A ED- Higher & Continuing Education MA 1 0 1 N/A N/A N/A
IS<- Info. Sci. & Learn. Tech. (60) MA,MED 0 0 0 77 108 173 182 146 154 163 154.3 163.6 100.3 63%EDSP 0 0 0 1 8 9 7 10 8 4 7.3 7.6 4.7 -15%PHD 0 0 0 5 2 3 4 9 2 6 5.7 4.8 3.1 94%
Library Science (60) MA,MED 80 80 86 2 2 1 1 N/A N/A N/APHD 4 1 0 0 N/A N/A N/A
SPC ED- Special Education BSED (54) (79) 14 27 1 5 6 8 9 7.7 N/A N/AMA,MED 11 28 13 18 17 24 24 11 9 18 12.7 17.2 17.3 4%EDSP 0 0 0 1 0 0 0 0 0 0 0.0 0.0 0.1 -100%PHD,EDD 4 3 3 3 2 3 5 0 1 3 1.3 2.4 2.7 11%
EDUCATION, COLLEGE OF

Change in FY07SCHOOL/COLLEGE FY FY FY FY FY FY FY FY FY FY Average relative to the DEPT PROGRAM DEGREE 1998 1999 2000 2001 2002 2003 2004 2005 2006 2007 3-Year 5-Year 10-Year 10-Year Avg.
Table 3.1. Degrees Awarded at the University Of Missouri - Columbia
TDP- (2) Early Childhood Education BSED (21) 29 44 27 29 33 29 31 43 47 22 37.3 34.4 33.4 -34%Educational Studies BES 19 21 12 7 12 10 16 10 8 2 6.7 9.2 11.7 -83%Elementary Education BSED 90 97 79 92 70 55 53 71 96 100 89.0 75.0 80.3 25%Middle Education BSED 10 12 20 14.0 N/A N/ASecondary Education BSED 106 108 105 85 80 97 101 91 112 116 106.3 103.4 100.1 16%
TOTAL-All Programs Bachelors 258 314 249 228 219 204 219 234 283 269 262.0 241.8 247.7 9%Masters 245 294 267 267 297 412 412 360 438 440 412.7 412.4 343.2 28%Ed. Specialist 24 32 12 36 33 41 23 33 21 36 30.0 30.8 29.1 24%Doctorate 77 68 76 76 69 70 70 73 62 84 73.0 71.8 72.5 16%
TOTAL-Education All 604 708 604 607 618 727 724 700 804 829 777.7 756.8 692.5 20%
INTDEP- Engineering ME 7 6 9 4 2 1 0 1 0.7 1.6 N/A
BIO EN- Biological Engineering (58) BSBE (59) 7 5 11 11 14 11 15 21 22 21 21.3 18.0 13.8 52%MS 4 3 3 3 2 2 2 4 8 4 5.3 4.0 3.5 14%PHD 1 5 2 1 4 2 3 2 2 7 3.7 3.2 2.9 141%
CE&ENE- Civil Engineering BSCIE 52 64 69 61 49 55 50 59 55 61 58.3 56.0 57.5 6%MS 18 17 17 20 18 12 16 16 15 17 16.0 15.2 16.6 2%PHD 1 0 2 1 3 3 1 5 5 2 4.0 3.2 2.3 -13%
CS- Computer Science BS 25 43 65 44 56 44 60 67 37 31 45.0 47.8 47.2 -34%MS (67) 12 7 17 14 20 28 14 19 9 14.0 18.0 N/APHD (57) 0 1 4 2 0 5 3 4 5 6 5.0 4.6 3.0 100%
Information Technology BS 1 20 N/A N/A N/A
CH ENG- Chemical Engineering BSCHE 35 55 43 42 38 29 26 31 34 34 33.0 30.8 36.7 -7%MS 7 6 1 6 3 2 9 5 4 1 3.3 4.2 4.4 -77%PHD 5 4 2 0 0 1 1 1 3 6 3.3 2.4 2.3 161%
ENGINEERING, COLLEGE OF

Change in FY07SCHOOL/COLLEGE FY FY FY FY FY FY FY FY FY FY Average relative to the DEPT PROGRAM DEGREE 1998 1999 2000 2001 2002 2003 2004 2005 2006 2007 3-Year 5-Year 10-Year 10-Year Avg.
Table 3.1. Degrees Awarded at the University Of Missouri - Columbia
ECE- Computer Engineering (82) BSCOE 47 38 55 43 40 30 48 39 29 38 35.3 36.8 40.7 -7%MS 0 3 2 0 3 2 1 1 0 0 0.3 0.8 1.2 -100%
Electrical and Computer Eng. (78) PHD 9 3 7 5 3 11 1 3 7 6 5.3 5.6 5.5 9%Electrical Engineering BSEE 87 60 70 69 53 43 54 57 42 62 53.7 51.6 59.7 4%
MS 23 21 23 14 11 25 12 26 29 11 22.0 20.6 19.5 -44%
ENG-ID- Nuclear Engineering MS 4 7 5 5 7 8 3 5 5 0 3.3 4.2 4.9 -100%PHD 6 1 10 1 2 3 4 4 3 6 4.3 4.0 4.0 50%
IMSE- Industrial Engineering BSIE 25 15 13 14 13 24 24 20 20 19 19.7 21.4 18.7 2%MS 8 6 4 3 5 2 3 3 10 7 6.7 5.0 5.1 37%PHD 6 1 1 1 3 1 0 2 0 1 1.0 0.8 1.6 -38%
MA ENG- Mechanical Engineering BSME 68 74 75 70 65 86 82 84 103 97 94.7 90.4 80.4 21%Mechanical & Aerospace Engr. MS 18 13 15 10 7 26 21 12 17 10 13.0 17.2 14.9 -33%
PHD 3 2 6 4 1 4 3 3 8 5 5.3 4.6 3.9 28%
TOTAL-All Programs Bachelors 346 354 401 354 328 322 359 378 343 383 368.0 357.0 356.8 7%Masters 82 88 84 84 79 103 97 87 107 60 84.7 90.8 87.1 -31%Doctorate 31 17 34 15 16 30 16 24 33 39 32.0 28.4 25.5 53%
TOTAL-Engineering All 459 459 519 453 423 455 472 489 483 482 484.7 476.2 469.4 3%
HP- Clinical Laboratory Sciences BHS (52) 1 0 0 0 0 0 0 0 2 3 1.7 1.0 0.6 400%Comm. Sci. & Disorders (50) BHS 19 31 20 27 25 21 24 20 24 27 23.7 23.2 23.8 13%
MHS 7 9 7 11 15 12 8 11 9 12 10.7 10.4 10.1 19%PHD 1 1 0 0 0 0 0 0.0 0.0 N/A
Diagnostic Medical Ultrasound BHS 3 8 15 13 14 14.0 10.6 N/AMHS 3 3 6 6 6 6.0 4.8 N/A
Health Services Management BHS (49) 0 0 0 0 1 N/A N/A N/AOccupational Therapy BHS (53) 36 38 35 34 27 18 11 34 16 22 24.0 20.2 27.1 -19%
MOT (85) 14 19 0 11.0 N/A N/APreprof. Physical Therapy (65) BHS 49 49 0 44 39 36 25 27 31 34 30.7 30.6 33.4 2%Physical Therapy MPT (61) 0 0 1 49 45 35 28 31 33 38 34.0 33.0 26.0 46%Radiologic Sciences BHS 15 16 15 14 14 15 22 18 19 24 20.3 19.6 17.2 40%Respiratory Therapy BHS 17 9 13 10 11 6 6 8 8 14 10.0 8.4 10.2 37%
HEALTH PROFESSIONS, SCHOOL OF

Change in FY07SCHOOL/COLLEGE FY FY FY FY FY FY FY FY FY FY Average relative to the DEPT PROGRAM DEGREE 1998 1999 2000 2001 2002 2003 2004 2005 2006 2007 3-Year 5-Year 10-Year 10-Year Avg.
Table 3.1. Degrees Awarded at the University Of Missouri - Columbia
TOTAL-All Programs Bachelors 137 143 83 129 117 99 96 122 113 138 124.3 113.6 117.7 17%Masters 7 9 8 60 60 50 39 62 67 56 61.7 54.8 41.8 34%Doctorate 1 1 0 0 0 0 0 0.0 0.0 N/A
TOTAL-Health Professions All 144 152 91 190 178 149 135 184 180 194 186.0 168.4 159.7 21%
ALL- Human Environmental Sci. (16) PHD 6 6 4 11 5 9 6 3 0 5 2.7 4.6 5.5 -9%
ARCH- Architectural Studies (84) BSHES (14) 31 28 30 36 25 25 39 36 44 32 37.3 35.2 32.6 -2%MA,MS 5 2 1 0 2 3 3 10 6 0 5.3 4.4 3.2 -100%
H D FS- Hum. Dev. & Fam. Studies (11) BSHES (14) 56 58 59 37 56 45 34 46 44 38 42.7 41.4 47.3 -20%MA,MS 11 6 9 10 15 8 9 15 10 11 12.0 10.6 10.4 6%
HN&FDS- (71) Exercise Physiology (63) MA 4 0 3 2 2 4 1 2 2.3 2.2 N/APHD 1 0 0 4 1 1.7 1.2 N/A
Human Ntrn. Foods & Sys. Mgt. MA(13),MS 0 2 1 1 1 0 0 1 0 0 0.3 0.2 0.6 -100%Nutritional Sciences (15) BSHES (14) 25 38 55 50 41 43 55 75 56 62 64.3 58.2 50.0 24%Nutritional Area Program MS 2 3 0 0 2 0 0 0.7 0.4 N/A
PHD 1 1 0 0 0 1 0.3 0.4 N/A
P F P- Personal Financial Planning (86) BSHES(14)(30) 46 69 72 102 63 64 48 42 49 32 41.0 47.0 58.7 -45%GR CT (83) 1 0 N/A N/A N/AMA(13),MS(29) 1 3 3 1 2 1 1 1 6 0 2.3 1.8 1.9 -100%
T A M- Textile & Apparel Mgmt. (12) BSHES (14) 32 35 46 59 52 51 57 63 57 70 63.3 59.6 52.2 34%MA,MS 1 3 1 2 2 2 0 2 1 2 1.7 1.4 1.6 25%
TOTAL-All Programs Bachelors 190 228 262 284 237 228 233 262 250 234 248.7 241.4 240.8 -3%Grad. Certif. 1 0 N/A N/A N/AMasters 20 17 19 16 28 16 15 35 24 15 24.7 21.0 20.5 -27%Doctorate 6 6 4 11 6 11 6 3 4 7 4.7 6.2 6.4 9%
TOTAL-Human Environmental Sciences All 216 251 285 311 271 255 254 300 279 256 278.3 268.8 267.8 -4%
HUMAN ENVIRONMENTAL SCIENCES, COLLEGE OF

Change in FY07SCHOOL/COLLEGE FY FY FY FY FY FY FY FY FY FY Average relative to the DEPT PROGRAM DEGREE 1998 1999 2000 2001 2002 2003 2004 2005 2006 2007 3-Year 5-Year 10-Year 10-Year Avg.
Table 3.1. Degrees Awarded at the University Of Missouri - Columbia
JOURN- Journalism BJ 284 300 292 287 320 337 364 404 412 426 414.0 388.6 342.6 24%MA 61 54 55 62 61 75 64 94 70 69 77.7 74.4 66.5 4%PHD 10 5 4 6 8 8 8 10 14 5 9.7 9.0 7.8 -36%
TOTAL-All Programs Bachelors 284 300 292 287 320 337 364 404 412 426 414.0 388.6 342.6 24%Masters 61 54 55 62 61 75 64 94 70 69 77.7 74.4 66.5 4%Doctorate 10 5 4 6 8 8 8 10 14 5 9.7 9.0 7.8 -36%
TOTAL-Journalism All 355 359 351 355 389 420 436 508 496 500 501.3 472.0 416.9 20%
LAW- Dispute Resolution GR CT (75) 0 17 0 1 12 0 4.3 6.0 N/ALLM (62) 0 6 4 13 7 12 10 7 13 10.0 9.8 N/A
Elec. Com. Intellectual Property GR CT (76) 4 0 0 0 0 0.0 0.8 N/ALaw JD 131 185 166 157 139 172 175 138 139 143 140.0 153.4 154.5 -7%Taxation GR CT (75) 0 12 0 0 6 0 2.0 3.6 N/A
TOTAL-All Programs Grad. Certif. 0 33 0 1 18 0 6.3 10.4 N/AFirst Profes. 131 185 166 157 139 172 175 138 139 143 140.0 153.4 154.5 -7%Masters 0 6 4 13 7 12 10 7 13 10.0 9.8 N/A
TOTAL-Law All 131 185 172 161 152 212 187 149 164 156 156.3 173.6 166.9 -7%
INTDEP- Health Administration (8) MHA 32 17 34 24 23 23 15 21 25 24 23.3 21.6 23.8 1%Medicine MD 97 87 87 96 92 90 92 89 89 87 88.3 89.4 90.6 -4%Public Health MS 0 0 3 7 3 3 4 3 3 1 2.3 2.8 2.7 -63%
BIOCHM- Biochemistry PHD (33) 1 0 0 4 N/A N/A N/A
MICR&I- Microbiology (Med) MS 1 1 1 0 0 0 1 2 1 0 1.0 0.8 0.7 -100%PHD 2 5 3 8 3 5 2 3 2 5 3.3 3.4 3.8 32%
JOURNALISM, SCHOOL OF
MEDICINE, SCHOOL OF
LAW, SCHOOL OF

Change in FY07SCHOOL/COLLEGE FY FY FY FY FY FY FY FY FY FY Average relative to the DEPT PROGRAM DEGREE 1998 1999 2000 2001 2002 2003 2004 2005 2006 2007 3-Year 5-Year 10-Year 10-Year Avg.
Table 3.1. Degrees Awarded at the University Of Missouri - Columbia
PHRMGY- Pharmacology MS 1 3 1 2 0 0 0 0 0 0 0.0 0.0 0.7 -100%PHD 1 4 0 2 2 0 1 1 2 1 1.3 1.0 1.4 -29%
PHYSIO- Physiology (Medicine) MS (10) 3 0 0 1 0 3 2 1 0 0 0.3 1.2 1.0 -100%PHD 2 1 6 6 1 5 2 3 1 2 2.0 2.6 2.9 -31%
PTH & AS- Pathology MS 0 1 0 0 1 0 0 0 0 0 0.0 0.0 0.2 -100%
TOTAL-All Programs First Profes. 97 87 87 96 92 90 92 89 89 87 88.3 89.4 90.6 -4%Masters 37 22 39 34 27 29 22 27 29 25 27.0 26.4 29.1 -14%Doctorate 6 10 9 20 6 10 5 7 5 8 6.7 7.0 8.6 -7%
TOTAL-Medicine All 140 119 135 150 125 129 119 123 123 120 122.0 122.8 128.3 -6%
F & W- Fisheries & Wildlife BSFW 28 47 29 24 27 38 31 34 31 48 37.7 36.4 33.7 42%MS 6 10 11 8 5 8 8 9 5 11 8.3 8.2 8.1 36%PHD 0 0 1 6 3 1 2 4 3 4 3.7 2.8 2.4 67%
FOREST- Forestry BSF 15 14 12 12 12 18 18 18 22 24 21.3 20.0 16.5 45%MS 6 3 1 4 3 3 4 4 7 3 4.7 4.2 3.8 -21%PHD 2 1 2 1 2 0 0 0 3 4 2.3 1.4 1.5 167%
R P&TR- Parks, Rec., & Tourism (22) BS 70 74 67 39 52 50 38 42 27 40 36.3 39.4 49.9 -20%MS 1 6 4 4 3 4 3 4 4 5 4.3 4.0 3.8 32%
SEAS- Soil & Atmospheric Sci. (38) BS (32) 13 10 10 8 15 16 17 15 19 19 17.7 17.2 14.2 34%MS 7 3 4 0 3 1 2 10 5 7 7.3 5.0 4.2 67%PHD 3 1 0 0 1 1 4 5 1 1 2.3 2.4 1.7 -41%
TOTAL-All Programs Bachelors 126 145 118 83 106 122 104 109 99 131 113.0 113.0 114.3 15%Masters 20 22 20 16 14 16 17 27 21 26 24.7 21.4 19.9 31%Doctorate 5 2 3 7 6 2 6 9 7 9 8.3 6.6 5.6 61%
TOTAL-Natural Resources All 151 169 141 106 126 140 127 145 127 166 146.0 141.0 139.8 19%
NATURAL RESOURCES, SCHOOL OF

Change in FY07SCHOOL/COLLEGE FY FY FY FY FY FY FY FY FY FY Average relative to the DEPT PROGRAM DEGREE 1998 1999 2000 2001 2002 2003 2004 2005 2006 2007 3-Year 5-Year 10-Year 10-Year Avg.
Table 3.1. Degrees Awarded at the University Of Missouri - Columbia
NURSE- Nursing BSN 115 134 154 145 145 143 134 156 166 201 174.3 160.0 149.3 35%MS 42 43 27 34 25 27 26 36 28 33 32.3 30.0 32.1 3%PHD (41) 3 5 2 1 9 4 3 2 4 3 3.0 3.2 3.6 -17%
TOTAL-All Programs Bachelors 115 134 154 145 145 143 134 156 166 201 174.3 160.0 149.3 35%Masters 42 43 27 34 25 27 26 36 28 33 32.3 30.0 32.1 3%Doctorate 3 5 2 1 9 4 3 2 4 3 3.0 3.2 3.6 -17%
TOTAL-Nursing All 160 182 183 180 179 174 163 194 198 237 209.7 193.2 185.0 28%
SOC WK- Social Work BSW 22 22 22 30 27 35 32 28 29 43 33.3 33.4 29.0 48%MSW 64 56 65 98 56 108 103 48 65 112 75.0 87.2 77.5 45%PHD (69) 0 0 0 0 0 1 0 1 0.7 0.4 N/A
TOTAL-All Programs Bachelors 22 22 22 30 27 35 32 28 29 43 33.3 33.4 29.0 48%Masters 64 56 65 98 56 108 103 48 65 112 75.0 87.2 77.5 45%Doctorate 0 0 0 0 0 1 0 1 0.7 0.4 N/A
TOTAL-Social Work All 86 78 87 128 83 143 135 77 94 156 109.0 121.0 106.7 46%
INTDEP- Veterinary Medicine DVM 64 58 61 62 60 63 64 61 64 59 61.3 62.2 61.6 -4%
V BSCI- (45) Biomedical Sciences MS (55) (73) 5 1 3 1 7 9 7 4 11 7.3 7.6 N/APHD (73) 6 4 2 2 1 1 0 2 1 4 2.3 1.6 2.3 74%
V M&S- Vet. Medicine & Surgery MS (55) 2 4 1 0 2 N/A N/A N/A
V PBIO Veterinary Microbiology MS (55) 2 2 0 0 N/A N/A N/AVeterinary Pathology MS (55) 0 2 1 1 N/A N/A N/A
VETERINARY MEDICINE, COLLEGE OF
SOCIAL WORK, SCHOOL OF
NURSING, SCHOOL OF

Change in FY07SCHOOL/COLLEGE FY FY FY FY FY FY FY FY FY FY Average relative to the DEPT PROGRAM DEGREE 1998 1999 2000 2001 2002 2003 2004 2005 2006 2007 3-Year 5-Year 10-Year 10-Year Avg.
Table 3.1. Degrees Awarded at the University Of Missouri - Columbia
TOTAL-All Programs First Profes. 64 58 61 62 60 63 64 61 64 59 61.3 62.2 61.6 -4%Masters 4 13 3 4 3 7 9 7 4 11 7.3 7.6 6.5 69%Doctorate 6 4 2 2 1 1 0 2 1 4 2.3 1.6 2.3 74%
TOTAL-Veterinary Medicine All 74 75 66 68 64 71 73 70 69 74 71.0 71.4 70.4 5%
INTDIV- Center for the Digital Globe GR CT 3 2 N/A N/A N/AConservation Biology GR CT (76) 0 0 2 2 0 1.3 0.8 N/AEuropean Union Studies GR CT (77) 0 0 1 1 2 1.3 0.8 N/AGenetics Area Program PHD 2 2 1 6 3 6 2 6 4 1 3.7 3.8 3.3 -70%Geographical Information Sc. GR CT (77) 0 0 12 2 4 6.0 3.6 N/ALaboratory Animal Medicine MS (55) 0 1 N/A N/A N/ANeuroscience MS (72) 0 0 0 0 1 2 0 1.0 0.6 N/A
PHD (72) 0 0 0 0 1 0 3 1.3 0.8 N/ANuclear Engineering GR CT 1 N/A N/A N/ANutrition Area Program MS 3 3 N/A N/A N/A
PHD 0 1 0 0 1 0 2 N/A N/A N/APathbiology Area Program (42) PHD 0 0 0 0 5 3 3 3 6 2 3.7 3.4 2.2 -9%Pathology Area Program (43) PHD 1 6 2 5 1 N/A N/A N/ASociety and Ecosystems GR CT (75) 0 0 1 0 1 1 0.7 0.6 N/A
A&S ID- Classics & Classical Arch PHD 0 0 0 0 0 0 1 N/A N/A N/A
H M&IN- Health Informatics MS (64) 0 0 3 2 4 5 12 10 7 9.7 7.6 N/A
NSEGIN- Nuclear Engineering MS 2 3 4 3.0 N/A N/A
PUB AF- Non-Profit Management GR CT (80) 0 2 3 1 2.0 N/A N/AOrganizational Change GR CT (80) 0 5 2 3 3.3 N/A N/APublic Administration (70) MPA 10 31 12 22 37 40 40 50 43.3 37.8 N/APublic Management GR CT (80) 0 0 0 4 1.3 N/A N/A
TOTAL-All Programs Grad. Certif. 0 0 1 22 14 18 18.0 11.0 N/AMasters 3 4 10 34 14 26 42 55 55 61 57.0 47.8 30.4 101%Doctorate 3 9 3 11 10 9 8 10 10 6 8.7 8.6 7.9 -24%
TOTAL-Graduate All 6 13 13 45 24 35 51 87 79 85 83.7 67.4 43.8 94%
GRADUATE SCHOOL

Change in FY07SCHOOL/COLLEGE FY FY FY FY FY FY FY FY FY FY Average relative to the DEPT PROGRAM DEGREE 1998 1999 2000 2001 2002 2003 2004 2005 2006 2007 3-Year 5-Year 10-Year 10-Year Avg.
Table 3.1. Degrees Awarded at the University Of Missouri - Columbia
ALL DEPTS-All Programs Bachelors 3,391 3,670 3,840 3,716 3,761 3,848 4,086 4,259 4,461 4,736 4,485.3 4,278.0 3,976.8 19%Grad. Certif. 36 93 69 79 84 68 77.0 78.6 N/AFirst Profes. 292 330 314 315 291 325 331 288 292 289 289.7 305.0 306.7 -6%Masters 848 893 905 1,004 991 1,209 1,222 1,195 1,314 1,350 1,286.3 1,258.0 1,093.1 24%Ed. Specialist 24 32 12 36 33 41 23 33 21 36 30.0 30.8 29.1 24%Doctorate 277 230 256 278 252 274 251 274 277 293 281.3 273.8 266.2 10%
TOTAL 4,832 5,155 5,327 5,349 5,364 5,790 5,982 6,128 6,449 6,772 6,449.7 6,224.2 5,714.8 18%
(1) Business Administration BSBA may be Interdepartment, Financial, Management, or Marketing.(2) Undergraduate Teacher Development subsumed several degree programs perviously in Curriculum & Instruction or independent. Changed to Teacher Development Program FY03.(3) Discontinued BA Italian 7/85.(4) Added 6/86(5) BS added 11/86(6) Changed from Speech & Dramatic Art 12/86.(7) BS added 1/88(8) Changed from Public Health/Health Service Mgmt. MS; moved from Health & Related Professions 6/88.(9) BS in Pest Managemnt, Animal Science, Dairy Science, and Poultry Science combined into Animal Sciences 8/88. MS & PHD Discontinued 7/91.(10) Changed from MA 8/88.(11) Changed from Child & Family Development 9/88.(12) Changed from Clothing & Textiles 3/89.(13) MA discontinued 3/89.(14) Changed from BSHE 3/89.(15) Changed from Food & Nutrition BSHE 3/89. Then changed from Human Nutrition & Foods 3/98. Then changed from Food Science & Human Nutrition 9/00.(16) Changed from Home Economics 3/89.(17) Changed from Home Economics Communication 3/89.(18) Changed from Home Economics Journalism 3/89.(19) Changed from Housing & Interior Design 3/89.(20) Poultry Science numbers combined with Animal Sciences 3/89.(21) Added 3/89(22) Changed from Recreation & Park Administration 7/89.(23) Discontinued 10/89(24) BS reactivated 2/90.(25) Added 2/90(26) Changed from Geology 2/90. Then changed from Geological Sciences 3/00.(27) Discontinued MS Sanitary Engineering 5/90.(28) Combined Latin American, Russian Area, and South Asian Studies 10/90. Includes Interdepartment and Interdivisional.
UNIVERSITY OF MISSOURI - COLUMBIA

Change in FY07SCHOOL/COLLEGE FY FY FY FY FY FY FY FY FY FY Average relative to the DEPT PROGRAM DEGREE 1998 1999 2000 2001 2002 2003 2004 2005 2006 2007 3-Year 5-Year 10-Year 10-Year Avg.
Table 3.1. Degrees Awarded at the University Of Missouri - Columbia
(29) Changed from Family & Consumer Economics 12/90.(30) Changed from Family Economics & Management 12/90.(31) Discontinued BA Library Science 12/90.(32) Changed from BSAG; moved from Agriculture, Food, & Natural Resources 7/91.(33) Discontinued MS Dairy Science, PHD Dairy Science, MS Biochemistry, and PHD Biochemistry 7/91.(34) Discontinued MST Economics and MST Physical Science 11/91.(35) Discontinued MS Extension Education 2/92.(36) Discontinued MS Community Development 7/92.(37) Discontinued MS Agricultural Sys. Mgmt., BS Rural Sociology, MA/MED Social & Phil. Foundation of Ed., BSHES Interdept. Studies Hum. Env. Sci., MA/MS Hum. Env. Sci. Comm., MS Anatomy, MA Linguistics 12/92.(38) Changed from Atmospheric Science 2/93.(39) Inactive PHD Anatomy and MS Genetics Area Program 2/93.(40) Discontinued BSHES Hum. Env. Sci. Journalism 2/93.(41) Added 3/93 as coop with UMKC and UMSL.(42) Changed from Microbiology Area Program; moved from Graduate School 4/93. Includes 1 PHD MIC from Grad. School FY94 and 2 from FY95.(43) Changed from Pathology Area Program; moved from Graduate School 6/93. FY94 PL PTH includes 4 PHD which came through Grad School and 2 from FY95.(44) Educational Administration and Higher & Adult Education Foundations departments combined FY94.(45) Vet. Microbiology and Vet. Pathology departments combined FY94. Combined with other Vet. Interdepartment programs FY02.(46) MS discontinued 10/93.(47) Change from Health & Physical Education 12/93. MAPE changed to MAES 7/94. Exercise & Sport Sciences MA, MAES, MED, PHD, EDD to remain in College of Education on Inactive status. Exercise Physiology MA, PHD moved to HES 7/95. Includes total history. (48) Combined Agronomy and Horticulture 5/94.(49) Discontinued 7/94(50) Changed from Speech Pathology & Audiology 1/85. Then changed from Communicative Disorders 4/95.(51) Changed from Agricultural Mechanization 9/95.(52) Inactive 9/95(53) Due to national placement dates and curriculum revision, the award date for degrees has been moved from May to December. Requirements for 38 degrees were completed in FY96 but will show as awarded in FY97.(54) Inactive 4/96(55) Combined Lab. Animal Medicine Area, Vet. Medicine & Surgery, Vet. Microbiology, Vet Pathology, Vet. Physiology & Pharmacology, and Vet. Anatomy into Biomedical Sciences 7/96.(56) Added as coop with UMR, CMSU, NWMSU, SEMO, and SMSU 12/96.(57) Added 2/97(58) Changed from Agricultural Engineering 3/97.(59) Changed from BSAGE 5/97.(60) Added 9/97; Library Science combining with new Info. Science & Learning Tech. program.(61) Added 9/97(62) Added 3/98(63) Changed from Health & Exercise Sciences 5/98; moved from Education to Human Environmental Sciences in FY00, FY01, FY02, & FY03.(64) Added 7/98(65) Changed from Physical Therapy 9/98.(66) Combined Education Administration, Educational Policy Studies (prior Social Philosophical Foundations), and Higher & Continuing Education (prior Higher &

Change in FY07SCHOOL/COLLEGE FY FY FY FY FY FY FY FY FY FY Average relative to the DEPT PROGRAM DEGREE 1998 1999 2000 2001 2002 2003 2004 2005 2006 2007 3-Year 5-Year 10-Year 10-Year Avg.
Table 3.1. Degrees Awarded at the University Of Missouri - Columbia
Adult Ed.-Adult & Continuing Ed.-Higher & Continuing Ed.) 9/98.(67) Moving from Arts & Science to Engineering in FY99, FY00, FY01, FY02, FY03, FY04, & FY05.(68) Changed from Communication Sciences 3/00.(69) Added 5/00(70) Moved from Business to Graduate School in FY00, FY01, FY02, FY03, FY04, & FY05.(71) Changed from Food Science and Human Nutrition in FY00.(72) Added 9/00(73) Changed from Physiology Area Program PHD 3/01. Prior to 90-91, these degrees were reported under Graduate School. MS discontinued 12/89.(74) Changed from Practical Arts and Vo-Tech. Education 3/01.(75) Added 9/01(76) Added 1/02(77) Added 5/02(78 ) Changed from Electrical Engineering 9/03.(79) Reactivated 10/03(80) Added 11/03(81) Discontinued 11/03(82) Moved from Computer Science in FY04.(83) Added 3/04(84) Changed from Environmental Design 5/04.(85) Added 9/04(86) Changed from Consumer & Family Economics 9/05.
IR&P/RS 8/07

Change in FY07SCHOOL/COLLEGE FY FY FY FY FY FY FY FY FY FY Average relative to the DEPT- PROGRAM DEGREE 1998 1999 2000 2001 2002 2003 2004 2005 2006 2007 3-Year 5-Year 10-Year 10-Year Avg.
INTDEP- American Studies (16) BA 2 2 7 4 4 2 2 4 3 2 3.0 2.6 3.2 -38%Art History & Archaeology BA 2 0 0 1 0 0 3 1.0 0.8 N/AEnvironmental Studies BA,BS 3 8 10 9 8 6 12 8.7 9.0 N/AInterdisciplinary Studies BA,BS 0 4 3 3 0 2 1 2 1 0 1.0 1.2 1.6 -100%Judaic Studies BA 0 0 0 0 1 0 0 2 0 1 1.0 0.6 0.4 150%Liberal Arts BLA (2) 134 181 198 220 246 238 276 286 239 223 249.3 252.4 224.1 0%Liberal Studies MA (22) 0 0 2 1 15 15 9 11 11 12 11.3 11.6 7.6 58%Mathematics BS 1 N/A N/A N/A
PHD 0 0 0 1 0 0 N/A N/A N/AUrban Affairs-Studies BA 1 5 0 0 0 4 1 4 6 4 4.7 3.8 2.5 60%
ART-AH- Art BA 1 6 5 3 7 4 2 1 4 3 2.7 2.8 3.6 -17%Art History BA 5 9 6 2 0 4 3 5 5 4 4.7 4.2 4.3 -7%
MA 9 3 3 2 2 0 0 2 3 4 3.0 1.8 2.8 43%Studio Art BA 12 19 12 20 22 25 37 29 27 33 29.7 30.2 23.6 40%
MA 8 6 3 6 3 2 3 2 3 4 3.0 2.8 4.0 0%
AUPD- Urban Planning and Design BA (29) 0 0 0 6 8 6 6.7 4.0 N/A
CHEM- Chemistry BA,BS 23 24 21 15 36 36 30 37 53 39 43.0 39.0 31.4 24%MS 3 1 0 3 1 1 2 1 1 2 1.3 1.4 1.5 33%
CMP SC- Computer Science (4) (26) BA,BS 38 34 55 30 0 N/A N/A N/AMS 44 31 44 37 1 N/A N/A N/A
Information Technology (26) BIT 3 0 N/A N/A N/A
COM S- Communication Studies BA 48 53 65 58 70 63 77 76 68 90 78.0 74.8 66.8 35%MA 10 7 9 4 7 4 0 1 1 1 1.0 1.4 4.4 -77%
ECONOM- Economics BA 31 26 19 16 14 23 25 27 24 15 22.0 22.8 22.0 -32%MA 11 5 2 10 12 9 6 19 11 8 12.7 10.6 9.3 -14%
ENGLSH- English BA 36 48 50 58 50 40 43 49 53 47 49.7 46.4 47.4 -1%MA 13 12 13 12 11 15 11 6 12 15 11.0 11.8 12.0 25%
Table 3.2. Degrees Awarded at the University Of Missouri - Kansas City
ARTS AND SCIENCES, COLLEGE OF

Change in FY07SCHOOL/COLLEGE FY FY FY FY FY FY FY FY FY FY Average relative to the DEPT- PROGRAM DEGREE 1998 1999 2000 2001 2002 2003 2004 2005 2006 2007 3-Year 5-Year 10-Year 10-Year Avg.
Table 3.2. Degrees Awarded at the University Of Missouri - Kansas City
FRN LG- French BA 2 5 3 6 2 1 0 6 4 4 4.7 3.0 3.3 21%German BA 3 2 2 3 0 2 2 2 0 2 1.3 1.6 1.8 11%Spanish BA 6 13 7 14 7 23 18 8 22 20 16.7 18.2 13.8 45%Romance Lang. & Lit. MA 4 7 5 6 4 4 4 3 10 6 6.3 5.4 5.3 13%
GEOSCI- Earth Sciences BA,BS 3 3 4 1 2 1 0 0 0 0 0.0 0.2 1.4 -100%Geography BA,BS 5 4 3 4 5 3 4 5 3 6 4.7 4.2 4.2 43%Geology BA,BS 2 4 2 3 5 1 5 6 0 0 2.0 2.4 2.8 -100%Urban Environmental Geology MS 2 2 1 2 0 1 0 3 3 3 3.0 2.0 1.7 76%
HIST- History BA 28 25 17 23 21 20 21 24 31 49 34.7 29.0 25.9 89%MA 12 12 7 11 13 6 9 7 7 4 6.0 6.6 8.8 -55%
MATH- Mathematics & Statistics (21) BA,BS 5 7 4 4 10 10 8 10 13 8 10.3 9.8 7.9 1%MA,MS 1 2 4 0 3 4 0 4 5 4 4.3 3.4 2.7 48%PHD 0 0 0 0 0 1 N/A N/A N/A
PHIL- Philosophy BA 6 6 4 4 9 4 4 13 16 17 15.3 10.8 8.3 105%
PHYSCS- Physics BA,BS 0 5 4 1 0 1 6 3 4 3 3.3 3.4 2.7 11%MS 5 4 1 3 1 1 2 3 5 3 3.7 2.8 2.8 7%
POL SC- Political Science BA 18 22 24 20 21 11 24 27 35 38 33.3 27.0 24.0 58%MA 8 6 6 3 1 3 5 4 7 1 4.0 4.0 4.4 -77%
PSYCH- Psychology BA 87 79 83 85 93 83 83 86 102 91 93.0 89.0 87.2 4%MA 6 9 2 2 4 3 4 4 6 4 4.7 4.2 4.4 -9%PHD 3 0 0 0 1 2 1 0 4 4 2.7 2.2 1.5 167%
SOC WK- Social Work MSW (25) 0 0 11 30 54 65 54 66 61 60.3 60.0 N/A
SOCIOL- Crim. Just. & Criminology (28) BA 27 49 27 30 34 29 31 25 41 33 33.0 31.8 32.6 1%MS 4 7 7 4 4 5 2 2 8 6 5.3 4.6 4.9 22%
Sociology BA 33 39 28 18 26 35 34 31 28 19 26.0 29.4 29.1 -35%MA 5 3 5 5 5 3 0 2 2 4 2.7 2.2 3.4 18%
THEAT- Theatre BA 8 2 10 6 10 9 8 13 9 6 9.3 9.0 8.1 -26%MA 1 0 2 3 1 0 6 3 3 2 2.7 2.8 2.1 -5%
Theatre: Acting & Directing MFA 7 7 8 8 8 9 8 7 7 4 6.0 7.0 7.3 -45%Theatre: Design & Technology MFA 11 17 14 14 9 13 9 12 18 13 14.3 13.0 13.0 0%

Change in FY07SCHOOL/COLLEGE FY FY FY FY FY FY FY FY FY FY Average relative to the DEPT- PROGRAM DEGREE 1998 1999 2000 2001 2002 2003 2004 2005 2006 2007 3-Year 5-Year 10-Year 10-Year Avg.
Table 3.2. Degrees Awarded at the University Of Missouri - Kansas City
TOTAL-All Programs Bachelors 564 676 663 660 703 684 755 795 805 778 792.7 763.4 708.3 10%Masters 164 141 138 147 135 152 145 150 189 161 166.7 159.4 152.2 6%Doctorate 3 0 0 1 1 3 1 0 4 4 2.7 2.4 1.7 135%
TOTAL-Arts & Sciences All 731 817 801 808 839 839 901 945 998 943 962.0 925.2 862.2 9%
BIO SCI- (9) (14) Cell & Molecular Biology (13) MS 3 3 2 1 5 4 1 6 4 6 5.3 4.2 3.5 71%PHD 3 0 0 0 N/A N/A N/A
Medical Technology BS 2 1 0 2 1 0 1 1 0 0 0.3 0.4 0.8 -100%
BIOL- (14) Biology BA,BS 140 148 81 72 59 56 48 56 64 74 64.7 59.6 79.8 -7%MA,MS 8 9 7 12 12 10 12 15 12 13 13.3 12.4 11.0 18%
TOTAL-All Programs Bachelors 142 149 81 74 60 56 49 57 64 74 65.0 60.0 80.6 -8%Masters 11 12 9 13 17 14 13 21 16 19 18.7 16.6 14.5 31%Doctorate 3 0 0 0 N/A N/A N/A
TOTAL-Biological Sciences All 156 161 90 87 77 70 62 78 80 93 83.7 76.6 95.4 -3%
B&PA- Accounting BS 44 56 52 42 32 30 32 30 46 37 37.7 35.0 40.1 -8%MS 58 37 26 29 21 29 33 31 38 38 35.7 33.8 34.0 12%
Business Administratrion BBA 79 90 87 106 130 93 115 150 143 157 150.0 131.6 115.0 37%MBA 140 169 149 180 156 160 164 138 115 139 130.7 143.2 151.0 -8%
Public Administration MPA 39 47 32 43 42 43 25 44 28 36 36.0 35.2 37.9 -5%
TOTAL -All Programs Bachelors 123 146 139 148 162 123 147 180 189 194 187.7 166.6 155.1 25%Masters 237 253 207 252 219 232 222 213 181 213 202.3 212.2 222.9 -4%
TOTAL-Business & Public Administration All 360 399 346 400 381 355 369 393 370 407 390.0 378.8 378.0 8%
BIOLOGICAL SCIENCES, SCHOOL OF
BUSINESS AND PUBLIC ADMINISTRATION, SCHOOL OF

Change in FY07SCHOOL/COLLEGE FY FY FY FY FY FY FY FY FY FY Average relative to the DEPT- PROGRAM DEGREE 1998 1999 2000 2001 2002 2003 2004 2005 2006 2007 3-Year 5-Year 10-Year 10-Year Avg.
Table 3.2. Degrees Awarded at the University Of Missouri - Kansas City
CMP SC- Computer Science (26) BA,BS 13 7 65 44 52 46 24 35 35.0 40.2 N/AMS 0 0 47 54 53 52 42 56 50.0 51.4 N/A
Information Technology (26) BIT 0 0 25 25 44 23 23 9 18.3 24.8 N/A
CV END- Civil Engineering BSCIE 14 8 11 12 18 13 14.3 12.4 N/AMS 2 3 7 7 5 9 7.0 6.2 N/A
ECE- Elect. & Computer Engineering BSEE, BS (32) 8 6 20 16 16 15 15.7 14.6 N/AMS 1 1 9 20 21 14 18.3 13.0 N/A
MC ENG- Mechanical Engineering BSME 15 13 19 12 12 17 13.7 14.6 N/AMS 1 1 5 6 7 10 7.7 5.8 N/A
TOTAL -All Programs Bachelors 13 7 127 96 146 109 93 89 97.0 106.6 N/AMasters 0 0 51 59 74 85 75 89 83.0 76.4 N/A
TOTAL-Computing & Engineering All 13 7 178 155 220 194 168 178 180.0 183.0 N/A
DENT- Advanced Ed. in Gen. Dnt. (3) GR CT 7 8 6 9 0 6 0 8 8 6 7.3 5.6 5.8 3%Dental Hygiene BSDH 25 22 29 29 30 30 28 24 28 31 27.7 28.2 27.6 12%Dental Hygiene Education MS 5 0 5 1 2 1 0 1 0 1 0.7 0.6 1.6 -38%Dentistry DDS 67 78 76 65 83 83 78 79 92 101 90.7 86.6 80.2 26%Diagnostic Sciences (15) GR CT 3 2 1 2 0 1 0 0 1 1 0.7 0.6 1.1 -9%Endodontics GR CT 0 0 0 0 0 0 0 0 2 3 1.7 1.0 0.5 500%Oral Biology MS 7 4 2 3 2 1 6 1 0 2 1.0 2.0 2.8 -29%Oral Medicine GR CT 1 1 0 0 0 0.0 0.4 N/AOral & Maxillofacial Surgery GR CT 2 1 1 2 0 2 0 1 4 0 1.7 1.4 1.3 -100%Ortho & Dentofacial Orthp.(17) GR CT 4 4 4 4 4 4 4 4 4 4 4.0 4.0 4.0 0%Pediatric Dentistry GR CT 2 2 2 2 0 2 1 2 2 2 2.0 1.8 1.7 18%Periodontics GR CT 2 3 2 0 2 3 2 2 2 3 2.3 2.4 2.1 43%Prosthodontics GR CT 1 3 2 0 2 2 1 0 0 0 0.0 0.6 1.1 -100%
DENTISTRY, SCHOOL OF
COMPUTING AND ENGINEERING, SCHOOL OF

Change in FY07SCHOOL/COLLEGE FY FY FY FY FY FY FY FY FY FY Average relative to the DEPT- PROGRAM DEGREE 1998 1999 2000 2001 2002 2003 2004 2005 2006 2007 3-Year 5-Year 10-Year 10-Year Avg.
Table 3.2. Degrees Awarded at the University Of Missouri - Kansas City
TOTAL-All Programs Bachelors 25 22 29 29 30 30 28 24 28 31 27.7 28.2 27.6 12%Grad. Certif. 21 23 18 19 8 21 9 17 23 19 19.7 17.8 17.8 7%First Profes. 67 78 76 65 83 83 78 79 92 101 90.7 86.6 80.2 26%Masters 12 4 7 4 4 2 6 2 0 3 1.7 2.6 4.4 -32%
TOTAL-Dentistry All 125 127 130 117 125 136 121 122 143 154 139.7 135.2 130.0 18%
EDUC- Counseling & Guidance MA 31 25 24 25 26 47 44 45 38 28 37.0 40.4 33.3 -16%EDSP 4 0 0 0 4 3 2 2 4 0 2.0 2.2 1.9 -100%
Curriculum & Instruction MA (1) 60 70 81 63 74 103 92 80 69 71 73.3 83.0 76.3 -7%EDSP 4 3 2 2 3 1 1 1 3 1 1.7 1.4 2.1 -52%PHD 0 0 1 1 N/A N/A N/A
Counseling Psychology PHD 4 3 5 11 6 5 9 5 4 4 4.3 5.4 5.6 -29%Early Childhood Education BA (30) 2 4 5 9 16 10.0 7.2 N/AEducation EDD (23) 0 0 0 2 4 4 2 0 1 1.0 2.2 N/AEducational Administration MA 44 40 42 51 48 79 42 37 35 27 33.0 44.0 44.5 -39%
EDSP 37 31 32 48 32 49 53 36 30 32 32.7 40.0 38.0 -16%PHD 5 2 0 0 N/A N/A N/A
Educational Research & Psych. MA 4 3 2 7 3 3 3 1 2 0 1.0 1.8 2.8 -100%Elementary Education BA 29 49 35 57 45 43 47 36 32 46 38.0 40.8 41.9 10%Middle Education BA (24) 4 3 5 9 1 7 11 11 7 9.7 7.4 N/AReading Education MA 15 15 19 10 11 11 18 13 20 8 13.7 14.0 14.0 -43%
EDSP 2 2 2 2 4 0 3 2 4 6 4.0 3.0 2.7 122%PHD 3 2 0 0 N/A N/A N/A
Secondary Education BA 34 29 27 26 25 27 53 49 48 55 50.7 46.4 37.3 47%Special Education MA 25 26 29 35 26 37 24 24 32 22 26.0 27.8 28.0 -21%
PHY ED- Physical Education BA (8) 7 3 2 3 10 10 8 6 7 0 4.3 6.2 5.6 -100%
TOTAL-All Programs Bachelors 70 85 67 91 89 83 119 107 107 124 112.7 108.0 94.2 32%Masters 179 179 197 191 188 280 223 200 196 156 184.0 211.0 198.9 -22%Ed. Specialist 47 36 36 52 43 53 59 41 41 39 40.3 46.6 44.7 -13%Doctorate 12 7 6 12 8 9 13 7 4 5 5.3 7.6 8.3 -40%
TOTAL-Education All 308 307 306 346 328 425 414 355 348 324 342.3 373.2 346.1 -6%
EDUCATION, SCHOOL OF

Change in FY07SCHOOL/COLLEGE FY FY FY FY FY FY FY FY FY FY Average relative to the DEPT- PROGRAM DEGREE 1998 1999 2000 2001 2002 2003 2004 2005 2006 2007 3-Year 5-Year 10-Year 10-Year Avg.
Table 3.2. Degrees Awarded at the University Of Missouri - Kansas City
INTDIV- Multi/Interdisciplinary Studies PHD 23 35 38 42 38 36 33 29 43 43 38.3 36.8 36.0 19%
TOTAL-Graduate Studies Doctorate 23 35 38 42 38 36 33 29 43 43 38.3 36.8 36.0 19%
LAW- Business & Entrepreneurial Law JD 7 N/A N/A N/ALaw (20) JD 131 166 131 146 116 132 159 138 156 176 156.7 152.2 145.1 21%
LLM 3 0 7 2 2 6 5 3 6 0 3.0 4.0 3.4 -100%Litigation Law JD 6 N/A N/A N/ATaxation LLM 22 20 12 7 16 22 17 12 15 18 15.0 16.8 16.1 12%Urban Affairs JD 2 N/A N/A N/A
LLM 0 0 0 0 0 1 0 0 0 1 0.3 0.4 0.2 400%
TOTAL-All Programs First Profes. 131 166 131 146 116 132 159 153 156 176 161.7 155.2 146.6 20%Masters 25 20 19 9 18 29 22 15 21 19 18.3 21.2 19.7 -4%
TOTAL-Law All 156 186 150 155 134 161 181 168 177 195 180.0 176.4 166.3 17%
MEDIC- Medicine MD 74 87 86 76 97 81 93 83 90 84 85.7 86.2 85.1 -1%
TOTAL-Medicine First Profes. 74 87 86 76 97 81 93 83 90 84 85.7 86.2 85.1 -1%
MUSIC- Conducting MM 8 4 6 4 5 1 0 3 0 3 2.0 1.4 3.4 -12%DMA 3 4 8 9 2 2 3 0 1 3 1.3 1.8 3.5 -14%
Dance BFA (7) 10 5 5 9 5 2 11 9 11 10 10.0 8.6 7.7 30%Music BA 6 7 0 13 10 7 10 11 8 9 9.3 9.0 8.1 11%
MA 3 8 2 6 5 6 8 10 7 17 11.3 9.6 7.2 136%Music Composition BM 1 0 4 3 2 3 0 2 7 1 3.3 2.6 2.3 -57%
MM 0 1 0 1 2 3 2 4 4 7 5.0 4.0 2.4 192%DMA 2 2 3 0 2 2 1 1 2 3 2.0 1.8 1.8 67%
MUSIC, CONSERVATORY OF
MEDICINE, SCHOOL OF
LAW, SCHOOL OF
GRADUATE STUDIES, SCHOOL OF

Change in FY07SCHOOL/COLLEGE FY FY FY FY FY FY FY FY FY FY Average relative to the DEPT- PROGRAM DEGREE 1998 1999 2000 2001 2002 2003 2004 2005 2006 2007 3-Year 5-Year 10-Year 10-Year Avg.
Table 3.2. Degrees Awarded at the University Of Missouri - Kansas City
Music Education BME 5 9 7 10 7 13 10 12 13 11 12.0 11.8 9.7 13%MME 3 3 6 5 6 3 6 3 6 5 4.7 4.6 4.6 9%DMA (10) 1 N/A N/A N/A
Music History & Literature MM 1 0 0 0 0 1 2 0 2 0 0.7 1.0 0.6 -100%Music Theory BM 0 0 7 1 2 1 1 0 0 2 0.7 0.8 1.4 43%
MM 0 1 2 0 0 0 0 0 1 1 0.7 0.4 0.5 100%Performance BM 12 11 11 16 7 23 20 21 18 19 19.3 20.2 15.8 20%
GR CT (31) 1 0 2 0 0 0.7 0.6 N/AMM 18 24 10 24 18 16 11 29 21 14 21.3 18.2 18.5 -24%DMA 5 13 7 11 5 8 13 8 6 8 7.3 8.6 8.4 -5%
TOTAL-All Programs Bachelors 34 32 34 52 33 49 52 55 57 52 54.7 53.0 45.0 16%Grad. Certif. 1 0 2 0 0 0.7 0.6 N/AMasters 33 41 26 40 36 30 29 49 41 47 45.7 39.2 37.2 26%Doctorate 11 19 18 20 9 12 17 9 9 14 10.7 12.2 13.8 1%
TOTAL-Music All 78 92 78 112 78 92 98 115 107 113 111.7 105.0 96.3 17%
NURSE- Nursing BSN 13 23 19 20 17 14 14 61 76 76 71.0 48.2 33.3 128%MSN (6) 77 68 66 55 67 69 58 58 69 59 62.0 62.6 64.6 -9%PHD (12) 1 2 0 1 3 2 1 3 1 5 3.0 2.4 1.9 163%
TOTAL-All Programs Bachelors 13 23 19 20 17 14 14 61 76 76 71.0 48.2 33.3 128%Masters 77 68 66 55 67 69 58 58 69 59 62.0 62.6 64.6 -9%Doctorate 1 2 0 1 3 2 1 3 1 5 3.0 2.4 1.9 163%
TOTAL-Nursing All 91 93 85 76 87 85 73 122 146 140 136.0 113.2 99.8 40%
PHARM- Pharmacy BS 30 5 0 0 N/A N/A N/APHARMD (18) 28 33 55 57 63 68 60 62 77 77 72.0 68.8 58.0 33%
Pharmaceutical Sciences BS (27) 0 0 6 5 6 10 7.0 5.4 N/AMS 0 1 5 1 6 10 3 1 3 3 2.3 4.0 3.3 -9%PHD 1 2 1 0 N/A N/A N/A
PHARMACY, SCHOOL OF
NURSING, SCHOOL OF

Change in FY07SCHOOL/COLLEGE FY FY FY FY FY FY FY FY FY FY Average relative to the DEPT- PROGRAM DEGREE 1998 1999 2000 2001 2002 2003 2004 2005 2006 2007 3-Year 5-Year 10-Year 10-Year Avg.
Table 3.2. Degrees Awarded at the University Of Missouri - Kansas City
TOTAL-All Programs Bachelors 30 5 0 0 0 0 6 5 6 10 7.0 5.4 6.2 61%First Profes. 28 33 55 57 63 68 60 62 77 77 72.0 68.8 58.0 33%Masters 0 1 5 1 6 10 3 1 3 3 2.3 4.0 3.3 -9%Doctorate 1 2 1 0 N/A N/A N/A
TOTAL-Pharmacy All 59 41 61 58 69 78 69 68 86 90 81.3 78.2 67.9 33%
ALL DEPTS-All Programs Bachelors 1,001 1,138 1,045 1,081 1,221 1,135 1,316 1,393 1,425 1,428 1,415.3 1,339.4 1,218.3 17%Grad. Certif. 21 23 18 19 8 22 9 19 23 19 20.3 18.4 18.1 5%First Profes. 300 364 348 344 359 364 390 377 415 438 410.0 396.8 369.9 18%Masters 738 719 674 712 741 877 795 794 791 769 784.7 805.2 761.0 1%Ed. Specialist 47 36 36 52 43 53 59 41 41 39 40.3 46.6 44.7 -13%Doctorate 54 65 63 76 59 62 65 48 61 71 60.0 61.4 62.4 14%
TOTAL 2,161 2,345 2,184 2,284 2,431 2,513 2,634 2,672 2,756 2,764 2,730.7 2,667.8 2,474.4 12%
(1) Combined Elementary Ed. and Secondary Ed. 8/87.(2) Changed from General Studies BGS 1/88.(3) Changed from General Practice 6/88.(4) Includes Business and Public Administration Computer Science through FY89.(5) Discontinued DMA Music History & Literature and DMA Music Theory 4/89.(6) Changed from MS 7/89.(7) Changed from BA 11/89.(8) Changed from Health & Physical Education BA and BS 9/90.(9) Changed from Basic Life Sciences 4/92.(10) Discontinued MA Social Psychology, PHD Counseling & Guidance, BA Speech & Hearing Science, LLM Int'l Public & Trade Law, LLM Trial Practice, Corp. & Criminal, and DMA Music Education 12/92. (11) Discontinued BA Art Education 2/93.(12) Added 3/93 as co-op with UMC and UMSL.(13) Changed from Microbiology 4/93.(14) Moved from Arts & Sciences to Biological Sciences in FY94.(15) Combined Oral Diag.-Oral Med. and Oral Radiology 3/93, changed to Diagnostic Sciences 10/93.(16) Changed from American Culture 10/94.(17) Changed from Orthodontics 12/95.(18) Changed from DPHARM 11/96.(19) Discontinued 3/97(20) Changed from Juris Doctor 3/97.
UNIVERSITY OF MISSOURI - KANSAS CITY

Change in FY07SCHOOL/COLLEGE FY FY FY FY FY FY FY FY FY FY Average relative to the DEPT- PROGRAM DEGREE 1998 1999 2000 2001 2002 2003 2004 2005 2006 2007 3-Year 5-Year 10-Year 10-Year Avg.
Table 3.2. Degrees Awarded at the University Of Missouri - Kansas City
(21) Changed from Mathematics 3/97.(22) Added 9/97(23) Added 3/98 as co-op with UMC and UMSL.(24) Added 3/98(25) Added 7/98 as co-op with UMC and UMSL.(26) Moved from Arts & Sciences to Computing & Engineering in FY00, FY01, & FY02.(27) Added 11/00(28) Changed from Administration of Justice 7/01; merged with Sociology Dept. in FY02.(29) Added 9/01(30) Added 6/02(31) Added 8/02(32) Changed from Electrical Engineering BSEE 11/03.
IR&P/RS 8/07
Change in FY07SCHOOL/COLLEGE FY FY FY FY FY FY FY FY FY FY Average relative to the DEPT- PROGRAM DEGREE 1998 1999 2000 2001 2002 2003 2004 2005 2006 2007 3-Year 5-Year 10-Year 10-Year Avg.
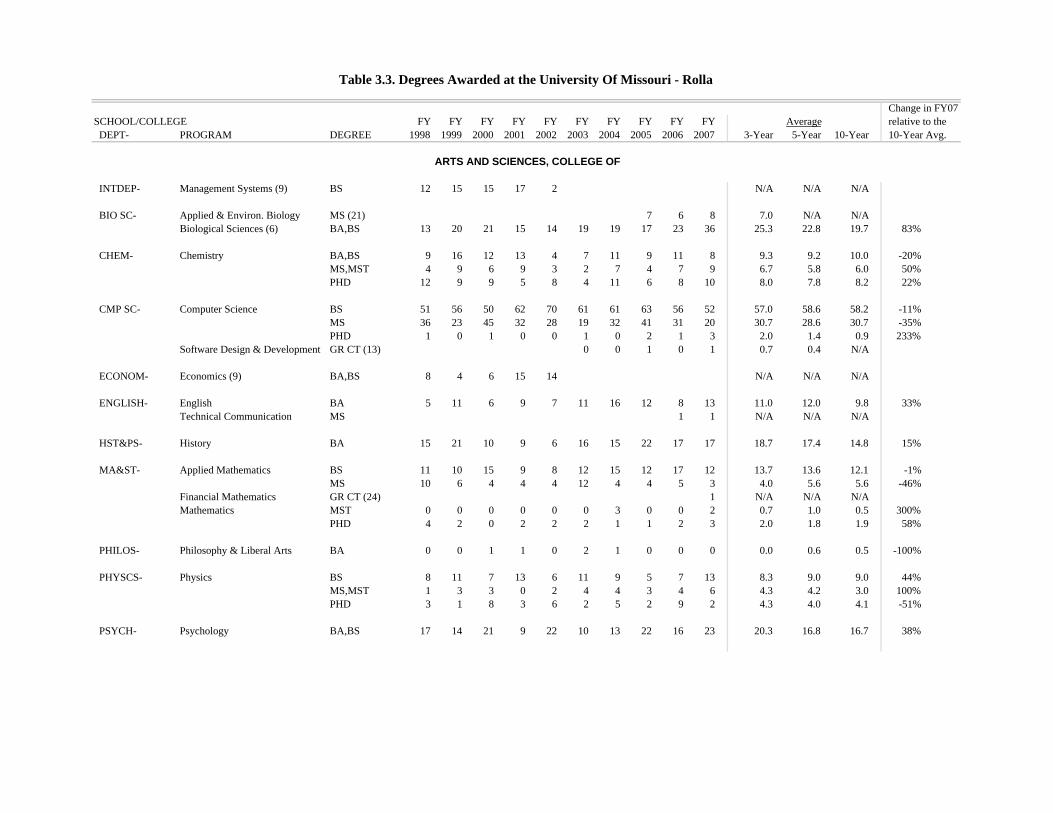
INTDEP- Management Systems (9) BS 12 15 15 17 2 N/A N/A N/A
BIO SC- Applied & Environ. Biology MS (21) 7 6 8 7.0 N/A N/ABiological Sciences (6) BA,BS 13 20 21 15 14 19 19 17 23 36 25.3 22.8 19.7 83%
CHEM- Chemistry BA,BS 9 16 12 13 4 7 11 9 11 8 9.3 9.2 10.0 -20%MS,MST 4 9 6 9 3 2 7 4 7 9 6.7 5.8 6.0 50%PHD 12 9 9 5 8 4 11 6 8 10 8.0 7.8 8.2 22%
CMP SC- Computer Science BS 51 56 50 62 70 61 61 63 56 52 57.0 58.6 58.2 -11%MS 36 23 45 32 28 19 32 41 31 20 30.7 28.6 30.7 -35%PHD 1 0 1 0 0 1 0 2 1 3 2.0 1.4 0.9 233%
Software Design & Development GR CT (13) 0 0 1 0 1 0.7 0.4 N/A
ECONOM- Economics (9) BA,BS 8 4 6 15 14 N/A N/A N/A
ENGLISH- English BA 5 11 6 9 7 11 16 12 8 13 11.0 12.0 9.8 33%Technical Communication MS 1 1 N/A N/A N/A
HST&PS- History BA 15 21 10 9 6 16 15 22 17 17 18.7 17.4 14.8 15%
MA&ST- Applied Mathematics BS 11 10 15 9 8 12 15 12 17 12 13.7 13.6 12.1 -1%MS 10 6 4 4 4 12 4 4 5 3 4.0 5.6 5.6 -46%
Financial Mathematics GR CT (24) 1 N/A N/A N/AMathematics MST 0 0 0 0 0 0 3 0 0 2 0.7 1.0 0.5 300%
PHD 4 2 0 2 2 2 1 1 2 3 2.0 1.8 1.9 58%
PHILOS- Philosophy & Liberal Arts BA 0 0 1 1 0 2 1 0 0 0 0.0 0.6 0.5 -100%
PHYSCS- Physics BS 8 11 7 13 6 11 9 5 7 13 8.3 9.0 9.0 44%MS,MST 1 3 3 0 2 4 4 3 4 6 4.3 4.2 3.0 100%PHD 3 1 8 3 6 2 5 2 9 2 4.3 4.0 4.1 -51%
PSYCH- Psychology BA,BS 17 14 21 9 22 10 13 22 16 23 20.3 16.8 16.7 38%
ARTS AND SCIENCES, COLLEGE OF
Table 3.3. Degrees Awarded at the University Of Missouri - Rolla

Change in FY07SCHOOL/COLLEGE FY FY FY FY FY FY FY FY FY FY Average relative to the DEPT- PROGRAM DEGREE 1998 1999 2000 2001 2002 2003 2004 2005 2006 2007 3-Year 5-Year 10-Year 10-Year Avg.
Table 3.3. Degrees Awarded at the University Of Missouri - Rolla
TOTAL-All Programs Bachelors 149 178 164 172 153 149 160 162 155 174 163.7 160.0 161.6 8%Grad. Certif. 0 0 1 0 2 1.0 0.6 N/AMasters 51 41 58 45 37 37 50 59 54 49 54.0 49.8 48.1 2%Doctorate 20 12 18 10 16 9 17 11 20 18 16.3 15.0 15.1 19%
TOTAL-Arts & Sciences All 220 231 240 227 206 195 227 233 229 243 235.0 225.4 225.1 8%
CH&BL- Chemical Engineering BS 83 62 52 57 70 43 35 34 31 32 32.3 35.0 49.9 -36%MS 12 4 10 10 6 13 10 6 10 6 7.3 9.0 8.7 -31%PHD,DE 0 3 1 3 1 5 0 1 4 2 2.3 2.4 2.0 0%
CVAREV- Architectural Engineering BS (10) 0 0 1 15 21 27 21.0 12.8 N/ACivil Engineering BS 112 101 72 67 84 78 71 71 78 81 76.7 75.8 81.5 -1%
MS 21 11 19 19 38 36 46 37 34 31 34.0 36.8 29.2 6%PHD,DE 5 4 1 4 3 7 9 7 9 8 8.0 8.0 5.7 40%
Contemporary Structural Eng. GR CT (16) 2 N/A N/A N/AEng. Mgmt. & Construction Eng. GR CT (15) 2 4 0 7 4 3.7 3.4 N/AEnvironmental Engineering (4) BS 2 3 N/A N/A N/A
MS 6 10 5 10 19 5 6 9 11 7 9.0 7.6 8.8 -20%Geoenvironmental Engineering GR CT (14) 0 0 0 1 0 0.3 0.2 N/AGeotech. Earthquake Engineering GR CT (14) 0 0 0 1 1 0.7 0.4 N/A
ECE- Computer Engineering BS (5) 0 10 22 33 40 56 46 39 49 44.7 46.0 N/AMS (5) 0 0 10 13 26 37 11 12 16 13.0 20.4 N/APHD (5) 0 0 0 0 0 1 3 1 4 2.7 1.8 N/A
Electrical Engineering BS 89 114 108 81 91 74 88 101 67 87 85.0 83.4 90.0 -3%MS 32 37 36 34 29 33 63 40 28 24 30.7 37.6 35.6 -33%PHD,DE 7 2 4 7 6 3 7 15 8 10 11.0 8.6 6.9 45%
ENGINEERING, SCHOOL OF

Change in FY07SCHOOL/COLLEGE FY FY FY FY FY FY FY FY FY FY Average relative to the DEPT- PROGRAM DEGREE 1998 1999 2000 2001 2002 2003 2004 2005 2006 2007 3-Year 5-Year 10-Year 10-Year Avg.
Table 3.3. Degrees Awarded at the University Of Missouri - Rolla
ENG MG- Engineering Management BS 35 52 48 52 46 54 70 46 47 45 46.0 52.4 49.5 -9%GR CT (26) 3 N/A N/A N/AMS 160 144 121 155 123 146 118 116 95 66 92.3 108.2 124.4 -47%PHD 13 8 5 2 4 7 7 6 4 5 5.0 5.8 6.1 -18%
Financial Engineering GR CT (27) 3 N/A N/A N/AMilitary Construction Mgmt. GR CT (12) 0 0 27 44 8 22 24.7 20.2 N/ANetwork Centric Systems GR CT 4 5 N/A N/A N/AProject Eng.&Construction Mgmt. GR CT (19) 1 0 N/A N/A N/AProject Management GR CT (20) 0 6 10 N/A N/A N/ASystems Engineering GR CT (12) 22 18 39 34 39 54 42.3 36.8 N/A
MS (8) 4 19 26 38 43 41 47 43.7 39.0 N/A
ENGR- CAD/CAM & Rapid Product Real. GR CT 1 N/A N/A N/AManufacturing Engineering MS,ME (7) 0 2 6 19 10 11 15 12.0 12.2 N/AManufacturing Systems GR CT (15) 0 0 2 1 6 3.0 1.8 N/A
M&A&EM- Aerospace Engineering BS 22 20 12 23 20 21 24 27 34 37 32.7 28.6 24.0 54%MS 2 1 2 1 2 4 6 7 5 9 7.0 6.2 3.9 131%PHD (2) 1 1 0 1 1 3 0 0 0 1 0.3 0.8 0.8 25%
Engineering Mechanics GR CT (22) 2 1 2 1.7 N/A N/AMS 8 2 3 3 1 2 2 1 0 1 0.7 1.2 2.3 -57%PHD 1 0 0 2 0 1 1 2 0 0 0.7 0.8 0.7 -100%
Mechanical Engineering BS 125 118 133 105 111 122 119 105 120 140 121.7 121.2 119.8 17%MS 23 20 28 32 34 30 36 30 31 33 31.3 32.0 29.7 11%PHD,DE 3 5 4 4 8 5 6 7 10 6 7.7 6.8 5.8 3%
TOTAL-All Programs Bachelors 466 467 435 407 455 432 464 445 439 501 461.7 456.2 451.1 11%Grad. Certif. 0 22 20 70 82 69 113 88.0 70.8 N/AMasters 264 229 224 278 286 327 381 310 278 255 281.0 310.2 283.2 -10%Doctorate 30 23 15 23 23 31 31 41 36 36 37.7 35.0 28.9 25%
TOTAL-Engineering All 760 719 674 708 786 810 946 878 822 905 868.3 872.2 800.8 13%

Change in FY07SCHOOL/COLLEGE FY FY FY FY FY FY FY FY FY FY Average relative to the DEPT- PROGRAM DEGREE 1998 1999 2000 2001 2002 2003 2004 2005 2006 2007 3-Year 5-Year 10-Year 10-Year Avg.
Table 3.3. Degrees Awarded at the University Of Missouri - Rolla
B&MS- Business & Mgmt. Sys. (9) (11) BS 20 35 28 38 37 24 33.0 32.4 N/AHuman Computer Interaction GR CT (18) 0 5 7 4.0 N/A N/A
ECN&FN- Economics (9) BS 17 12 8 11 8 9.0 11.2 N/A
IS&T- Enterprise Resource Planning GR CT 1 3 N/A N/A N/AInfo. Systems & Technology BS (10) 0 0 7 18 21 21 20.0 13.4 N/A
MS (10) 0 3 6 15 20 18 17.7 12.4 N/APsychology of Leadership GR CT (23) 2 N/A N/A N/A
TOTAL-All Programs Bachelors 20 52 47 64 69 53 62.0 57.0 N/AGrad. Certif. 0 6 12 6.0 N/A N/AMasters 0 3 6 15 20 18 17.7 12.4 N/A
TOTAL-Management & Info. Systems All 20 55 53 79 95 83 85.7 73.0 N/A
GS&ENG- Geological Engineering BS 40 36 46 22 28 21 11 6 12 8 8.7 11.6 23.0 -65%MS 3 6 8 7 5 15 14 15 3 4 7.3 10.2 8.0 -50%PHD,DE 2 2 1 0 1 0 3 2 0 0 0.7 1.0 1.1 -100%
Geology & Geophysics BS 10 16 17 15 12 19 7 12 16 14 14.0 13.6 13.8 1%MS 4 3 10 19 22 13 20 24 18 10 17.3 17.0 14.3 -30%PHD 0 1 2 1 0 4 3 1 2 0 1.0 2.0 1.4 -100%
Geotecnnics ME (17) 0 1 2 1.0 N/A N/APetroleum Engineering BS 11 15 7 6 5 7 4 2 7 9 6.0 5.8 7.3 23%
MS 2 0 1 1 1 0 5 3 3 1 2.3 2.4 1.7 -41%PHD,DE 0 1 1 1 0 0 0 0 1 0 0.3 0.2 0.4 -100%
MS&ENG- Ceramic Engineering BS 17 16 23 11 17 13 18 6 7 17 10.0 12.2 14.5 17%MS 4 7 6 7 7 9 7 6 2 2 3.3 5.2 5.7 -65%PHD,DE 1 1 2 4 2 3 2 5 1 5 3.7 3.2 2.6 92%
Materials Science & Engineering MS 2 6 N/A N/A N/APHD 3 1 N/A N/A N/A
Metallurgical Engineering BS 22 27 25 26 29 22 23 14 9 17 13.3 17.0 21.4 -21%MS 4 2 6 4 3 7 8 5 6 5 5.3 6.2 5.0 0%PHD,DE 6 4 3 2 1 2 3 5 6 1 4.0 3.4 3.3 -70%
MATERIALS, ENERGY, AND EARTH RESOURCES, SCHOOL OF
MANAGEMENT AND INFORMATION SYSTEMS, SCHOOL OF

Change in FY07SCHOOL/COLLEGE FY FY FY FY FY FY FY FY FY FY Average relative to the DEPT- PROGRAM DEGREE 1998 1999 2000 2001 2002 2003 2004 2005 2006 2007 3-Year 5-Year 10-Year 10-Year Avg.
Table 3.3. Degrees Awarded at the University Of Missouri - Rolla
M&N ENG- Explosives Engineering U CT (25) 1 N/A N/A N/AMining Engineering BS 21 17 18 18 17 19 14 7 14 18 13.0 14.4 16.3 10%
MS,ME 3 1 0 1 4 1 2 3 2 2 2.3 2.0 1.9 5%PHD,DE 0 0 2 1 1 0 2 1 5 2 2.7 2.0 1.4 43%
Nuclear Engineering BS 7 7 8 8 6 9 8 13 16 23 17.3 13.8 10.5 119%MS 3 2 4 4 1 2 9 0 3 2 1.7 3.2 3.0 -33%PHD,DE 2 0 2 0 1 2 0 0 0 0 0.0 0.4 0.7 -100%
TOTAL-All Programs U-Grad. Certif. 1 N/A N/A N/ABachelors 128 134 144 106 114 110 85 60 81 106 82.3 88.4 106.8 -1%Masters 23 21 35 43 43 47 65 56 40 34 43.3 48.4 40.7 -16%Doctorate 11 9 13 9 6 11 13 14 18 9 13.7 13.0 11.3 -20%
TOTAL-Materials, Energy, & Earth All 162 164 192 158 163 168 163 130 139 150 139.7 150.0 158.9 -6%
ALL DEPTS-All Programs U-Grad. Certif. 1 N/A N/A N/ABachelors 743 779 743 685 742 743 756 731 744 834 769.7 761.6 750.0 11%Grad. Certif. 0 22 20 70 83 75 127 95.0 75.0 N/AMasters 338 291 317 366 366 414 502 440 392 356 396.0 420.8 378.2 -6%Doctorate 61 44 46 42 45 51 61 66 74 63 67.7 63.0 55.3 14%
TOTAL 1,142 1,114 1,106 1,093 1,175 1,228 1,389 1,320 1,285 1,381 1,328.7 1,320.6 1,223.3 13%
(1) Discontinued BS Engineering Mechanics 10/88.(2) Added 9/90(3) Discontinued PDD Engineering Management and PDD Engineering Mechanics 12/92.(4) Changed from Environmental and Planning 6/93.(5) Added 5/98(6) Changed from Life Sciences 8/98.(7) Added 5/00(8) Added 8/00 as co-op with Univ. of Southern Calfifornia & Boeing.(9) Moved from Arts & Sciences to Management & Info. Systems in FY02 & FY03.(10) Added 9/01(11) Changed from Management Systems 5/02.(12) Added 3/02(13) Added 8/02(14) Added 9/02(15) Added 3/03(16) Added 9/03
UNIVERSITY OF MISSOURI - ROLLA

Change in FY07SCHOOL/COLLEGE FY FY FY FY FY FY FY FY FY FY Average relative to the DEPT- PROGRAM DEGREE 1998 1999 2000 2001 2002 2003 2004 2005 2006 2007 3-Year 5-Year 10-Year 10-Year Avg.
Table 3.3. Degrees Awarded at the University Of Missouri - Rolla
(17) Added 1/04(18) Added 3/04(19) Changed from Engineering Management and Construction Engineering and moving from Civil Engineering 8/04.(20) Added 8/04(21) Added 2/05(22) Added 4/05(23) Added 1/06(24) Added 4/06(25) Added 6/06(26) Added 9/06(27) Added 12/06
IR&P/RS 8/07

Change in FY07SCHOOL/COLLEGE FY FY FY FY FY FY FY FY FY FY Average relative to the DEPT- PROGRAM DEGREE 1998 1999 2000 2001 2002 2003 2004 2005 2006 2007 3-Year 5-Year 10-Year 10-Year Avg.
INTDEP- Interdisciplinary Studies (40) BIS (40) 6 N/A N/A N/ALiberal Studies BLS (37) 2 34 67 34.3 N/A N/A
ANTHRO- Anthropology BA 18 13 11 15 13 12 16 13 19 26 19.3 17.2 15.6 67%
ART-AH- Art History (30) BA 6 5 10 6 5 0 0 0 0 1 0.3 0.2 3.3 -70%Studio Art (30) BFA (15) 6 14 17 34 7 0 0 2 1 N/A N/A N/A
BIOL- Biochemistry & Biotechnology BS (36) 0 2 11 4.3 N/A N/AMS (36) 0 4 2 2.0 N/A N/A
Biology BA,BS 63 64 81 58 58 74 57 62 64 66 64.0 64.6 64.7 2%MS 28 17 17 16 17 22 15 29 20 28 25.7 22.8 20.9 34%PHD (4) 3 5 4 1 1 2 1 5 3 10 6.0 4.2 3.5 186%
Biotechnology GR CT (16) 9 7 5 2 2 5 3 6 7 7 6.7 5.6 5.3 32%Environmental Sciences PHD 3 1 0 5 N/A N/A N/APlant Sciences PHD 2 4 0 1 N/A N/A N/ATropical Biol. & Conserv. GR CT (15) 3 4 5 7 4 3 2 10 5 14 9.7 6.8 5.7 146%
CH&BIO- Chemistry BA,BS 13 18 16 15 19 23 9 13 18 14 15.0 15.4 15.8 -11%MS 7 15 9 11 9 11 6 14 11 8 11.0 10.0 10.1 -21%PHD 7 3 9 4 8 5 5 4 4 4 4.0 4.4 5.3 -25%
COMMUN- Communication (7) (30) BA 102 103 99 118 83 1 3 4 2 2 2.7 2.4 51.7 -96%MA (27) 0 0 2 1 3 2 1 2.0 1.8 N/A
CR JUS- Criminology & Crmnl. Just. (9) BS 84 85 101 113 105 104 123 127 133 107 122.3 118.8 108.2 -1%MA (3) 28 15 12 10 15 13 12 14 13 14 13.7 13.2 14.6 -4%PHD (16) 0 0 0 2 2 3 3 3 3 5 3.7 3.4 2.1 138%
ECONOM- Economics BA,BS 17 12 15 7 16 9 14 23 24 24 23.7 18.8 16.1 49%MA 8 7 8 4 14 6 7 13 11 7 10.3 8.8 8.5 -18%
ENGLISH- Creative Writing MFA (17) 4 8 6 8 5 11 7 10 6 14 10.0 9.6 N/AEnglish BA 52 52 32 45 54 51 47 45 47 49 47.0 47.8 47.4 3%
GR CT (33) 0 1 1 2 5 2.7 1.8 N/AMA 9 10 8 11 12 9 13 13 15 10 12.7 12.0 11.0 -9%
ARTS AND SCIENCES, COLLEGE OF
Table 3.4. Degrees Awarded at the University Of Missouri - St. Louis

Change in FY07SCHOOL/COLLEGE FY FY FY FY FY FY FY FY FY FY Average relative to the DEPT- PROGRAM DEGREE 1998 1999 2000 2001 2002 2003 2004 2005 2006 2007 3-Year 5-Year 10-Year 10-Year Avg.
Table 3.4. Degrees Awarded at the University Of Missouri - St. Louis
F L&L- French BA 2 5 7 7 5 7 7 6 3 10 6.3 6.6 5.9 69%German BA 2 0 1 2 1 5 7 4 1 3 2.7 4.0 2.6 15%Spanish BA 10 11 8 9 9 13 7 14 9 9 10.7 10.4 9.9 -9%
HIST- History BA 20 20 20 18 31 21 22 26 33 30 29.7 26.4 24.1 24%MA 6 3 10 17 11 21 19 15 20 23 19.3 19.6 14.5 59%
Museum Studies GR CT (26) 0 5 8 11 11 8 12 8 9.3 10.0 N/A
MTH CS- Applied Mathematics PHD (17) 0 0 0 0 0 0 0 0 2 2 1.3 0.8 0.4 400%Computer Science BS 24 19 29 35 40 55 51 47 34 24 35.0 42.2 35.8 -33%
MS 8 22 27 37 20 28 25 24.3 27.4 N/AMathematics BA,BS (35) 8 10 10 9 10 10 7 17 15 31 21.0 16.0 12.7 144%
MA 3 3 7 5 6 4 5 5 2 10 5.7 5.2 5.0 100%
MUSIC- Music (30) BA,BM 3 3 7 6 0 N/A N/A N/AMusic Education (30) BM 7 3 14 10 2 N/A N/A N/A
MME (14) 6 4 2 8 9 14 5 4 2 4 3.3 5.8 5.8 -31%
PHIL- Philosophy BA 8 5 8 7 5 11 9 6 12 6 8.0 8.8 7.7 -22%MA (27) 0 0 2 4 2 6 7 5.0 4.2 N/A
POL SC- Political Science BA 26 33 19 13 20 27 25 23 22 38 27.7 27.0 24.6 54%MA 6 7 3 4 7 2 9 6 5 2 4.3 4.8 5.1 -61%PHD (1) 4 7 4 3 2 3 1 3 5 2 3.3 2.8 3.4 -41%
Public Policy & Administration BSPPA 5 7 7 8 9 7 3 10 3 7 6.7 6.0 6.6 6%
PS AST- Physics BA,BS 3 4 7 7 11 5 11 2 9 4 5.0 6.2 6.3 -37%MS 5 3 4 5 4 0 3 0 5 4 3.0 2.4 3.3 21%PHD (5) 0 1 0 2 1 0 1 0 3 1 1.3 1.0 0.9 11%
PSYCH- Psychology BA 109 127 135 130 139 140 136 123 126 147 132.0 134.4 131.2 12%MA 10 7 9 12 13 14 9 14 11 14 13.0 12.4 11.3 24%PHD 11 6 11 4 7 7 6 12 10 6 9.3 8.2 8.0 -25%
Psych.-Clinical Respecial. GR CT (16) 0 0 0 0 0 0 1 0 0 0 0.0 0.2 0.1 -100%
SOC WK- Social Work BSW 64 78 53 62 66 36 64 46 45 54 48.3 49.0 56.8 -5%MSW (25) 0 1 14 28 26 31 43 36 33 37.3 33.8 N/A
SOCIOL- Sociology BA,BS 19 20 15 13 16 21 26 25 18 23 22.0 22.6 19.6 17%MA 3 3 4 6 5 3 5 3 4 5 4.0 4.0 4.1 22%

Change in FY07SCHOOL/COLLEGE FY FY FY FY FY FY FY FY FY FY Average relative to the DEPT- PROGRAM DEGREE 1998 1999 2000 2001 2002 2003 2004 2005 2006 2007 3-Year 5-Year 10-Year 10-Year Avg.
Table 3.4. Degrees Awarded at the University Of Missouri - St. Louis
TOTAL-All Programs Bachelors 671 711 722 747 724 632 644 640 674 759 691.0 669.8 692.4 10%Grad. Certif. 12 11 10 14 14 19 18 25 26 34 28.3 24.4 18.3 86%Masters 123 102 100 139 177 187 188 208 201 211 206.7 199.0 163.6 29%Doctorate 25 22 28 21 26 20 23 27 30 30 29.0 26.0 25.2 19%
TOTAL-Arts and Sciences All 831 846 860 921 941 858 873 900 931 1,034 955.0 919.2 899.5 15%
BUS AD- Accounting BSAcc (18) 99 132 81 79 83 94 110 103 102 133 112.7 108.4 101.6 31%MAcc 8 6 4 2 13 11 14 10 9 17 12.0 12.2 9.4 81%
Business Administration BSBA 304 283 298 328 324 371 392 378 383 405 388.7 385.8 346.6 17%MBA 52 54 62 64 77 87 80 116 111 135 120.7 105.8 83.8 61%PHD (31) 0 0 0 0 0 1 0.3 0.2 N/A
Information Systems (41) BSIS,BSMIS(24) 35 91 92 140 101 110 51 57 41 49.7 72.0 N/AMS 8 32 25 34 37 37 23 19 13 11 14.3 20.6 23.9 -54%
Grad. Certificate Programs (29) GR CT (16) 2 3 17 23 30 46 17 21 16 16 17.7 23.2 19.1 -16%
TOTAL-All Programs Bachelors 403 450 470 499 547 566 612 532 542 579 551.0 566.2 520.0 11%Grad. Certif. 2 3 17 23 30 46 17 21 16 16 17.7 23.2 19.1 -16%Masters 68 92 91 100 127 135 117 145 133 163 147.0 138.6 117.1 39%Doctorate 0 0 0 0 0 1 0.3 0.2
TOTAL-Business Administration All 473 545 578 622 704 747 746 698 691 759 716.0 728.2 656.3 16%
INTDEP- (28) Education EDD,PHD (22) 9 6 6 8 13 20 15 21 24 18 21.0 19.6 14.0 29%
CNSL- (28) Counseling MED 96 96 60 74 58 48 40 55 52 53 53.3 49.6 63.2 -16%
ED LD- (28) Adult & Higher Education MED 5 16 22 14.3 N/A N/AEducational Administration MED 75 60 66 44 42 46 64 48 44 53 48.3 51.0 54.2 -2%
EDSP 3 27 29 19.7 N/A N/AInstitutional Research GR CT (34) 5 6 9 1 5.3 N/A N/A
ED PSY- School Psychology GR CT (34) 0 0 2 7 3.0 N/A N/AEDSP 2 2 N/A N/A N/A
EDUCATION, COLLEGE OF
BUSINESS ADMINISTRATION, COLLEGE OF

Change in FY07SCHOOL/COLLEGE FY FY FY FY FY FY FY FY FY FY Average relative to the DEPT- PROGRAM DEGREE 1998 1999 2000 2001 2002 2003 2004 2005 2006 2007 3-Year 5-Year 10-Year 10-Year Avg.
Table 3.4. Degrees Awarded at the University Of Missouri - St. Louis
TCH LR- (28) Early Childhood Education BSED 26 32 32 31 32 29 36 35 31 30 32.0 32.2 31.4 -4%Educational Studies BES (32) 0 1 2 6 2 3.3 2.2 N/AElementary Education BSED 148 117 144 168 162 149 174 162 136 151 149.7 154.4 151.1 0%
MED 56 49 46 55 68 51 46 116 77 49 80.7 67.8 61.3 -20%Physical Education BSED 17 20 12 18 18 21 20 26 30 20 25.3 23.4 20.2 -1%Secondary Education BSED 56 75 46 45 51 37 39 31 29 38 32.7 34.8 44.7 -15%
MED 43 50 38 46 36 36 55 50 58 38 48.7 47.4 45.0 -16%Special Education BSED 89 65 55 60 43 35 19 20 15 19 18.0 21.6 42.0 -55%
MED 28 34 26 26 23 58 62 59 55 37 50.3 54.2 40.8 -9%
TOTAL-All Programs Bachelors 336 309 289 322 306 271 289 276 247 260 261.0 268.6 290.5 -10%Grad. Certif. 5 6 11 8 8.3 N/A N/AMasters 298 289 236 245 227 239 267 333 302 252 295.7 278.6 268.8 -6%Ed. Specialist 3 29 31 21.0 N/A N/ADoctorate 9 6 6 8 13 20 15 21 24 18 21.0 19.6 14.0 29%
TOTAL-Education All 643 604 531 575 546 530 576 639 613 569 607.0 585.4 582.6 -2%
ART-AH- Art History (30) BA 5 16 8 13 10 14 12.3 12.2 N/AStudio Art (30) BFA 39 36 41 49 54 38 47.0 43.6 N/A
COMMUN- Communication (30) BA 56 135 120 144 139 139 140.7 135.4 N/AMA 1 4 13 13 10.0 N/A N/A
MUSIC- Music (30) BA,BM 1 8 2 4 7 8 6.3 5.8 N/AMusic Education (30) BM 1 10 3 9 9 6 8.0 7.4 N/A
MME 3 3 6 4.0 N/A N/A
TDMS- Theater and Dance (38) BA 5 N/A N/A N/A
TOTAL-All Programs Bachelors 102 205 174 219 219 210 216.0 205.4 N/AMasters 1 7 16 19 14.0 N/A N/A
TOTAL-Fine Arts & Communication All 102 205 175 226 235 229 230.0 214.0 N/A
FINE ARTS AND COMMUNICATION, COLLEGE OF

Change in FY07SCHOOL/COLLEGE FY FY FY FY FY FY FY FY FY FY Average relative to the DEPT- PROGRAM DEGREE 1998 1999 2000 2001 2002 2003 2004 2005 2006 2007 3-Year 5-Year 10-Year 10-Year Avg.
Table 3.4. Degrees Awarded at the University Of Missouri - St. Louis
NURSE- (12) Health Sciences BHS (20) 3 5 5 4 4 2 1 0 1 0.7 1.6 N/ANursing BSN 144 140 112 89 106 111 121 151 160 162 157.7 141.0 129.6 25% MSN (6) 46 94 66 30 88 34 64 60 46 48 51.3 50.4 57.6 -17%
PHD (11) 0 2 4 4 5 4 1 1 4 2 2.3 2.4 2.7 -26%
TOTAL-All Programs Bachelors 144 143 117 94 110 115 123 152 160 163 158.3 142.6 132.1 23%Masters 46 94 66 30 88 34 64 60 46 48 51.3 50.4 57.6 -17%Doctorate 0 2 4 4 5 4 1 1 4 2 2.3 2.4 2.7 -26%
TOTAL-Nursing All 190 239 187 128 203 153 188 213 210 213 212.0 195.4 192.4 11%
OPTOM- Optometry OD 38 43 44 45 42 39 35 46 34 44 41.3 39.6 41.0 7%Physiological Optics MS (8) 0 0 0 0 0 2 1 0 0 0 0.0 0.6 0.3 -100%
PHD (8) 0 0 0 0 1 1 1 2 0 1 1.0 1.0 0.6 67%
TOTAL-All Programs First Profes. 38 43 44 45 42 39 35 46 34 44 41.3 39.6 41.0 7%Masters 0 0 0 0 0 2 1 0 0 0 0.0 0.6 0.3 -100%Doctorate 0 0 0 0 1 1 1 2 0 1 1.0 1.0 0.6 67%
TOTAL-Optometry All 38 43 44 45 43 42 37 48 34 45 42.3 41.2 41.9 7%
W/SJEP Civil Engineering BSCIE (13) 2 6 5 12 2 9 8 12 5 10 9.0 8.8 7.1 41%Electrical Engineering BSEE (10) 11 6 7 13 17 7 21 21 23 20 21.3 18.4 14.6 37%Mechanical Engineering BSME (10) 1 5 5 8 10 10 13 9 5 18 10.7 11.0 8.4 114%
TOTAL-Engineering Program Bachelors 14 17 17 33 29 26 42 42 33 48 41.0 38.2 30.1 59%
EVE CO- (39) General Studies BGS 95 77 80 82 69 38 48 41 N/A N/A N/A
TOTAL-Evening Bachelors 95 77 80 82 69 38 48 41 N/A N/A N/A
OPTOMETRY, COLLEGE OF
NURSING, COLLEGE OF
ENGINEERING PROGRAM
EVENING COLLEGE

Change in FY07SCHOOL/COLLEGE FY FY FY FY FY FY FY FY FY FY Average relative to the DEPT- PROGRAM DEGREE 1998 1999 2000 2001 2002 2003 2004 2005 2006 2007 3-Year 5-Year 10-Year 10-Year Avg.
Table 3.4. Degrees Awarded at the University Of Missouri - St. Louis
INTRA- International Studies GR CT (16) 0 1 1 1 1 2 1 1 0 0 0.3 0.8 0.8 -100%Women's & Gender Studies (21) GR CT (16) 0 1 6 5 3 1 1 0 0 2 0.7 0.8 1.9 5%
EVE CO- (39) General Studies BGS 30 20 N/A N/A N/A
GR GER- Gerontology GR CT (16) 5 1 3 3 0 8 2 8 9 6 7.7 6.6 4.5 33%MS (2) 1 3 1 8 1 5 6 4 4 7 5.0 5.2 4.0 75%
Long Term Care Administration GR CT 1 N/A N/A N/A
GR PPA- Nonprofit Org. Mgmt. & Leader. GR CT (19) 1 4 4 10 16 11 10 15 15 12 14.0 12.6 9.8 22%Public Policy Administration MPPA (23) 7 10 13 23 17 20 31 29 28 18 25.0 25.2 19.6 -8%
TOTAL-All Programs Bachelors 30 20 N/A N/A N/AGrad. Certif. 6 7 14 19 20 22 14 24 24 21 23.0 21.0 17.1 23%Masters 8 13 14 31 18 25 37 33 32 25 30.0 30.4 23.6 6%
TOTAL-Graduate All 14 20 28 50 38 47 51 57 86 66 69.7 61.4 45.7 44%
ALL DEPTS-All Programs Bachelors 1,663 1,707 1,695 1,777 1,887 1,853 1,932 1,902 1,905 2,039 1,948.7 1,926.2 1,836.0 11%Grad. Certif. 20 21 41 56 64 87 54 76 77 79 77.3 74.6 57.5 37%
First Profes. 38 43 44 45 42 39 35 46 34 44 41.3 39.6 41.0 7%Masters 543 590 507 545 637 622 675 786 730 718 744.7 706.2 635.3 13%Ed. Specialist 3 29 31 21.0 N/A N/ADoctorate 34 30 38 33 45 45 40 51 58 52 53.7 49.2 42.6 22%
TOTAL 2,298 2,391 2,325 2,456 2,675 2,646 2,736 2,864 2,833 2,963 2,886.7 2,808.4 2,618.7 13%
(1) Added 4/86(2) Added 3/87(3) Added 4/88(4) Added 6/88(5) Added 6/88 as co-op with UMR.(6) Added 2/89 as co-op with UMKC.(7) Changed from Speech Communication 8/89.(8) Added 9/90(9) Changed from Administrative Justice 12/91.(10) Added 1/93 as co-.op with Washington Univ.
UNIVERSITY OF MISSOURI - ST. LOUIS
GRADUATE SCHOOL

Change in FY07SCHOOL/COLLEGE FY FY FY FY FY FY FY FY FY FY Average relative to the DEPT- PROGRAM DEGREE 1998 1999 2000 2001 2002 2003 2004 2005 2006 2007 3-Year 5-Year 10-Year 10-Year Avg.
Table 3.4. Degrees Awarded at the University Of Missouri - St. Louis
(11) Added 3/93 as co-op with UMC and UMKC.(12) Barnes College of Nursing and School of Nursing merged 6/94.(13) Added 7/94 as co-op with Washington Univ.(14) Added 1/95(15) Added 6/95(16) Added 12/95(17) Added 3/97(18) Added 5/97(19) Added 9/97(20) Added 1/98(21) Changed from Women's Studies 3/98.(22) Added PHD 3/98.(23) Changed from BSPA Public Administration 3/98.(24) Added 6/98(25) Added 7/98 as coop with UMC and UMKC.(26) Added 9/99(27) Added 10/99(28) Extensive reorganization affected placement of degrees to a small extent in FY99 and fully in FY00. See earlier reports for previous structures.(29) In FY00, all graduate certificate programs were combined for reporting purposes. Prior individually reported certificate programs were likewise combined.(30) Moving from Arts & Sciences to Fine Arts & Communication in FY02, FY03, FY04, FY05, FY06, & FY07.(31) Added 3/01(32) Added 10/01(33) Added 9/02(34) Added 3/03(35) Changed from BS Applied Mathematics 7/03.(36) Added 1/04(37) Added 9/04(38) Added 9/05(39) Administered under the Graduate School FY06.(40) Changed from BGS General Studies to BIS Interdisciplinary Studies 1/06.(41) Changed from Management Information Systems 8/06.
IR&P/RS 8/07