appendix - philipstown
TRANSCRIPT

APPENDIX M
Preliminary SWPPP, prepared by Badey & Watson,
last dated March 9, 2019
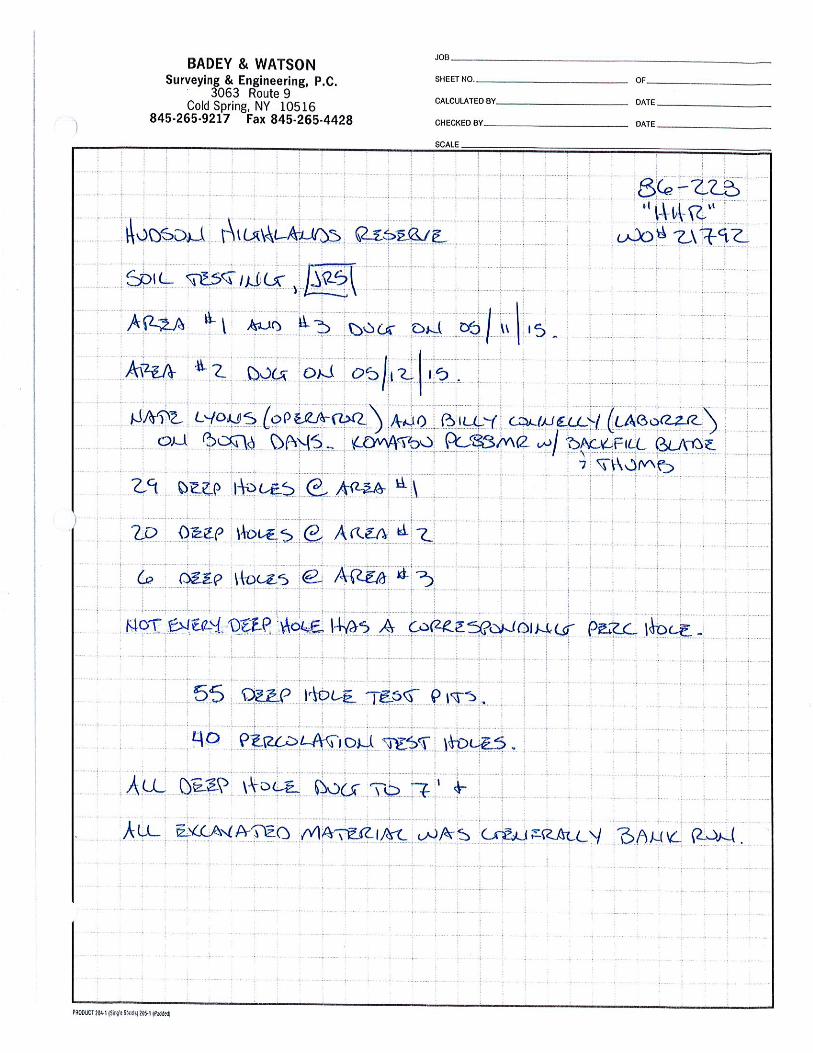
Soil Test Results, Badey & Watson,
May 11 and 12, 2015


HUDSON HIGHLANDS RESERVE
Route 9
Town of Philipstown
Putnam County, New York
Preliminary Stormwater Pollution Prevention Plan
March 9, 2018
Applicant:
Horton Road, LLC.
516 East 89th Street
New York, NY 10128
Contact: Mr Ulises Liceaga
(212) 722-0170
Prepared by:
Badey and Watson
Surveying and Engineering, LLC.
3063 Route 9
Cold Spring, NY 10516
(845) 265-9217
Mr. Edward Vergano, P.E., NYPE #72965 ATT 4.01


HHR Preliminary SWPPP 2 March 9, 2018
TABLE OF CONTENTS
XI. Contents
I. PROJECT DESCRIPTION ...................................................................................................................... 3
II. SCOPE OF THE PRELIMINARY SWPPP REPORT .......................................................................... 4
III. METHODOLOGY FOR EVALUATING PRE AND POST DEVELOPMENT RUNOFF ......... 5
IV. NYSDEC STORMWATER MANAGEMENT GUIDELINES ........................................................... 5
V. PRELIMINARY ESTIMATE QUALITY AND QUANTITY VOLUME CALCULATIONS ........ 6
VI. POTENTIAL SOURCES OF POLLUTION ........................................................................................ 7
VII. EROSION AND SEDIMENT CONTROL .......................................................................................... 7
VIII. CONSTRUCTION SEQUENCING ..................................................................................................... 8
IX. FINAL STABILIZATION ..................................................................................................................... 10
X. GOOD HOUSEKEEPING BEST MANAGEMENT PRACTICES (BMP’S) DURING
CONSTRUCTION ............................................................................................................................... 11
XI. CONCLUSIONS ................................................................................................................................... 15
Appendices: 1. Boring Report 2. Calculation Sheets

HHR Preliminary SWPPP 3 March 9, 2018
This report is the Preliminary Stormwater Pollution Prevention Plan (SWPPP) for the Hudson
Highlands Reserve project located in the Town of Philipstown, Putnam County, New York.
I. PROJECT DESCRIPTION
The subject property consists of approximately 210 acres and is identified as Section 17, Block 1,
Lots 39, 48, 76.111, 76.112, 76.21, and 77.2. on the Putnam County tax maps for the Town of
Philipstown. The project site is currently located in the M, HC and RR Zones. A significant
portion of the property is also located in the Open Space Overlay Zone. The property contains
some existing improvements, including a residential building, an entrance road and parking areas.
However, the property is substantially undeveloped and consists of mostly wooded areas, some
open fields and a 5.8-acre pond.
The site is adjacent to U. S. Highway Route 9 to the northwest, East Mountain North Road to
the north, Horton Road to the south and East Mountain Road South to the southeast.
The applicant proposes to construct 25 single family residential homes, each containing
approximately 1 acre, in 4 isolated areas of the property and an equestrian center with stables
near the center of the property.
The intention of the applicant is to create an attractive conservation development characterized
by a streetscape design and landscaping that compliments the existing environment, look and feel
of the community.
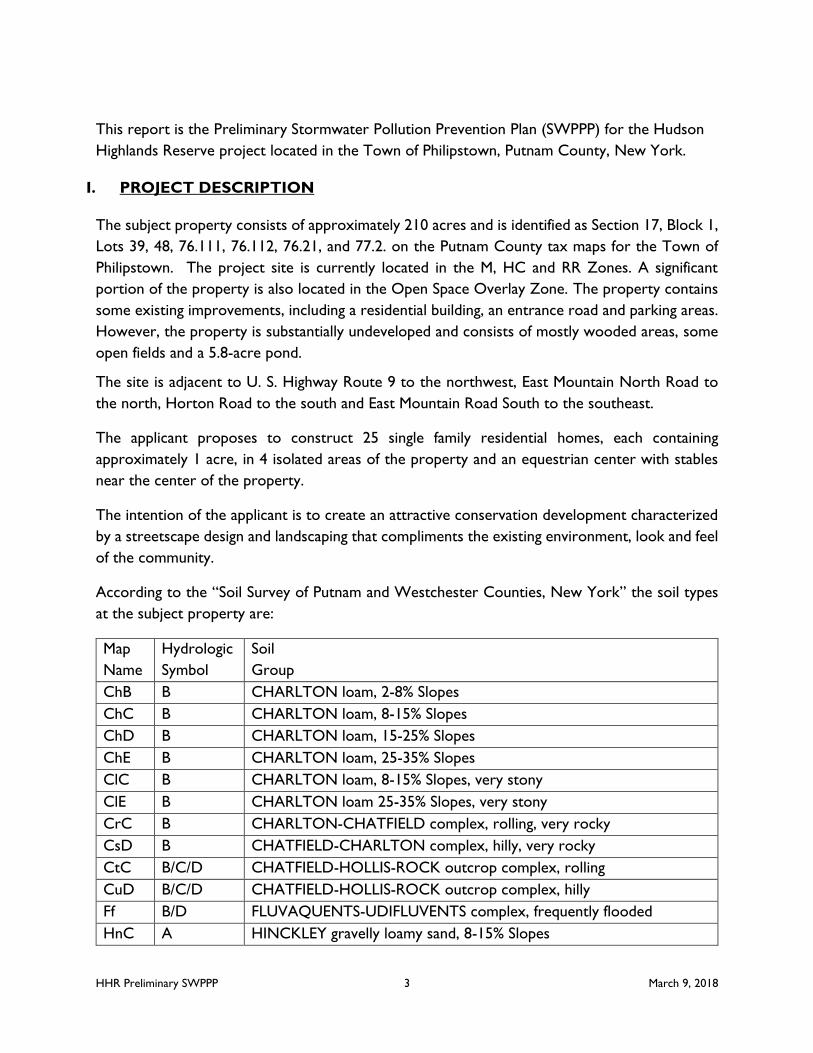
According to the “Soil Survey of Putnam and Westchester Counties, New York” the soil types
at the subject property are:
Map
Name
Hydrologic
Symbol
Soil
Group
ChB B CHARLTON loam, 2-8% Slopes
ChC B CHARLTON loam, 8-15% Slopes
ChD B CHARLTON loam, 15-25% Slopes
ChE B CHARLTON loam, 25-35% Slopes
ClC B CHARLTON loam, 8-15% Slopes, very stony
ClE B CHARLTON loam 25-35% Slopes, very stony
CrC B CHARLTON-CHATFIELD complex, rolling, very rocky
CsD B CHATFIELD-CHARLTON complex, hilly, very rocky
CtC B/C/D CHATFIELD-HOLLIS-ROCK outcrop complex, rolling
CuD B/C/D CHATFIELD-HOLLIS-ROCK outcrop complex, hilly
Ff B/D FLUVAQUENTS-UDIFLUVENTS complex, frequently flooded
HnC A HINCKLEY gravelly loamy sand, 8-15% Slopes

HHR Preliminary SWPPP 4 March 9, 2018
HrF C/D HOLLIS-ROCK outcrop complex, very steep
LeB C LEICESTER loam, 2-8% Slopes, very stony
RhA B RIVERHEAD loam, 0-3% Slopes
RhB B RIVERHEAD loam, 3-8% Slopes
RhC B RIVERHEAD loam, 8-15% Slopes
RhE B RIVERHEAD loam, 25-50% Slopes
SuB B SUTTON loam, 3-8% Slopes W – WATER
To corroborate the information in the Soil Survey, a series of test pits were performed at this
site to evaluate the subsurface soil, rock, and groundwater conditions for the proposed
development.
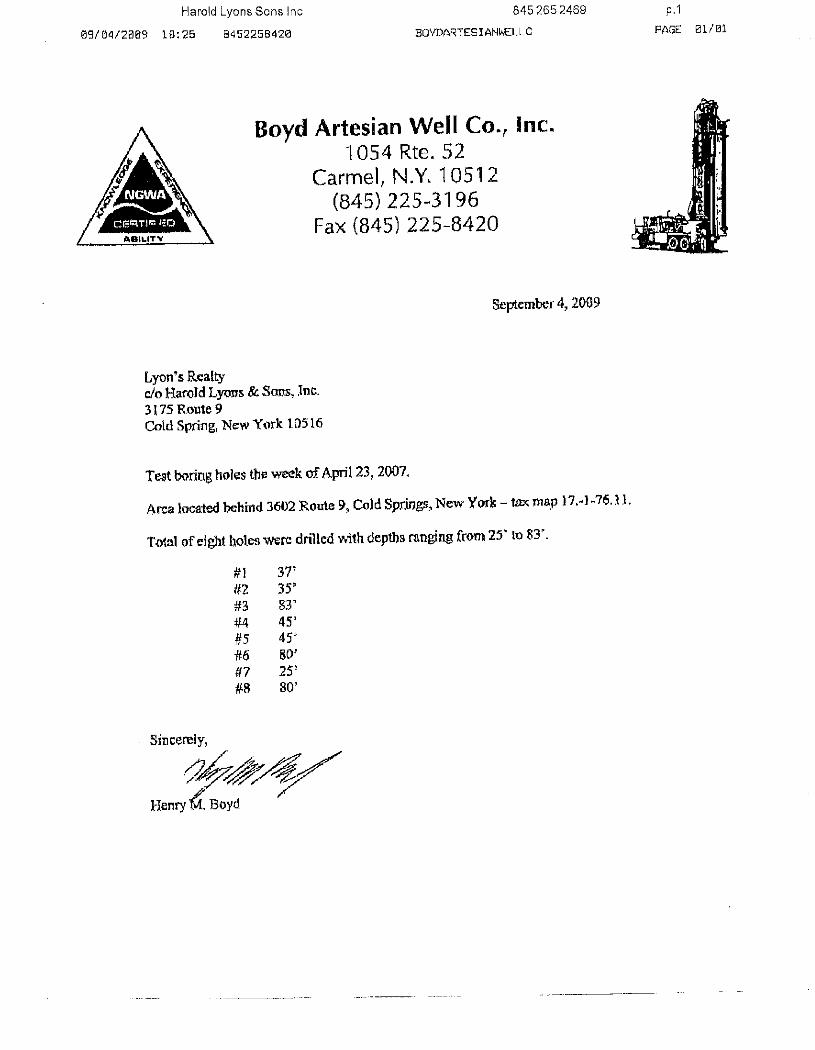
Eight soil borings were conducted by Boyd Artesian Well Company, Inc.. of Carmel, NY in April
2007 for a soil mine that had been proposed by the previous owner. Soil depths ranged from 25
to 83 feet. The depths of individual borings terminated when either bedrock or large boulders
were encountered. The locations of the individual borings are plotted on the map attached to
this report. The boring report is located in Appendix 1 of this report.
II. SCOPE OF THE PRELIMINARY SWPPP REPORT
The purpose of the preliminary SWPPP is to examine the potential impacts that the proposed
development may have on the local watershed and to set forth measures deemed necessary to
mitigate impacts. This study will contain an analysis of the existing drainage conditions within the
site's watershed and will describe the proposed drainage conditions after development of the
project.
The site is within the Hudson River drainage basin. The majority of the site discharges to Ulmar
Pond which in turn discharges to Clove Creek. The other portions of the site either discharge
directly to Clove Creek or to existing infrastructure in Route 9 that ultimately discharges to
Clove Creek. Clove Creek runs north west and meets Fishkill Creek before discharging to the
Hudson River.
A fully developed Stormwater Pollution Prevention Plan (SWPPP) will be submitted to the Town
of Philipstown for review and approval. The SWPPP will detail water quality and quantity controls
in accordance with the requirements of the NYSDEC SPDES General Permit No. GP-0-15-002
for Stormwater Discharges from Construction Activity. The Stormwater Pollution Prevention
Plan will include stormwater management practices from the "New York State Stormwater
Management Design Manual" dated January 2015.

HHR Preliminary SWPPP 5 March 9, 2018
III. METHODOLOGY FOR EVALUATING PRE AND POST DEVELOPMENT
RUNOFF
The “HydroCAD Stormwater Modeling System”, which is based on the widely accepted TR-20
method of storm water modeling developed by the USDA Soil Conservation Service, will be used
to evaluate the 1 ,10, and 100-year, 24-hour storm events. The TR-20 methodology considers a
multitude of characteristics from watershed areas including soil types, soil permeability, vegetative
cover, time of concentration, topography, rainfall intensity, and ponding areas, etc.
Hydrographs will be developed for each of the 10 hydrologically distinct areas and will be referred
to in the drainage evaluation as “subcatchments”.
Hydrology studies will likely reveal an increased peak rate of runoff in all studied storm events in
the post development condition for some of the subcatchments. However, the hydrology studies
will demonstrate that the surface and subsurface post construction stormwater practices located
at appropriate locations throughout the site will provide sufficient detention to keep the post
development peak runoff for the studied storm events to less than predevelopment (i.e. existing)
peak rate of runoff to the pond, Horton and Albany Post Roads and Clove Creek. Furthermore,
post construction treatment practices will be designed to infiltrate the Water Quality Volume
and Runoff Reduction Volume. This will preserve the quality of water entering the pond and off-
site areas and facilities after construction.
The hydrology studies will be based on a Type III rainfall distribution which is representative of
rainfall events that occur in the region. The soils types on the site are predominately Class B.
According to the latest available data from the Northeast Regional Climate Center
(http://precip.eas.cornell.edu/), the cumulative 24-hour rainfall amount for the 1, 10, and 100-year
storm events for this region is 2.63, 4.74, and 8.41 inches, respectively.
IV. NYSDEC STORMWATER MANAGEMENT GUIDELINES
The guidelines for designing the most effective stormwater management practices (SMPs) for new
and redeveloped sites are provided in the “New York State Stormwater Management Design Manual’,
dated January 2015. NYSDEC establishes therein what it terms Water Quality, Channel
Protection, Overbank Flood and Extreme Storm requirements.
A. Water Quality Volume Requirements
The Water Quality Volume is designed to improve water quality sizing to capture and treat
90% of the average annual stormwater runoff volume. The 90% rainfall event for the site
in Putnam County is 1.43 inches.
B. Stream Channel Protection Volume Requirements
Stream Channel Protection Volume Requirements are designed to protect off-site stream
channels from erosion. In New York State this goal is accomplished by providing 24-hour
extended detention of the 1-year, 24-hour storm event.

HHR Preliminary SWPPP 6 March 9, 2018
C. Overbank Flood Control Criteria
The primary purpose of the overbank flood control sizing criterion is to prevent an increase
in the frequency and magnitude of out-of-bank flooding generated by development to off-
site water courses. Overbank control requires storage to attenuate the post development
10-year, 24-hour peak discharge rate to predevelopment rates.
D. Extreme Flood Control Criteria
The intent of extreme flood criteria is to prevent the increased risk of flood damage on and
off-site from large storm events and to protect the physical integrity of Stormwater
Management Practices. 100-Year Control requires storage to attenuate the post
development 100-year, 24-hour peak discharge rate to predevelopment rates.
V. PRELIMINARY ESTIMATE QUALITY AND QUANTITY VOLUME
CALCULATIONS
Water Quality Volume
WQv = 1.57 ac-ft
Minimum Runoff Reduction Volume
RRv = 0.37 ac-ft (min.)
Water Quality Volume(WQv) and Runoff Reduction Volumes (RRv) are based on whole site
drainage catchment calculations.
Water Quantity Calculations
Retention = 1.3 ac-ft
The calculation for retention is preliminary and based solely on comparison of total runoff for
the 100-year storm in the pre and post condition with general attributes for cover
characteristics. This calculation does not take times of concentration into consideration or the
need to attenuate peak flow.
Calculation sheets are included as Appendix 2 to this report.
PRELIMINARY POST STOMRWATER PRACTICES
25 RAIN GARDENS – Each house site will have a 220-sf ft raingarden to capture and infiltrate
roof runoff. This provides 0.15 ac-ft of WQv and RRv.
6 Bioretention areas, A thru F will provide 1.42 ac-ft of WQV and 1.42 RRv
The final design may revise location and size of the practices.

HHR Preliminary SWPPP 7 March 9, 2018
The total preliminary post construction stormwater practices shown on the plan will
provide1.57 ac-ft of treatment and retention. This volume meets the preliminary calculated
WQV, RRv and retention requirements.
Conservation of Natural Areas have not been taken into consideration in the above calculations
but will be included in the Full SWPPP. It is expected that consideration of the conservation of
natural areas will lessen the requirements of the final SWPPP over those determined by this
preliminary SWPPP.
ADDITIONAL PRACTICES THAT WILL BE EMPLOYED
• Riparian Buffers
• Soil Restoration
• Velocity Dissipaters
• Stone Check Dams
• Dry Swales
• Deep Sump Catch Basins
ADDITIONAL PRACTICES THAT MAY BE EMPLOYED
• Cisterns
• Level Spreaders
VI. POTENTIAL SOURCES OF POLLUTION
Potentials sources of sediment to stormwater runoff include:
• clearing and grubbing operations,
• grading and site excavation operations,
• vehicle tracking,
• topsoil stripping and stockpiling, and
• landscaping operations
Potential pollutants and sources, other than sediment, to stormwater runoff include:
• Staging area including fueling activities, minor equipment maintenance, sanitary facilities,
and hazardous waste storage
• Materials storage in staging area including general building materials, solvents, adhesives,
paving materials, paints, aggregates, trash
• Construction activity including paving, curb/gutter installation, concrete
pouring/mortar/stucco, building construction
• Concrete washout areas
• Cleaning trucks and equipment on site
VII. EROSION AND SEDIMENT CONTROL
Development of the proposed project could potentially result in erosion and the transport of
sediment during construction. Erosion and sediment controls for the project will be designed to

HHR Preliminary SWPPP 8 March 9, 2018
meet or exceed the criteria of the New York State Department of Environmental Conservation
SPDES General Permit No. GP-0-15-002 for Stormwater Discharges from Construction Activity.
An Erosion and Sediment Control Management Program will be established for the proposed
development, beginning at the start of construction and continuing throughout its course, as
outlined in the "New York State Standards and Specifications for Erosion and Sediment Control," dated
November 2016. A continuing maintenance program will be implemented for erosion and
sediment control after construction. The Applicant will have a qualified professional conduct an
assessment of the site prior to the commencement of construction and certify that the
appropriate erosion and sediment controls, as shown on the drawing entitled "Erosion &
Sediment Control Plan", have been adequately installed prior to construction. In addition, the
Operator shall have a qualified professional conduct an inspection at least once every seven
calendar days.
VIII. CONSTRUCTION SEQUENCING
DISTURBANCE OF GREATER THAN 5 ACRES
Based on an initial evaluation of the cut and fill, the possibility that relief from the 5-acre limit of
disturbance, normally required by the NYSDEC stormwater regulations, cannot be discounted.
Should this prove to be the case, the rational for requesting relief and required procedures during
construction will be included in the Final SWPPP. During development of the Final SWPPP a
construction sequence similar to that shown on the preliminary plan will be developed. It will be
based on many factors, including the need to fell trees during the winter months and the need to
relocate soil from one end of the site to the other. When the applicant requests relief from the
5 acre disturbance limitation, justifications will be provided in the SWPPP to the satisfaction of
the Town of Philipstown Stormwater Officer and the NYSDEC. In accordance with NYDEC
requirements, stormwater compliance inspections will be conducted twice a week whenever
more than 5 acres of open soil disturbance exists on site.
PRE-CONSTRUCTION MEETING
A pre-construction meeting shall take place prior to construction. At a minimum, the
contractor, qualified inspection professional and Town Engineer shall attend.
SEQUENCE OF CONSTRUCTION
A site-specific Sequence of Construction will be developed with the Full SWPPP. The following
describes a Typical Sequence of Construction which shall be followed for each phase of
construction of the Project.
1. Install stabilized construction entrances and all silt fences and erosion control
measures.
2. Grub all areas to be constructed.

HHR Preliminary SWPPP 9 March 9, 2018
3. Surround all bioretention and raingarden areas with orange construction fence to
avoid compaction.
4. Construct any temporary sediment basins and stabilize the areas disturbed for the
construction of the temporary sediment basins.
5. Install silt fencing around the temporary topsoil stockpile location(s).
6. Proceed with rough grading of the area under active construction, including
construction of temporary diversion swales and stone check dams as required to
convey stormwater runoff to the temporary sediment basins. Exposed areas shall be
stabilized within 14 days.
7. Install the storm drainage system consisting of catch basins, manholes and
underground storm pipes from the Stormwater Management Areas throughout the
site along with the sediment and erosion control devices associated with the storm
drainage system (i.e. inlet protection, stone check dams, etc., as will be shown on the
Plans).
8. Install any underground utilities (sewer, electric, telephone, etc.), as required.
9. Begin building and roadway construction including foundations, curb, subbase and base
pavement sections.
10. Finish grading, redistribute topsoil and establish vegetation and/or landscaping.
The foregoing sequence will be repeated for each phase of construction.
When all phases are complete the following items will be conducted to close out the site
1. Complete any final grading, topsoil and establish vegetation and/or landscaping.
2. Clean pavements and storm drain system of all accumulated sediment in conjunction
with the removal of all temporary sediment and erosion control devices.
3. Complete construction throughout the site and stabilize the exposed areas.
4. Issue Notice of Termination (NOT)
Temporary Control Measures
Throughout the project, temporary control measures will be implemented to control on-site
erosion and sediment transfer. Interceptor swales will be used to direct stormwater runoff to
temporary sediment traps for settlement.
Descriptions of the temporary sediment and erosion controls that will be used during the
development of the site including silt fence, stabilized construction entrances, seeding, mulching,
inlet protection and stone check dams are as follows:
1. Silt Fence is constructed using a geotextile fabric. The fence will be at least 18 inches
tall. The fences will not be placed in areas which receive concentrated flows such as
ditches, swales and channels. Also, the filter fabric material will not be placed across the
entrance to pipes, culverts, spillway structures, sediment traps or basins.

HHR Preliminary SWPPP 10 March 9, 2018
2. Stabilized Construction Entrances consisting of 2-4 inch stone. The entrances will be a
minimum of 50 feet in length by 12 feet in width by 6 inches in depth.
3. Seeding will be used to create a vegetative surface to stabilize disturbed earth until at
least 70% of the disturbed area has a perennial vegetative cover. Grass lining will also
be used to line temporary channels and the surrounding disturbed areas.
4. Mulching is used as an anchor for seeding and disturbed areas to reduce soil loss due to
storm events. All disturbed areas that receive seeding will be mulched with straw at a
rate of 3 tons per acre such that the mulch forms a continuous blanket. Mulch must be
placed on all exposed areas within 48 hours of seeding
5. Inlet Protection will be provided for all stormwater inlets structures with the use of curb
gutter inlet protection, stone & block inlet protection or filter fabric inlet protection, which will
keep silt, sediment and construction debris out of the storm system.
6. Stone Check Dams will be installed within temporary and permanent swales in the
active construction area.
7. Temporary Swales will be installed to intercept sediment laden water and divert it to a
sediment trapping device.
8. Temporary Sediment Traps will be installed to intercept sediment laden runoff and to
trap and retain the sediment. The sediment traps will be sized to provide a sediment
storage volume of 3,600 cubic feet per acre draining to the basin.
Temporary sediment & erosion control measures will be maintained throughout construction.
This maintenance will include, but not be limited to the following tasks:
1. For dust control purposes, all exposed graded areas will be moistened with water at
least twice a day in those areas where soil is exposed and will not be planted with a
temporary cover due to construction operations or the season (December through
March).
2. Inspection of erosion and sediment control measures will be performed at the end of
each construction day and immediately following each rainfall event. All required repairs
shall be performed immediately.
3. Sediment deposits will be removed when they cover 1/3 of the height of the silt fence.
All such sediment will be properly disposed of in fill areas on the site. All fill areas will
be contained by installing silt fence on the downhill side.
4. During rough grading, areas that will not be disturbed for fourteen or more days will be
stabilized with the temporary seed mixture, as defined on the plans.
5. Following final grading, disturbed areas will be stabilized with a permanent surface
treatment (i.e. sod, grass, pavement or sidewalk).
IX. FINAL STABILIZATION
PERMANENT SEEDING:

HHR Preliminary SWPPP 11 March 9, 2018
Permanent seeding will be applied immediately after the final design grades are achieved at the
site but no later than 14 days after construction activities have permanently ceased. After the
entire site is stabilized, any sediment that has accumulated will be removed and hauled off site to
an appropriate receiving facility. Construction debris, trash, and temporary BMP’s (best
management practices) will also be removed. Any areas disturbed during removal will be seeded
immediately.
Seedbed Preparation:
a. Topsoil will be spread over final graded areas at a minimum depth of four inches.
b. The seedbed will be free of rocks, woody debris and other objectionable material.
c. Mulch will be applied to the seedbed as specified.
d. Topsoil will be loosened by raking, tilling or other suitable methods.
The Final SWPPP will detail additional specifications relating to seeding, hydroseeding, mulching
and sodding
INSTALLATION SCHEDULE
Portions of the site where construction activities have permanently ceased will be stabilized, as
soon as possible, but not later than 14 days after construction ceases.
MAINTENANCE AND INSPECTION
All seeded areas will be inspected weekly during construction activities for failure until a dense
cover of vegetation has been established. If failure is noticed on the seeded area, the area will be
re-seeded and mulched immediately. After construction is complete at the site, permanent
stabilization measures will be monitored until final stabilization is reached.
A “Notice of Termination” (NOT) will be submitted after all clean-up at the site is complete and
after all seeding and mulching operations are complete and all plants are installed.
X. GOOD HOUSEKEEPING BEST MANAGEMENT PRACTICES (BMP’S)
DURING CONSTRUCTION
MATERIAL HANDLING AND WASTE MANAGEMENT:
Waste Materials: All waste materials will be collected and disposed of into metal waste
dumpsters in the staging area. Dumpsters will have a secure tight lid, be placed away from storm
water drains and structures, and will meet all federal, state, county, and local regulations. Only
trash and construction debris will be placed in the dumpsters. Construction materials will not be
buried on site. All personnel will be instructed regarding the correct disposal of trash and
construction debris. Notices that state these practices will be posted in the office trailer and the
individual who manages day-to-day site operations will be responsible for seeing that these
practices are followed.
HHR Preliminary SWPPP 12 March 9, 2018
Installation Schedule: Trash dumpsters will be installed when the staging area has been established.
Maintenance and Inspection: The dumpsters will be inspected weekly and immediately after storm
events. The dumpsters will be removed from site when full and all materials will be recycled if
appropriate or disposed of at an appropriate facility, .
Hazardous Waste Materials: All hazardous waste materials including oil filters, petroleum
products, paint, and equipment maintenance fluids will be stored in structurally sound and sealed
shipping containers, within the staging area. Hazardous waste materials will be stored in
appropriate and clearly marked containers and segregated from other non-waste materials.
Secondary containment will be provided for all waste materials in the hazardous materials storage
area and will consist of commercially available spill pallets. Additionally, all hazardous waste
materials will be disposed of in accordance with federal, state, county, and local regulations.
Hazardous waste materials will not be disposed of into the on-site dumpsters. All personnel will
be instructed, regarding proper procedures for hazardous waste disposal. Notices that state
these procedures will be posted in the office trailer and the individual that manages day-to-day
site operations will be responsible for seeing that these procedures are followed.
Installation Schedule: Shipping containers used to store hazardous waste materials will be installed
once the staging area has been installed.
Maintenance and Inspection: The hazardous waste materials area will be inspected weekly and after
storm events. The storage area will be kept clean, well-organized and equipped with ample
cleanup supplies as appropriate for the materials being stored. Material safety datasheets, material
inventory, and emergency contact numbers will be maintained in the office trailer.
Sanitary Waste: Two portable toilets, located in the staging area, will be provided at the site
throughout the construction phase. The toilets will be anchored as approved by the stormwater
inspector and located away from concentrated drainage flow paths and will have collection pans
underneath as secondary containment.
Installation schedule: The portable toilets will be set up at the site when the staging area is
complete.
Maintenance and Inspection: Sanitary waste will be collected as necessary for the use and shall be
inspected weekly for evidence of leaking holding tanks.
Recycling: Wood pallets, cardboard boxes, and other recyclable construction scraps will be
disposed of in a dumpster designated for recycling. The dumpster will have a secure watertight
lid, be placed away from stormwater conveyances and drains and meet all local and state solid-
waste management regulations. Only solid recyclable construction scraps from the site will be
deposited in the dumpster. All personnel will be instructed, regarding the correct procedure for
disposal of recyclable construction scraps. Notices that state these procedures will be posted in
HHR Preliminary SWPPP 13 March 9, 2018
the office trailer, and the individual that manages day-to-day site operations will be responsible
for seeing that these procedures are followed.
Installation Schedule: Designated recycling dumpsters will be installed once the staging area has
been established.
Maintenance and Inspection: The recycling dumpster will be inspected weekly. The recycling
dumpster will be emptied when full and taken to an approved recycling center by the contractor.
If recyclable construction wastes are exceeding the dumpster’s capacity, the dumpsters will be
emptied more frequently.
ESTABLISH PROPER BUILDING MATERIAL STAGING AREAS:
Staging Area:
Construction equipment and maintenance materials will be stored at the staging area. Straw
Bales shall be installed around the perimeter of the area. A watertight shipping container will be
used to store hand tools, small parts, and other construction materials. Non-hazardous building
materials such as packaging material (wood, plastic, and glass), and construction scrap material
(brick, wood, steel, metal scraps, and pipe cuttings) will be stored in a separate covered storage
facility adjacent to the shipping container. All hazardous-waste materials such as oil filters,
petroleum products, paint, and equipment maintenance fluids will be stored in structurally sound
and sealed containers under cover within the staging area.
Very large items, such as framing materials and stockpiled lumber, will be stored in the open in
the staging area. Such materials will be elevated on wood blocks to minimize contact with runoff.
Installation Schedule: The staging area will be installed immediately and before any grading occurs
or before any infrastructure is constructed at the site, whichever is to occur first.
Maintenance and Inspection: The storage area will be inspected weekly. The storage area will be
kept clean, well-organized, and equipped with ample cleanup supplies as appropriate for the
materials being stored. Perimeter controls, containment structures, covers, and liners will be
repaired or replaced as needed to maintain proper function.
Concrete Washout
A designated temporary, above-grade concrete washout area will be constructed as will be
detailed on the final site map. The temporary concrete washout area will be constructed as
shown on the Erosion Control Plan, with a recommended minimum length and minimum width
of 10 feet, but with sufficient quantity and volume to contain all liquid and concrete waste
generated by washout operations. The washout area will be lined with plastic sheeting at least
10 mils thick and free of holes or tears. Signs will be posted marking the location of the washout
area to ensure that concrete equipment operators use the proper facility.

HHR Preliminary SWPPP 14 March 9, 2018
Concrete pours will not be conducted during or before an anticipated storm event. Concrete
mixer trucks and chutes will be washed in the designated area or concrete wastes will be properly
disposed of off-site. When the temporary washout area is no longer needed for the construction
project, the hardened concrete and materials used to construct the area will be removed and
disposed of according to the maintenance section below, and the area will be stabilized.
Installation Schedule: The washout area will be constructed before concrete pours occur at the
site.
Maintenance and Inspection: The washout areas will be inspected weekly and after each day of use
to ensure that all concrete washing is being discharged into the washout area, no leaks or tears
are present, and to identify when concrete wastes need to be removed. The washout areas will
be cleaned out once the area is filled to 75 percent of its holding capacity. Once the area’s
holding capacity has been reached, the concrete wastes will be allowed to harden; the concrete
will be broken up, removed, and taken to an appropriate facility for disposal. The plastic sheeting
will be replaced if tears occur during removal of concrete wastes from the washout area.
ESTABLISH PROPER EQUIPMENT/VEHICLE FUELING AND MAINTENANCE PRACTICES:
Vehicle/Equipment Fueling and Maintenance
BMP Description: Several types of vehicles and equipment will be used on-site throughout the
project, including graders, scrapers, excavators, loaders, paving equipment, rollers, trucks and
trailers, backhoes, and forklifts. All major equipment/vehicle fueling and maintenance will be
performed off-site. A small, 20-gallon pickup bed fuel tank will be kept on-site in the staging area.
When vehicle fueling must occur on-site, the fueling activity will occur in the staging area. Only
minor equipment maintenance will occur on-site. All equipment fluids generated from
maintenance activities will be disposed of into designated drums stored on spill pallets in
accordance with applicable laws. Absorbent, spill-cleanup materials and spill kits will be available
at the staging area. Drip pans will be placed under all equipment receiving maintenance and under
all vehicles and equipment parked overnight.
Installation Schedule: BMPs implemented for equipment and vehicle maintenance and fueling
activities will begin at the start of the project.
Maintenance and Inspection: Inspect equipment/vehicle storage areas and fuel tank weekly.
Vehicles and equipment will be inspected on each day of use. Leaks are to be repaired
immediately, or the problem vehicle(s) or equipment is to be removed from the project site. An
ample supply of spill-cleanup materials is to be kept on-site. Spills are to be cleaned up
immediately and materials are to be disposed of properly.
Equipment/Vehicle Washing:
All equipment and vehicle washing will be performed off-site.

HHR Preliminary SWPPP 15 March 9, 2018
Spill Prevention and Control Plan:
1. Employee Training: All employees will be trained during twice monthly meetings.
2. Vehicle Maintenance: Vehicles and equipment will be maintained off-site. All Vehicles and
equipment including subcontractor vehicles will be checked for leaking oil and fluids.
Vehicles leaking fluid will not be allowed on-site. Drip pans will be placed under all vehicles
and equipment that are parked overnight.
3. Hazardous Material Storage: Hazardous materials will be stored in accordance with state,
federal and municipal regulations.
4. Spill Kits: Spill kits will be stored within the staging area and concrete washout areas.
5. Spills: All spills will be cleaned up immediately upon discovery. Spent absorbent materials
and rags will be hauled off-site immediately after the spill is cleaned up for appropriate
disposal. Spills large enough to discharge to surface water will be reported to the
NYSDEC at the NYS Spill Hotline 1-800-457-7362.
6. Material safety data sheets: a material inventory, and emergency contact information will
be maintained at the on-site project trailer.
7. Installation Schedule: The spill prevention and control procedures will be implemented
prior to commencement of construction.
8. Maintenance and Inspection: All personnel will be instructed, during twice monthly
meetings, regarding the correct procedures for spill prevention and control. Notices that
state these practices will be posted in the office trailer, and the individual that manages
day-to-day site operations will be responsible for seeing that these procedures are
followed.
XI. CONCLUSIONS
Ultimately the SWPPP will be designed and implemented to ensure there is no increase in peak
runoff rates during the 1, 10 and 100-year storm events in the post development state when
compared to the pre-development state of the site. Water quality measures including catch
basins with sumps, bioretention areas, rain gardens, riparian buffers, dry swales, stone check
dams, soil restoration and velocity dissipaters, coupled with a comprehensive Erosion and
Sediment Control Program will protect the water quality of the downstream receiving waters.


APPENDIX 1
BORING REPORT


APPENDIX 11
CALCULATIONS


Runoff Reduction Techiques/Standard
SMPs
Total
Contributing
Area
Total
Contributing
Impervious
Area
WQv
Reduced
(RRv)
WQv Treated
(acres) (acres) cf cf
Conservation of Natural Areas RR‐1 142.00 0.00
Sheetflow to Riparian Buffers/Filter
StripsRR‐2 0.00 0.00
Tree Planting/Tree Pit RR‐3 0.00 0.00
Disconnection of Rooftop Runoff RR‐4 0.00
Vegetated Swale RR‐5 0.00 0.00 0
Rain Garden RR‐6 1.38 1.38 6793
Stormwater Planter RR‐7 0.00 0.00 0
Rain Barrel/Cistern RR‐8 0.00 0.00 0
Porous Pavement RR‐9 0.00 0.00 0
Green Roof (Intensive & Extensive) RR‐10 0.00 0.00 0
Infiltration Trench I‐1 0.00 0.00 0 0
Infiltration Basin I‐2 0.00 0.00 0 0
Dry Well I‐3 0.00 0.00 0 0
Underground Infiltration System I‐4
Bioretention & Infiltration Bioretention F‐5 102.62 7.56 61966 0
Dry swale O‐1 0.00 0.00 0 0
Micropool Extended Detention (P‐1) P‐1
Wet Pond (P‐2) P‐2
Wet Extended Detention (P‐3) P‐3
Multiple Pond system (P‐4) P‐4
Pocket Pond (p‐5) P‐5
Surface Sand filter (F‐1) F‐1
Underground Sand filter (F‐2) F‐2
Perimeter Sand Filter (F‐3) F‐3
Organic Filter (F‐4 F‐4
Shallow Wetland (W‐1) W‐1
Extended Detention Wetland (W‐2 W‐2
Pond/Wetland System (W‐3) W‐3
Pocket Wetland (W‐4) W‐4
Wet Swale (O‐2) O‐2
→ 142.00 0.00 36855
→ 1.38 1.38 6793
→ 102.62 7.56 61966 0
→ 0.00 0.00 0
→ 246.00 8.94 105,614 0Impervious Cover √ okay
Total Area √ okay
Totals by Volume Reduction
Totals by Standard SMP w/RRV
Totals by Standard SMP
Totals ( Area + Volume + all SMPs)
Runoff Reduction Volume and Treated volumes
Standard SMPs
w/RRv Capacity
Standard SMPs
Area/Volume Reduction
Totals by Area Reduction
February 15, 2018 HHR Preliminary Calc Badey Watson

Version 1.8
Last Updated: 11/09/2015
Total Water Quality Volume Calculation
WQv(acre‐feet) = [(P)(Rv)(A)] /12
No
Design 1
P= 1.43 inch
Catchme
nt
Number
Total Area
(Acres)
Impervious Area
(Acres)
Percent
Impervious
%
RvWQv
(ft 3 )Description
1 102.62 7.56 7% 0.12 61,966 Bioretention
2 1.38 1.38 100% 0.95 6,793 Rain Garden
3 142.00 0.00 0% 0.05 36,855Conservation of
Natural Areas
4
5
6
7
8
9
10Subtotal
(1 30)246.00 8.94 4% 0.08 105,614 Subtotal 1
Total 246.00 8.94 4% 0.08 105,614 Initial WQv
Total
Contributing
Area
Contributing
Impervious Area
(Acre) (Acre)
142.00 0.00
0.00 0.00
0.00 0.00
0.00 0.00
142.00 0.00
Total Area
(Acres)
Impervious Area
(Acres)
Percent
Impervious
%
Runoff
Coefficient
Rv
WQv
(ft 3 )
246.00 8.94 4% 0.08 105,614
‐142.00 0.00
104.00 8.94 9% 0.13 68,759
0.00
104.00 8.94 9% 0.13 68,759
36,855
Identify Runoff Reduction Techniques By Area
Breakdown of Subcatchments
Is this project subject to Chapter 10 of the NYS Design Manual (i.e. WQv is equal to post‐
development 1 year runoff
"<<Initial WQv"
Recalculate WQv after application of Area Reduction Techniques
Riparian Buffersmaximum contributing length 75 feet to
150 feet
Up to 100 sf directly connected impervious
area may be subtracted per treeTree Planting
Filter Strips
Total
Manually enter P, Total Area and Impervious Cover.
NotesTechnique
minimum 10,000 sfConservation of Natural
WQv reduced by Area
Reduction techniques
Adjusted WQv after
Area Reduction and
Rooftop Disconnect
Subtract Area
Disconnection of
WQv adjusted after
Area Reductions
February 15, 2015 HHR Preliminary Calc Badey Watson
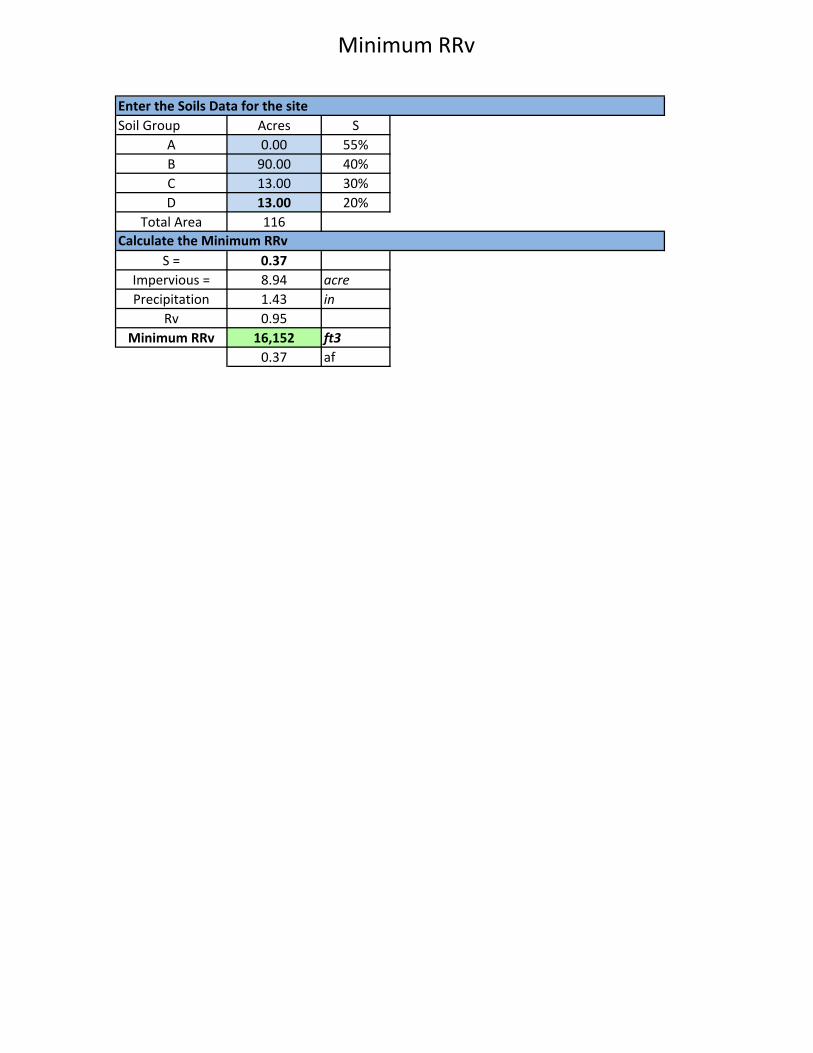
Minimum RRv
Soil Group Acres S
A 0.00 55%
B 90.00 40%
C 13.00 30%
D 13.00 20%
Total Area 116
S = 0.37
Impervious = 8.94 acre
Precipitation 1.43 in
Rv 0.95
Minimum RRv 16,152 ft3
0.37 af
Enter the Soils Data for the site
Calculate the Minimum RRv

Rain Garden Worksheet
Design Point: 1
Catchment
Number
Total Area
(Acres)
Impervious
Area
(Acres)
Percent
Impervious
%
RvWQv
(ft 3 )
Precipitation
(in)Description
2 1.38 1.38 1.00 0.95 6792.50 1.43 Rain Garden
0.00 100% 0.95 6,793
B
Yes
1.40 in/hour
25
220
ARG 5,500 sf
DSM 1.50 ft
DDL 0.50 ft
DP 0.50 ft
nSM 0.40
nDL 0.40
VSM 3,300 ft3
VDL 1,100 ft3
2,750 ft3
7,150 ft3
100%
6,793 ft 3
OK
WQv ≤ VSM + VDL + (DP x ARG)
VSM = ARG x DSM x nSM
VDL (optional) = ARG x DDL x nDL
Enter Site Data For Drainage Area to be Treated by Practice
Soil Information
Percent Reduction
Runoff Reduction
Rain Garden Parameters
1 to 1.50
≥ 0.50 ft
≤ 0.50
≥20%, enter as a decimal
≥ 40%, enter as a decimal
Determine Runoff Reduction
Enter Rain Garden Surface
area
Enter Impervious Area
Reduced by Disconnection of
Rooftops
<<WQv after adjusting for
Disconnected Rooftops
Design as a Bioretention practice
Enter ponding depth above
surface
WQv ≤ VSM + VDL + (DP x ARG) √
Okay
Soil Group
Using Underdrains
Infiltration Rate
Enter number of Rain Gardens
Enter area of each Rain Garden
Total Volume Provided
Enter porosity of Soil Media
Enter porosity of Drainage
Layer
Volume Provided In Soil
Media
Volume Provided in Drainage
Layer
Volume Provided In Ponding
Area
Enter depth of Soil Media
Enter depth of drainage layer
February 15, 2018 HHR Preliminary Calc Badey Watson

Bioretention Worksheet
Af
WQv
df
hf
tf
Design Point: 1
Catchment
Number
Total Area
(Acres)
Impervious
Area
(Acres)
Percent
Impervious
%
RvWQv
(ft 3 )
Precipitation
(in)Description
1 102.62 7.56 0.07 0.12 61966.16 1.43 Bioretention
0.00 7% 0.12 61,966
0 ft 3
B
6.00 in/hour
No
Units Notes
ft3
df ft 2.5‐4 ft
k ft/day
hf ft 6 inches max.
tf days
Af ft2
400 ft
200 ft
80000 ft2
80160 ft3
No
64,128
61,966 ft3
0 ft3
Water Quality Volume (ft3)
Depth of the Soil Medium (feet)
The hydraulic conductivity [ft/day], can be varied
depending on the properties of the soil media. Some
reported conductivity values are: Sand ‐ 3.5 ft/day
(City of Austin 1988); Peat ‐ 2.0 ft/day (Galli 1990);
Leaf Compost ‐ 8.7 ft/day (Claytor and Schueler,
1996); Bioretention Soil (0.5 ft/day (Claytor &
Average height of water above the planter bed
Volume Through the Filter Media (days)
k
Enter Impervious Area Reduced
by Disconnection of Rooftops
<<WQv after adjusting for
Disconnected Rooftops
Design as an infiltration bioretention practice
Soil Infiltration Rate
Using Underdrains?
Soil Group
Design as an infiltration bioretention practice
Soil Information
RRv
RRv applied
Volume Treated
Enter Site Data For Drainage Area to be Treated by Practice
Calculate the Minimum Filter Area
Enter the portion of the WQv that is not reduced for all practices
routed to this practice.
WQv
Enter Filter Time
61,966
2.5
0.5
0.5
Required Filter Area
Af=WQv*(df)/[k*(hf+df)(tf)]
This is the portion of the WQv that is not reduced in
the practice.
This is 40% of the storage provided or WQv
whichever is less.
Determine Runoff Reduction
Required Surface Area (ft2)
Filter Width
Filter Length
61842
Value
Enter Average Height of Ponding
Enter Hydraulic Conductivity
Enter Depth of Soil Media
Filter Area
Determine Actual Bio‐Retention Area
1.67
Actual Volume Provided
Is the Bioretention contributing flow to
another practice?Select Practice
February 15, 2018 HHR Preliminary Calc Badey atson
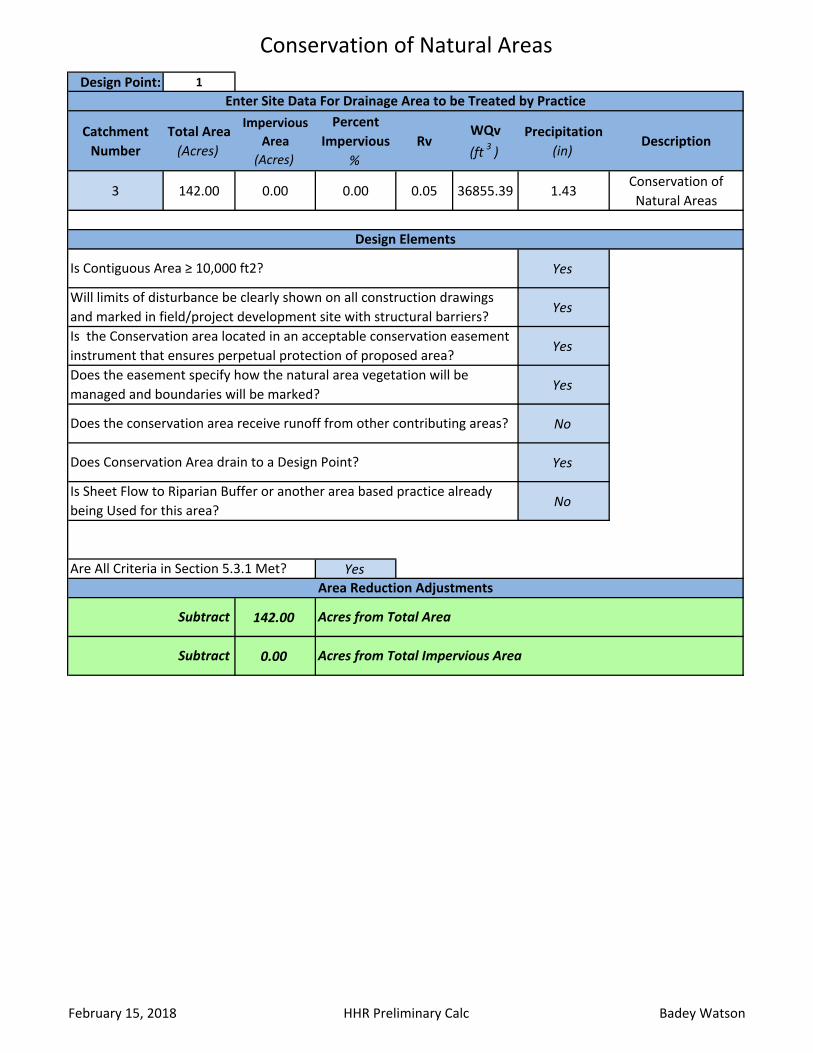
Conservation of Natural Areas
Design Point: 1
Catchment
Number
Total Area
(Acres)
Impervious
Area
(Acres)
Percent
Impervious
%
RvWQv
(ft 3 )
Precipitation
(in)Description
3 142.00 0.00 0.00 0.05 36855.39 1.43Conservation of
Natural Areas
Yes
Yes
Yes
Yes
No
Yes
No
Yes
142.00
0.00Subtract Acres from Total Impervious Area
Acres from Total Area
Are All Criteria in Section 5.3.1 Met?
Area Reduction Adjustments
Subtract
Enter Site Data For Drainage Area to be Treated by Practice
Design Elements
Is Sheet Flow to Riparian Buffer or another area based practice already
being Used for this area?
Does the easement specify how the natural area vegetation will be
managed and boundaries will be marked?
Does the conservation area receive runoff from other contributing areas?
Does Conservation Area drain to a Design Point?
Is Contiguous Area ≥ 10,000 ft2?
Will limits of disturbance be clearly shown on all construction drawings
and marked in field/project development site with structural barriers?
Is the Conservation area located in an acceptable conservation easement
instrument that ensures perpetual protection of proposed area?
February 15, 2018 HHR Preliminary Calc Badey Watson
370
3
6
0
380
310
300
290
3
5
0
3
4
0
3
3
0
320
2
7
0
280
3
2
0
3
3
0
3
4
0
420
320
4
6
0
4
5
0
440
430
\
/
\
/
\
/
\
/
\
/
\
/
\
/
\/
\
/
\
/
\/
\/
\
/
\
/
\
/
\
/
\
/
\
/
\
/
\
/
\
/
\
/
\
/
\
/
\
/
\
/
\
/
\
/
\
/
\
/
\
/
\
/
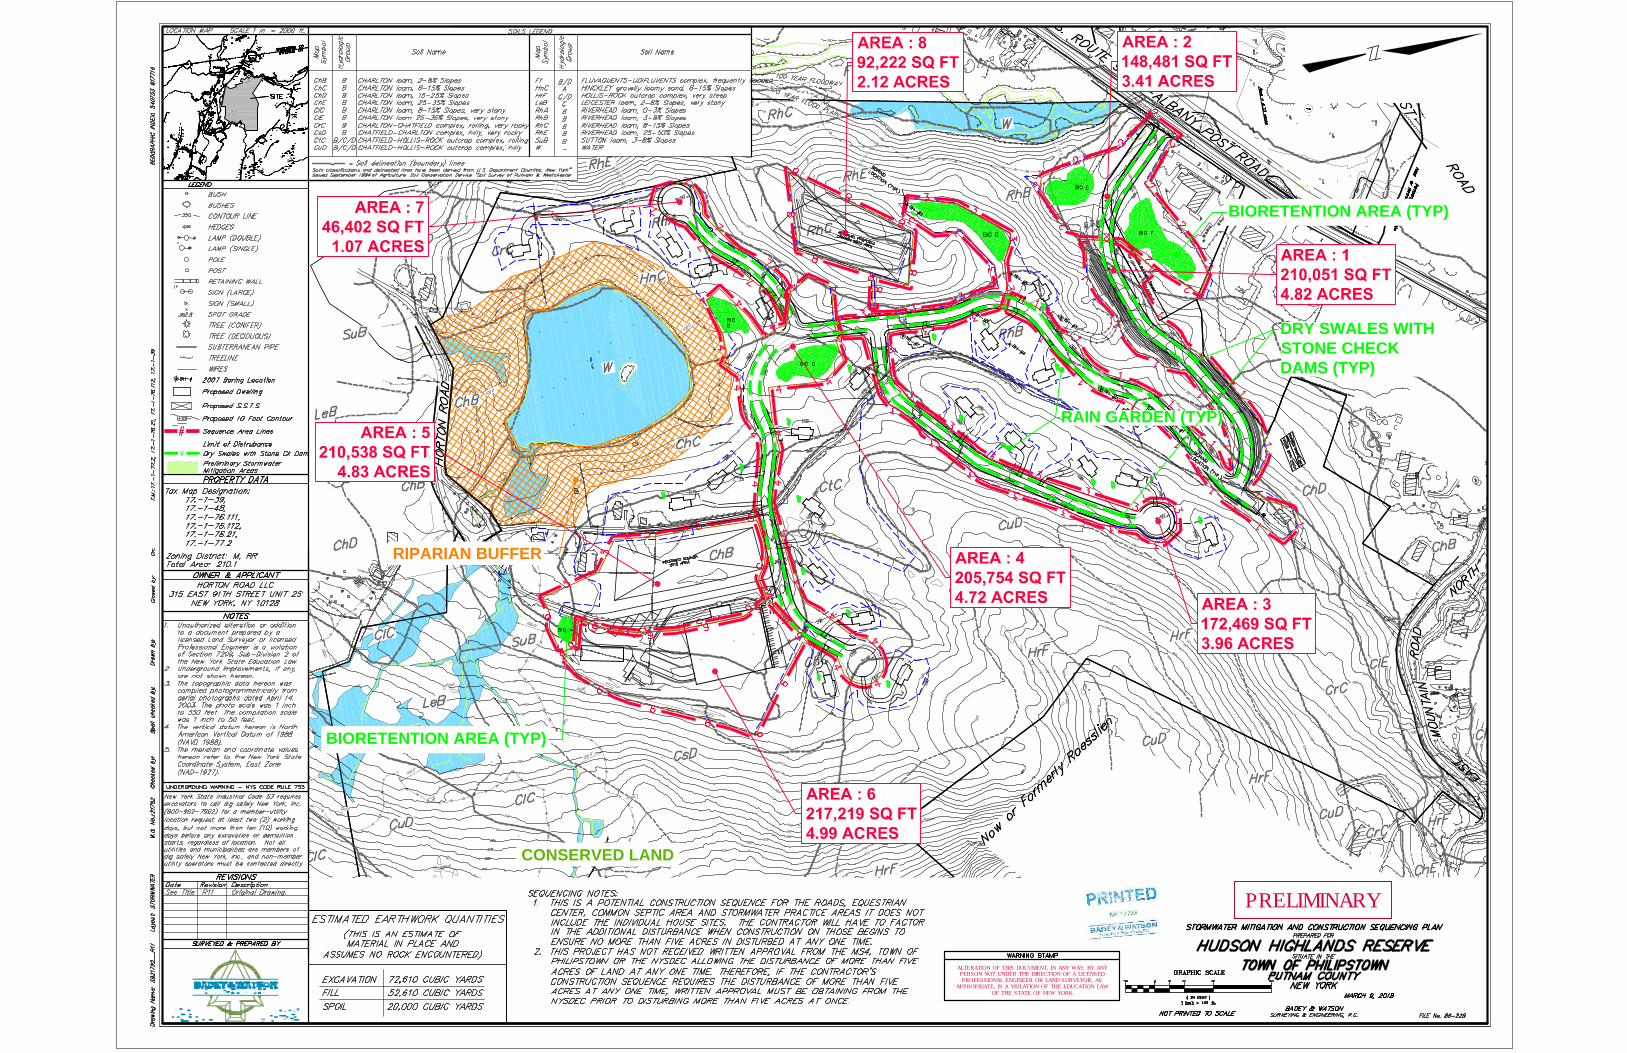
AREA : 6
217,219 SQ FT
4.99 ACRES
AREA : 5
210,538 SQ FT
4.83 ACRES
AREA : 8
92,222 SQ FT
2.12 ACRES
AREA : 1
210,051 SQ FT
4.82 ACRES
AREA : 7
46,402 SQ FT
1.07 ACRES
\/
\/
\/
\
/
\
/
\
/
\
/
\
/
\
/
\
/
\
/
\
/
\
/
\/
\/
\/
\
/
\
/
\
/
\
/
\/
\/
\
/
\
/
\
/
\
/
\
/
\
/
\
/
\
/
\
/
\
/
\
/
\/
\/
\/
\
/
\
/
\
/
\
/
\
/
\
/
\
/
\
/
\
/
\/
\
/
\
/
\
/
\
/
\/
\/
\/
\/
\/
\/
\/
\/
\/
\
/
\
/
\/
\/
\/
\/
\
/
\/
\/
\
/
\
/
\
/
\
/
\
/
\
/
\/
\
/
\
/
\
/
\
/
\/
\/
\/
\/
\/
\/
\
/
\
/
\
/
\/
\/
\/
\/
\/
\/
\
/
\/
\/
AREA : 3
172,469 SQ FT
3.96 ACRES
AREA : 4
205,754 SQ FT
4.72 ACRES
AREA : 2
148,481 SQ FT
3.41 ACRES
BIORETENTION AREA (TYP)
RAIN GARDEN (TYP)
BIORETENTION AREA (TYP)
RIPARIAN BUFFER
DRY SWALES WITH
STONE CHECK
DAMS (TYP)
CONSERVED LAND
\/
ALTERATION OF THIS DOCUMENT, IN ANY WAY, BY ANYPERSON NOT UNDER THE DIRECTION OF A LICENSEDPROFESSIONAL ENGINEER OR LAND SURVEYOR, AS
APPROPRIATE, IS A VIOLATION OF THE EDUCATION LAWOF THE STATE OF NEW YORK
PRELIMINARY


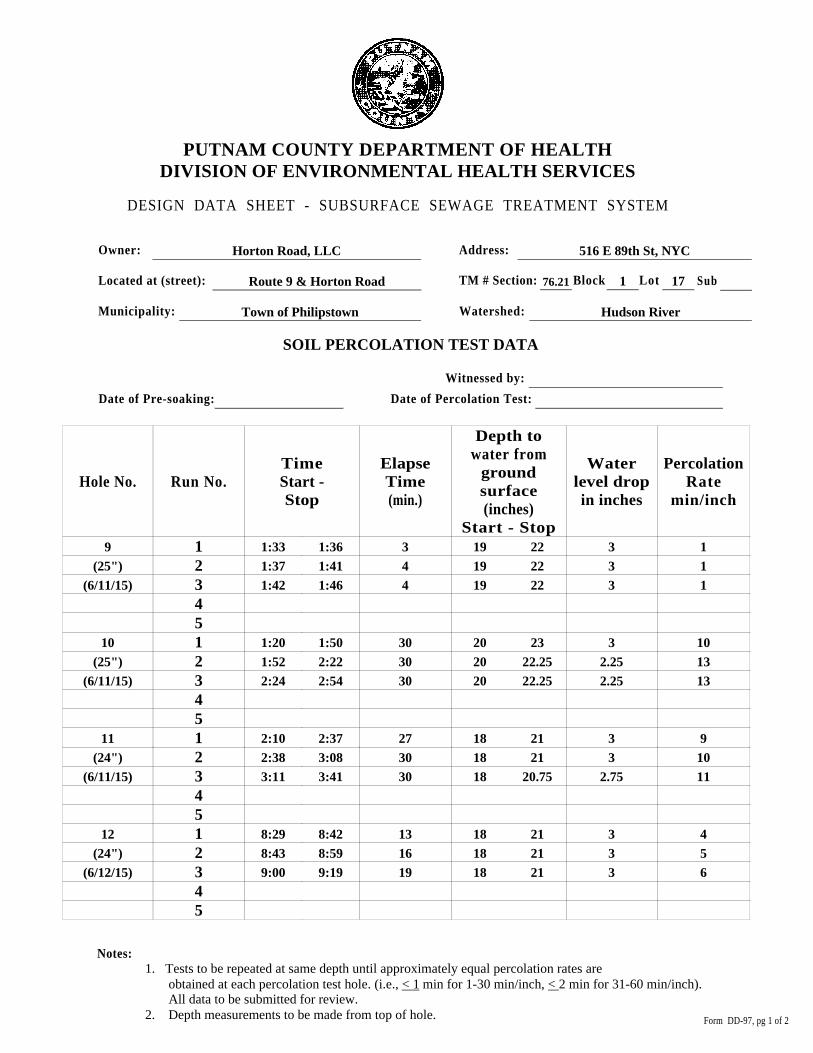
PUTNAM COUNTY DEPARTMENT OF HEALTHDIVISION OF ENVIRONMENTAL HEALTH SERVICES
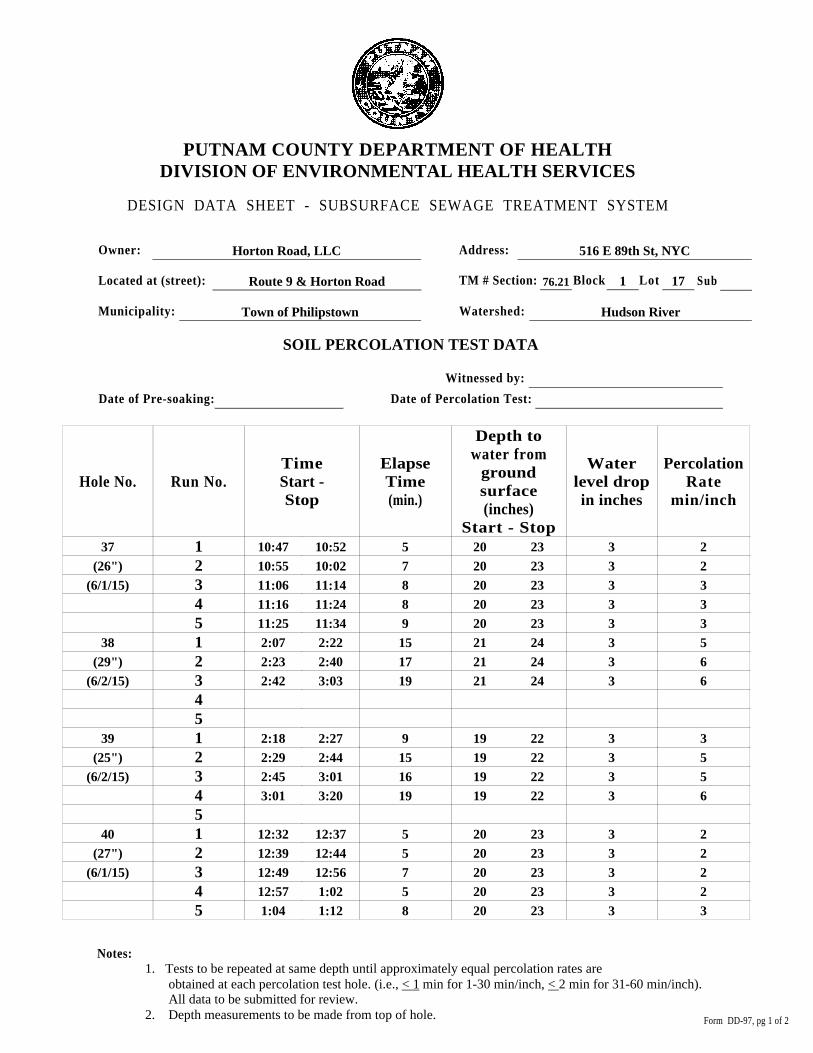
DESIGN DATA SHEET - SUBSURFACE SEWAGE TREATMENT SYSTEM
Horton Road, LLC 516 E 89th St, NYCOwner: Address:
Route 9 & Horton Road 176.21 17Located at (street): TM # Section: Block Lot
Town of Philipstown Hudson RiverMunicipality: Watershed:
SOIL PERCOLATION TEST DATA
Witnessed by:
Date of Pre-soaking: Date of Percolation Test:
Notes:1. Tests to be repeated at same depth until approximately equal percolation rates are
obtained at each percolation test hole. (i.e., < 1 min for 1-30 min/inch, < 2 min for 31-60 min/inch).All data to be submitted for review.
2. Depth measurements to be made from top of hole. Form DD-97, pg 1 of 2
Depth towater from
groundsurface(inches)
Start - Stop
TimeStart -Stop
Waterlevel dropin inches
PercolationRate
min/inch
ElapseTime(min.)
Run No.Hole No.
3 82411
3 9282(28")
3 10303(6/11/15)
45
n/a n/an/a12
2345
n/a n/an/a13
2345
n/a n/an/a14
2345
8:30
9:00
9:30
n/a
n/a
n/a
8:54
9:28
10:00
n/a
n/a
n/a
21
21
21
n/a
n/a
n/a
24
24
24
n/a
n/a
n/a
Sub
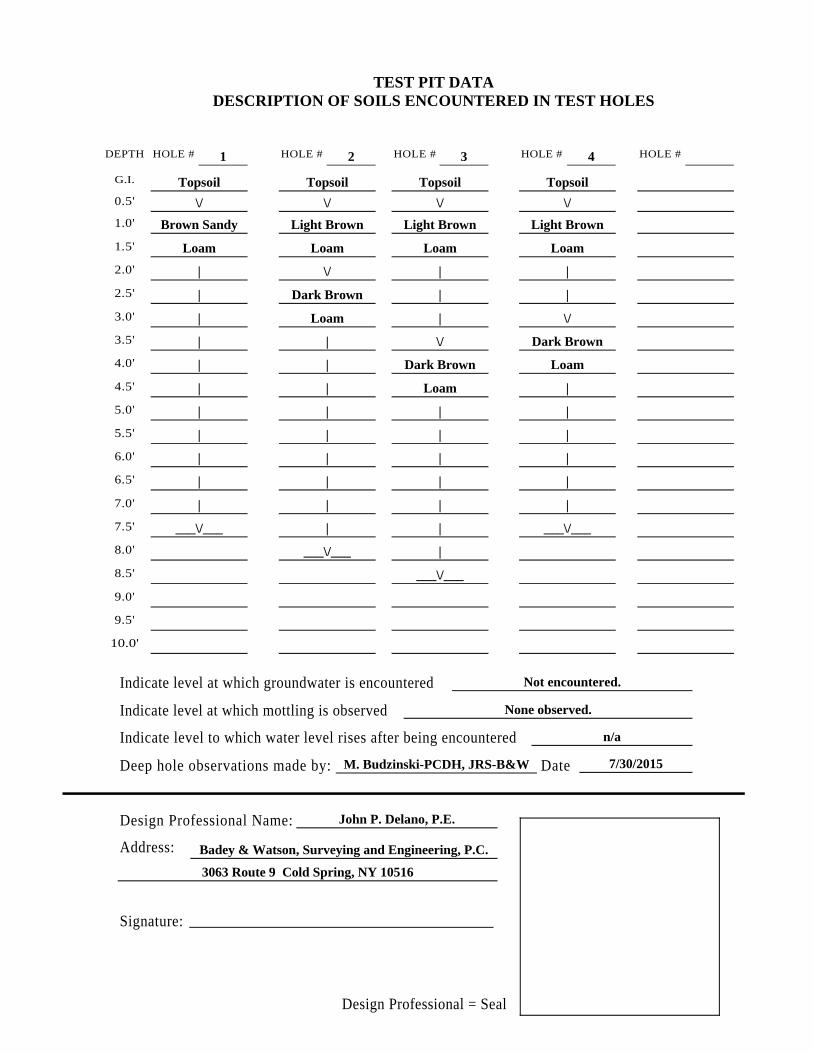
TEST PIT DATADESCRIPTION OF SOILS ENCOUNTERED IN TEST HOLES
1 2 3 4 HOLE # HOLE #DEPTH HOLE # HOLE # HOLE #
Topsoil Topsoil Topsoil Topsoil G.I.
\/ \/ \/ \/0.5'
Light Brown Brown Sandy Light Brown Light Brown 1.0'
Loam Loam Loam Loam 1.5'
| \/ | |2.0'
| Dark Brown | |2.5'
| Loam | \/3.0'
| | \/ Dark Brown3.5'
Loam | | Dark Brown4.0'
| || Loam 4.5'
| | | |5.0'
| | | |5.5'
|| | |6.0'
| || |6.5'
| | | |7.0'
| | ___\/______\/___7.5'
___\/___ |8.0'
___\/___8.5'
9.0'
9.5'
10.0'
Not encountered. Indicate level at which groundwater is encountered
None observed. Indicate level at which mottling is observed
n/a Indicate level to which water level rises after being encountered
M. Budzinski-PCDH, JRS-B&W DateDeep hole observations made by:
John P. Delano, P.E. Design Professional Name:
Address:
Signature:
Design Professional = Seal
7/30/2015
Badey & Watson, Surveying and Engineering, P.C.
3063 Route 9 Cold Spring, NY 10516

PUTNAM COUNTY DEPARTMENT OF HEALTHDIVISION OF ENVIRONMENTAL HEALTH SERVICES
DESIGN DATA SHEET - SUBSURFACE SEWAGE TREATMENT SYSTEM
Horton Road, LLC 516 E 89th St, NYCOwner: Address:
Route 9 & Horton Road 176.21 17Located at (street): TM # Section: Block Lot
Town of Philipstown Hudson RiverMunicipality: Watershed:
SOIL PERCOLATION TEST DATA
Witnessed by:
Date of Pre-soaking: Date of Percolation Test:
Notes:1. Tests to be repeated at same depth until approximately equal percolation rates are
obtained at each percolation test hole. (i.e., < 1 min for 1-30 min/inch, < 2 min for 31-60 min/inch).All data to be submitted for review.
2. Depth measurements to be made from top of hole. Form DD-97, pg 1 of 2
Depth towater from
groundsurface(inches)
Start - Stop
TimeStart -Stop
Waterlevel dropin inches
PercolationRate
min/inch
ElapseTime(min.)
Run No.Hole No.
3 51615
3 7212(25")
3 7223(6/10/15)
45
3 41116
3 4132(27")
3 515:523(6/10/15)
45
2.5 123017
2 15302(27")
2 15303(6/11/15)
45
3 2718
3 382(26")
3 3103(6/10/15)
45
11:56
12:08
12:32
9:54
10:06
1021
10:25
10:57
11:30
11:40
11:48
11:57
12:06
12:29
12:54
10:05
10:19
10:36
10:55
11:27
12:00
11:47
11:56
12:07
19
19
19
21
21
21
21
21
21
18
18
18
22
22
22
24
24
24
23.5
23
23
21
21
21
Sub

TEST PIT DATADESCRIPTION OF SOILS ENCOUNTERED IN TEST HOLES
5 6 7 8 HOLE # HOLE #DEPTH HOLE # HOLE # HOLE #
Topsoil Topsoil Topsoil Topsoil G.I.
\/ \/ \/ \/0.5'
Sandy Loam Light Brown Sandy Loam Sandy Loam 1.0'
w/ Gravel Loam w/ Gravel w/ Gravel 1.5'
| | | |2.0'
| | \/ |2.5'
| | Compact |3.0'
| | Brown Loam |3.5'
\/\/ \/ | 4.0'
Compact CompactSandy Loam |4.5'
w/ Gravel Brown Loam ___\/___ Brown Loam 5.0'
| | | | 5.5'
|| | |6.0'
| || |6.5'
| | | |7.0'
| | ||7.5'
| | ___\/______\/___8.0'
___\/___ ___\/___8.5'
9.0'
9.5'
10.0'
Not encountered. Indicate level at which groundwater is encountered
None observed. Indicate level at which mottling is observed
n/a Indicate level to which water level rises after being encountered
M. Budzinski-PCDH, JRS-B&W DateDeep hole observations made by:
John P. Delano, P.E. Design Professional Name:
Address:
Signature:
Design Professional = Seal
7/30/2015
Badey & Watson, Surveying and Engineering, P.C.
3063 Route 9 Cold Spring, NY 10516
PUTNAM COUNTY DEPARTMENT OF HEALTHDIVISION OF ENVIRONMENTAL HEALTH SERVICES
DESIGN DATA SHEET - SUBSURFACE SEWAGE TREATMENT SYSTEM
Horton Road, LLC 516 E 89th St, NYCOwner: Address:
Route 9 & Horton Road 176.21 17Located at (street): TM # Section: Block Lot
Town of Philipstown Hudson RiverMunicipality: Watershed:
SOIL PERCOLATION TEST DATA
Witnessed by:
Date of Pre-soaking: Date of Percolation Test:
Notes:1. Tests to be repeated at same depth until approximately equal percolation rates are
obtained at each percolation test hole. (i.e., < 1 min for 1-30 min/inch, < 2 min for 31-60 min/inch).All data to be submitted for review.
2. Depth measurements to be made from top of hole. Form DD-97, pg 1 of 2
Depth towater from
groundsurface(inches)
Start - Stop
TimeStart -Stop
Waterlevel dropin inches
PercolationRate
min/inch
ElapseTime(min.)
Run No.Hole No.
3 1319
3 142(25")
3 143(6/11/15)
45
3 1030110
2.25 13302(25")
2.25 13303(6/11/15)
45
3 927111
3 10302(24")
2.75 11303(6/11/15)
45
3 413112
3 5162(24")
3 6193(6/12/15)
45
1:33
1:37
1:42
1:20
1:52
2:24
2:10
2:38
3:11
8:29
8:43
9:00
1:36
1:41
1:46
1:50
2:22
2:54
2:37
3:08
3:41
8:42
8:59
9:19
19
19
19
20
20
20
18
18
18
18
18
18
22
22
22
23
22.25
22.25
21
21
20.75
21
21
21
Sub
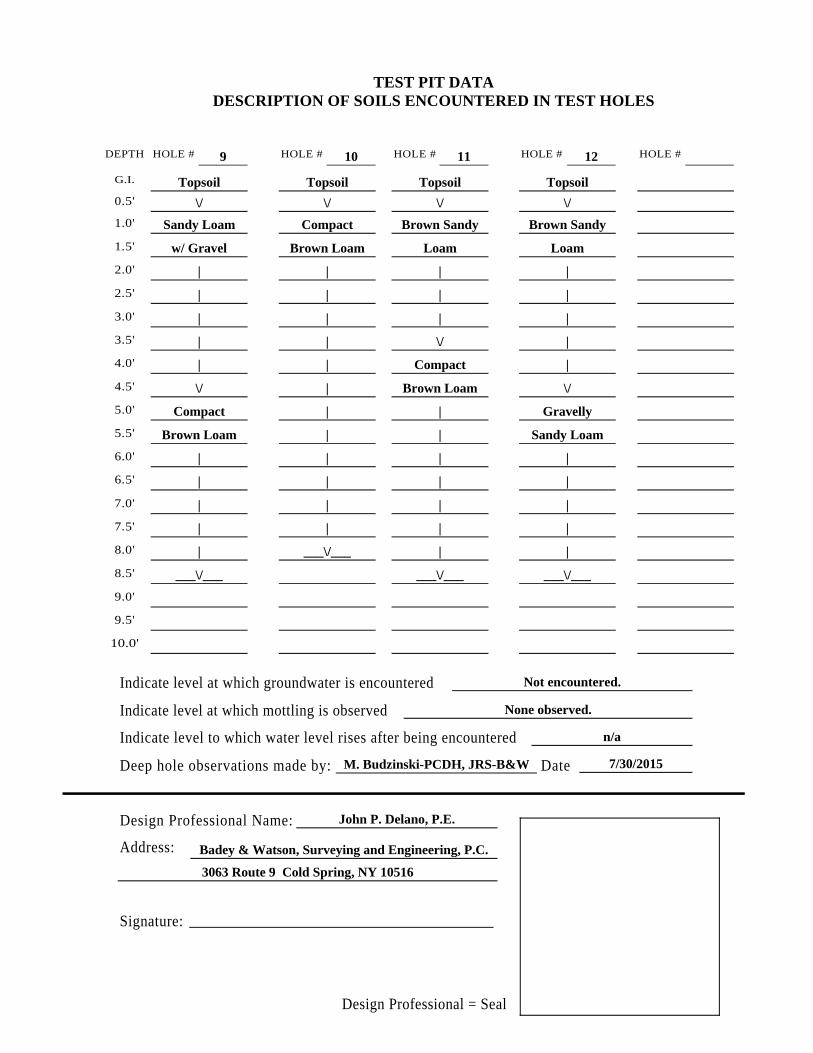
TEST PIT DATADESCRIPTION OF SOILS ENCOUNTERED IN TEST HOLES
9 10 11 12 HOLE # HOLE #DEPTH HOLE # HOLE # HOLE #
Topsoil Topsoil Topsoil Topsoil G.I.
\/ \/ \/ \/0.5'
Brown Sandy Sandy Loam Compact Brown Sandy 1.0'
Loam w/ Gravel Brown Loam Loam 1.5'
| | | |2.0'
| | | |2.5'
| | | |3.0'
| | \/ |3.5'
|| | Compact4.0'
| \/\/ Brown Loam 4.5'
Compact | | Gravelly 5.0'
Brown Loam | | Sandy Loam 5.5'
|| | |6.0'
| || |6.5'
| | | |7.0'
| | ||7.5'
___\/___ | ||8.0'
___\/___ ___\/___ ___\/___8.5'
9.0'
9.5'
10.0'
Not encountered. Indicate level at which groundwater is encountered
None observed. Indicate level at which mottling is observed
n/a Indicate level to which water level rises after being encountered
M. Budzinski-PCDH, JRS-B&W DateDeep hole observations made by:
John P. Delano, P.E. Design Professional Name:
Address:
Signature:
Design Professional = Seal
7/30/2015
Badey & Watson, Surveying and Engineering, P.C.
3063 Route 9 Cold Spring, NY 10516

PUTNAM COUNTY DEPARTMENT OF HEALTHDIVISION OF ENVIRONMENTAL HEALTH SERVICES
DESIGN DATA SHEET - SUBSURFACE SEWAGE TREATMENT SYSTEM
Horton Road, LLC 516 E 89th St, NYCOwner: Address:
Route 9 & Horton Road 176.21 17Located at (street): TM # Section: Block Lot
Town of Philipstown Hudson RiverMunicipality: Watershed:
SOIL PERCOLATION TEST DATA
Witnessed by:
Date of Pre-soaking: Date of Percolation Test:
Notes:1. Tests to be repeated at same depth until approximately equal percolation rates are
obtained at each percolation test hole. (i.e., < 1 min for 1-30 min/inch, < 2 min for 31-60 min/inch).All data to be submitted for review.
2. Depth measurements to be made from top of hole. Form DD-97, pg 1 of 2
Depth towater from
groundsurface(inches)
Start - Stop
TimeStart -Stop
Waterlevel dropin inches
PercolationRate
min/inch
ElapseTime(min.)
Run No.Hole No.
3 515113
3 7212(26")
3 8253(6/12/15)
45
3 825114
3 9282(26")
2.75 11303(6/12/15)
45
3 618115
3 6182(29")
3 6193(6/12/15)
45
3 310116
3 5162(24")
3 6193(6/12/15)
45
11:49
12:07
12:30
8:50
9:19
9:48
9:58
10:21
10:42
10:45
10:57
11:16
12:04
12:28
12:55
9:15
9:47
10:18
10:16
10:39
10:01
10:55
11:13
11:00
20
20
20
20
20
20
24
24
24
18
18
18
23
23
23
23
23
22.75
27
27
27
21
21
21
Sub

TEST PIT DATADESCRIPTION OF SOILS ENCOUNTERED IN TEST HOLES
13 14 15 16 HOLE # HOLE #DEPTH HOLE # HOLE # HOLE #
Topsoil Topsoil Topsoil Topsoil G.I.
\/ \/ \/ \/0.5'
Brown Sandy Brown Sandy Brown Sandy Brown Sandy 1.0'
Loam Loam Loam Loam 1.5'
| | | |2.0'
| | | |2.5'
| | | |3.0'
| | | \/3.5'
Brown Sandy | \/ |4.0'
Fine Sand Loam w/ Gravel \/ |4.5'
Brown Sandy | | |5.0'
Loam w/ Gravel | | |5.5'
|| | |6.0'
| || \/6.5'
| | Coarse Sand |7.0'
| & Gravel ||7.5'
___\/___ | ||8.0'
___\/___ ___\/___ ___\/___8.5'
9.0'
9.5'
10.0'
Not encountered. Indicate level at which groundwater is encountered
None observed. Indicate level at which mottling is observed
n/a Indicate level to which water level rises after being encountered
M. Budzinski-PCDH, JRS-B&W DateDeep hole observations made by:
John P. Delano, P.E. Design Professional Name:
Address:
Signature:
Design Professional = Seal
7/30/2015
Badey & Watson, Surveying and Engineering, P.C.
3063 Route 9 Cold Spring, NY 10516

PUTNAM COUNTY DEPARTMENT OF HEALTHDIVISION OF ENVIRONMENTAL HEALTH SERVICES
DESIGN DATA SHEET - SUBSURFACE SEWAGE TREATMENT SYSTEM
Horton Road, LLC 516 E 89th St, NYCOwner: Address:
Route 9 & Horton Road 176.21 17Located at (street): TM # Section: Block Lot
Town of Philipstown Hudson RiverMunicipality: Watershed:
SOIL PERCOLATION TEST DATA
Witnessed by:
Date of Pre-soaking: Date of Percolation Test:
Notes:1. Tests to be repeated at same depth until approximately equal percolation rates are
obtained at each percolation test hole. (i.e., < 1 min for 1-30 min/inch, < 2 min for 31-60 min/inch).All data to be submitted for review.
2. Depth measurements to be made from top of hole. Form DD-97, pg 1 of 2
Depth towater from
groundsurface(inches)
Start - Stop
TimeStart -Stop
Waterlevel dropin inches
PercolationRate
min/inch
ElapseTime(min.)
Run No.Hole No.
3 514117
3 5162(28")
3 6183(6/12/15)
45
n/a n/an/a118
2345
3 618119
3 8242(24")
3 9273(6/16/15)
45
3 411120
3 5162(27")
3 7203(6/16/15)
45
2:06
2:21
2:38
n/a
8:01
8:22
8:48
8:14
8:26
8:43
2:20
2:37
2:56
n/a
8:19
8:46
9:15
8:25
8:42
9:03
22
22
22
n/a
17
17
17
20
20
20
25
25
25
n/a
20
20
20
23
23
23
Sub

TEST PIT DATADESCRIPTION OF SOILS ENCOUNTERED IN TEST HOLES
17 18 19 20 HOLE # HOLE #DEPTH HOLE # HOLE # HOLE #
Topsoil Topsoil Topsoil Topsoil G.I.
\/ | \/ \/0.5'
Brown Sandy Brown Sandy \/ Brown Sandy 1.0'
Loam Loam Brown Loam Loam 1.5'
| w/ Course Sand | |2.0'
| | | |2.5'
| | \/ \/3.0'
| | Brown Sandy Coarse Sand3.5'
w/ Gravel | | Loam w/ Gravel 4.0'
| |\/ |4.5'
Brown Loam | | |5.0'
w/ Course Sand | | |5.5'
|| | |6.0'
| || |6.5'
| | | |7.0'
| | ||7.5'
___\/___ ___\/___ ___\/______\/___8.0'
8.5'
9.0'
9.5'
10.0'
Not encountered. Indicate level at which groundwater is encountered
None observed. Indicate level at which mottling is observed
n/a Indicate level to which water level rises after being encountered
M. Budzinski-PCDH, JRS-B&W DateDeep hole observations made by:
John P. Delano, P.E. Design Professional Name:
Address:
Signature:
Design Professional = Seal
7/30/2015
Badey & Watson, Surveying and Engineering, P.C.
3063 Route 9 Cold Spring, NY 10516

PUTNAM COUNTY DEPARTMENT OF HEALTHDIVISION OF ENVIRONMENTAL HEALTH SERVICES
DESIGN DATA SHEET - SUBSURFACE SEWAGE TREATMENT SYSTEM
Horton Road, LLC 516 E 89th St, NYCOwner: Address:
Route 9 & Horton Road 176.21 17Located at (street): TM # Section: Block Lot
Town of Philipstown Hudson RiverMunicipality: Watershed:
SOIL PERCOLATION TEST DATA
Witnessed by:
Date of Pre-soaking: Date of Percolation Test:
Notes:1. Tests to be repeated at same depth until approximately equal percolation rates are
obtained at each percolation test hole. (i.e., < 1 min for 1-30 min/inch, < 2 min for 31-60 min/inch).All data to be submitted for review.
2. Depth measurements to be made from top of hole. Form DD-97, pg 1 of 2
Depth towater from
groundsurface(inches)
Start - Stop
TimeStart -Stop
Waterlevel dropin inches
PercolationRate
min/inch
ElapseTime(min.)
Run No.Hole No.
3 .62121
3 132(24")
3 143(6/16/15)
45
3 516122
3 6182(25")
3 7213(6/16/15)
45
3 26123
3 3102(26")
3 4123(6/9/15)
45
3 617124
3 7222(26")
3 8253(6/9/15)
45
9:05
9:08
9:12
9:35
9:52
10:11
1:11
1:18
1:29
1:35
1:54
2:18
9:07
9:11
9:16
9:51
10:10
10:32
1:17
1:28
1:41
1:52
2:16
2:43
18
18
18
22
22
22
22
22
22
21
21
21
21
21
21
25
25
25
25
25
25
24
24
24
Sub

TEST PIT DATADESCRIPTION OF SOILS ENCOUNTERED IN TEST HOLES
21 22 23 24 HOLE # HOLE #DEPTH HOLE # HOLE # HOLE #
Topsoil Topsoil Topsoil G.I.
\/ \/ \/0.5'
Brown Sandy Brown Sandy Brown Sandy 1.0'
Loam Loam Loam 1.5'
| | \/2.0'
Did | \/ Brown Sandy 2.5'
not \/ Run-of-Bank Loam w/ Gravel 3.0'
log. Coarse Sand Gravel |3.5'
|w/ Gravel |4.0'
| ||4.5'
| | |5.0'
| | |5.5'
|| |6.0'
| ||6.5'
| | |7.0'
| | |7.5'
| | ___\/___8.0'
| ___\/___8.5'
___\/___9.0'
9.5'
10.0'
Not encountered. Indicate level at which groundwater is encountered
None observed. Indicate level at which mottling is observed
n/a Indicate level to which water level rises after being encountered
M. Budzinski-PCDH, JRS-B&W DateDeep hole observations made by:
John P. Delano, P.E. Design Professional Name:
Address:
Signature:
Design Professional = Seal
7/30/2015
Badey & Watson, Surveying and Engineering, P.C.
3063 Route 9 Cold Spring, NY 10516

PUTNAM COUNTY DEPARTMENT OF HEALTHDIVISION OF ENVIRONMENTAL HEALTH SERVICES
DESIGN DATA SHEET - SUBSURFACE SEWAGE TREATMENT SYSTEM
Horton Road, LLC 516 E 89th St, NYCOwner: Address:
Route 9 & Horton Road 176.21 17Located at (street): TM # Section: Block Lot
Town of Philipstown Hudson RiverMunicipality: Watershed:
SOIL PERCOLATION TEST DATA
Witnessed by:
Date of Pre-soaking: Date of Percolation Test:
Notes:1. Tests to be repeated at same depth until approximately equal percolation rates are
obtained at each percolation test hole. (i.e., < 1 min for 1-30 min/inch, < 2 min for 31-60 min/inch).All data to be submitted for review.
2. Depth measurements to be made from top of hole. Form DD-97, pg 1 of 2
Depth towater from
groundsurface(inches)
Start - Stop
TimeStart -Stop
Waterlevel dropin inches
PercolationRate
min/inch
ElapseTime(min.)
Run No.Hole No.
3 12125
3 252(24")
3 273(6/9/15)
45
3 618126
3 7202(24")
3 7203(6/9/15)
45
3 13127
3 272(25")
3 383(6/9/15)
45
3 .62128
3 132(24")
3 143(6/9/15)
45
1:02
1:05
1:11
8:04
8:24
8:45
12:29
12:43
12:51
11:53
11:56
12:00
1:04
1:10
1:18
8:22
8:44
9:05
12:03
12:50
12:59
11:55
11:59
12:04
18
18
18
19
19
19
19
19
19
19
19
19
21
21
21
22
22
22
22
22
22
22
22
22
Sub

TEST PIT DATADESCRIPTION OF SOILS ENCOUNTERED IN TEST HOLES
25 26 27 28 HOLE # HOLE #DEPTH HOLE # HOLE # HOLE #
Topsoil Topsoil Topsoil Topsoil G.I.
\/ | \/ \/0.5'
CompactRed-brown \/ Brown Sandy 1.0'
Brown Loam Sandy Loam Red-brown Loam 1.5'
| Sandy Loam \/ |2.0'
\/ | Brown Sandy |2.5'
Medium Sand | Loam w/ Gravel |3.0'
w/ Gravel \/ | \/3.5'
Brown Sandy | Medium Sand |4.0'
w/ Gravel Loam w/ Gravel | |4.5'
| | | |5.0'
| | | |5.5'
|| | |6.0'
| || |6.5'
| | | |7.0'
| ___\/___ ||7.5'
___\/___ ___\/______\/___8.0'
8.5'
9.0'
9.5'
10.0'
Not encountered. Indicate level at which groundwater is encountered
None observed. Indicate level at which mottling is observed
n/a Indicate level to which water level rises after being encountered
M. Budzinski-PCDH, JRS-B&W DateDeep hole observations made by:
John P. Delano, P.E. Design Professional Name:
Address:
Signature:
Design Professional = Seal
7/30/2015
Badey & Watson, Surveying and Engineering, P.C.
3063 Route 9 Cold Spring, NY 10516
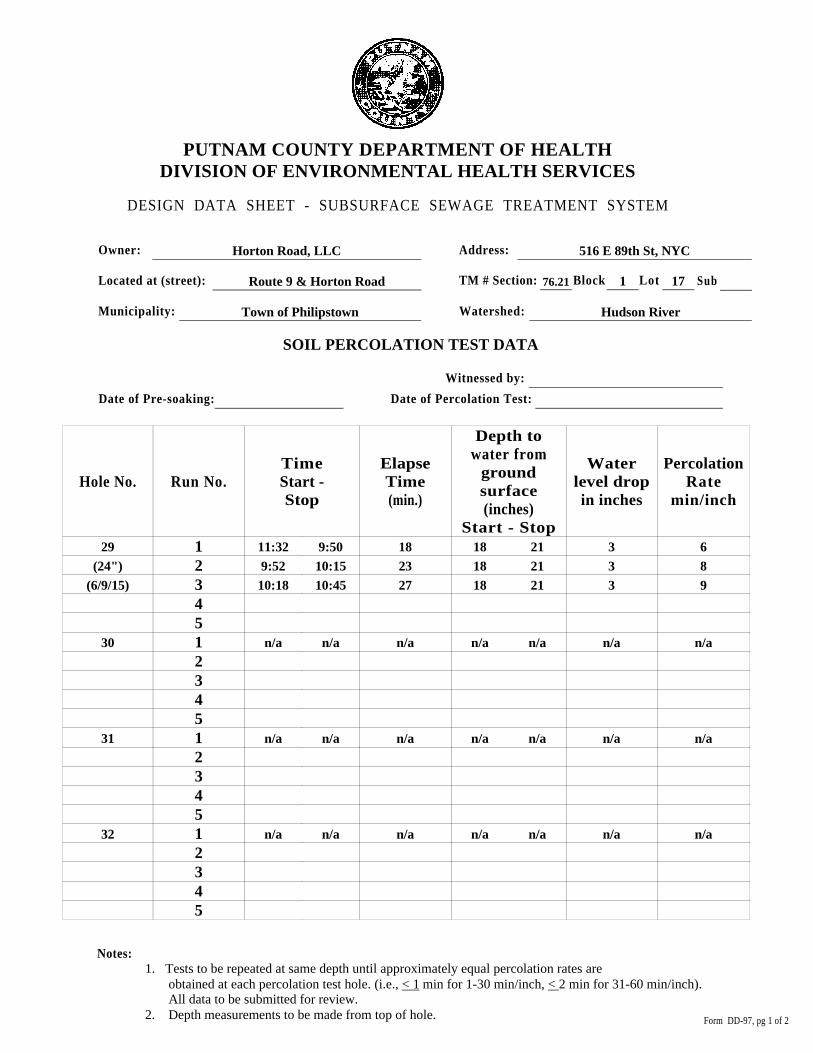
PUTNAM COUNTY DEPARTMENT OF HEALTHDIVISION OF ENVIRONMENTAL HEALTH SERVICES
DESIGN DATA SHEET - SUBSURFACE SEWAGE TREATMENT SYSTEM
Horton Road, LLC 516 E 89th St, NYCOwner: Address:
Route 9 & Horton Road 176.21 17Located at (street): TM # Section: Block Lot
Town of Philipstown Hudson RiverMunicipality: Watershed:
SOIL PERCOLATION TEST DATA
Witnessed by:
Date of Pre-soaking: Date of Percolation Test:
Notes:1. Tests to be repeated at same depth until approximately equal percolation rates are
obtained at each percolation test hole. (i.e., < 1 min for 1-30 min/inch, < 2 min for 31-60 min/inch).All data to be submitted for review.
2. Depth measurements to be made from top of hole. Form DD-97, pg 1 of 2
Depth towater from
groundsurface(inches)
Start - Stop
TimeStart -Stop
Waterlevel dropin inches
PercolationRate
min/inch
ElapseTime(min.)
Run No.Hole No.
3 618129
3 8232(24")
3 9273(6/9/15)
45
n/a n/an/a130
2345
n/a n/an/a131
2345
n/a n/an/a132
2345
11:32
9:52
10:18
n/a
n/a
n/a
9:50
10:15
10:45
n/a
n/a
n/a
18
18
18
n/a
n/a
n/a
21
21
21
n/a
n/a
n/a
Sub

TEST PIT DATADESCRIPTION OF SOILS ENCOUNTERED IN TEST HOLES
29 30 31 32 HOLE # HOLE #DEPTH HOLE # HOLE # HOLE #
Topsoil Topsoil Topsoil Topsoil G.I.
| | | |0.5'
\/\/ \/ \/1.0'
Light Brown Dark Brown Light Brown Light Brown 1.5'
Loam Loam Loam Loam 2.0'
| | w/ Cobble w/ Cobble 2.5'
| | | |3.0'
| \/ | \/3.5'
Run-of-Bank\/ Medium Sand \/4.0'
| Gravel Brown Sandy Medium Sand4.5'
Loam w/ Gravel | | \/5.0'
| | | Medium Sand5.5'
|| | |6.0'
| || |6.5'
| | | |7.0'
___\/___ | ___\/___7.5'
___\/______\/___8.0'
8.5'
9.0'
9.5'
10.0'
Not encountered. Indicate level at which groundwater is encountered
None observed. Indicate level at which mottling is observed
n/a Indicate level to which water level rises after being encountered
M. Budzinski-PCDH, JRS-B&W DateDeep hole observations made by:
John P. Delano, P.E. Design Professional Name:
Address:
Signature:
Design Professional = Seal
7/30/2015
Badey & Watson, Surveying and Engineering, P.C.
3063 Route 9 Cold Spring, NY 10516

PUTNAM COUNTY DEPARTMENT OF HEALTHDIVISION OF ENVIRONMENTAL HEALTH SERVICES
DESIGN DATA SHEET - SUBSURFACE SEWAGE TREATMENT SYSTEM
Horton Road, LLC 516 E 89th St, NYCOwner: Address:
Route 9 & Horton Road 176.21 17Located at (street): TM # Section: Block Lot
Town of Philipstown Hudson RiverMunicipality: Watershed:
SOIL PERCOLATION TEST DATA
Witnessed by:
Date of Pre-soaking: Date of Percolation Test:
Notes:1. Tests to be repeated at same depth until approximately equal percolation rates are
obtained at each percolation test hole. (i.e., < 1 min for 1-30 min/inch, < 2 min for 31-60 min/inch).All data to be submitted for review.
2. Depth measurements to be made from top of hole. Form DD-97, pg 1 of 2
Depth towater from
groundsurface(inches)
Start - Stop
TimeStart -Stop
Waterlevel dropin inches
PercolationRate
min/inch
ElapseTime(min.)
Run No.Hole No.
n/a n/an/a133
2345
n/a n/an/a134
2345
n/a n/an/a135
2345
3 25136
3 272(25")
3 4 123(6/1/15)
3 61743 7205
n/a
n/a
n/a
10:33
10:40
10:49
11:03
11:22
n/a
n/a
n/a
10:38
10:47
11:01
11:20
11:44
n/a
n/a
n/a
19
19
19
19
19
n/a
n/a
n/a
22
22
22
22
22
Sub

TEST PIT DATADESCRIPTION OF SOILS ENCOUNTERED IN TEST HOLES
33 34 35 36 HOLE # HOLE #DEPTH HOLE # HOLE # HOLE #
Topsoil Topsoil Topsoil Topsoil G.I.
| | | |0.5'
\/ (10")\/ \/ \/1.0'
Light Brown Light Brown Light Brown Light Brown 1.5'
Loam Loam Loam Loam 2.0'
w/ Cobble w/ Cobble | \/2.5'
| | | Run-of-Bank3.0'
\/ | | Gravel 3.5'
|Medium Sand \/ |4.0'
Medium Sand || |4.5'
| | \/ |5.0'
| | Fine Sand |5.5'
|| | |6.0'
| || |6.5'
| | | |7.0'
___\/___ | |___\/___7.5'
| |8.0'
___\/___ ___\/___8.5'
9.0'
9.5'
10.0'
Not encountered. Indicate level at which groundwater is encountered
None observed. Indicate level at which mottling is observed
n/a Indicate level to which water level rises after being encountered
M. Budzinski-PCDH, JRS-B&W DateDeep hole observations made by:
John P. Delano, P.E. Design Professional Name:
Address:
Signature:
Design Professional = Seal
7/30/2015
Badey & Watson, Surveying and Engineering, P.C.
3063 Route 9 Cold Spring, NY 10516
PUTNAM COUNTY DEPARTMENT OF HEALTHDIVISION OF ENVIRONMENTAL HEALTH SERVICES
DESIGN DATA SHEET - SUBSURFACE SEWAGE TREATMENT SYSTEM
Horton Road, LLC 516 E 89th St, NYCOwner: Address:
Route 9 & Horton Road 176.21 17Located at (street): TM # Section: Block Lot
Town of Philipstown Hudson RiverMunicipality: Watershed:
SOIL PERCOLATION TEST DATA
Witnessed by:
Date of Pre-soaking: Date of Percolation Test:
Notes:1. Tests to be repeated at same depth until approximately equal percolation rates are
obtained at each percolation test hole. (i.e., < 1 min for 1-30 min/inch, < 2 min for 31-60 min/inch).All data to be submitted for review.
2. Depth measurements to be made from top of hole. Form DD-97, pg 1 of 2
Depth towater from
groundsurface(inches)
Start - Stop
TimeStart -Stop
Waterlevel dropin inches
PercolationRate
min/inch
ElapseTime(min.)
Run No.Hole No.
3 25137
3 272(26")
3 383(6/1/15)
3 3843 3953 515138
3 6172(29")
3 6193(6/2/15)
45
3 39139
3 5152(25")
3 5163(6/2/15)
3 61945
3 25140
3 252(27")
3 273(6/1/15)
3 2543 385
10:47
10:55
11:06
11:16
11:25
2:07
2:23
2:42
2:18
2:29
2:45
3:01
12:32
12:39
12:49
12:57
1:04
10:52
10:02
11:14
11:24
11:34
2:22
2:40
3:03
2:27
2:44
3:01
3:20
12:37
12:44
12:56
1:02
1:12
20
20
20
20
20
21
21
21
19
19
19
19
20
20
20
20
20
23
23
23
23
23
24
24
24
22
22
22
22
23
23
23
23
23
Sub

TEST PIT DATADESCRIPTION OF SOILS ENCOUNTERED IN TEST HOLES
37 38 39 40 HOLE # HOLE #DEPTH HOLE # HOLE # HOLE #
Topsoil Topsoil Topsoil Topsoil G.I.
\/ (9") | | \/ (8")0.5'
Light Brown Light Brown \/ \/ (10")1.0'
Loam Loam Compact Light Brown 1.5'
\/ (20") Brown Loam Loam |2.0'
Run-of-Bank w/ Cobble | \/2.5'
Gravel | \/ Run-of-Bank3.0'
| | Run-of-Bank Gravel 3.5'
|| | Gravel 4.0'
| || |4.5'
| | | |5.0'
| | | |5.5'
|| | |6.0'
| || |6.5'
| | | |7.0'
| ___\/___ ___\/___|7.5'
||8.0'
___\/___ ___\/___8.5'
9.0'
9.5'
10.0'
Not encountered. Indicate level at which groundwater is encountered
None observed. Indicate level at which mottling is observed
n/a Indicate level to which water level rises after being encountered
M. Budzinski-PCDH, JRS-B&W DateDeep hole observations made by:
John P. Delano, P.E. Design Professional Name:
Address:
Signature:
Design Professional = Seal
7/30/2015
Badey & Watson, Surveying and Engineering, P.C.
3063 Route 9 Cold Spring, NY 10516

PUTNAM COUNTY DEPARTMENT OF HEALTHDIVISION OF ENVIRONMENTAL HEALTH SERVICES
DESIGN DATA SHEET - SUBSURFACE SEWAGE TREATMENT SYSTEM
Horton Road, LLC 516 E 89th St, NYCOwner: Address:
Route 9 & Horton Road 176.21 17Located at (street): TM # Section: Block Lot
Town of Philipstown Hudson RiverMunicipality: Watershed:
SOIL PERCOLATION TEST DATA
Witnessed by:
Date of Pre-soaking: Date of Percolation Test:
Notes:1. Tests to be repeated at same depth until approximately equal percolation rates are
obtained at each percolation test hole. (i.e., < 1 min for 1-30 min/inch, < 2 min for 31-60 min/inch).All data to be submitted for review.
2. Depth measurements to be made from top of hole. Form DD-97, pg 1 of 2
Depth towater from
groundsurface(inches)
Start - Stop
TimeStart -Stop
Waterlevel dropin inches
PercolationRate
min/inch
ElapseTime(min.)
Run No.Hole No.
3 27141
3 4122(25")
3 5153(6/1/15)
3 51643 61753 618142
3 7202(28")
3 8233(6/2/15)
45
3 617143
3 7202(28")
3 7223(6/2/15)
45
3 26144
3 272(26")
3 393(6/1/15)
3 41143 395
12:47
1:00
1:14
1:30
1:49
3:31
3:51
4:12
3:17
3:35
4:00
2:49
2:58
3:05
3:17
3:29
12:54
1:12
1:29
1:46
2:04
3:49
4:11
4:35
3:34
3:55
4:22
2:55
3:04
3:14
3:28
3:38
21
21
21
21
21
20
20
20
22
22
22
18
18
18
18
18
24
24
24
24
24
23
23
23
25
25
25
21
21
21
21
21
Sub

TEST PIT DATADESCRIPTION OF SOILS ENCOUNTERED IN TEST HOLES
41 42 43 44 HOLE # HOLE #DEPTH HOLE # HOLE # HOLE #
Topsoil Topsoil Topsoil Topsoil G.I.
\/ (8") \/ \/ (10") \/0.5'
Lt Brown Loam Light Brown Light Brown Light Brown 1.0'
w/ Cobble Loam Loam Loam 1.5'
| | w/ Cobble \/2.0'
| \/ | Run-of-Bank2.5'
| Run-of-Bank | Gravel 3.0'
| Gravel | |3.5'
|| | |4.0'
| || |4.5'
\/ | | |5.0'
Run-of-Bank | | |5.5'
|Gravel | |6.0'
| || \/6.5'
| | R.O.B. Gravel |7.0'
| ___\/___ ||7.5'
| ___\/______\/___8.0'
___\/___8.5'
9.0'
9.5'
10.0'
Not encountered. Indicate level at which groundwater is encountered
None observed. Indicate level at which mottling is observed
n/a Indicate level to which water level rises after being encountered
M. Budzinski-PCDH, JRS-B&W DateDeep hole observations made by:
John P. Delano, P.E. Design Professional Name:
Address:
Signature:
Design Professional = Seal
7/30/2015
Badey & Watson, Surveying and Engineering, P.C.
3063 Route 9 Cold Spring, NY 10516

PUTNAM COUNTY DEPARTMENT OF HEALTHDIVISION OF ENVIRONMENTAL HEALTH SERVICES
DESIGN DATA SHEET - SUBSURFACE SEWAGE TREATMENT SYSTEM
Horton Road, LLC 516 E 89th St, NYCOwner: Address:
Route 9 & Horton Road 176.21 17Located at (street): TM # Section: Block Lot
Town of Philipstown Hudson RiverMunicipality: Watershed:
SOIL PERCOLATION TEST DATA
Witnessed by:
Date of Pre-soaking: Date of Percolation Test:
Notes:1. Tests to be repeated at same depth until approximately equal percolation rates are
obtained at each percolation test hole. (i.e., < 1 min for 1-30 min/inch, < 2 min for 31-60 min/inch).All data to be submitted for review.
2. Depth measurements to be made from top of hole. Form DD-97, pg 1 of 2
Depth towater from
groundsurface(inches)
Start - Stop
TimeStart -Stop
Waterlevel dropin inches
PercolationRate
min/inch
ElapseTime(min.)
Run No.Hole No.
3 39145
3 4122(30")
3 4133(6/2/15)
3 41345
3 .31146
3 .622(24")
3 133(6/2/15)
45
n/a n/an/a147
2345
n/a n/an/a148
2345
8:40
8:52
9:06
9:22
9:02
9:05
9:11
n/a
n/a
8:49
9:04
9:19
9:35
9:03
9:07
9:14
n/a
n/a
23
23
23
23
18
18
18
n/a
n/a
26
26
26
26
21
21
21
n/a
n/a
Sub

TEST PIT DATADESCRIPTION OF SOILS ENCOUNTERED IN TEST HOLES
45 46 47 48 HOLE # HOLE #DEPTH HOLE # HOLE # HOLE #
Topsoil Topsoil Topsoil Topsoil G.I.
\/ | \/ \/0.5'
Light Brown Lt Brown Loam \/ (10") Lt Brown Loam 1.0'
Loam w/ Cobble Light Brown \/1.5'
\/ Loam Run-of-Bank |2.0'
Run-of-Bank | | |2.5'
Gravel | | |3.0'
| | | \/3.5'
Medium Sand| \/ |4.0'
Run-of-Bank || |4.5'
| Gravel | |5.0'
| | | |5.5'
|| | |6.0'
| || |6.5'
| | | |7.0'
| | ||7.5'
| ___\/___ |___\/___8.0'
___\/___ ___\/___8.5'
9.0'
9.5'
10.0'
Not encountered. Indicate level at which groundwater is encountered
None observed. Indicate level at which mottling is observed
n/a Indicate level to which water level rises after being encountered
M. Budzinski-PCDH, JRS-B&W DateDeep hole observations made by:
John P. Delano, P.E. Design Professional Name:
Address:
Signature:
Design Professional = Seal
7/30/2015
Badey & Watson, Surveying and Engineering, P.C.
3063 Route 9 Cold Spring, NY 10516

PUTNAM COUNTY DEPARTMENT OF HEALTHDIVISION OF ENVIRONMENTAL HEALTH SERVICES
DESIGN DATA SHEET - SUBSURFACE SEWAGE TREATMENT SYSTEM
Horton Road, LLC 516 E 89th St, NYCOwner: Address:
Route 9 & Horton Road 176.21 17Located at (street): TM # Section: Block Lot
Town of Philipstown Hudson RiverMunicipality: Watershed:
SOIL PERCOLATION TEST DATA
Witnessed by:
Date of Pre-soaking: Date of Percolation Test:
Notes:1. Tests to be repeated at same depth until approximately equal percolation rates are
obtained at each percolation test hole. (i.e., < 1 min for 1-30 min/inch, < 2 min for 31-60 min/inch).All data to be submitted for review.
2. Depth measurements to be made from top of hole. Form DD-97, pg 1 of 2
Depth towater from
groundsurface(inches)
Start - Stop
TimeStart -Stop
Waterlevel dropin inches
PercolationRate
min/inch
ElapseTime(min.)
Run No.Hole No.
n/a n/a n/a149
2(25")
3(6/2/15)
45
n/a n/an/a150
2345
n/a n/an/a151
2345
3 .62152
3 132(28")
3 133(6/2/15)
45
n/a
n/a
n/a
10:21
10:25
10:33
n/a
n/a
n/a
10:23
10:28
10:36
17
n/a
n/a
21
21
21
n/a
n/a
n/a
24
24
24
Sub

TEST PIT DATADESCRIPTION OF SOILS ENCOUNTERED IN TEST HOLES
49 50 51 52 HOLE # HOLE #DEPTH HOLE # HOLE # HOLE #
Topsoil Topsoil Topsoil Topsoil G.I.
| \/ (4") | |0.5'
\/\/ Lt Brown Loam \/1.0'
Light Brown Light Brown \/ Light Brown 1.5'
Loam Run-of-Bank Loam Loam 2.0'
| Gravel | w/ Cobble 2.5'
| | | |3.0'
| | | \/3.5'
Medium Sand\/ | |4.0'
| w/ Cobble Medium Sand \/4.5'
w/ Cobble | Medium Sand |5.0'
| | w/ Cobble |5.5'
|| | |6.0'
| || |6.5'
| | | |7.0'
| | ||7.5'
___\/___ | ||8.0'
| ___\/___ |8.5'
___\/___ ___\/___9.0'
9.5'
10.0'
Not encountered. Indicate level at which groundwater is encountered
None observed. Indicate level at which mottling is observed
n/a Indicate level to which water level rises after being encountered
M. Budzinski-PCDH, JRS-B&W DateDeep hole observations made by:
John P. Delano, P.E. Design Professional Name:
Address:
Signature:
Design Professional = Seal
7/30/2015
Badey & Watson, Surveying and Engineering, P.C.
3063 Route 9 Cold Spring, NY 10516
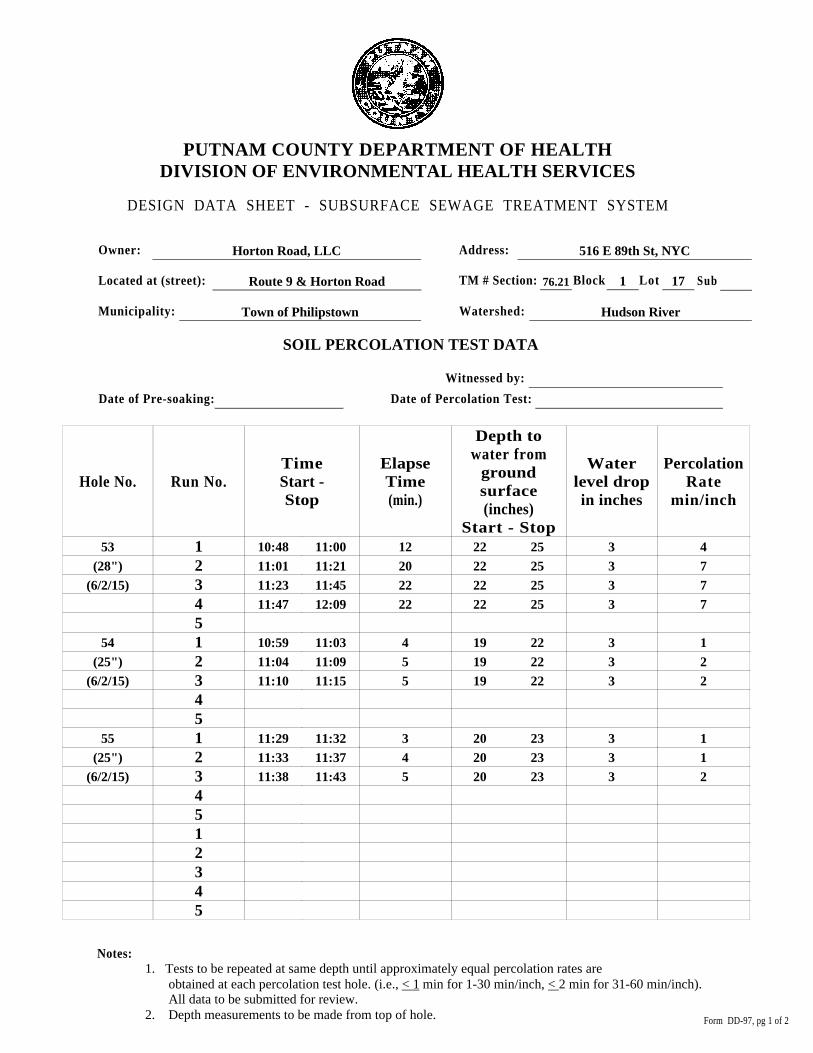
PUTNAM COUNTY DEPARTMENT OF HEALTHDIVISION OF ENVIRONMENTAL HEALTH SERVICES
DESIGN DATA SHEET - SUBSURFACE SEWAGE TREATMENT SYSTEM
Horton Road, LLC 516 E 89th St, NYCOwner: Address:
Route 9 & Horton Road 176.21 17Located at (street): TM # Section: Block Lot
Town of Philipstown Hudson RiverMunicipality: Watershed:
SOIL PERCOLATION TEST DATA
Witnessed by:
Date of Pre-soaking: Date of Percolation Test:
Notes:1. Tests to be repeated at same depth until approximately equal percolation rates are
obtained at each percolation test hole. (i.e., < 1 min for 1-30 min/inch, < 2 min for 31-60 min/inch).All data to be submitted for review.
2. Depth measurements to be made from top of hole. Form DD-97, pg 1 of 2
Depth towater from
groundsurface(inches)
Start - Stop
TimeStart -Stop
Waterlevel dropin inches
PercolationRate
min/inch
ElapseTime(min.)
Run No.Hole No.
3 412153
3 7202(28")
3 7223(6/2/15)
3 72245
3 14154
3 252(25")
3 253(6/2/15)
45
3 13155
3 142(25")
3 253(6/2/15)
4512345
10:48
11:01
11:23
11:47
10:59
11:04
11:10
11:29
11:33
11:38
11:00
11:21
11:45
12:09
11:03
11:09
11:15
11:32
11:37
11:43
22
22
22
22
19
19
19
20
20
20
25
25
25
25
22
22
22
23
23
23
Sub

TEST PIT DATADESCRIPTION OF SOILS ENCOUNTERED IN TEST HOLES
53 54 55 HOLE # HOLE #DEPTH HOLE # HOLE # HOLE #
Topsoil Topsoil Topsoil G.I.
| | |0.5'
\/ \/ \/1.0'
Light Brown Light Brown Light Brown 1.5'
Loam Loam Loam 2.0'
w/ Cobble w/ Cobble w/ Cobble 2.5'
| | |3.0'
| | \/3.5'
\/ | Run-of-Bank4.0'
\/Run-of-Bank Gravel 4.5'
Gravel Run-of-Bank |5.0'
| Gravel |5.5'
| | |6.0'
|| |6.5'
| | |7.0'
| ||7.5'
| |___\/___8.0'
| ___\/___8.5'
___\/___9.0'
9.5'
10.0'
Not encountered. Indicate level at which groundwater is encountered
None observed. Indicate level at which mottling is observed
n/a Indicate level to which water level rises after being encountered
M. Budzinski-PCDH, JRS-B&W DateDeep hole observations made by:
John P. Delano, P.E. Design Professional Name:
Address:
Signature:
Design Professional = Seal
7/30/2015
Badey & Watson, Surveying and Engineering, P.C.
3063 Route 9 Cold Spring, NY 10516